CA2 neuronal activity controls hippocampal low gamma and ripple oscillations
- National Institutes of Health, United States
Figures
Figure 1 with 2 supplements
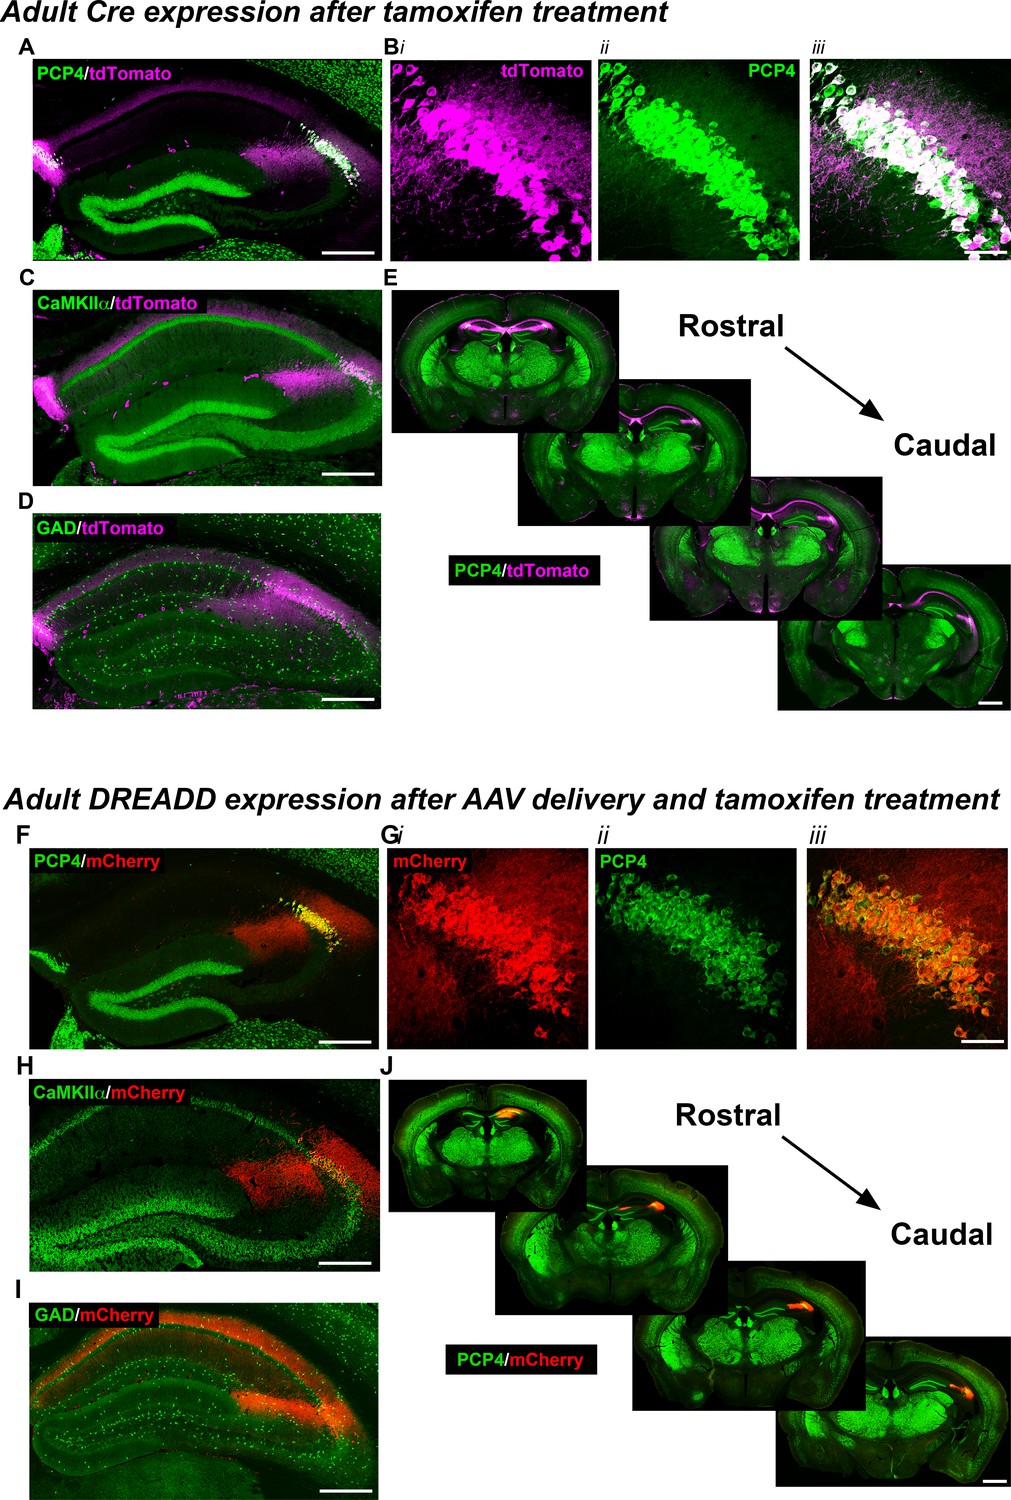
Expression of the Cre indicator, tdTomato, in Amigo2-icreERT2+; ROSA-tdTomato± mice (A–E) or mCherry-tagged DREADD receptors (F–J) in Amigo2-icreERT2 mice.
(A–B) Co-expression of tdTomato and PCP4, a marker for CA2 neurons, in the coronal hippocampal section (A) or CA2 only (B). In B, i shows tdTomato expression, ii shows PCP4 expression and iii shows the merged image. (C) Co-expression of tdTomato and CaMKIIα, a marker for principal neurons in hippocampus (see also Figure 1—figure supplement 1A). (D) Expression of tdTomato and GAD, a marker for inhibitory neurons. Cre-dependent tdTomato expression did not colocalize with GAD (see also Figure 1—figure supplement 1B). (E) Expression of tdTomato colocalizes with expression of PCP4 across the rostral to caudal extent of CA2. (F–J) Coronal sections from Amigo2-icreERT2+ mice infused unilaterally with AAV-hSyn-DIO-hM3D(Gq)-mCherry (hM3Dq AAV; F–H,J) or bilaterally with AAV-hSyn-DIO-hM4D(Gi)-mCherry (hM4Di AAV; I) and treated with tamoxifen. (F–G) Expression of hM3Dq-mCherry and the CA2-specific marker PCP4, in the hippocampus (F) and CA2 (G). In (G), i shows DREADD-mCherry expression, ii shows PCP4 expression and iii shows the merged image. Expression of DREADD-mCherry colocalizes with CaMKIIα (H) but does not colocalize with GAD (I; see also Figure 1—figure supplement 1C–D). Note that hM4Di-mCherry (shown in I) fills axons projecting to CA1. (J) Expression of hM3Dq-mCherry colocalizes with expression of PCP4 across the rostral to caudal extent of CA2. Scale bars = 200 μm (A, C, D, F, H, I), 50 μm (B, G) and 1 mm (E, J). See also Figure 1—figure supplement 1 and Figure 1—figure supplement 2.
Figure 1—figure supplement 1
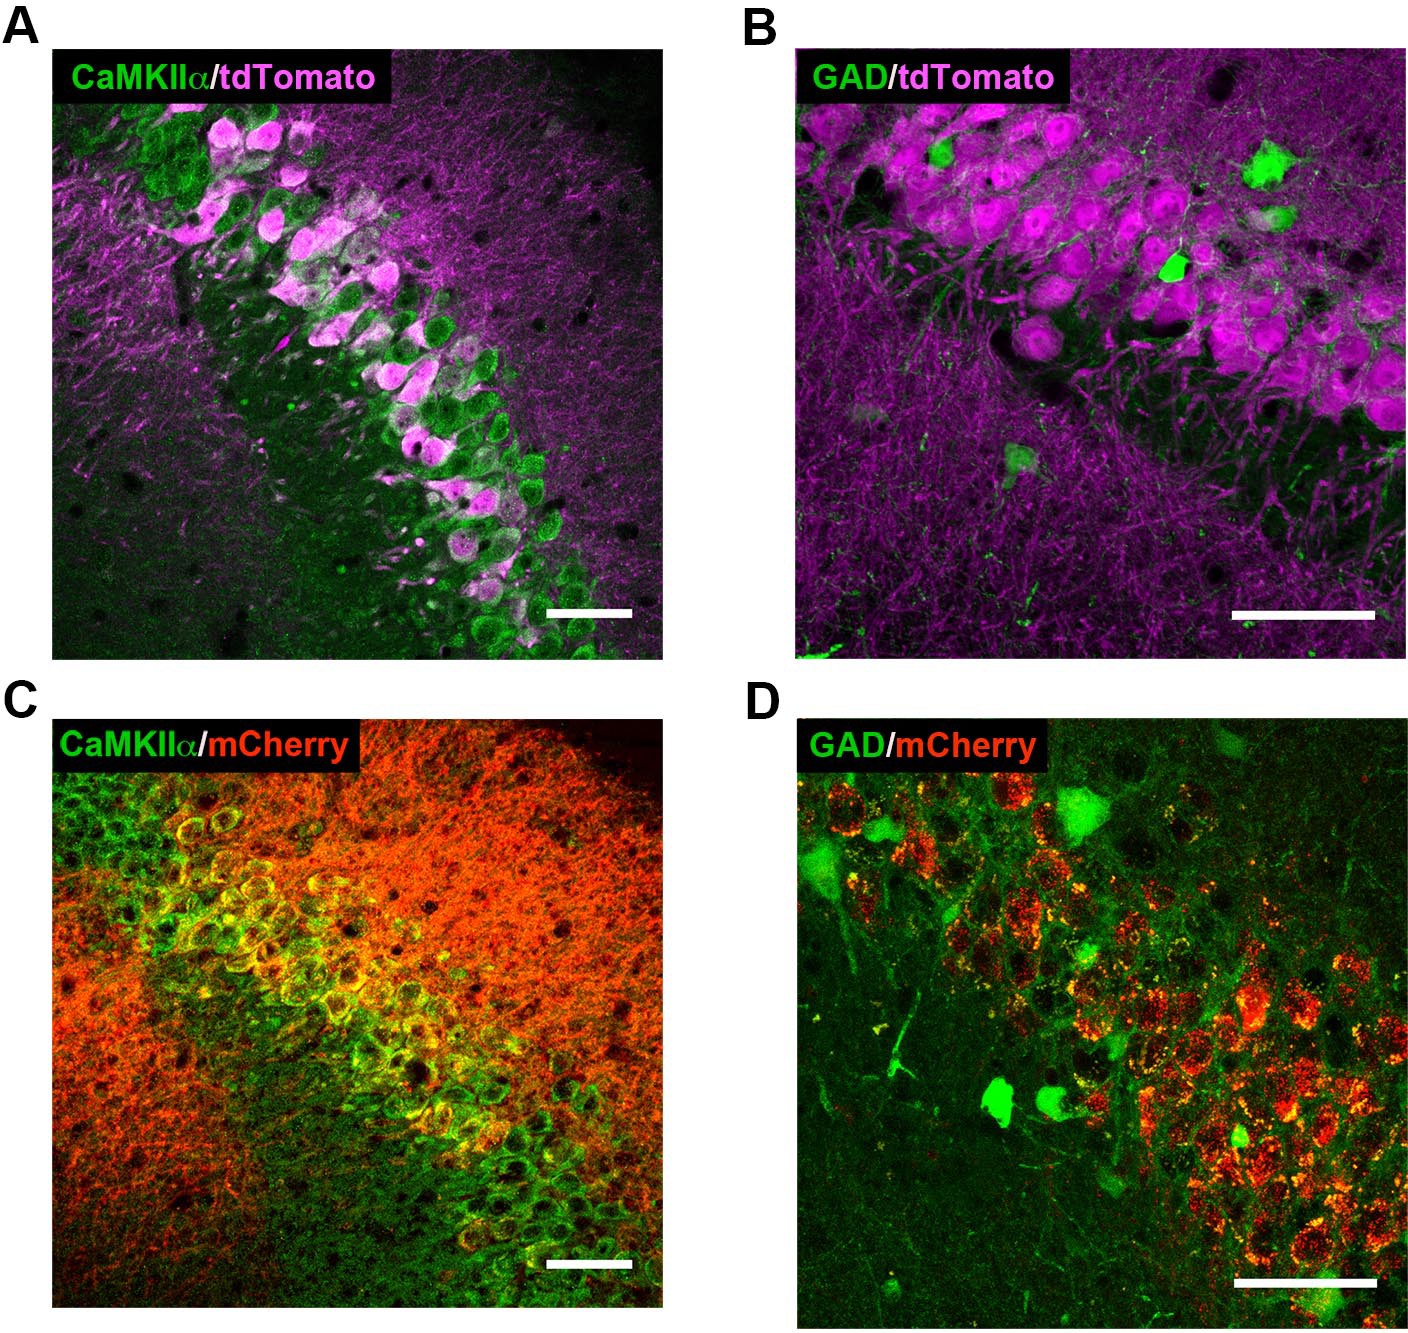
High-magnification co-expression images of tdTomato (A–B) or mCherry (C–D) with markers of excitatory and inhibitory neurons.
(A) tdTomato (magenta) expression in Cre+Amigo2-icreERT2; ROSA-tdTomato± mice colocalizes with CaMKIIα (green, single z-plane shown), a marker for principal neurons in hippocampus. Similar Cre-dependent tdTomato co-expression with CaMKIIα was found in 6 Amigo2-icreERT2+; ROSA-tdTomato± mice treated with tamoxifen. (B) tdTomato expression in Amigo2-icreERT2+; GAD-eGFP+/-±; ROSA-tdTomato± mice does not colocalize with GAD (green), a marker for inhibitory neurons. Similar lack of co-expression of Cre-dependent tdTomato with GAD was found in 3 Amigo2-icreERT2+; GAD-eGFP+/-±; ROSA-tdTomato± mice treated with tamoxifen. (C) In Amigo2-icreERT2+ mice infused with hM3Dq AAV, mCherry (red) colocalizes with CaMKIIα. Similar co-expression of mCherry with CaMKIIα was found in 4 Amigo2-icreERT2+ mice infused with hM3Dq AAV and treated with tamoxifen. (D) In Amigo2-icreERT2+; GAD-eGFP± infused with hM3Dq AAV, mCherry does not colocalize with GAD (green). Similar lack of co-expression of mCherry with GAD was found in 4 Amigo2-icreERT2+; GAD-eGFP± infused with DREADD AAV and treated with tamoxifen. Scale bars = 100 μm.
Figure 1—figure supplement 2
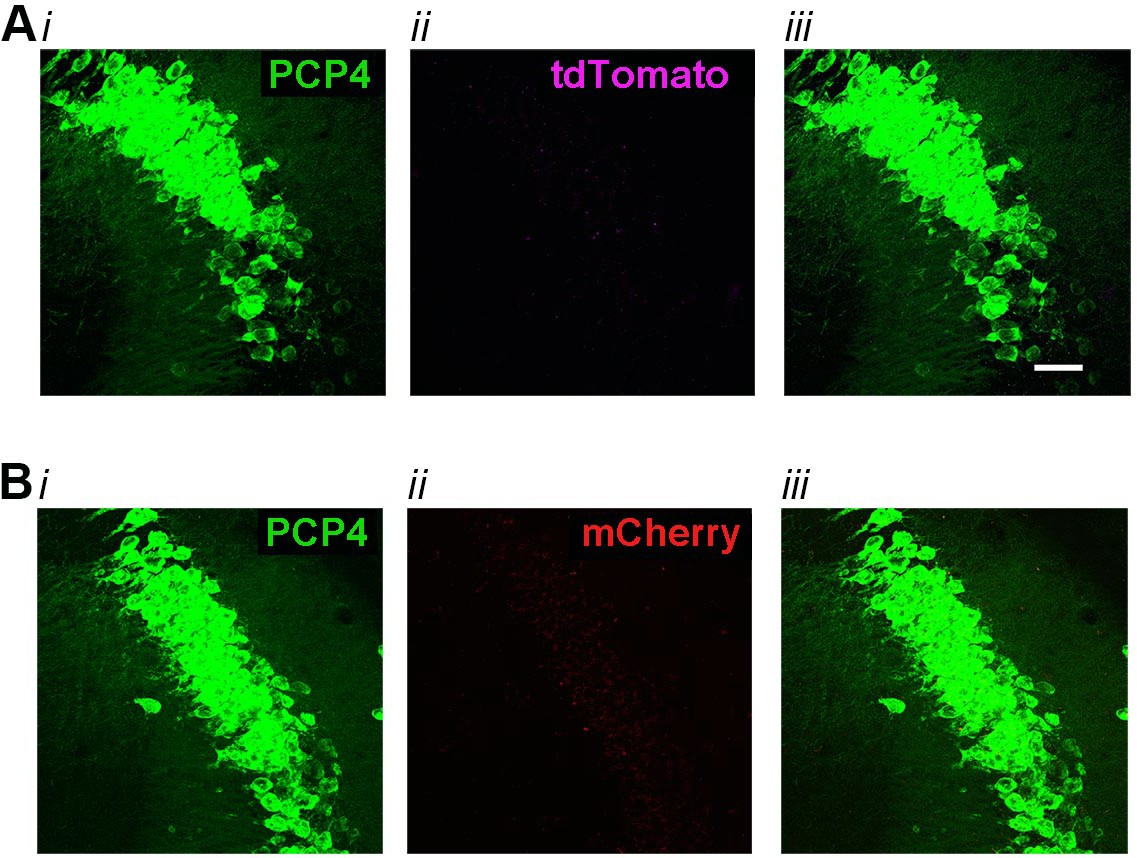
High-magnification co-expression images of tdTomato (A) or mCherry (B) with PCP4, a marker for CA2 neurons in negative control animals.
(A) In Amigo2-icreERT2+; ROSA-tdTomato± mice treated with corn oil (vehicle used for tamoxifen), tdTomato expression was absent from neurons expressing PCP4 (N = 3 Amigo2-icreERT2+; ROSA-tdTomato± mice treated with corn oil). (B) In Amigo2-icreERT2- mice infused with hM3Dq AAV and treated with tamoxifen, mCherry expression was absent from neurons expressing PCP4 (N = 4 Amigo2-icreERT2- mice infused with hM3Dq AAV and treated with tamoxifen). In both A and B, i shows PCP4 expression, ii shows either tdTomato or mCherry expression and iii shows the merged image. Scale bars = 100 μm.
Figure 2 with 8 supplements
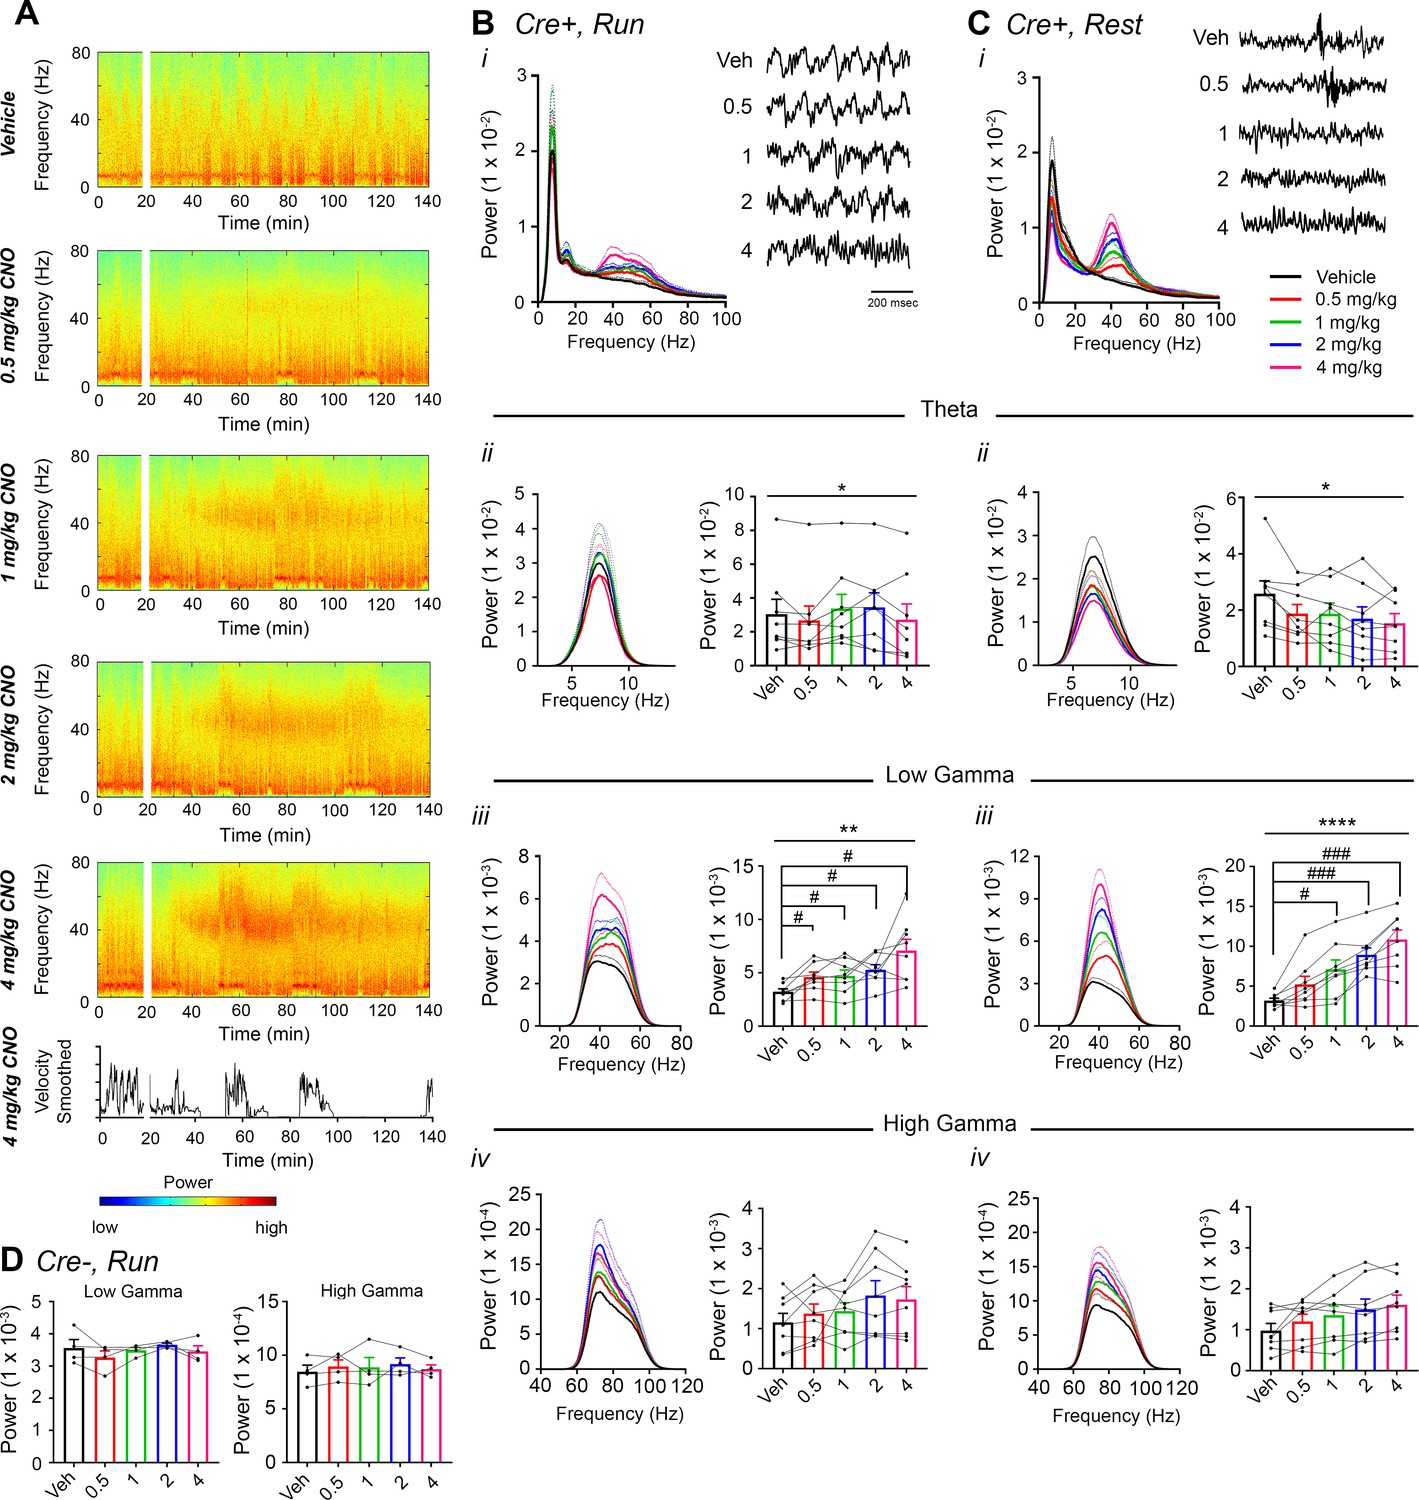
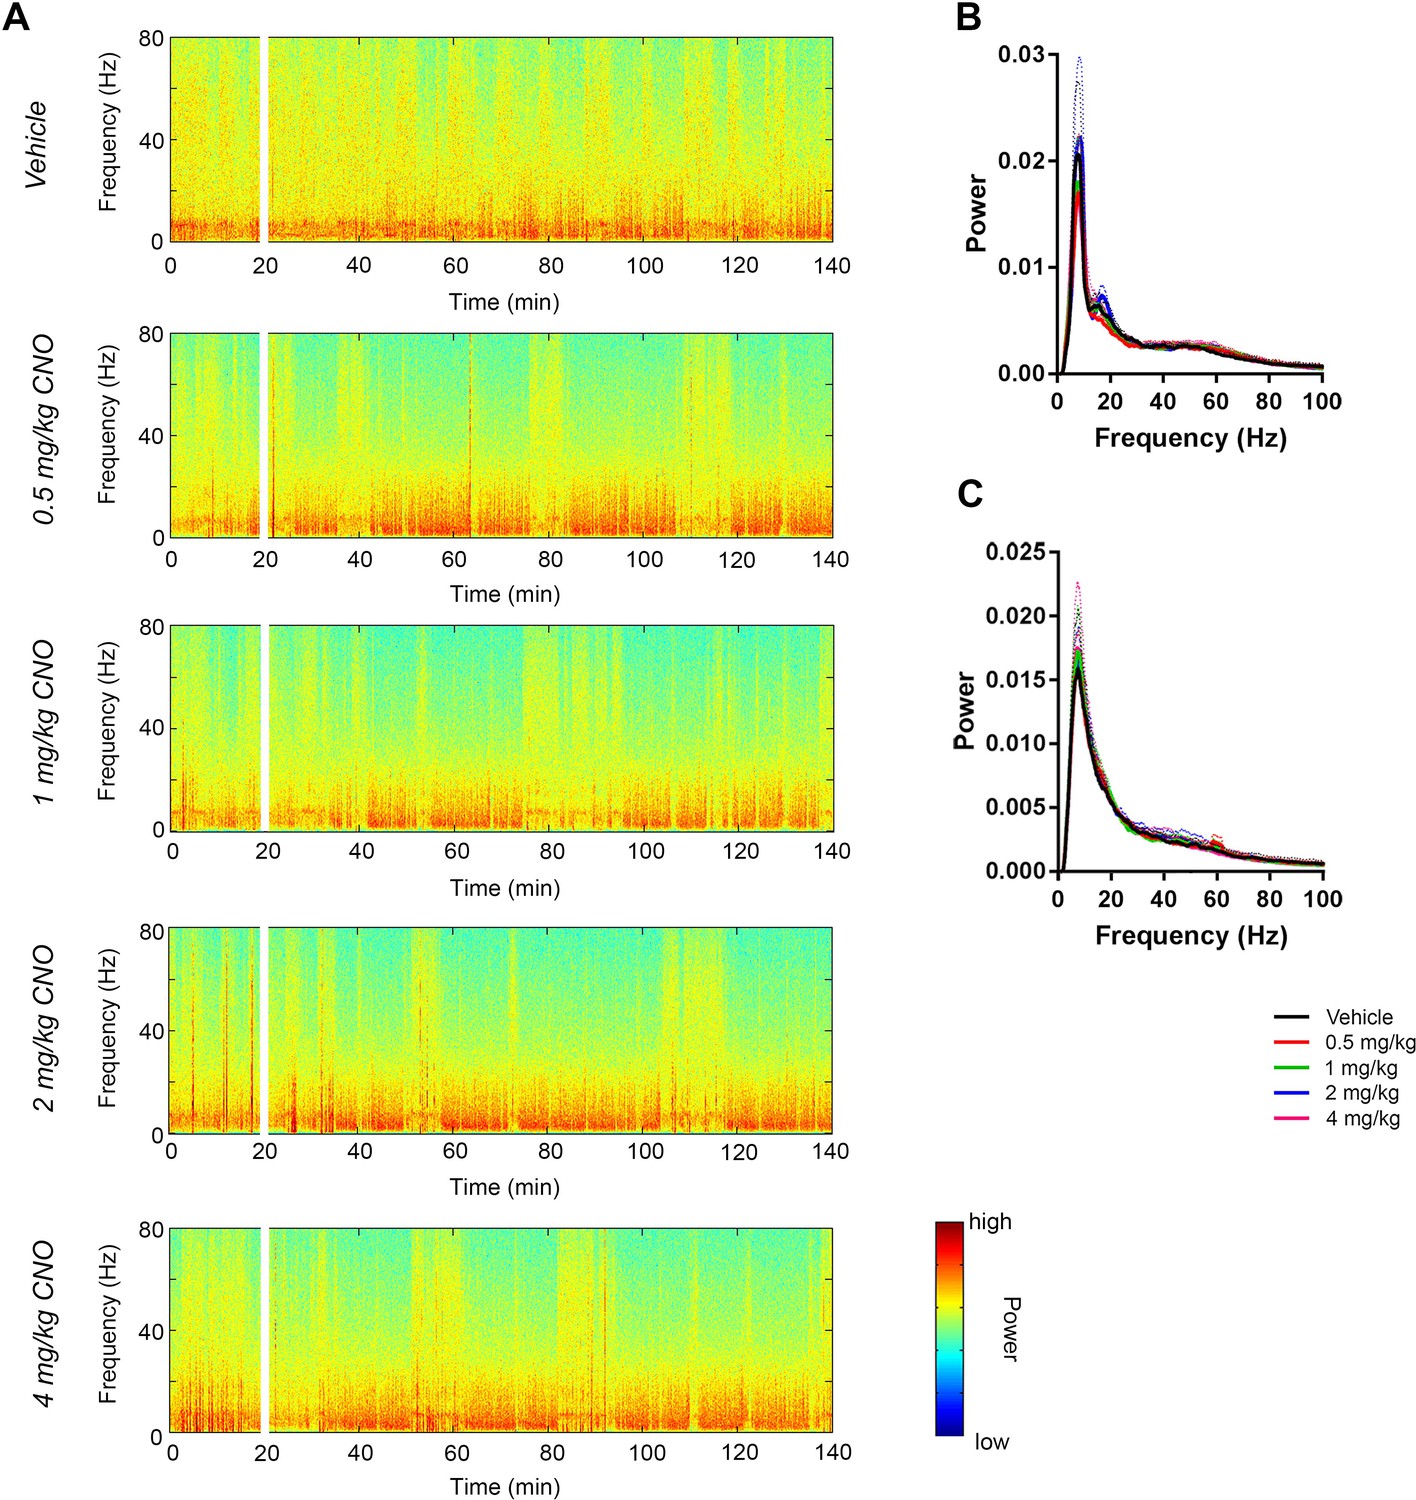
CNO treatment dose-dependently increases low-gamma power in hippocampus of hM3Dq-infused Amigo2-icreERT2+ mice.
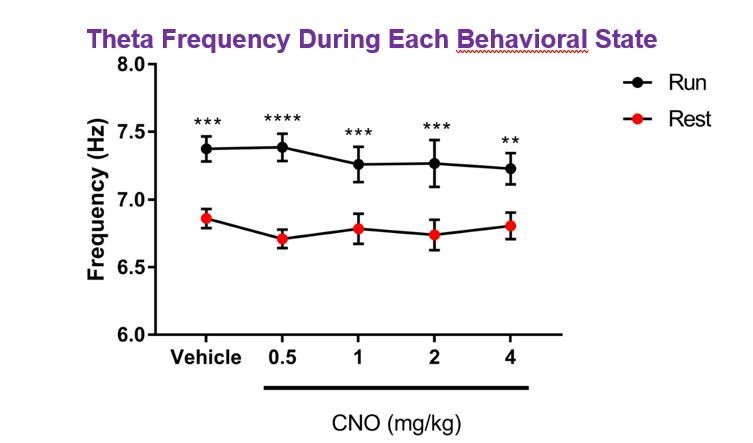
(A) Spectrograms of hippocampal LFP recordings depicting LFP power according to different frequencies over time. Vehicle/CNO administration time is shown by the white bar, and the treatment is shown to the left of each spectrogram. Locomotor velocity is shown in the bottom panel, corresponding to the 4 mg/kg CNO spectrogram. Note the increased theta band power during periods of running compared with periods of resting. (B–C) Power measures for hippocampal LFPs in Amigo2-icreERT2+ mice during periods of running (B) and resting (C). For each of B and C: (i) Power spectral density plots from LFPs for frequencies up to 100 Hz. (ii-iv) Power spectral density plots and peak power from LFPs filtered in the theta (5 – 10 Hz; ii), low-gamma (30 – 60 Hz; iii), or high-gamma (65 – 100 Hz; iv) frequency ranges. In Bi and Ci, raw LFP traces are shown to the right of the power spectral density plot for each treatment, sampled during a period of running (Bi) or resting (Ci) during the 30 – 60 min following treatment listed. Scale bar applies to both sets of traces. All recordings are taken from the same recording site in the same animal. In Bii-iv and Cii-iv, plots on the left show power spectral density plots for each frequency band, and plots on the right show mean peak power for the population of animals in colored bars and data from individual animals as black dots. (Bii) Theta power varied significantly upon treatment during running (N = 8 mice (three female, five male); Friedman statistic = 11.3; p = 0.0234, results of post hoc tests not significant). (Biii) CNO treatment produced a significant dose-dependent increase in low-gamma power during running (F(1.904, 13.33) = 9.457, p = 0.0030, repeated-measures one-way ANOVA with Geisser-Greenhouse correction for unequal variance; results of Holm-Sidak post hoc tests are shown by symbols. (Biv) CNO treatment did not significantly affect high-gamma power during running (F(1.384, 9.69) = 2.288, p = 0.1602, repeated-measures one-way ANOVA with Geisser-Greenhouse correction for unequal variance). (Cii) Theta power varied significantly upon treatment during rest (same N; F(1.972, 13.81) = 4.825, p = 0.0261, repeated-measures one-way ANOVA with Geisser-Greenhouse correction for unequal variance; results of post hoc tests not significant). (Ciii) CNO treatment produced a significant dose-dependent increase in low-gamma power during rest (F(2.306, 16.15) = 32.2), p < 0.0001, repeated-measures one-way ANOVA with Geisser-Greenhouse correction for unequal variance; results of Holm-Sidak post hoc tests are shown by symbols). (Civ) CNO treatment did not significantly affect high-gamma power during rest (F(1.286, 9.003) = 4.775, p = 0.0501, repeated-measures one-way ANOVA with Geisser-Greenhouse correction for unequal variance). (D) Peak low-gamma (left plot) and high-gamma (right plot) power for the population of Amigo2-icreERT2- mice infused with hM3Dq, treated with tamoxifen and challenged with CNO. Neither low-gamma power nor high-gamma power changed significantly in response to CNO administration during running (N = 4 male mice; low-gamma: F(1.669, 5.006) = 1.36, p = 0.3281; high-gamma: F(1.895, 5.684) = 0.5079, p = 0.6175, repeated-measures one-way ANOVA with Geisser-Greenhouse correction for unequal variance). *p < 0.05, **p < 0.01, ****p < 0.0001, one-way ANOVA; #p < 0.05, ###p < 0.001, Holm-Sidak post hoc test. See also Figure 2—figure supplements 1–8.
Figure 2—figure supplement 1
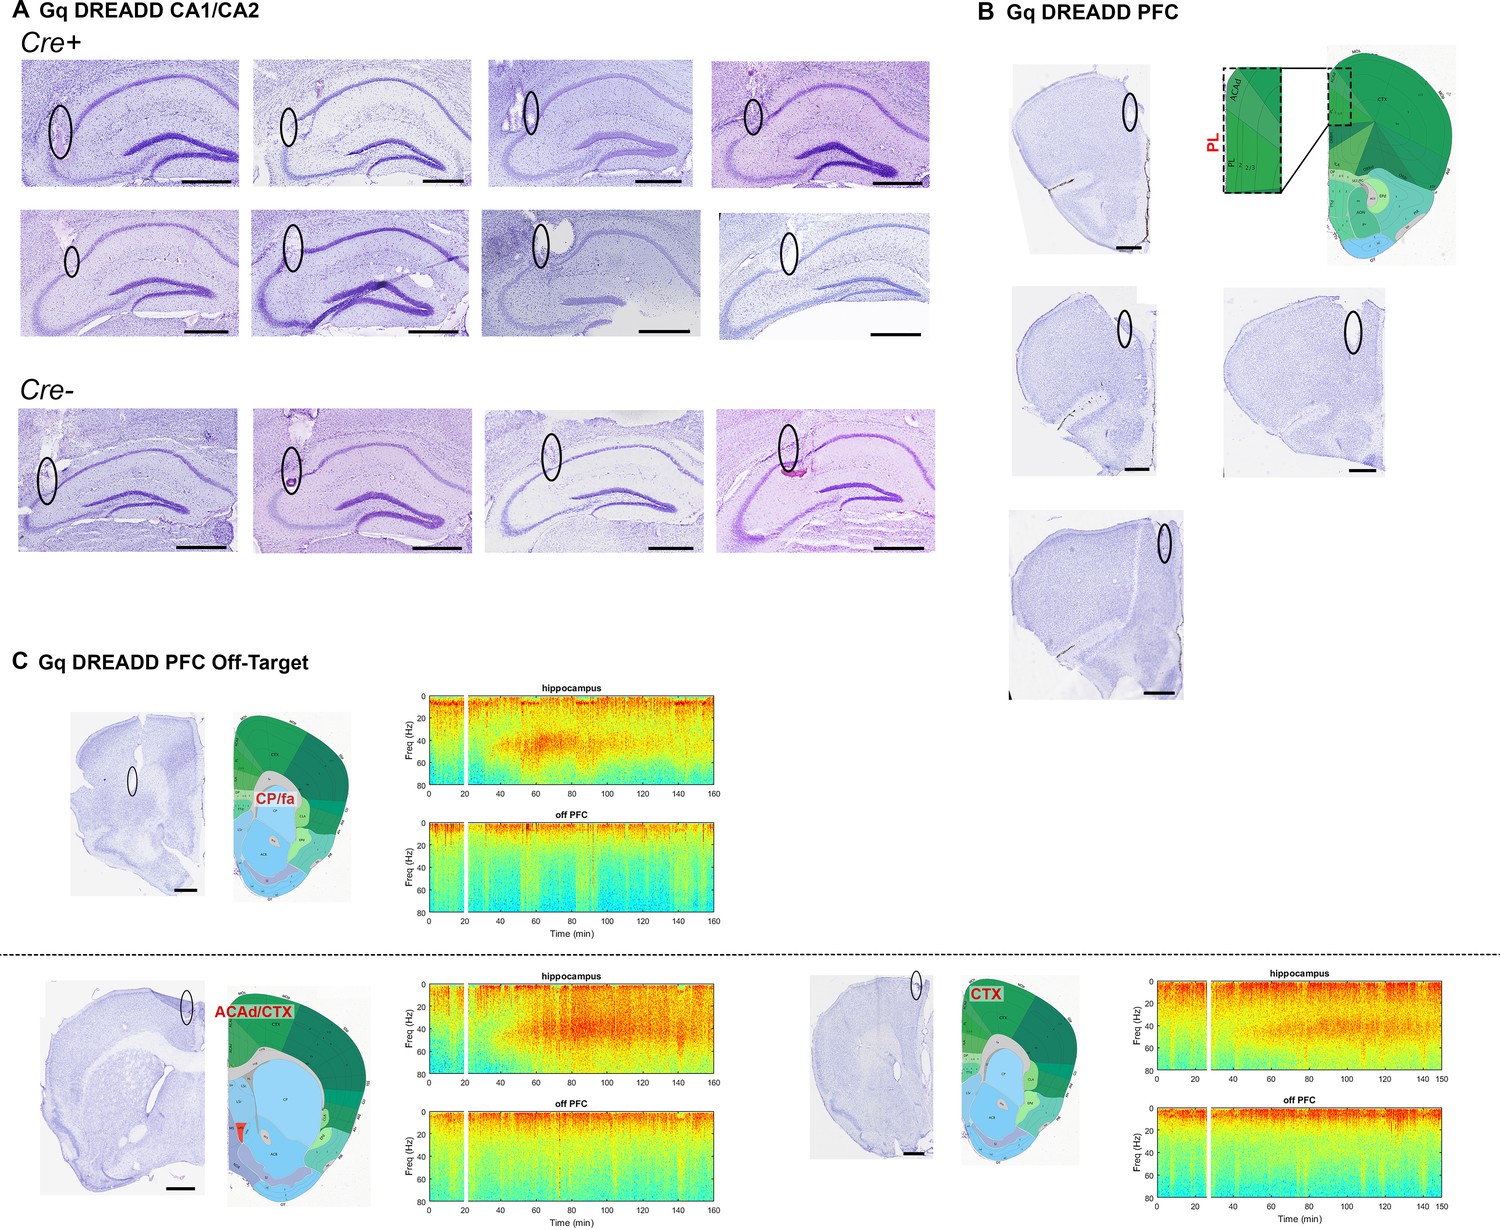
Electrode localization for Cre+ and Cre- Amigo2-icreERT2 mice infused with hM3Dq AAV and implanted with electrodes into hippocampus and PFC.
(A) Eight Cre+ and 4 Cre- animals were implanted with electrodes in hippocampus, targeting CA2/proximal CA1. Cre+ animals are shown on top and Cre- animals are shown on bottom. In seven of eight Cre+ hippocampal implanted animals, electrodes were also targeted toward prefrontal cortex. Four animals were successfully targeted toward prelimbic cortex (B), whereas three animals were implanted off-target (C). All brain sections are Nissl stained. In B and C, atlas images from the coronal plane approximately equivalent to that of the Nissl stained sections are shown. In B, all four Nissl-stained sections correspond to the atlas image to the right. The area bounded by the dotted rectangle is enlarged to the left. In C, spectrograms to the right of each brain section are shown for hippocampal (top) and off-target PFC (bottom) LFP channels corresponding to the animal from which the brain section was taken. Warmer colors represent more power and cooler colors represent less power. White bars represent the time of CNO (4 mg/kg, S.Q.) administration. Note that despite the increased gamma power in hippocampal channels, off-target PFC channels do not show increased gamma power. All scale bars represent 50 μm. Atlas images modified from Allen Mouse Brain Atlas (Image credit: Allen Institute) (Lein et al., 2007). ACAd: anterior cingulate area, dorsal part; CP: caudate-putamen; CTX: cortex; fa: anterior forceps.
Figure 2—figure supplement 2
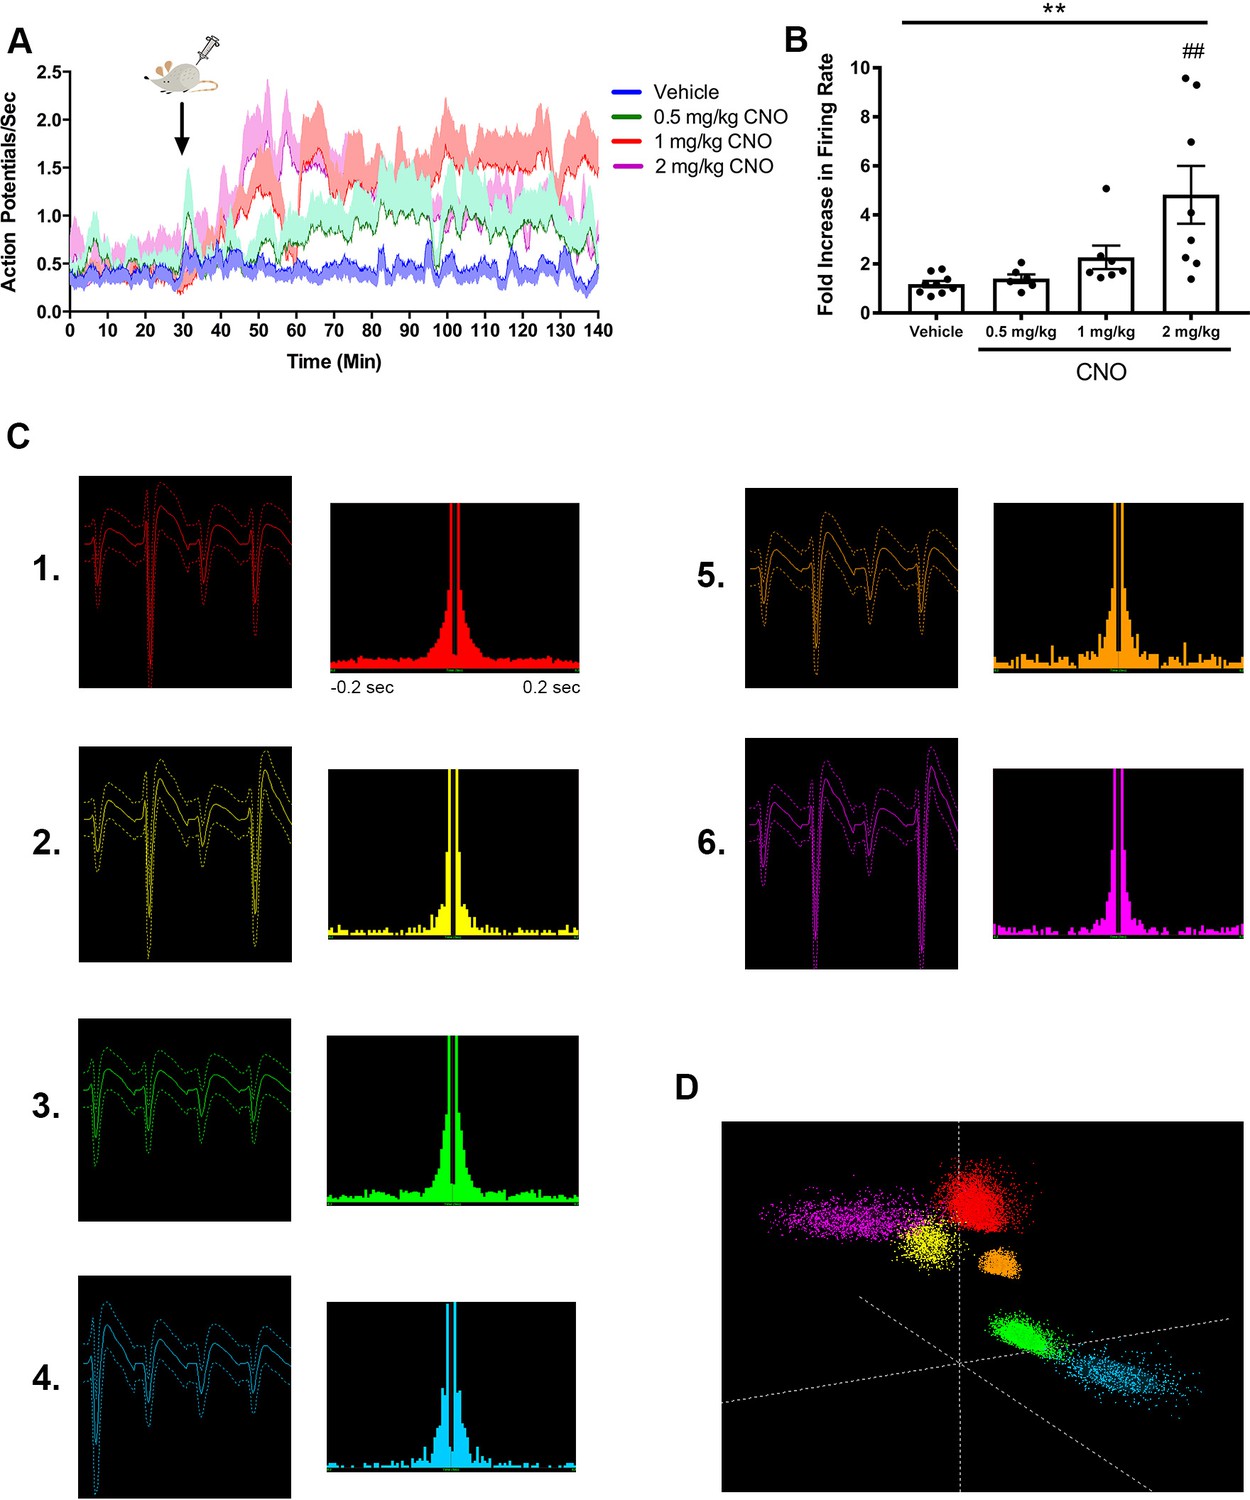
CNO dose-dependently increased firing rate of hippocampal pyramidal neurons in an hM3Dq-expressing mouse.
Electrode localization showed CA2/proximal CA1 recording site. (A) Timecourse of firing rate (action potentials/s) for the population of pyramidal neurons. CNO or vehicle was administered at 30 min, as indicated by the arrow. For each dose, the darker line shows the means at each time point and the lighter shaded area shows the standard error of the mean for each time point. (B) Fold increase in firing rate from baseline (pre-CNO) to post vehicle or CNO levels, measured 30 – 60 min following administration (n = 6 – 9 neurons/dose; F(3, 26) = 6.434, p = 0.0021; one-way ANOVA). (C) Average waveforms and autocorrelation plots for six representative neurons used for the analyses described in A-B. (D) Three-dimensional feature space plot showing clusters associated with each neuron represented in (C). **p < 0.01, one-way ANOVA, ##p < 0.01 Holm-Sidak post-hoc test.
Figure 2—figure supplement 3
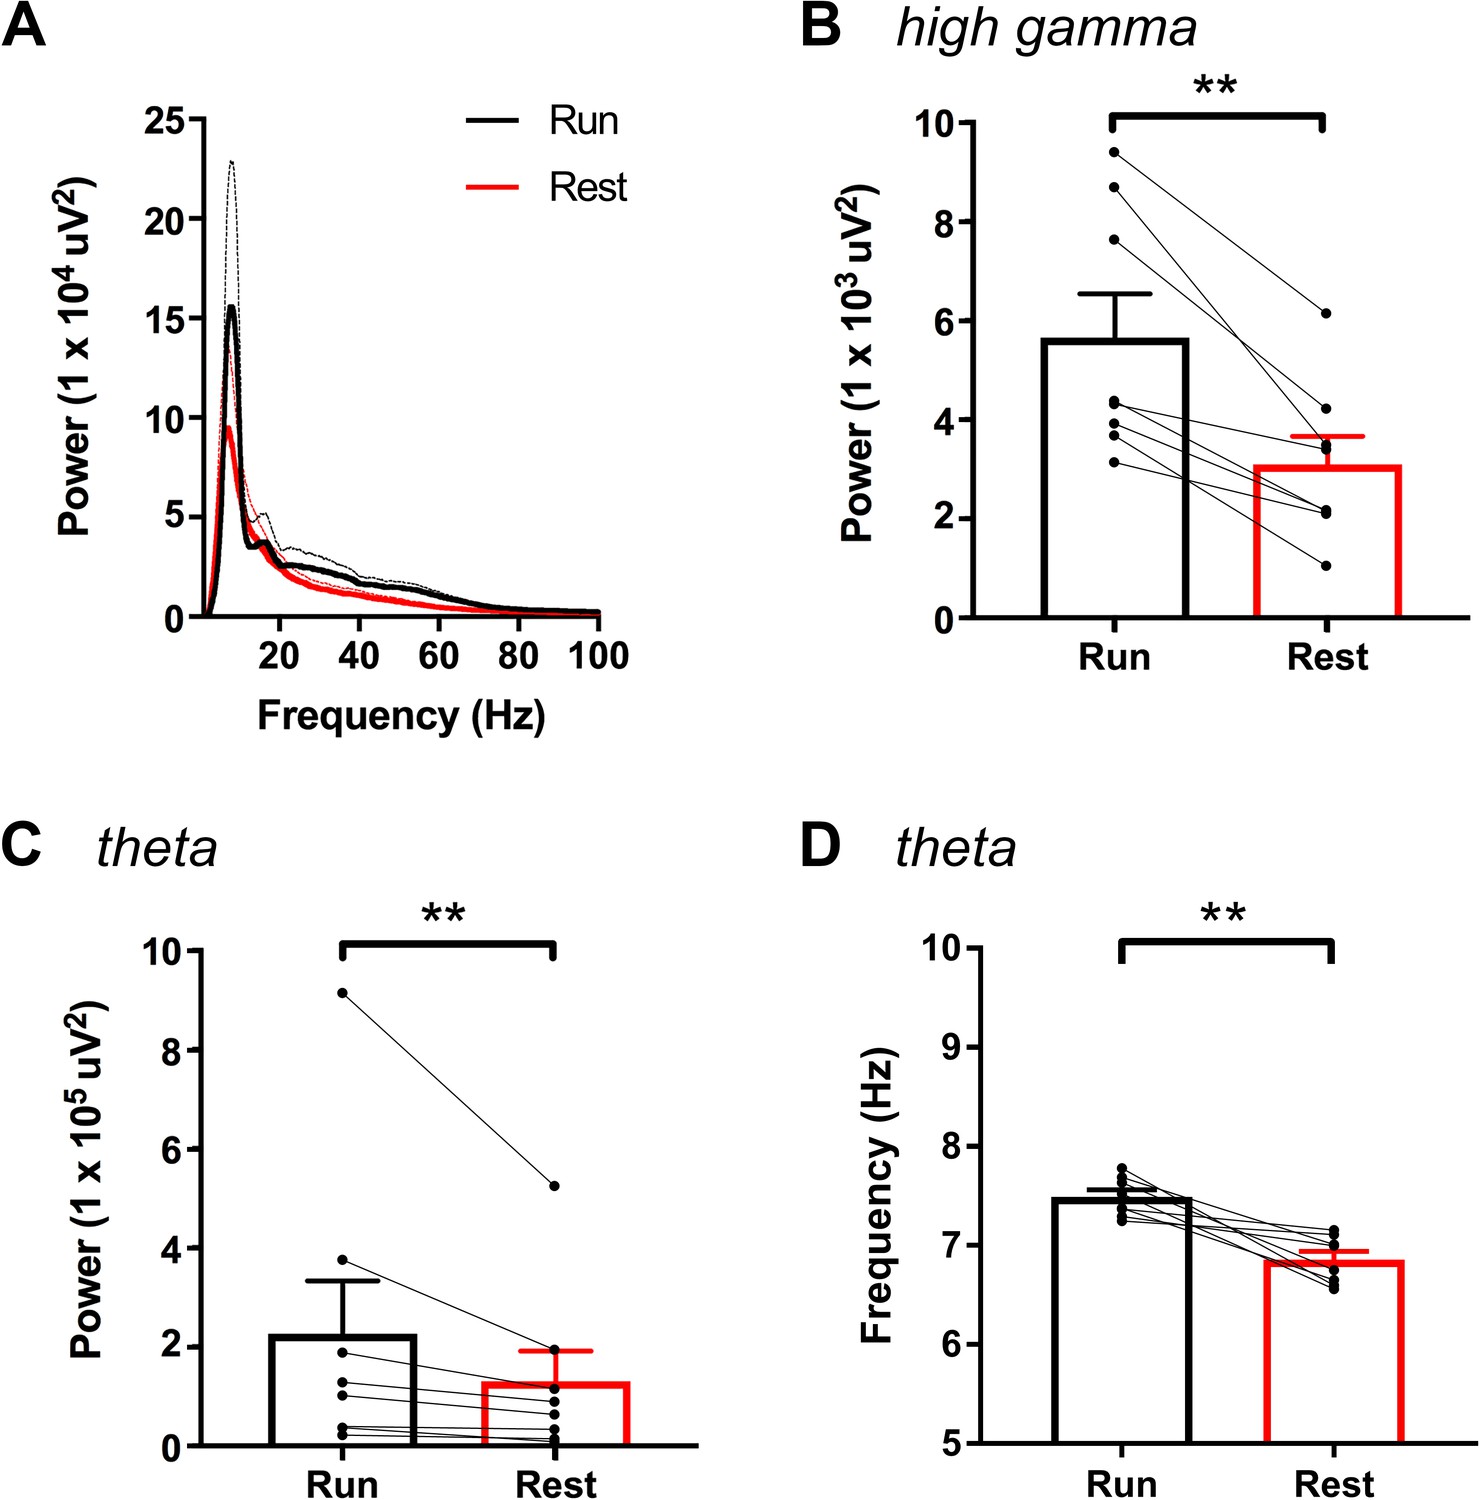
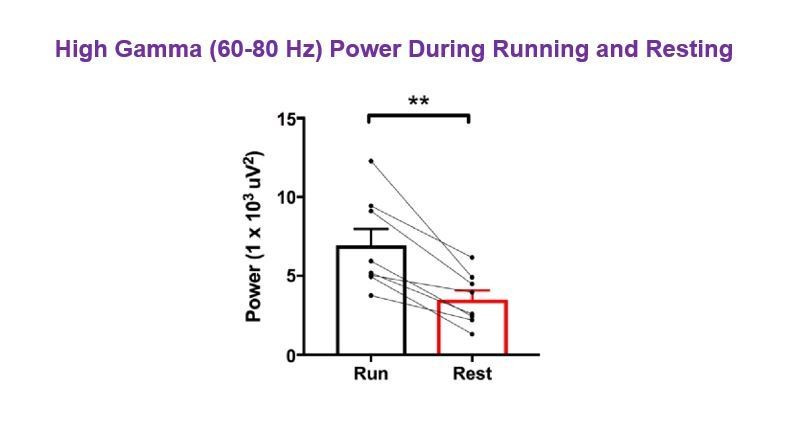
High-gamma power and theta power were significantly greater during periods of running than periods of resting in hM3Dq animals following vehicle treatment, as measured from non-normalized LFPs.
A, Power spectral density plots from LFPs for frequencies up to 100 Hz during periods of running and resting. B-C, Peak power in the high-gamma (B) and theta (C) frequency bands demonstrating significantly increased power for each during periods of running (high-gamma: t(7) = 5.114, p = 0.0014, paired t-test; theta: W = -36, p = 0.0078, Wilcoxon signed-rank test). D, Peak theta frequency was significantly higher during periods of running than resting (t(7) = 4.711, p = 0.0022, paired t-test). **p < 0.01.
Figure 2—figure supplement 4

Percent of time running (A, C, E) and mean running speed during periods of run (B, D, F) for hM3Dq (A, B) and hM4Di (C, D) animals for each treatment.
Neither running time nor mean velocity was significantly different across genotype or treatment for either hM3Dq mice (percent of time running: main effect of genotype: F(1, 10) = 0.1317, p = 0.7242; main effect of treatment: F(4, 40) = 0.5251, p = 0.7178; interaction: F(4, 40) = 1.265, p = 0.2996; running velocity: main effect of genotype: F(1, 10) = 0.2178, p = 0.6507); main effect of treatment: F(4, 40) = 0.1857; p = 0.9445); interaction: F(4, 40) = 0.8774, p = 0.4860; two-way ANOVA) or hM4Di mice (percent of time running: main effect of genotype: F(1, 12) = 0.02054, p = 0.8884; main effect of treatment: F(1, 12) = 2.988, p = 0.1095; interaction: F(1, 12) = 0.02761, p = 0.8708; running velocity: main effect of genotype: F(1, 12) = 0.2934, p = 0.5979; main effect of treatment: F(1, 12) = 2.465, p = 0.1424; interaction: F(1, 12) = 0.02162, p = 0.8855; two-way ANOVA). However, both percent of time running (E) and mean run velocity (F) were significantly higher in hM4Di animals following vehicle treatment than hM3Dq animals following vehicle treatment (Cre+ and Cre- combined; time spent running: t(24) = 2.403, p = 0.0243; run velocity: t(24) = 3.515, p = 0.0018; unpaired t-test), likely reflecting the different recording procedures between the two sets of experiments.
Figure 2—figure supplement 5
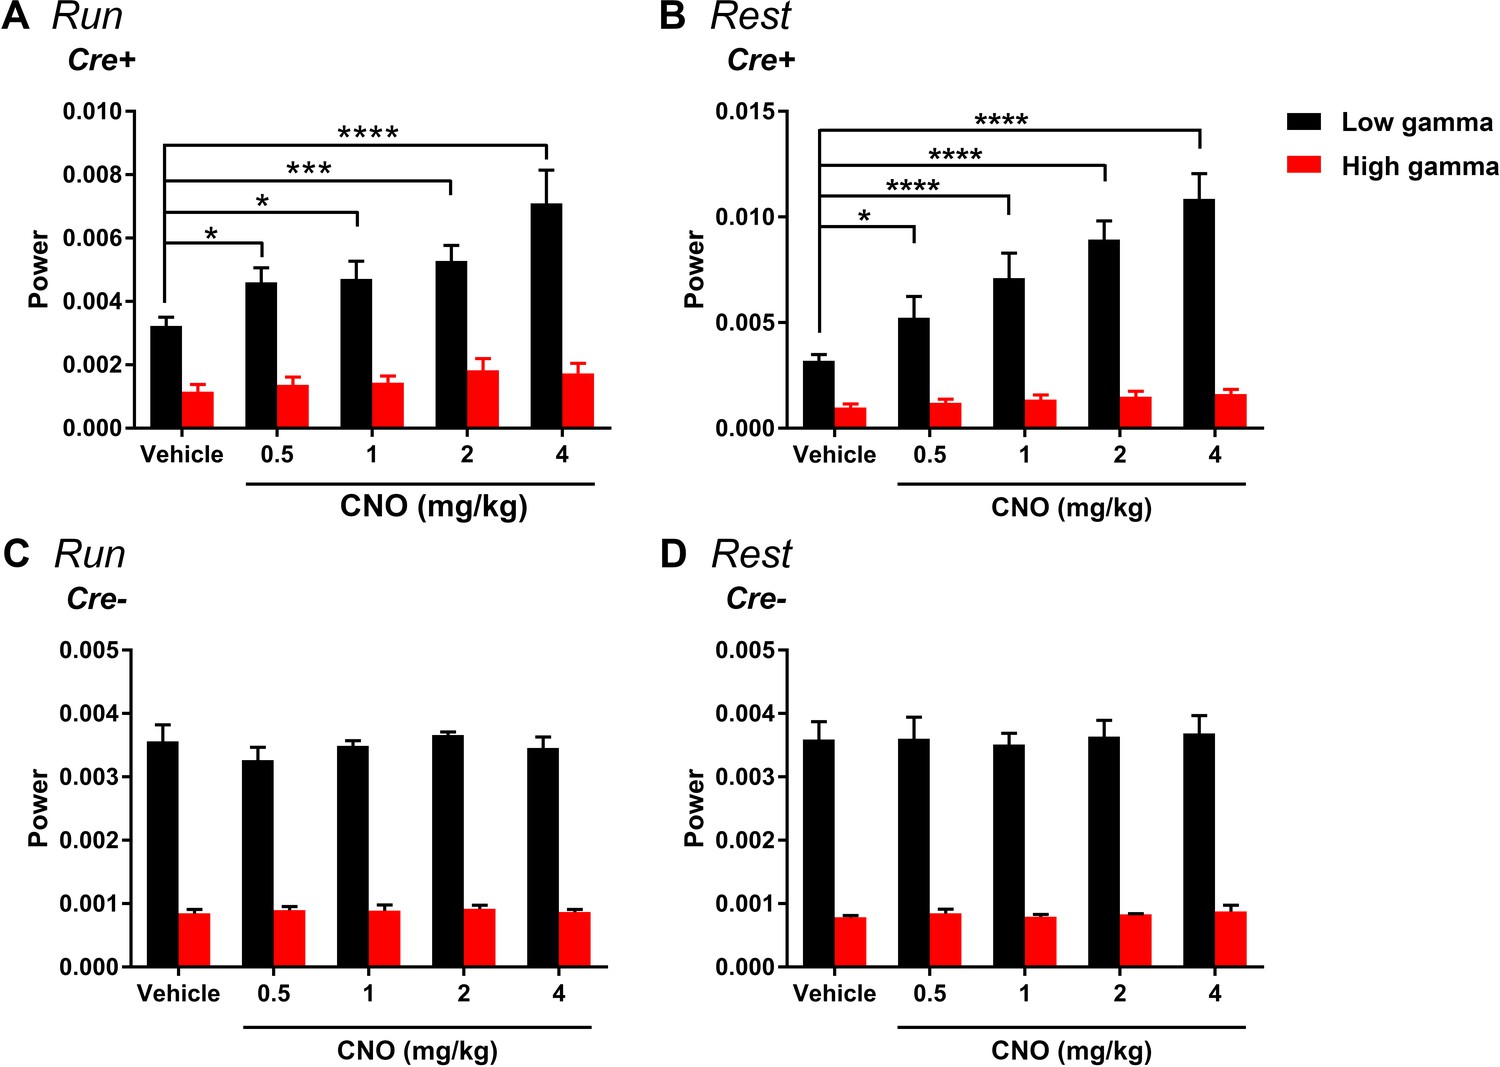
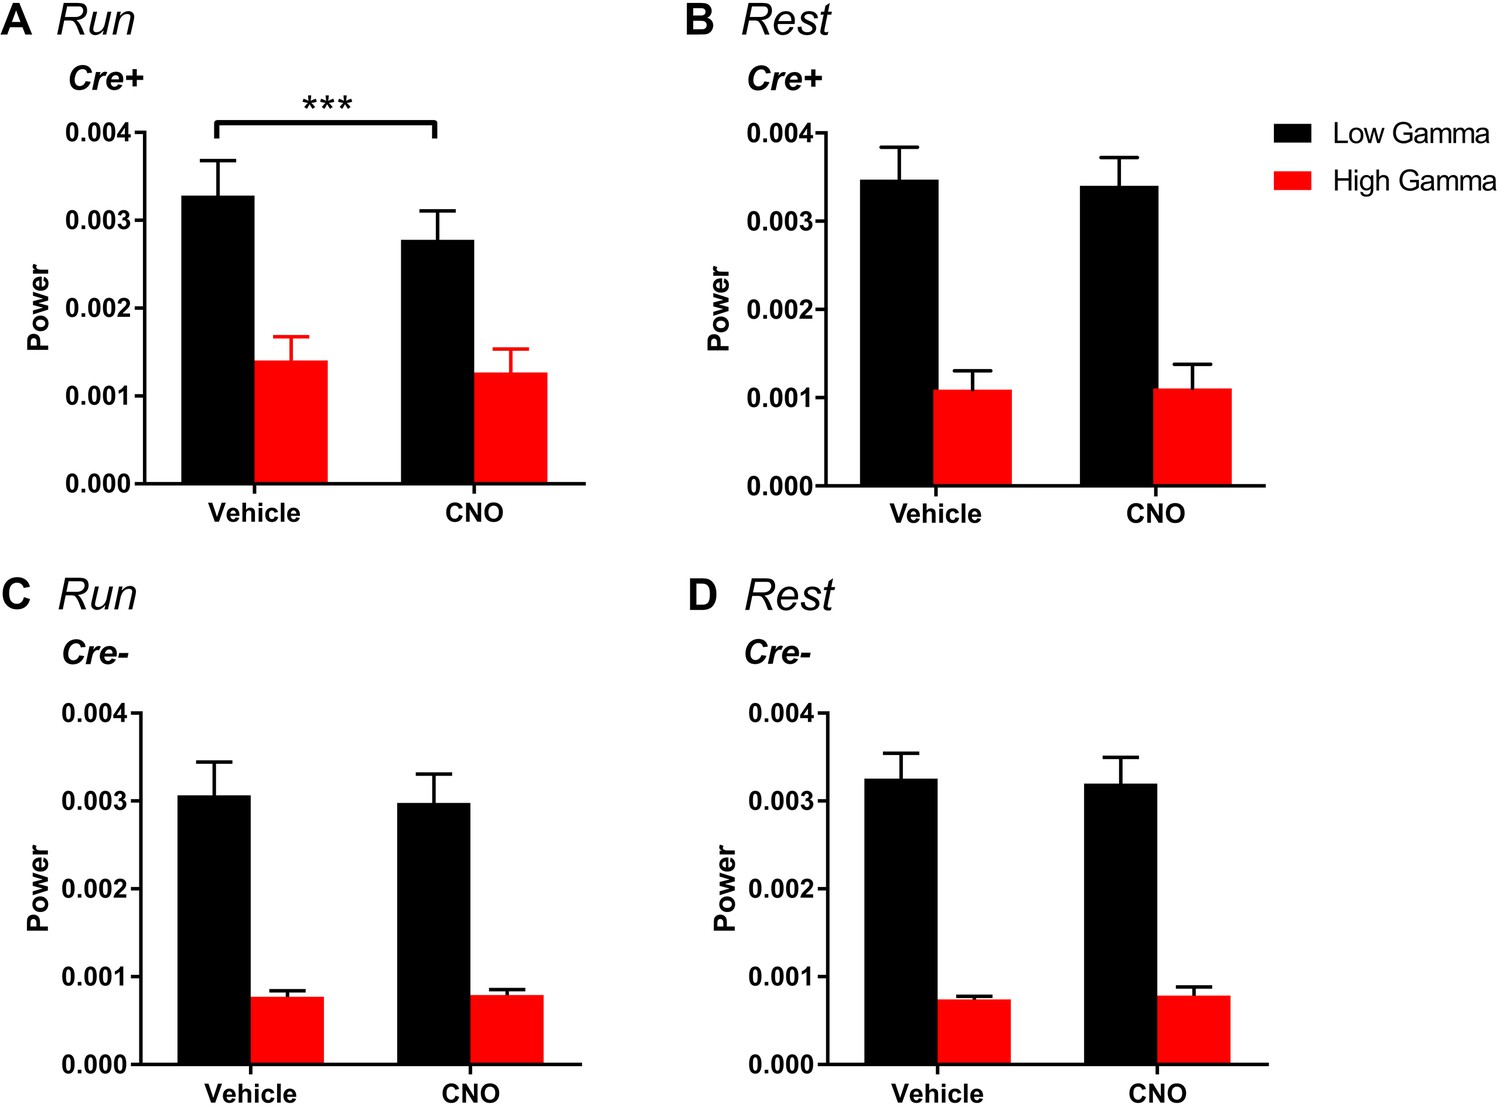
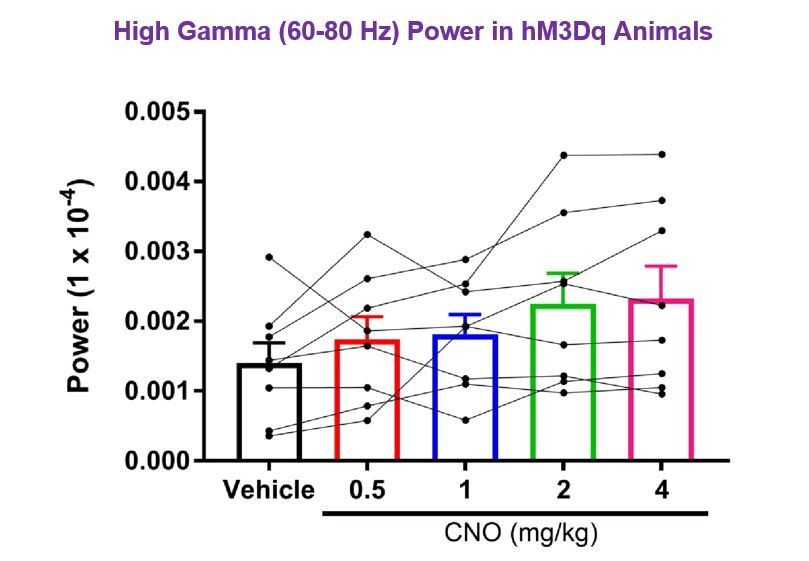
Change in gamma power by hM3Dq is selective for low-gamma and does not significantly affect highgamma during either run (A) or rest (B).
(A) During running, in Cre+ animals, low-gamma power, but not high-gamma power, was increased (main effect of treatment: F(4, 28) = 9.605, p < 0.0001; main effect of gamma range: F(1, 7) = 111.1, p < 0.0001; interaction: F(4 28) = 6.945, p = 0.0005, two-way ANOVA; Bonferroni multiple comparisons tests: low-gamma, 0.5 mg/kg, p = 0.0204; 1 mg/kg, p = 0.0112; 2 mg/kg, p = 0.0004; 4 mg/kg, p < 0.0001; high-gamma, 0.5 and 1 mg/kg, p > 0.9999; 2 mg/kg, p = 0.5857; 4 mg/kg, p = 0.8531). B, During rest, in Cre+ animals, low-gamma power, but not high-gamma power, was increased (main effect of treatment: F(4, 28) = 38.24, p < 0.0001; main effect of gamma range: F(1,7) = 51.01, p = 0.0002; interaction: F(4, 28) = 24.54, p < 0.0001, two-way ANOVA). Follow-up post hoc tests revealed a significant increase in low-gamma for 0.5, 1, 2, and 4 mg/kg CNO but no significant change in high-gamma power (low-gamma: 0.5 mg/kg, p = 0.0105; 1 mg/kg, p < 0.0001; 2 mg/kg, p < 0.0001; 4 mg/kg, p < 0.0001; high-gamma: all doses, p > 0.9999, Bonferroni’s multiple comparison tests). C-D, During both run and rest, Cre- animals showed no significant change in either low-gamma or high-gamma power (run: main effect of treatment: F(4, 12) = 1.368, p = 0.3021; main effect of gamma range: F(1, 3) = 930.5, p < 0.0001; interaction: F(4, 12) = 1.216, p = 0.3543; rest: main effect of treatment: F(4, 12) = 0.2884, p = 0.8799; main effect of gamma range: F(1, 3) = 136.5, p = 0.0013; interaction: F(4, 12) = 0.1033, p = 0.9792).
Figure 2—figure supplement 6
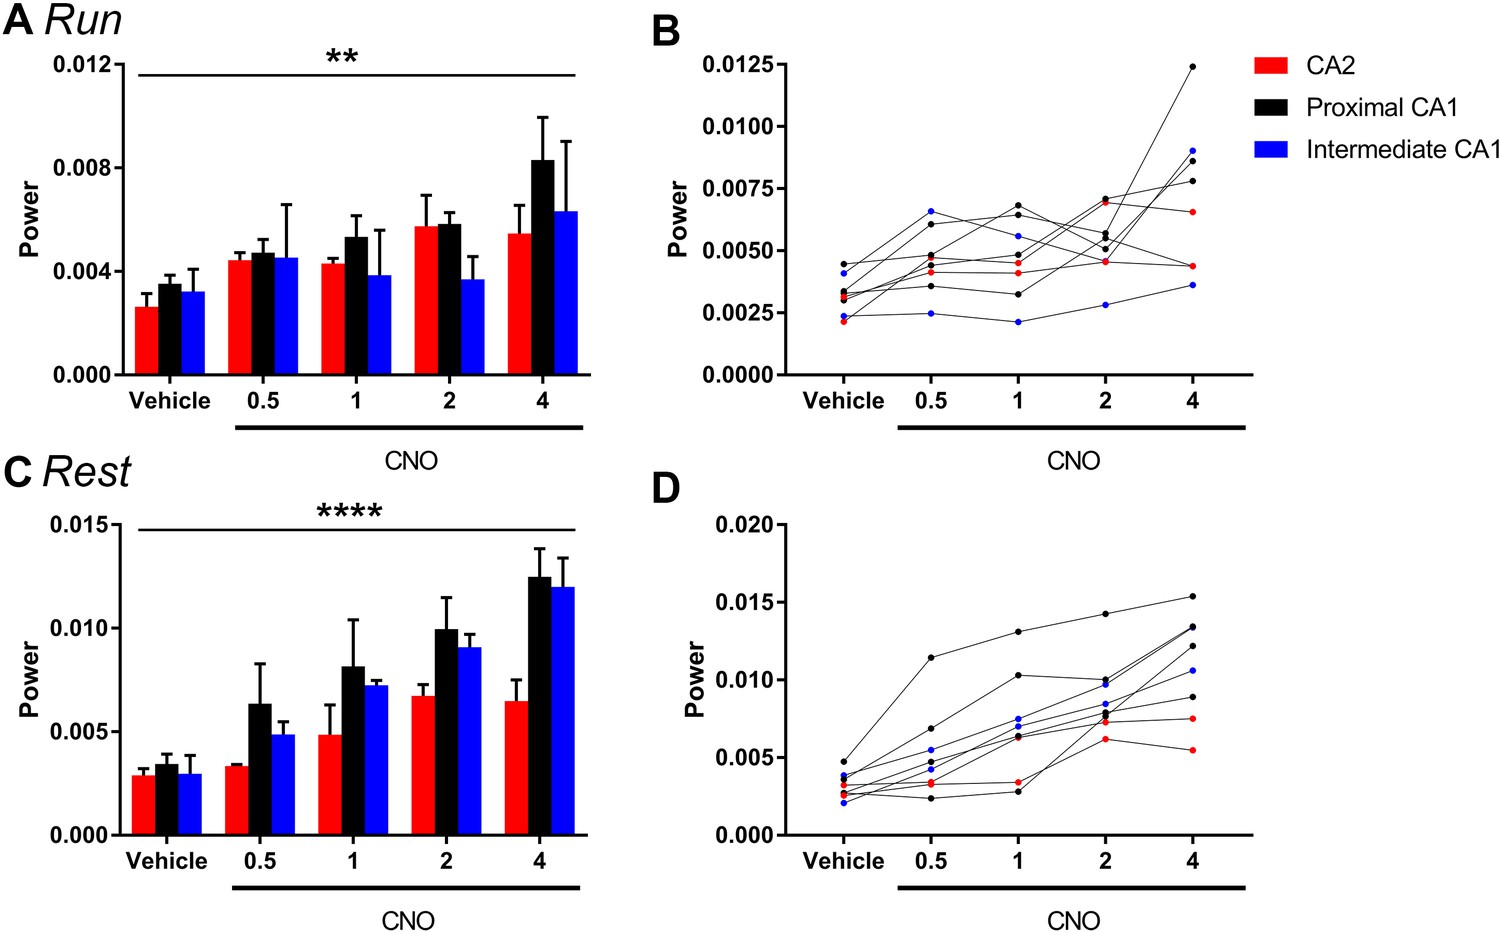
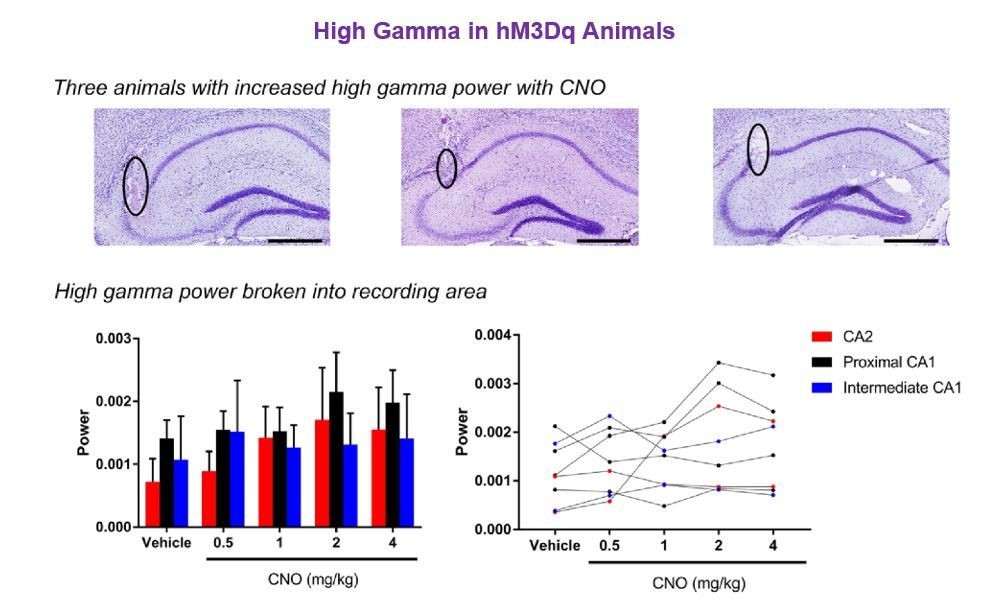
The magnitude of hM3Dq-mediated change in low-gamma power did not vary significantly as a function of proximal or distal recording location for periods of running (A–B) or rest (C–D).
Animals were divided into groups according to the recording location being in CA2 (N = 2), proximal CA1 (N = 4) or intermediate CA1 (more distal to CA2 than proximal CA1; N = 2). A and C show population means and SEM, and B and D show individual animal data. We found no significant difference in the magnitude of gamma power change between recordings from close to CA2 and further from CA2 during periods of run (main effect of location: F(2, 5) = 0.6411, p = 0.5651; main effect of treatment: F(4, 20) = 6.668, p = 0.0014; interaction: F(8, 20) = 0.7554, p = 0.6443; two-way ANOVA) or periods of rest (main effect of location: F(2, 5) = 1.307, p = 0.3494; main effect of treatment: F(4, 20) = 29.98, p < 0.0001; interaction: F(8, 20) = 1.478, p = 0.2268; two-way ANOVA). **p < 0.01, ****p < 0.0001.
Figure 2—figure supplement 7
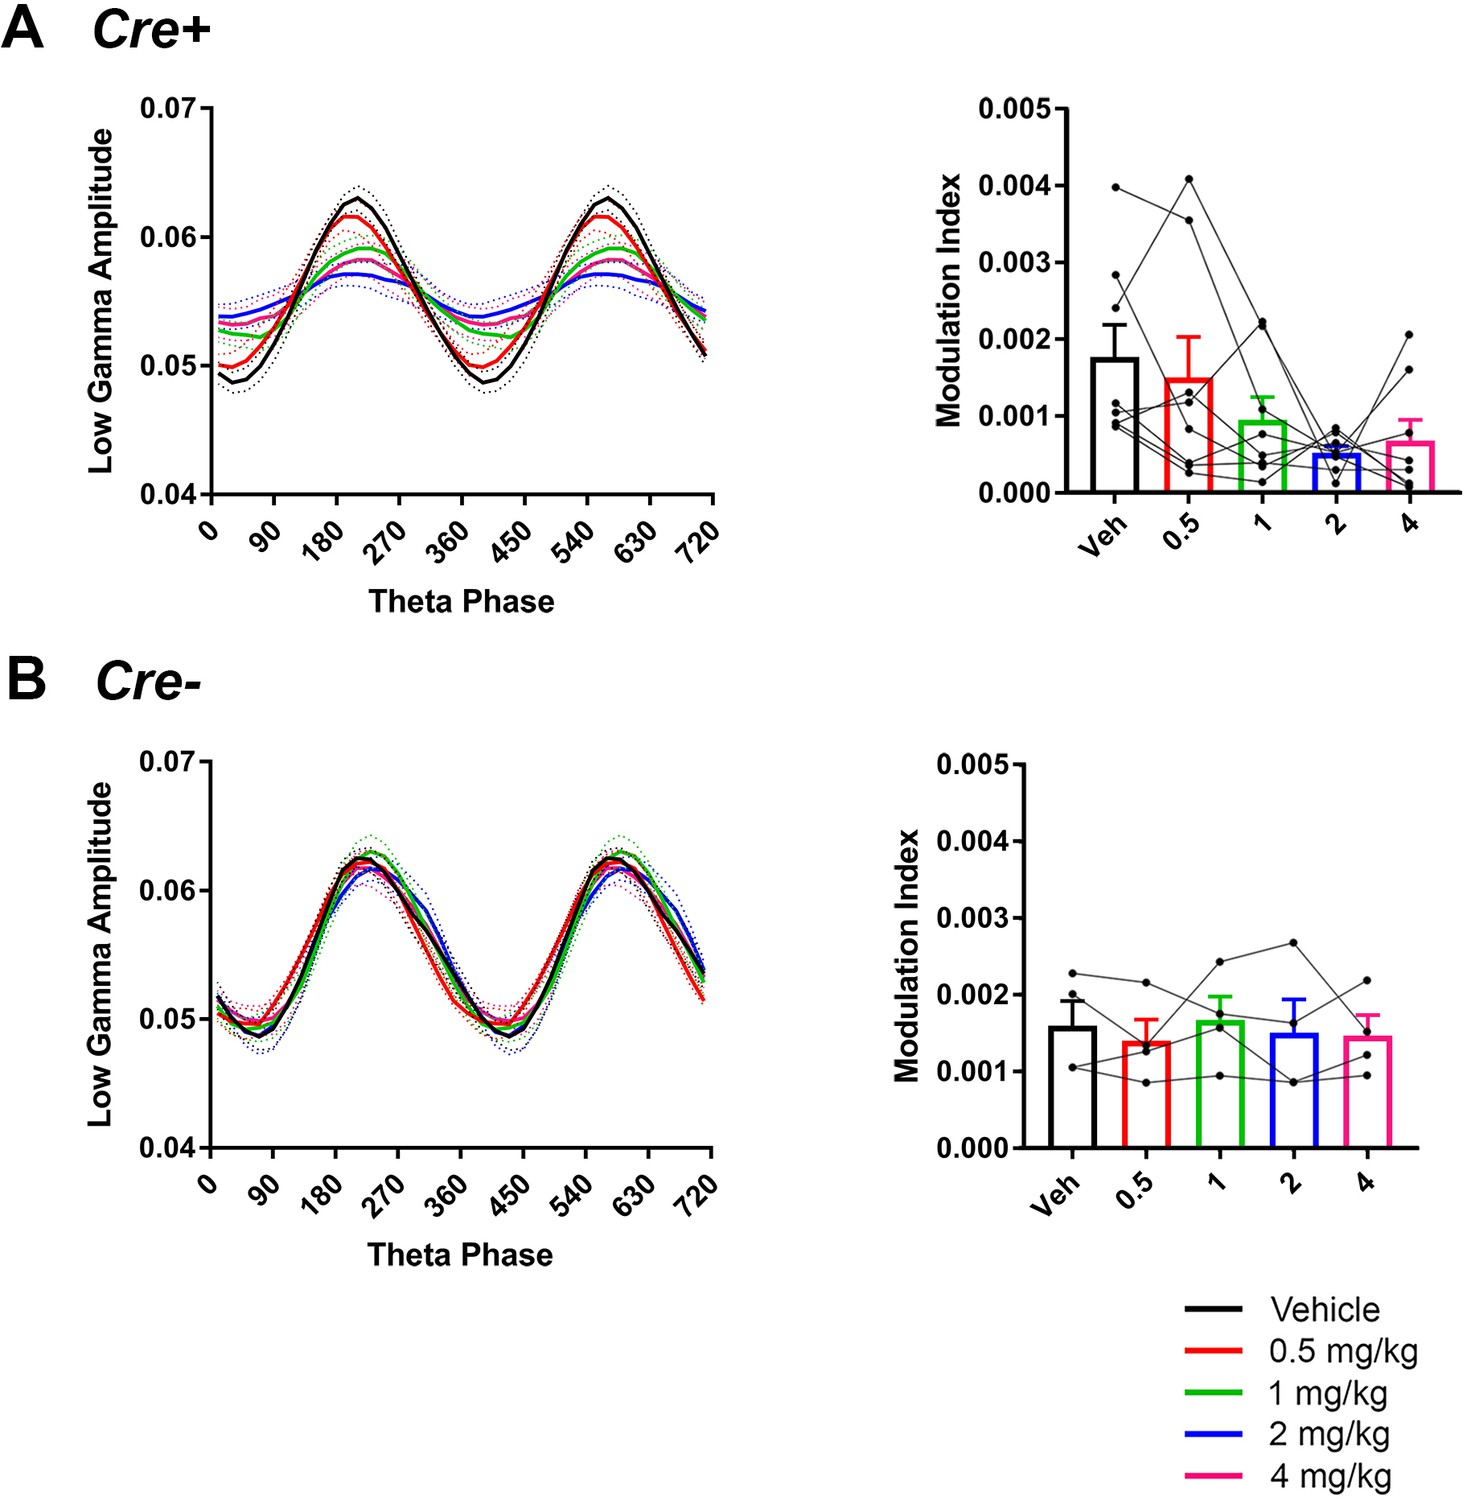
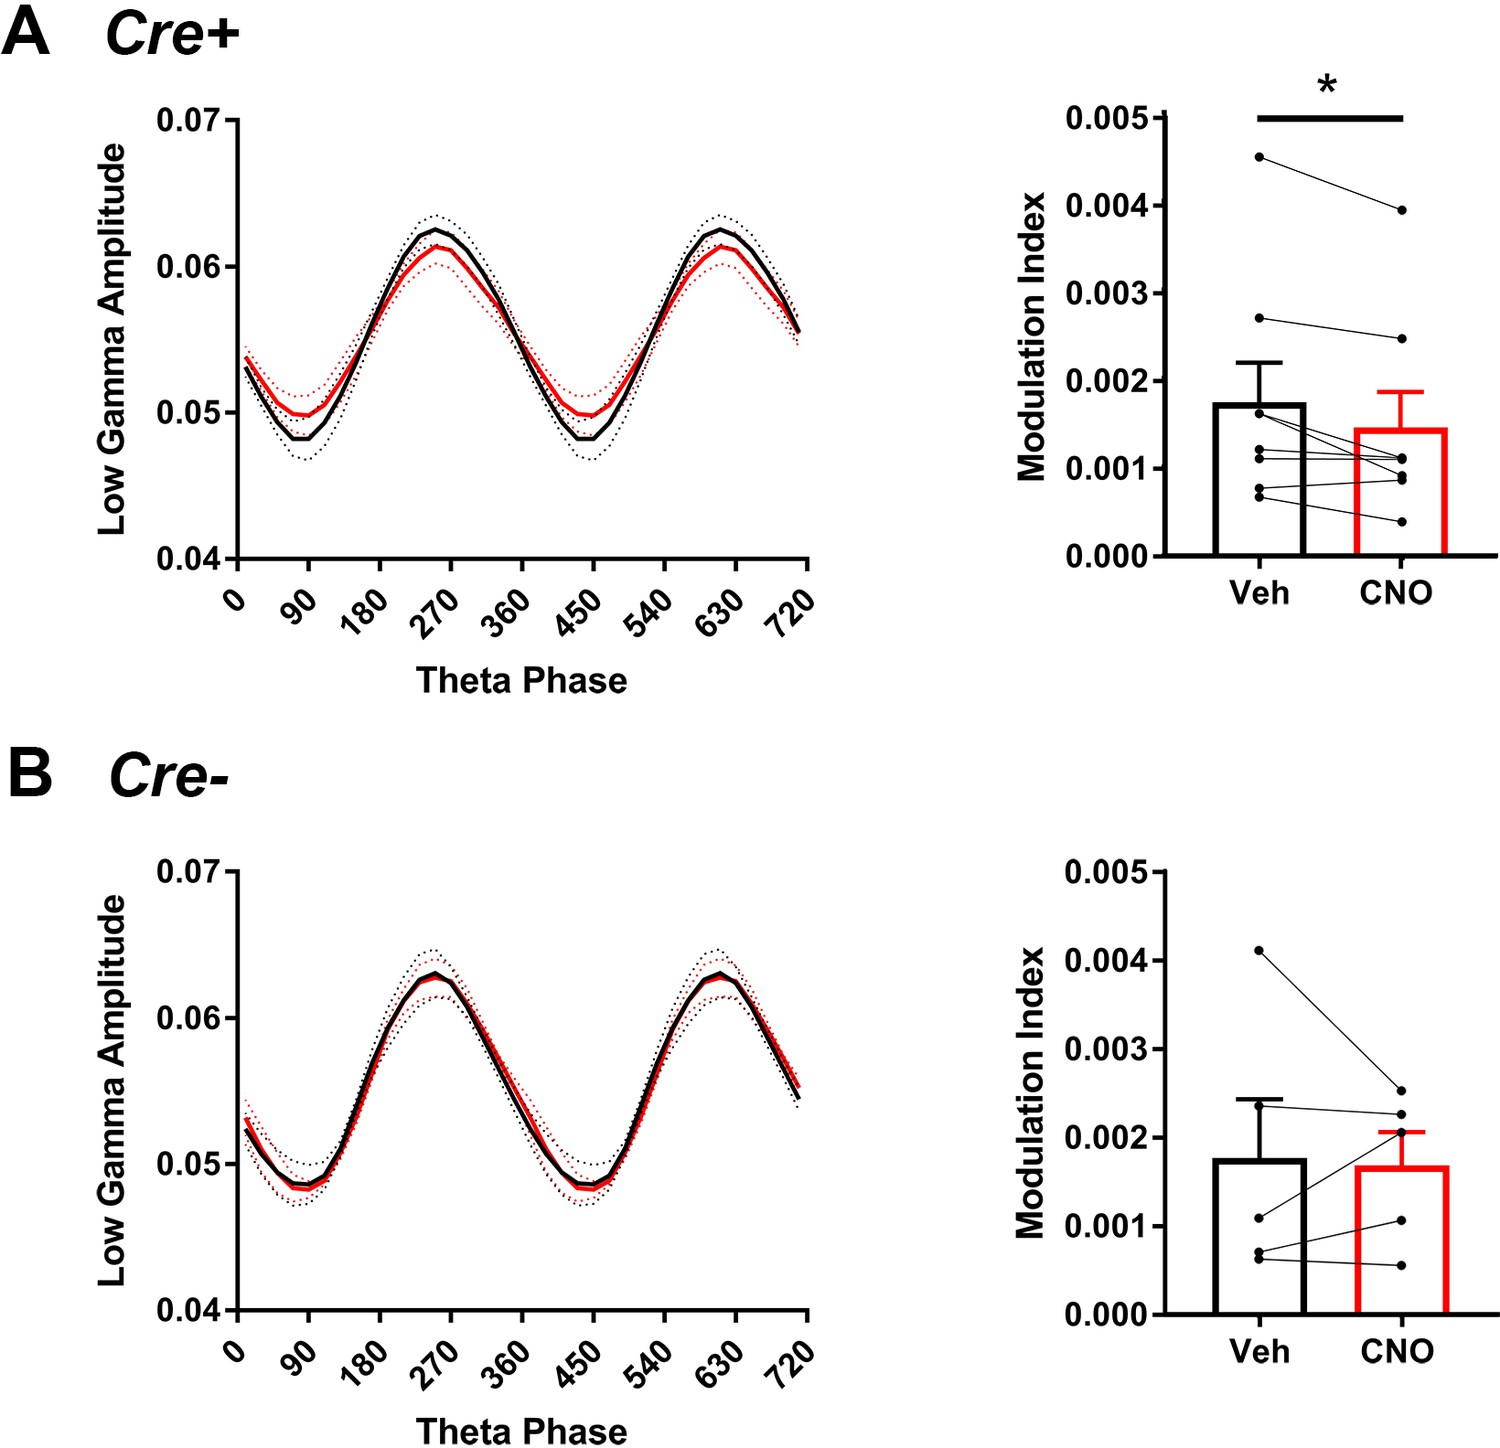
Comodulation of low-gamma amplitude and theta phase in hM3Dq mice with vehicle or CNO treatment.
CNO did not significantly affect theta phase of peak low-gamma amplitude in Cre+ mice but trended toward affecting modulation index (A), N = 8, phase: F(1.266, 8.864) = 0.4696, p = 0.5552; modulation index: F(2.475, 17.33) = 3.11, p = 0.0612, repeated-measures one-way ANOVA with Geisser-Greenhouse correction for unequal variance). In Cre- mice, neither phase not modulation index was affected by CNO (B) phase: F(1.449, 4.346) = 0.6923, p = 0.5033; modulation index: F(1.329, 3.988) = 0.3098, p = 0.6688, repeated-measures one-way ANOVA with Geisser-Greenhouse correction for unequal variance).
Figure 2—figure supplement 8
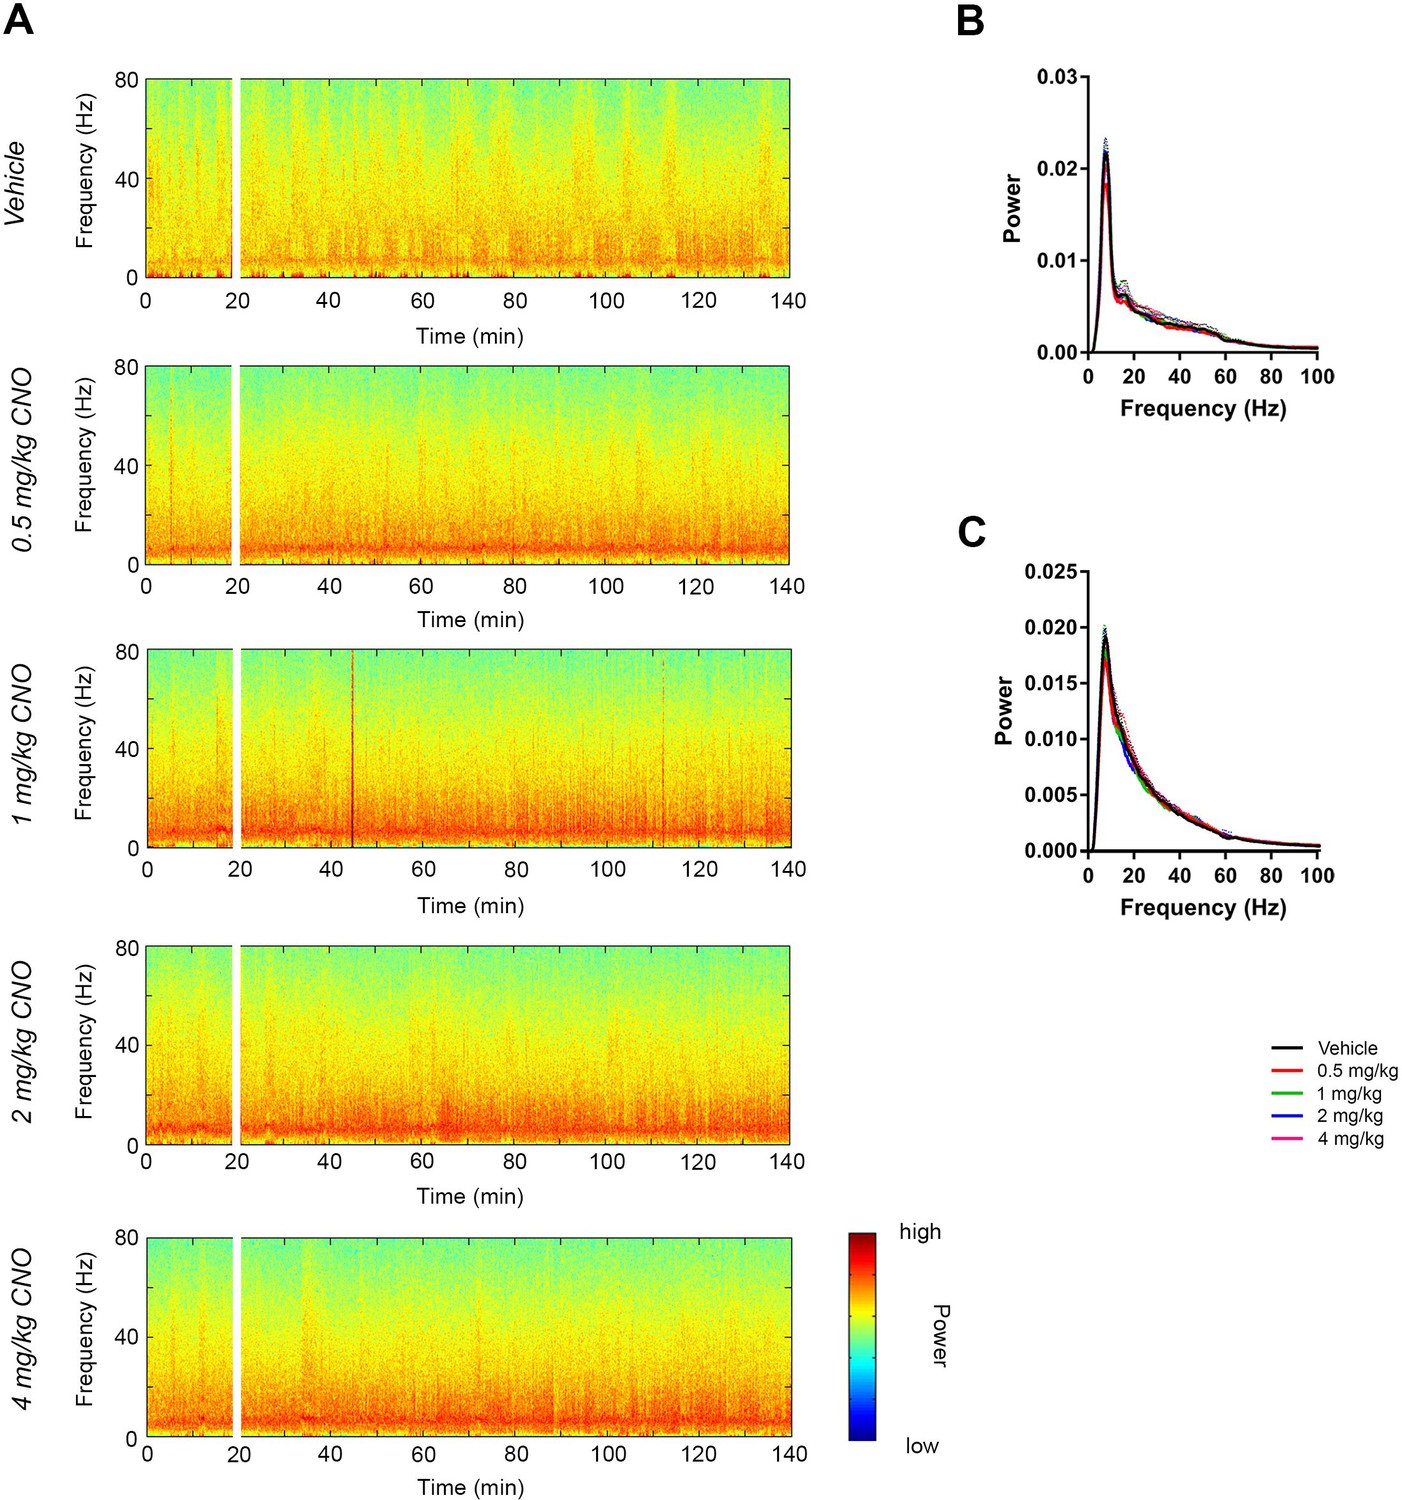
CNO did not affect low-gamma power in hippocampus of hM3Dq-infused Cre- Amigo2-icreERT2 mice.
(A) Spectrograms of hippocampal LFP recordings depicting LFP power according to different frequencies over time. CNO/vehicle administration time is shown by the white bar, and the treatment is shown to the left of each spectrogram. (B–C) Mean power spectral density for hippocampal LFPs during periods of running (B) or resting (C) measured 30 – 60 min following treatment for the population of Cre- Amigo2-icreERT2 mice infused with hM3Dq and treated with vehicle or CNO. Power spectral densities were plotted for LFP frequencies low-pass filtered below 100 Hz.
Figure 3 with 2 supplements
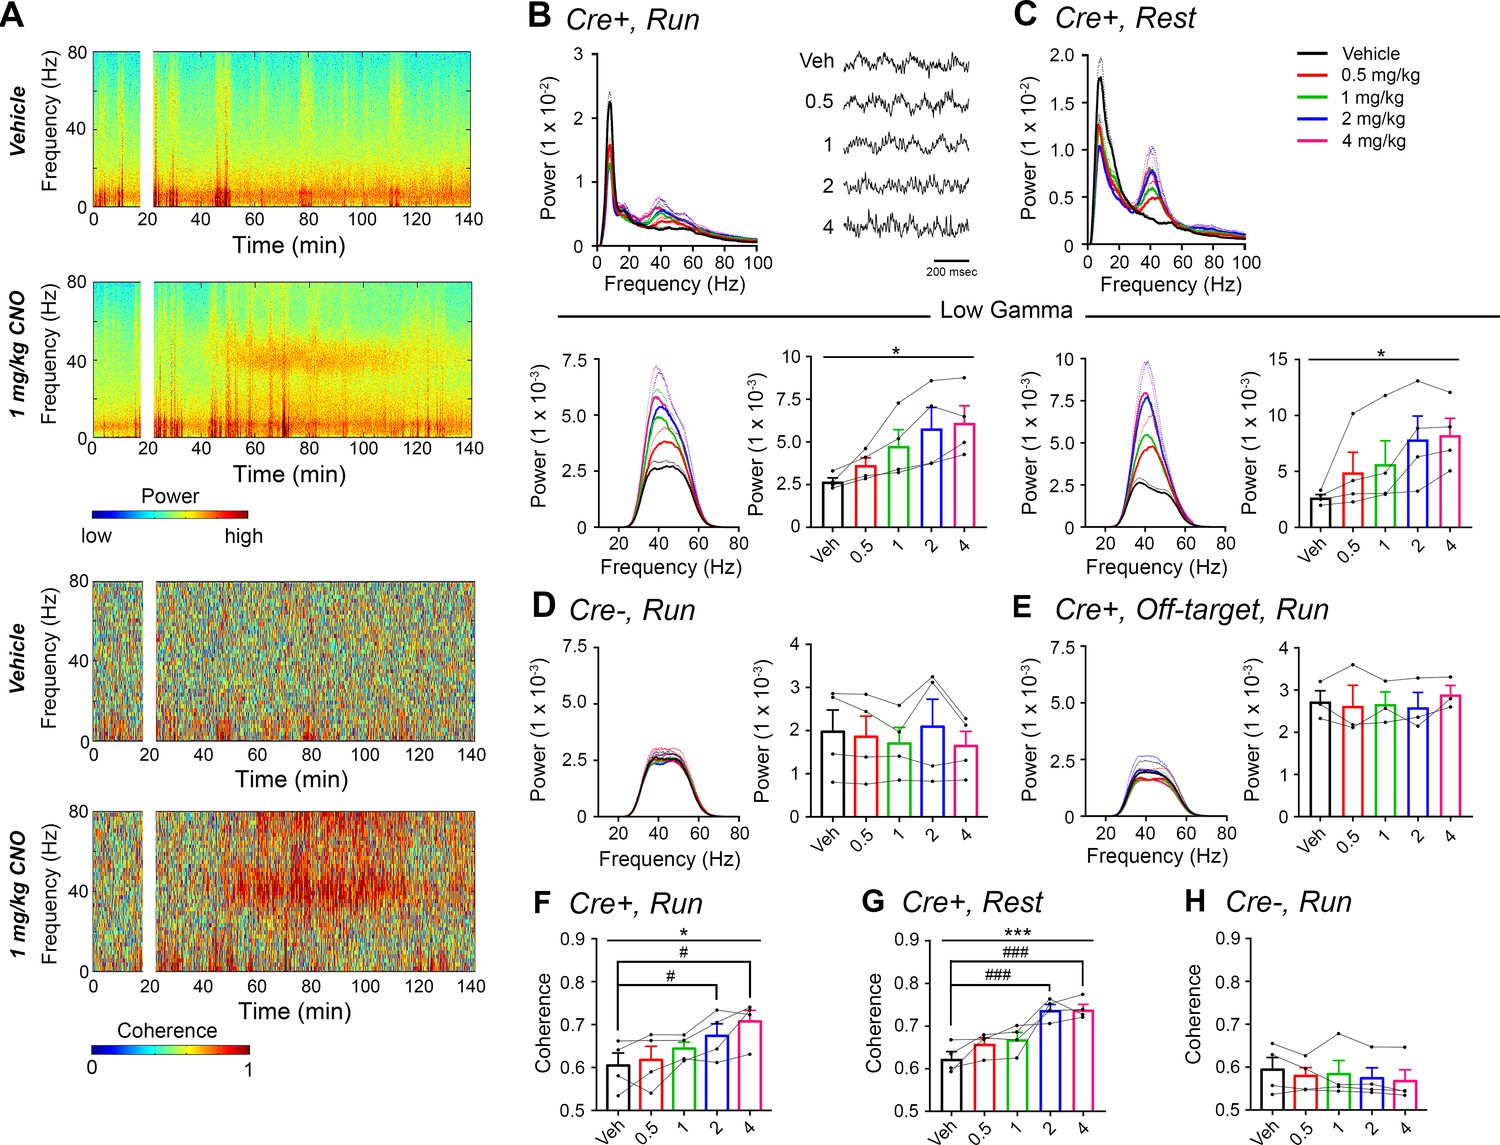
CNO treatment dose-dependently increases low-gamma power in PFC of hM3Dq-infused Amigo2-icreERT2+ mice.
(A) Spectrograms of PFC LFP recordings depicting power (top two panels) and coherograms depicting coherence between PFC and hippocampal LFP recordings (bottom two panels) according to different frequencies over time. Vehicle/CNO (1 mg/kg, SQ) administration time is shown by the white bar, and the treatment is shown to the left of each spectrogram. (B–C) Power measures for PFC LFPs during periods of running (B) and resting (C) for Amigo2-icreERT2+ mice. For each of B and C: Top plots show power spectral densities of LFPs for frequencies up to 100 Hz and bottom plots show power measured from PFC LFPs filtered in the low-gamma (30 – 60 Hz) frequency range for each of run and rest periods. LFP traces in B show example LFPs during periods of running following the listed treatment. CNO treatment significantly increased low-gamma power during both running (N = 4 mice (three male, one female); F(1.177, 3.53) = 9.154, p = 0.0444, repeated-measures one-way ANOVA with Geisser-Greenhouse correction for unequal variance; results of Holm-Sidak post hoc tests not significant) and resting (F(1.561, 4.684) = 7.155), p = 0.0409, repeated-measures one-way ANOVA with Geisser-Greenhouse correction for unequal variance). (D) Mean low-gamma power spectra and peak low-gamma power recorded from PFC for the population of hM3Dq infused Amigo2-icreERT2- mice during periods of running. Low-gamma power did not significantly change in Amigo2-icreERT2- mice upon CNO administration (N = 4 male mice; F(1.349, 4.047) = 1.809, p = 0.2617; repeated-measures one-way ANOVA with Geisser-Greenhouse correction for unequal variance). (E) Mean low-gamma power spectra and peak low-gamma power for recordings from Amigo2-icreERT2+ mice infused with hM3Dq in which recording wires missed the target PFC area. CNO administration produced no significant change in peak low-gamma power from off-target recordings (N = 3 mice (one male, two female); F(1.742, 3.483) = 0.7609, p = 0.5145; repeated-measures one-way ANOVA with Geisser-Greenhouse correction for unequal variance). Each of the animals used for data shown in E showed increased low-gamma power in hippocampus upon CNO administration. (F–G) Mean low-gamma coherence between PFC and hippocampal during periods of run (F) and rest (G) for Amigo2-icreERT2+ mice successfully targeted to PFC. CNO treatment produced a significant increase in low-gamma coherence between hippocampus and PFC during both running (N = 4 mice; F(1.595, 4.786) = 8.279, p = 0.0305; repeated-measures one-way ANOVA with Geisser-Greenhouse correction for unequal variance, results of Holm-Sidak post hoc tests shown by symbols) and resting (F(4, 12) = 11.71, p = 0.0004; repeated-measures one-way ANOVA, results of Holm-Sidak post hoc tests shown by symbols). (H) Amigo2-icreERT2- animals showed no significant change in low-gamma coherence upon CNO administration (N = 4 male mice; F(4, 12) = 1.053, p = 0.4209; repeated-measures one-way ANOVA). All spectral plots show mean spectra for the population of animals with colors representing treatments. Bar graphs show mean peak gamma power (B–E) or mean gamma coherence (F–H) for the population of animals in colored bars according to treatment and data from individual animals in black dots. Dotted lines on spectral plots and error bars on bar graphs represent standard error of the mean. *p < 0.05, ***p < 0.001, one-way ANOVA; #p < 0.05, ### p < 0.001, Holm-Sidak post hoc test. See also Figure 3—figure supplements 1–2.
Figure 3—figure supplement 1

CNO did not affect low-gamma power in PFC of hM3Dq-infused Cre- Amigo2-icreERT2 mice.
(A) Spectrograms of PFC LFP recordings depicting LFP power according to different frequencies over time. CNO/vehicle administration time is shown by the white bar, and the treatment is shown to the left of each spectrogram. (B–C) Mean power spectral density for PFC LFPs during periods of running (B) or resting (C) measured 30 – 60 min following treatment for the population of Cre- Amigo2-icreERT2 mice infused with hM3Dq and treated with vehicle or CNO. Power spectral densities were plotted for LFP frequencies low-pass filtered below 100 Hz.
Figure 3—figure supplement 2
CNO did not affect low-gamma power when PFC-targeted electrodes did not hit PFC in hM3Dq-infused Cre+ Amigo2-icreERT2 mice.
(A) Spectrograms of off-target (striatum, in this example) LFP recordings depicting LFP power according to different frequencies over time. CNO/vehicle administration time is shown by the white bar, and the treatment is shown to the left of each spectrogram. (B–C) Mean power spectral density for off-target LFPs during periods of running (B) or resting (C) measured 30 – 60 min following treatment for the population of Cre+ Amigo2-icreERT2 mice infused with hM3Dq and treated with vehicle or CNO. Power spectral densities were plotted for LFP frequencies low pass filtered below 100 Hz.
Figure 4

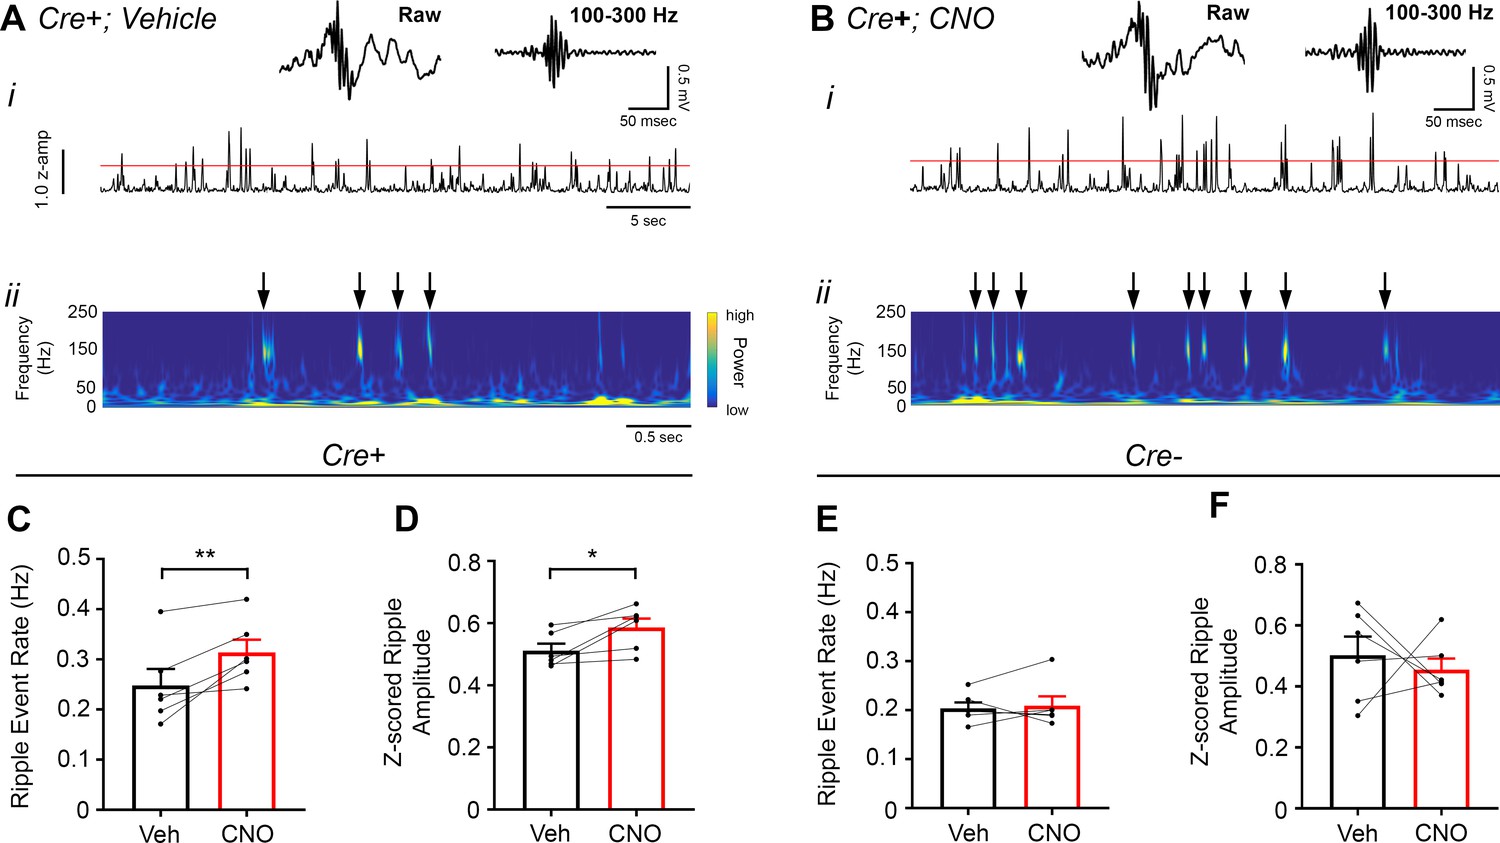
Chemoactivation of CA2 pyramidal cells with hM3Dq decreases high-frequency ripple event rate.
(A–B) Envelopes of ripple-filtered CA1 LFPs (i) recorded during periods of rest following administration of vehicle (A) or CNO (B; 0.5 mg/kg, SQ) and wavelet-filtered spectrograms (ii) of the same LFPs. Cooler colors represent low power and warmer colors represent high power. Arrows denote examples of ripples shown by spectrogram. Raw and filtered LFPs showing example ripples following vehicle or CNO are shown on top. (C–D) Ripple event rate (C) but not amplitude (D) was significantly decreased in hM3Dq-expressing mice following CNO administration compared to that following vehicle administration (Ripple event rate: N = 8 mice (five male, three female); t(7) = 4.574, p = 0.0026; two-tailed paired t-test; Amplitude: t(7) = 0.3004, p = 0.7726, two-tailed paired t-test). (E–F) Ripple event rate and amplitude were not significantly changed in Amigo2-icreERT2- hM3Dq-infused mice (Ripple event rate: N = 4 male mice, t(3) = 1.871, p = 0.1581, two-tailed paired t-test; Amplitude: N = 4 male mice, t(3) = 0.3193, p = 0.7704, two-tailed paired t-test). **p < 0.01.
Figure 5 with 5 supplements
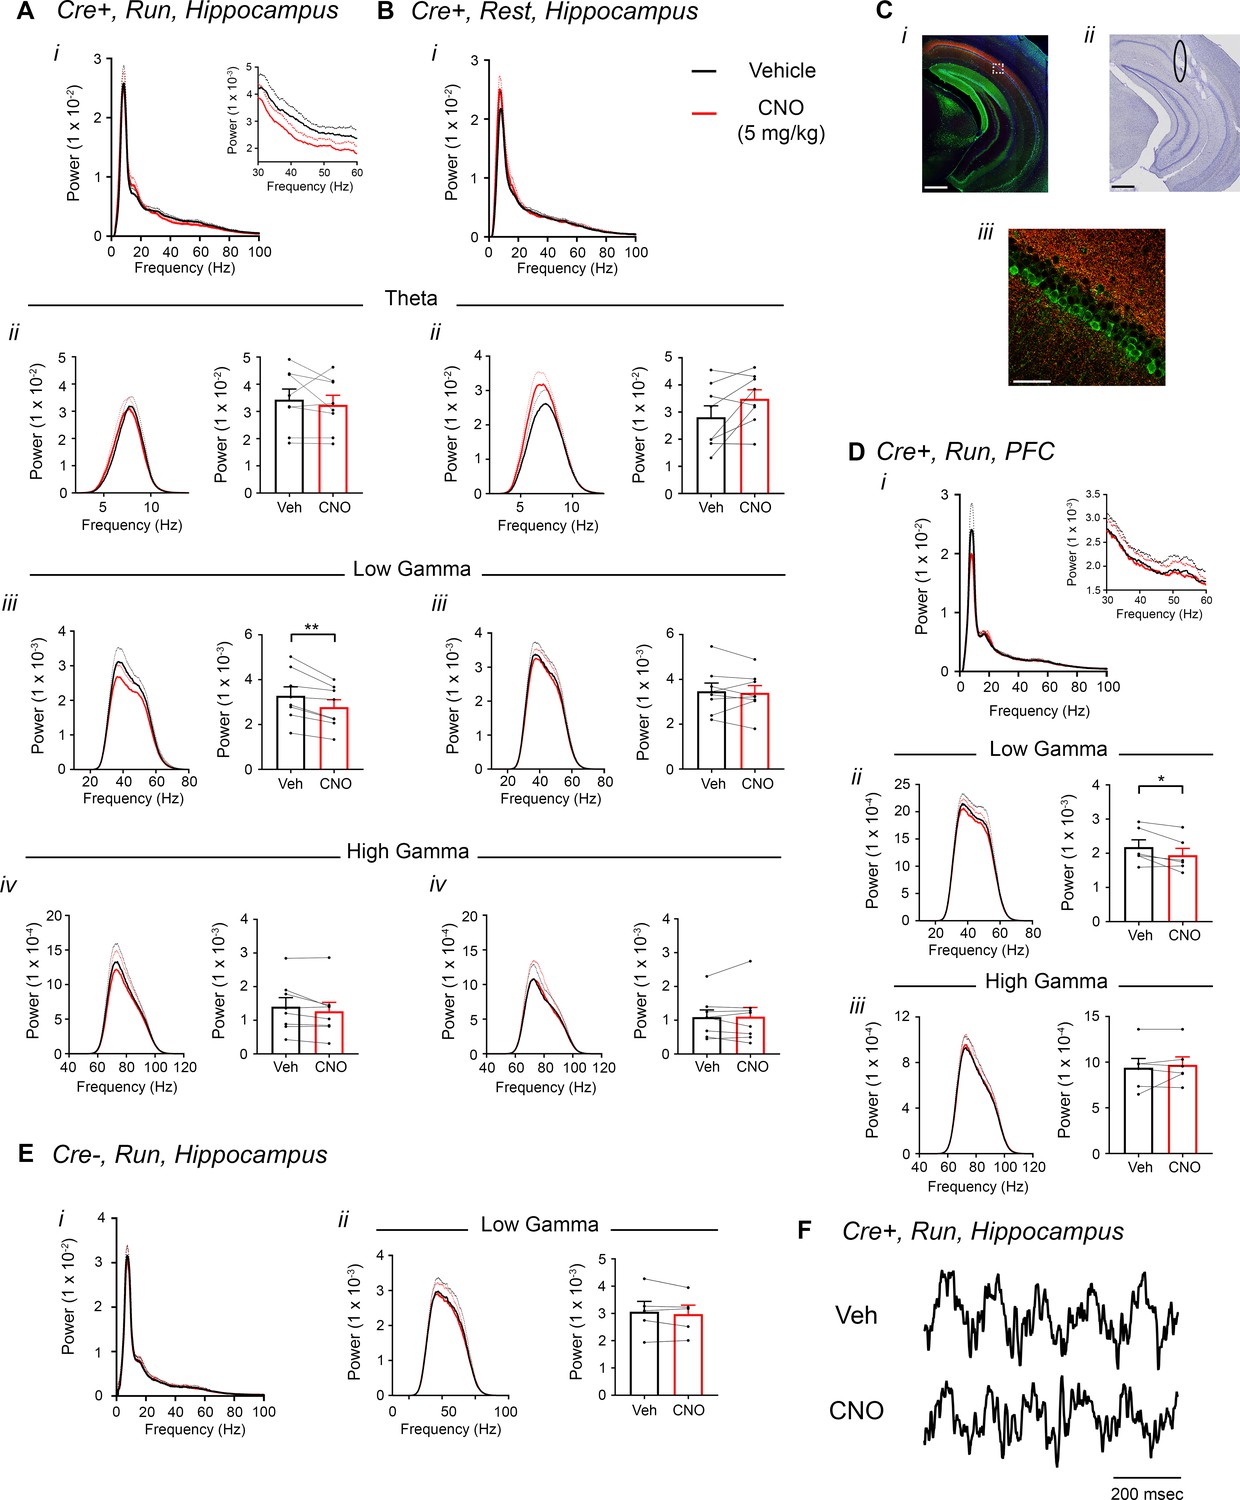
Inhibition of CA2 pyramidal cells with hM4Di decreases hippocampal and PFC low-gamma power.
(A–B) Hippocampal LFP power measures from Amigo2-icreERT2+ mice infused with hM4Di AAV and treated with vehicle or CNO (5 mg/kg, SQ; LFP samples 30 – 60 min following treatment) during periods of running (A) and resting (B). For each of A and B: (i) Power spectral density plots from raw LFPs for frequencies up to 100 Hz. Inset plot in Ai is expanded from Ai. (ii-iv) Power spectral density plots and peak power measured in the theta (5 – 10 Hz; ii), low-gamma (30 – 60 Hz; iii) or high-gamma (65 – 100 Hz; iv) frequency ranges. In Aii-iv and Bii-iv, plots on the left show power spectral density for the listed frequency bands, and plots on the right show mean peak power for the population of animals in colored bars according to treatment and dots representing data from individual animals. (Aiii) CNO administration produced a significant decrease in hippocampal low-gamma power during running (N = 8 mice (four female, four male); t(7) = 4.408, p = 0.0031, two-tailed paired t-test). CNO treatment did not affect theta power during running (t(7) = 0.7786, p = 0.4617; Aii), high-gamma power during running (t(7) = 2.029, p = 0.0821; Aiv), theta power during rest (t(7) = 2.214, p = 0.0625; Bii), low-gamma power during rest (t(7) = 0.4522, p = 0.6648; Biii) or high-gamma power during rest (t(7) = 0.172, p = 0.8683; Biv). (C) Expression of mCherry-tagged hM4Di in intermediate CA1 and electrode tracks at a similar position. (Ci) Expression of mCherry-tagged hM4Di (red) and calbindin (green, a marker for superficial CA1 neurons (Kohara et al., 2014) in an intermediate hippocampal section. The white box shows the area that is expanded in Ciii. Axons expressing hM4Di target intermediate CA1, with preferential targeting toward stratum oriens. (Cii) Electrode tracks of intermediate CA1 recording wires (black ellipse surrounds one of the tracks). (D) PFC LFP power measures from same mice used in A-B. (i) Power spectral density plots from raw LFPs for frequencies up to 100 Hz. Inset plot is expanded from the adjacent plot. (ii-iii) Power spectral density plot and peak power measured from low-gamma (ii) and high-gamma (iii) filtered LFPs. CNO administration produced a significant decrease in PFC low-gamma power during running (N = 6 mice (three female, three male); t(5) = 2.948, p = 0.0320, two-tailed paired t-test) but did not affect PFC high-gamma power (t(5) = 0.738, p = 0.4937. (E) Power spectral density plot for the population of Amigo2-icreERT2- mice infused with hM3Di, treated with tamoxifen and challenged with CNO. Plots show spectral density of frequencies below 100 Hz (i), low-gamma-filtered LFP spectral power and peak low-gamma power for the population of animals (ii). CNO administration did not significantly affect low-gamma power in Amigo2-icreERT2- mice during running (N = 5 male mice; t(4) = 1.079, p = 0.3413; two-tailed paired t-test). (F) Example LFP traces from periods of running following vehicle or CNO treatment. Both recordings are taken from the same recording site in the same animal. *p < 0.05, **p < 0.01. Scale bars = 500 um (Ci, ii) and 75 um (Ciii). See also Figure 5—figure supplements 1–5.
Figure 5—figure supplement 1
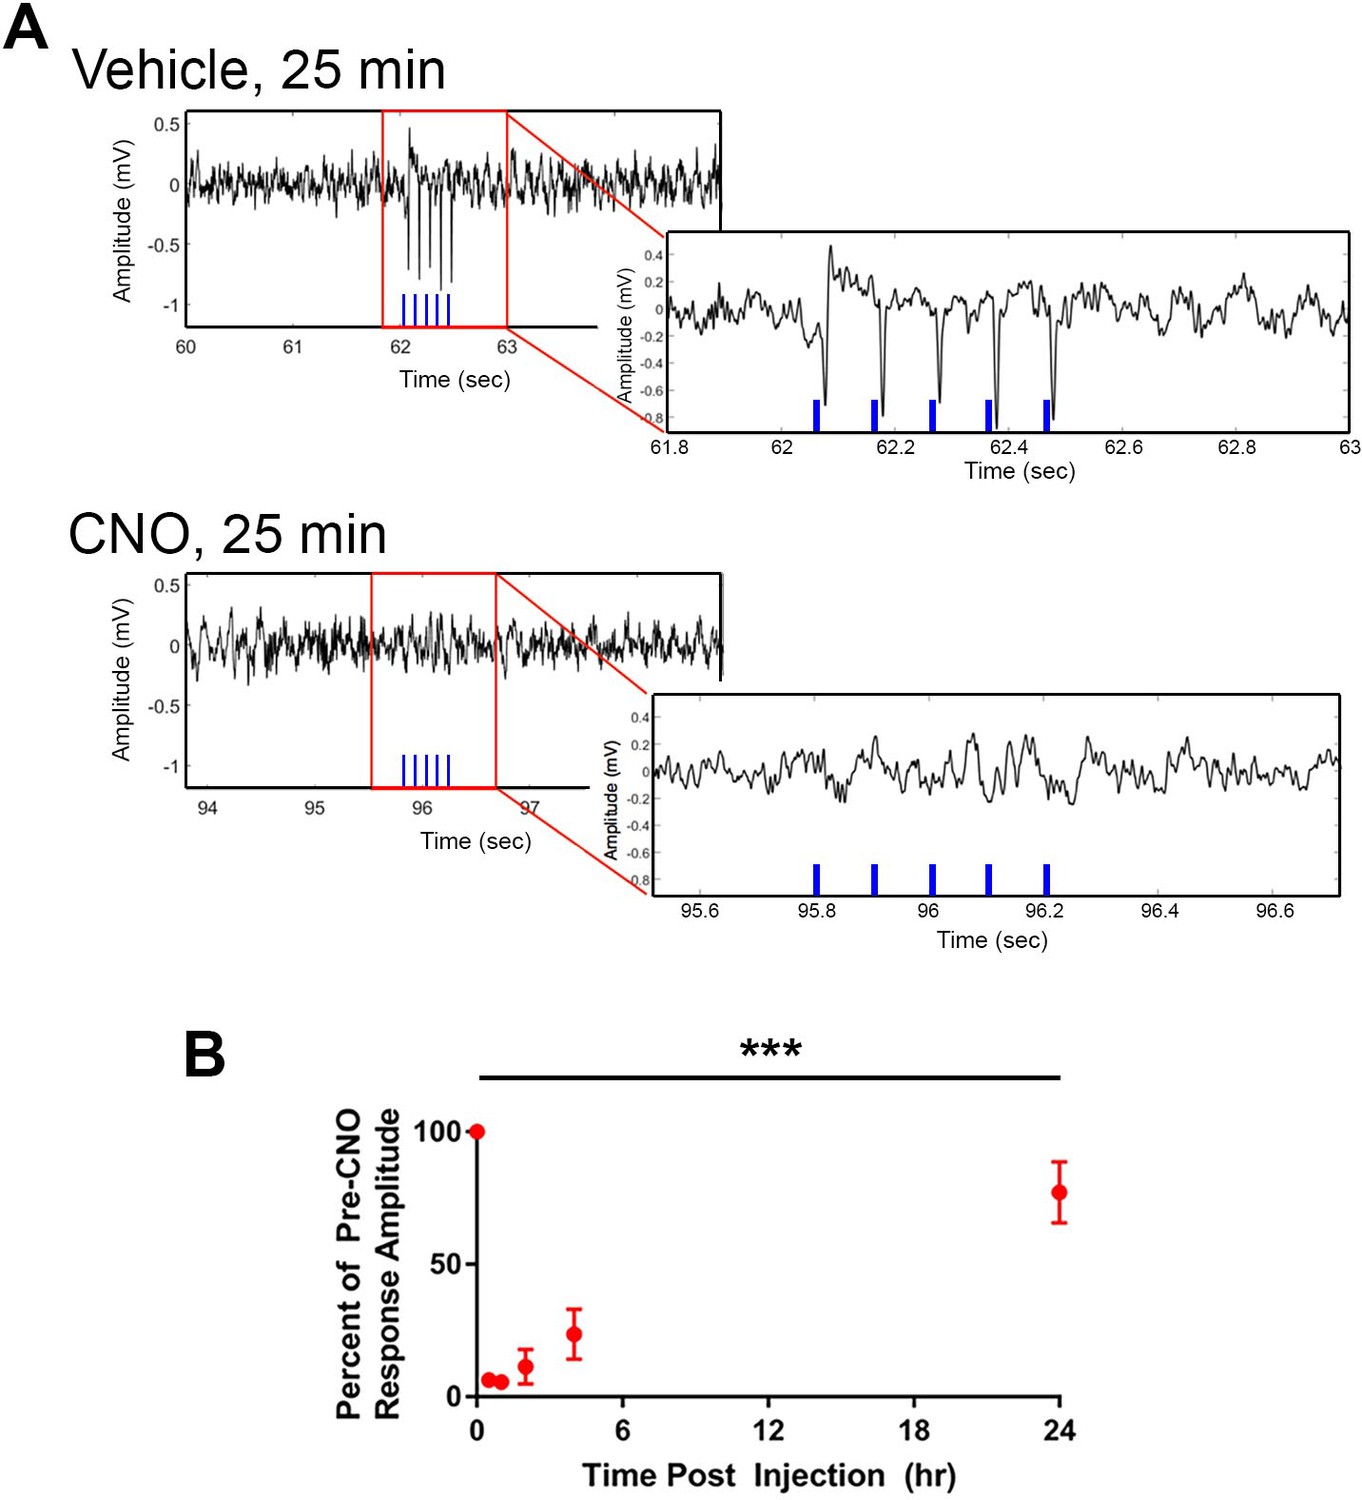
Optogenetic activation of CA2 neurons evokes responses in intermediate CA1, which are blocked by hM4Di.
Cre+ Amigo2-icreERT2 mice were co-infused with hM4Di and ChR2 AAVs in the left dorsal hippocampus and implanted with fiber optic probes in dorsal CA2 and electrodes in intermediate CA1. Trains of 5 5-ms light pulses were delivered while recording LFPs from CA1 before and after vehicle or CNO administration (5 mg/kg CNO, SQ). (A) Example LFP recordings and fiber optic stimulation-evoked responses following vehicle or CNO. Red boxes surrounding portions of the LFPs are expanded in LFPs shown to the lower right. The blue vertical lines on each LFP trace represent the times of light stimulation. Vehicle administration did not alter light-evoked response amplitudes, whereas CNO abolished light-evoked responses. (B) Mean light-evoked response amplitudes at various timepoints following CNO administration. The zero timepoint represents the pre-CNO response amplitude. Response amplitudes were significantly reduced by CNO (N = 2 mice; F(5,5) = 35.22, p = 0.0007, one-way ANOVA followed by Holm-Sidak post hoc tests). Response amplitudes were significantly reduced to 6.3 ± 0.38% (p = 0.0010), 5.6 ± 0.67% (p = 0.0010), 11.3 ± 6.6% (p = 0.0010) and 23.5 ± 9.5% (p = 0.0011) of pre-CNO response amplitude at 25 min, 60 min, 2 hr and 4 hr, respectively. By 24 hr following CNO administration, response amplitude recovered to 77.20 ± 11.58% (p = 0.0663) of pre-CNO response amplitude. ***p < 0.001, results of post hoc tests not shown on plot.
Figure 5—figure supplement 2

Electrode localization for Cre+ and Cre- Amigo2-icreERT2 mice infused with hM4Di AAV and implanted with electrodes into hippocampus and PFC.
(A) Eight Cre+ and 6 Cre- animals were implanted with electrodes in hippocampus. In six of eight Cre+ hippocampal implanted animals, electrodes were also implanted in prefrontal cortex. All brain sections are Nissl stained. In B, atlas images from the coronal plane approximately equivalent to that of the Nissl stained sections are shown. The three Nissl stained sections on each of the left and right sides of the vertical divide correspond to the atlas image in the bottle right quadrant of each side. The area bounded by each dotted rectangle is enlarged to the left. All scale bars represent 50 μm. Atlas images modified from Allen Mouse Brain Atlas (Image credit: Allen Institute) (Lein et al., 2007).
Figure 5—figure supplement 3
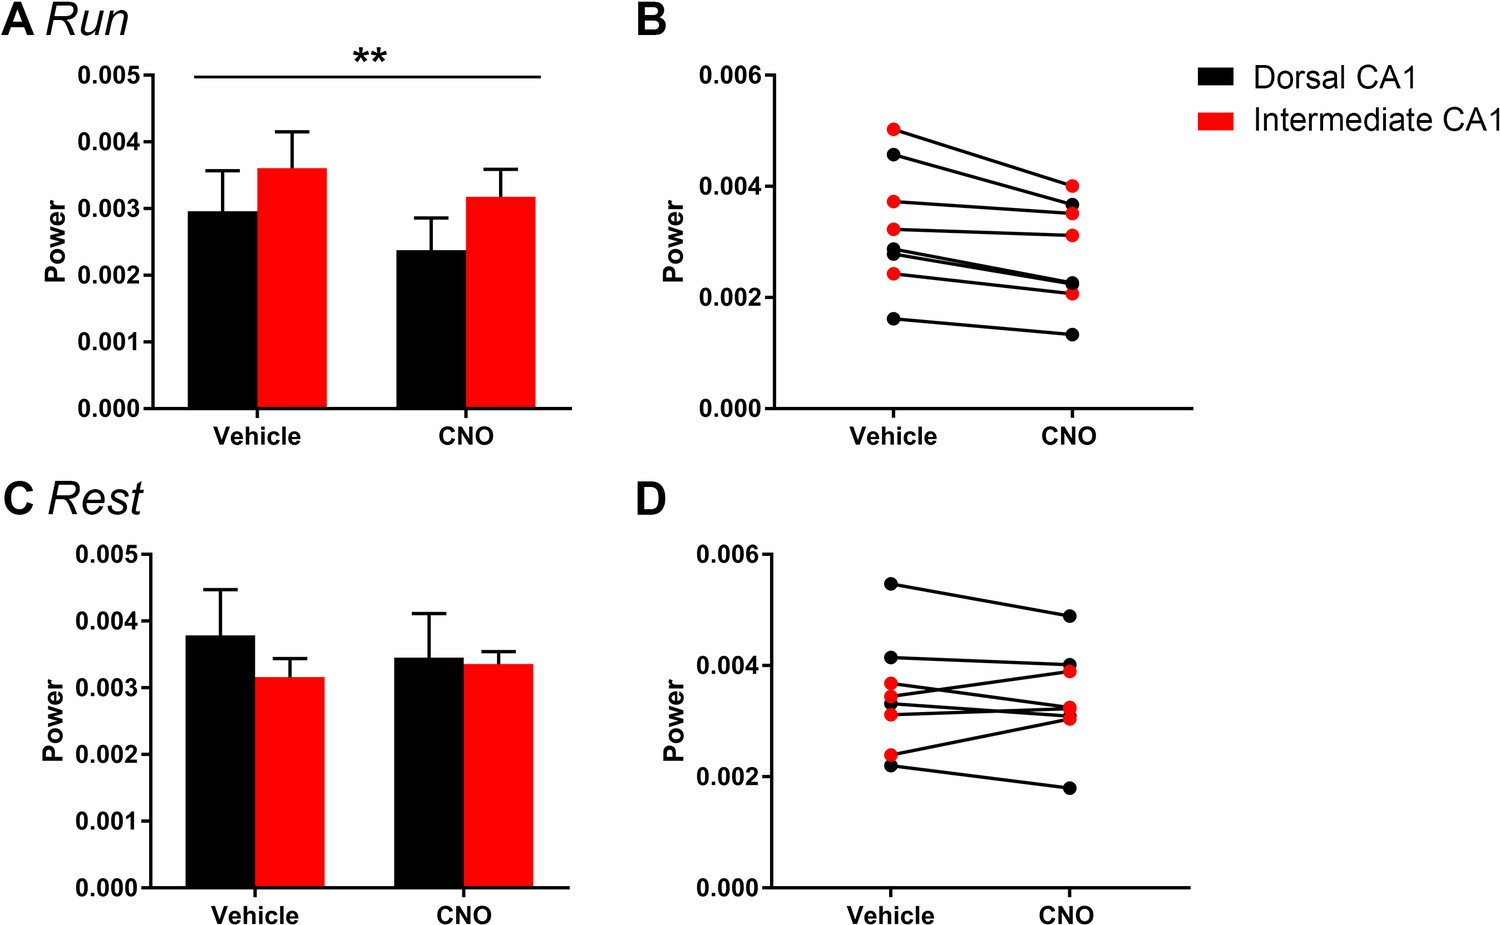
The magnitude of hM4Di-mediated change in low-gamma power did not vary significantly as a function of dorsal or intermediate recording location for periods of running (A–B) of rest (C–D).
Animals were divided into groups according to the recording location in dorsal CA1 (N = 4) and intermediate CA1 (N = 4). A and C show population means and SEM, and B and D show individual animal data. We found no significant difference in the magnitude of low-gamma power change between recordings from dorsal and intermediate CA1. We found a main effect of drug treatment during periods of running (F(1, 6) = 17.84, p = 0.0055) but no main effect of recording location and no interaction effect (main effect of location: F(1, 6) = 1.002, p = 0.3555; interaction: F(1, 6) = 0.428, p = 0.5372). During periods of rest, we found no significant effect of recording location, drug treatment or an interaction (main effect of location: F(1, 6) = 0.2614, p = 0.6274; main effect of treatment: F(1, 6) = 0.3002, p = 0.6035; interaction: F(1, 6) = 4.278, p = 0.0841). **p < 0.01.
Figure 5—figure supplement 4
Comodulation of low-gamma amplitude and theta phase in hM3Di mice with vehicle or CNO treatment.
(A), In Cre+ hM4Di mice, theta phase at which low-gamma amplitude was greatest was not significantly affected by CNO but modulation index was significantly decreased with CNO treatment (N = 8, phase: t(7) = 1.000, p = 0.3506, two-tailed paired t-test; modulation index: W = -32, p = 0.0234, Wilcoxon signed-ranked test). (B), In Cre- hM4Di mice, neither theta phase nor modulation index was significantly affected by CNO treatment (N = 5, phase: t(4) = 1.206, p = 0.2943, two-tailed paired t-test; modulation index: t(4) = 0.206, p = 0.8469, two-tailed paired t-test).
Figure 5—figure supplement 5
Change in gamma power by hM4Di is selective for low gamma and does not significantly affect high-gamma during running.
(A), For periods of running, Cre+ hM4Di mice showed a main effect of treatment (F(1, 7) = 18.38, p = 0.0036), a main effect of gamma range (F(1,7) = 14.57, p = 0.0066) and a significant interaction between treatment and gamma range (F(1, 7) = 10.64, p = 0.0138). Follow-up post hoc tests revealed a significant decrease in low-gamma power with CNO treatment (p = 0.0008, Bonferroni’s multiple comparison test) but no significant change in high-gamma power (p = 0.2703, Bonferroni’s multiple comparison test). (B), For periods of rest, we found a significant main effect of gamma range (F(1,7) = 41.65, p = 0.0003) but no main effect of treatment (F(1, 7) = 0.1067, p = 0.7535) and no interaction between gamma range and treatment (F(1, 7) = 41.65, p = 0.6433). (C-D), Among Cre- animals, for the hM4Di group, during periods of running, we found a significant main effect of gamma range (F(1, 4) = 59.1, p = 0.0015) but no main effect of treatment (F(1, 4) = 0.486, p = 0.5241) and no interaction (F(1, 4) = 2.288, p = 0.2049). Similarly, during periods of rest, we found a main effect of gamma range (F(1, 4) = 80.85, p = 0.0008) but no effect of treatment (F(1, 4) = 0.003743, p = 0.9542) and no interaction (F(1, 4) = 0.9938, p = 0.3752).
Figure 6
Inhibition of CA2 pyramidal cells with hM4Di increases high-frequency ripple event rate and amplitude.
(A–B) Envelopes of ripple-filtered CA1 LFPs (i) recorded during periods of rest following administration of vehicle (A) or CNO (B; 5 mg/kg, SQ) and wavelet-filtered spectrograms (ii) of the same LFPs. Cooler colors represent low power and warmer colors represent high power. Arrows denote examples of ripples shown by spectrogram. Raw and filtered LFPs of example ripples following vehicle or CNO are shown on top. (C–D) Ripple event rate (C) and amplitude (D) were significantly increased in hM4Di-expressing mice following CNO treatment compared to that following vehicle treatment (Ripple event rate: N = 6 mice (three male, three female); t(5) 3.809, p = 0.0063; two-tailed paired t-test; Amplitude: N = 6; t(5) = 3.069, p = 0.0278, two-tailed paired t-test). (E–F) Ripple event rate and amplitude were not significantly changed in Amigo2-icreERT2- hM4Di-infused mice (Ripple event rate: N = 6 male mice; W = 5, p = 0.6875, Wilcoxon signed-ranked test; Amplitude: t(5) = 0.5165, p = 0.6275, two-tailed paired t-test). *p < 0.05, **p < 0.01.cortical network. Further, these findings support a negative regulatory role of CA2 in hippocampal sharp-wave ripples.
Author response image 1
Author response image 2
Author response image 3
Author response image 4
Tables
Key resources table
| Reagent type (species) or resource | Designation | Source or reference | Identifiers | Additional Information |
|---|---|---|---|---|
| Genetic reagent (Mus musculus) | Amigo2-icreERT2 | NIEHS | B6(SJL)-Tg(Amigo2-icre/ERT2)1Ehs) | |
| Genetic reagent (M. musculus) | B6(SJL)-Tg(Amigo2-icre/ERT2)2Ehs) | NIEHS | B6(SJL)-Tg(Amigo2-icre/ERT2)2Ehs) | |
| Genetic reagent (M. musculus) | ROSA-tdTomato | Jax | B6.129S6-Gt(ROSA)26Sor<tm9(CAG-td Tomato) Hze>/J | RRID: Jax 007909 |
| Genetic reagent (M. musculus) | GAD-eGFP | Riken | ICR.Cg-Gad1<tm1.1Tama> | RRID: RBRC03674 |
| AAV | hM3Dq AAV | University of North Carolina-Chapel Hill Viral Vector Core | AAV-hSyn-DIO-hM3D(Gq)-mCherry | Serotype AAV5 |
| AAV | hM4Di AAV | University of North Carolina-Chapel Hill Viral Vector Core | AAV-hSyn-DIO-hM4D(Gi)-mCherry | Serotype AAV5 |
| AAV | ChR2 AAV | University of North Carolina-Chapel Hill Viral Vector Core | AAV-EF1a-DIO-hChR2(H134R)-EYFP | Serotype AAV5 |
| Antibody | rabbit anti-PCP4 | SCBT | Cat # sc-74186 | IHC, 1:500 |
| Antibody | rabbit anti-CaMKII alpha | Abcam | Cat # ab131468 | IHC, 1:250 |
| Antibody | rat anti-mCherry | Life Technologies | Cat# M11217 | IHC, 1:500- 1:1000 |
| Antibody | mouse anti-calbindin | Swant | Cat# D-28k | IHC, 1:500 |
Additional files
-
Supplementary file 1
- https://doi.org/10.7554/eLife.38052.025
-
Transparent reporting form
- https://doi.org/10.7554/eLife.38052.026
Download links
A two-part list of links to download the article, or parts of the article, in various formats.
Downloads (link to download the article as PDF)
Open citations (links to open the citations from this article in various online reference manager services)
Cite this article (links to download the citations from this article in formats compatible with various reference manager tools)
CA2 neuronal activity controls hippocampal low gamma and ripple oscillations
eLife 7:e38052.
https://doi.org/10.7554/eLife.38052


