Mechanical force regulates tendon extracellular matrix organization and tenocyte morphogenesis through TGFbeta signaling
- University of California, Irvine, United States
- Massachusetts General Hospital, Harvard Stem Cell Institute, United States
Figures
Figure 1 with 4 supplements
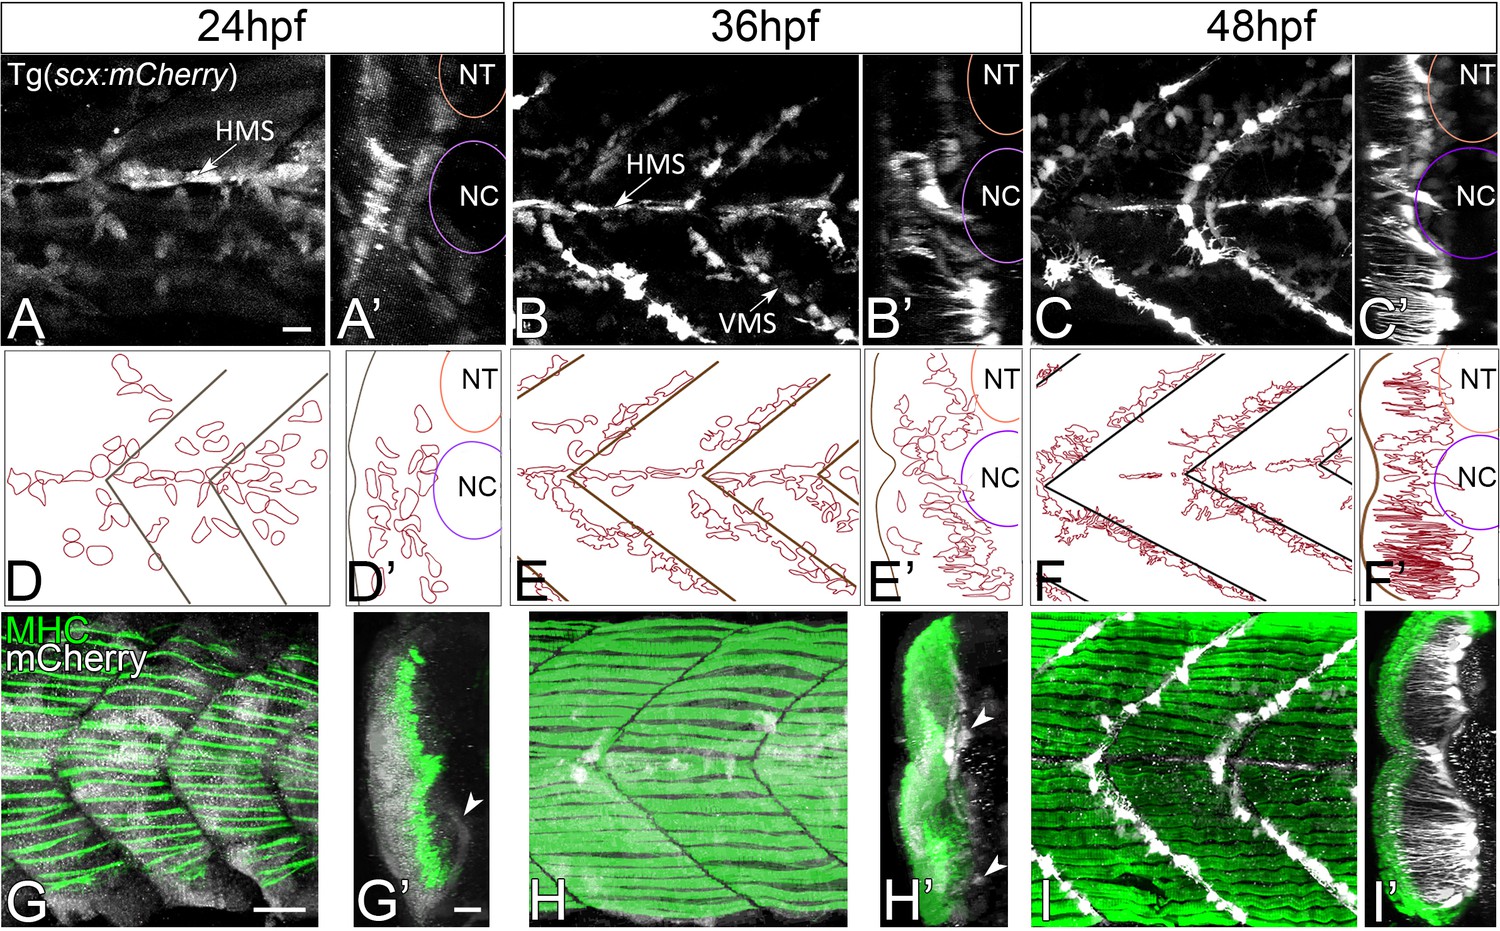
Axial tenocyte morphogenesis.
(A–C) Lateral views of live Tg(scx:mCherry) embryos showing developing tenocytes (A - 24 hpf, B - 36 hpf, C - 48 hpf). (A’–C’) Transverse views from 3D projections showing the positions of developing tenocytes in relation to the notochord (NC) and neural tube (NT) along the horizontal (HMS) and vertical myosepta (VMS) (arrows). Tenocytes form projections at 36–48 hpf (B’ and C’). (D–F) Diagrams of lateral views showing the morphology of tenocytes in the developing somites. (D’–F’) Diagrams of transverse views from 3D projections of live Tg(scx:mCherry) embryos show the development of tenocyte projections (E’ and F’). (G–I) Lateral views of co-immunostained Tg(scx:mCherry) embryos showing developing tenocytes (anti-mCherry - white) and muscle fibers (anti-MHC - green) (G – 24 hpf, H – 36 hpf, I – 48 hpf). (G’–I’) Transverse views from 3D projections of live Tg(scx:mCherry) embryos showing the positions of developing tenocytes (arrowheads in G’ and H’) in relation to the myotome. Scale bars = 20 microns.
Figure 1—figure supplement 1
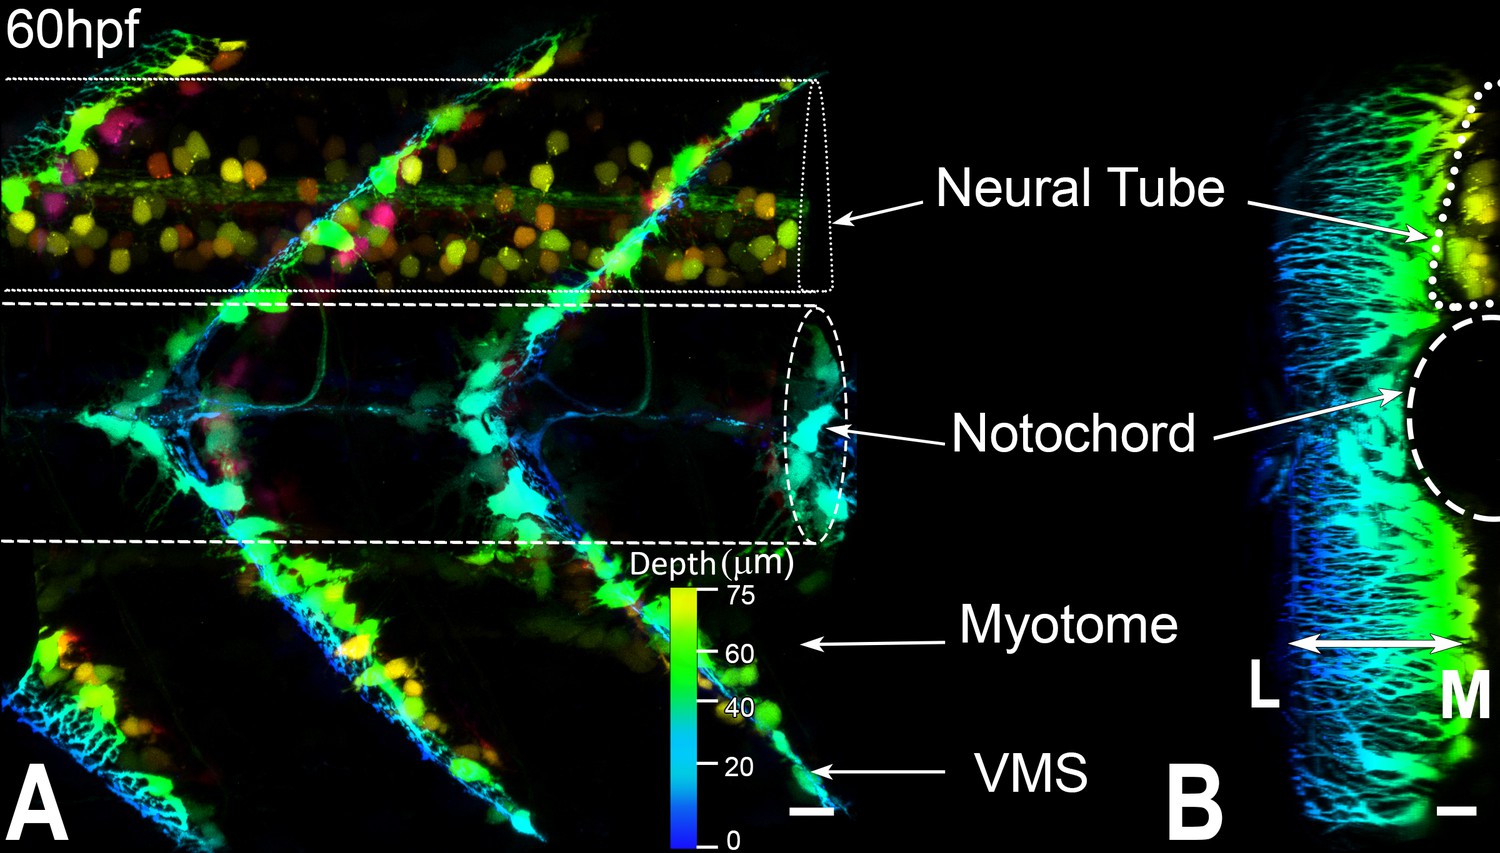
Axial tenocytes form polarized projections orthogonal to muscle fibers.
(A) Lateral and (B) transverse views of live 60 hpf Tg(scx:mCherry) embryos showing tenocytes, which are pseudocolored to highlight the depth of the 3D reconstructed image. Transgene expression is also observed in neuronal cell bodies in the neural tube. Scale bars = 10 microns.
Figure 1—figure supplement 2
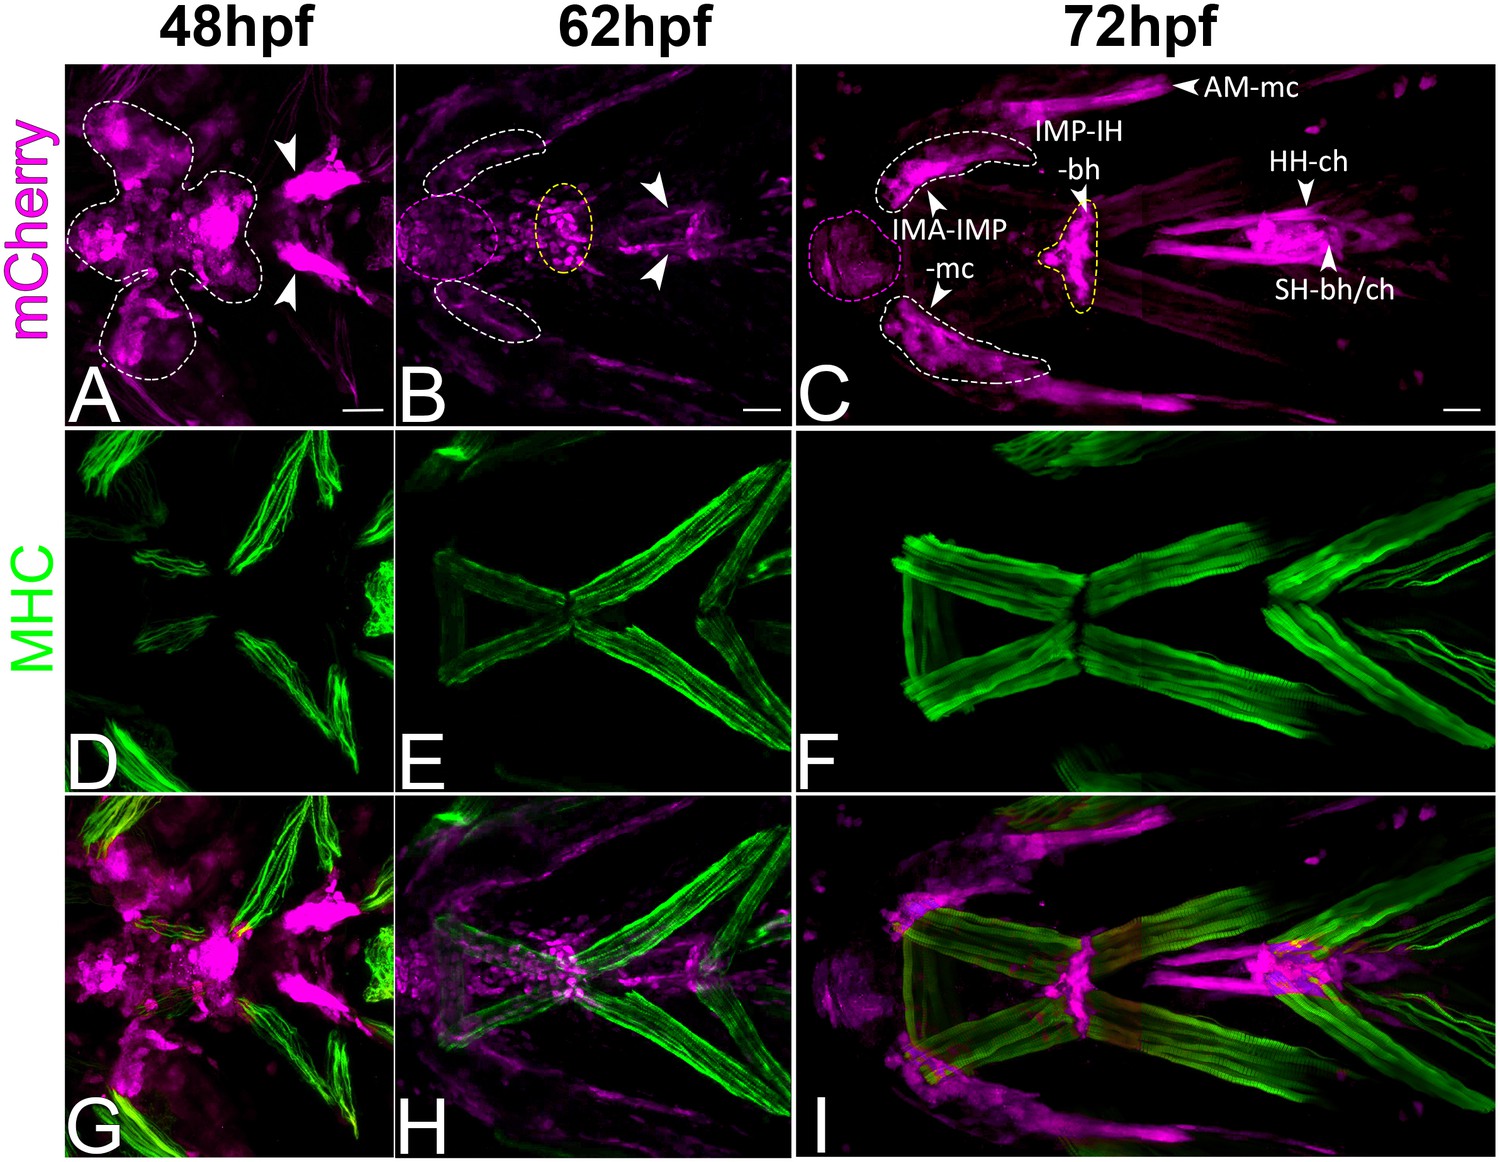
Cranial tenocyte morphogenesis correlates with onset of muscle contraction.
Co-immunostained Tg(scx:mCherry) embryos (anti-mCherry – red; anti-MHC – green) showing temporal changes in tenocyte morphogenesis in relation to developing muscles. (A, D, G – 48 hpf; B, E, H – 62 hpf; C, F, I, – 72 hpf). Ventral views of Tg(scx:mCherry) embryonic heads. Abbreviations: IMA – intermandibularis anterior, IMP – intermandibularis posterior, IH – interhyal, AM – adductor mandibulae, HH – hyohyal, SH – sternohyoideus, mc – Meckels cartilage, bh – basihyal, ch – ceratohyal. Scale bar = 20 microns.
Figure 1–video 1
Axial tenocyte progenitors align along HMS and VMS following muscle fiber differentiation.
Time-lapse video of a developing Tg(scx:mCherry) embryo between 20 and 36 hpf at 15 min intervals. Tenocyte progenitors express scx:mCherry at 24 hpf, when muscle fibers have already formed initial attachments at the VMS. A transverse view shows migration of tenocyte progenitors to a medial position (HMS) around the notochord (NC) and along the VMS.
Figure 1–video 2
Tenocyte projections are dynamic.
A time-lapse video of a developing Tg(scx:mCherry) embryo between 48 and 60 hpf at 15 min intervals shows activity of tenocyte projections along VMS and HMS.
Figure 2 with 3 supplements
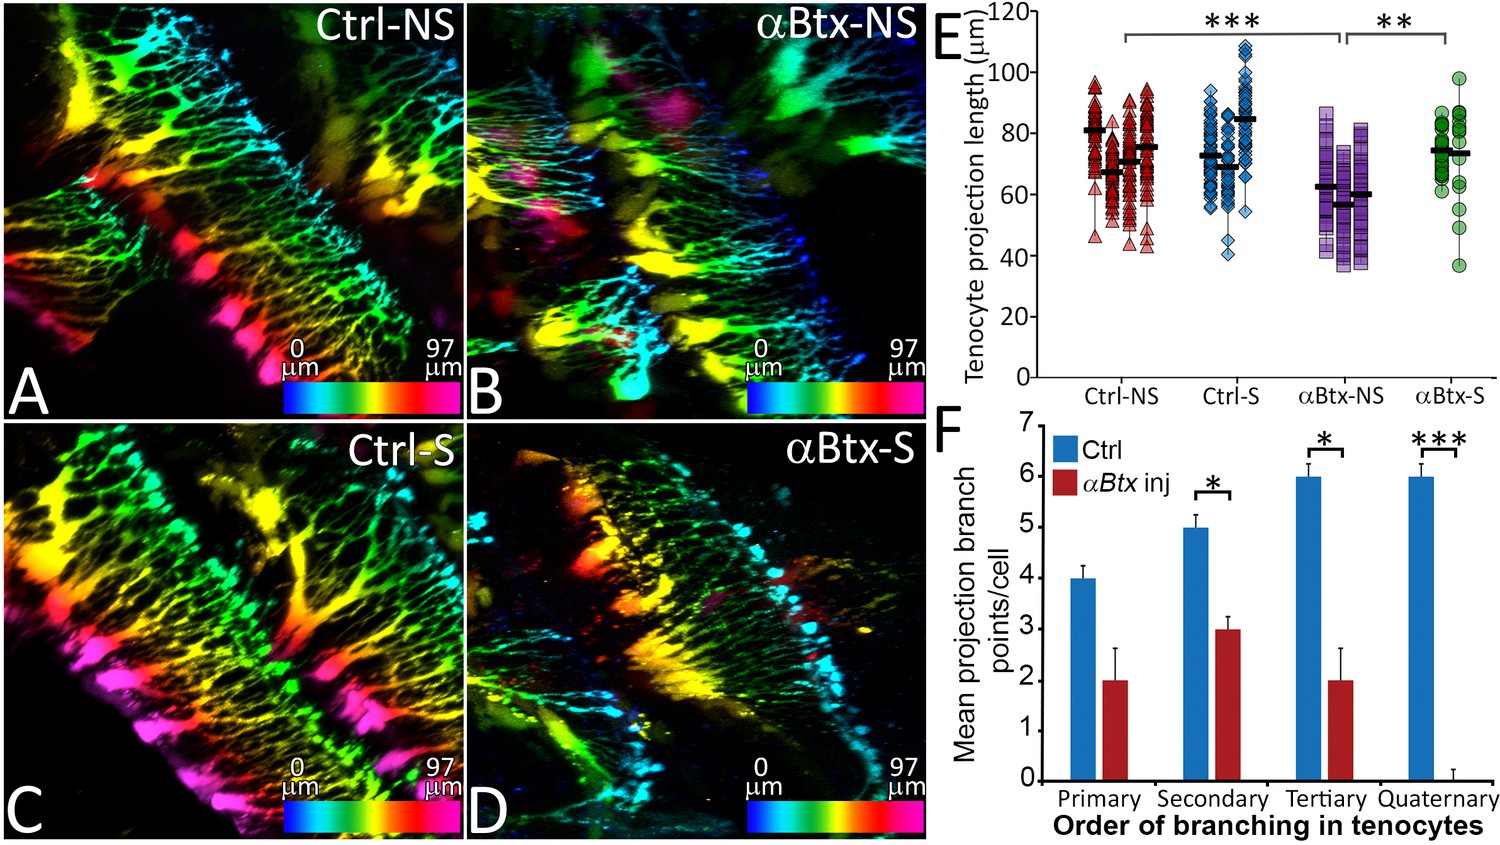
Tenocyte projection length and branching density is regulated by mechanical force.
Lateral views of live Tg(scx:mCherry) embryos (48 hpf) showing tenocyte projections. Images are pseudocolored by depth from medial (red) to lateral (blue). Control embryos were imaged without stimulation (A) and after stimulation (B), and the length of tenocyte projections was compared with embryos injected with αBtx and imaged without (C) and with stimulation (D). Dot plot shows individual data points of tenocyte projection length under different conditions (E). The data points from each embryo are connected by a vertical line. NS – Not Stimulated, S – Stimulated. (n > 50 data points/embryo in three embryos/sample, p value was determined through ANOVA 1-way analysis ***<0.00001, **<0.0001). Histogram shows quantification of branch points along tenocyte projections per tenocyte in 36 hpf control and αBtx injected embryos for every level of branching (1o – primary, 2o – secondary, 3o – tertiary, 4o – quaternary). (n = 4, p value was determined through ttest *<0.01, ***<0.00001). The measurements used for quantitative analysis and creation of the plots can be accessed from Figure 2—source data 1 and Figure 2—source data 2.
-
Figure 2—source data 1
Measurements of tenocyte projection length along VMS.
- https://doi.org/10.7554/eLife.38069.014
-
Figure 2—source data 2
Measurement of tenocyte projection branching complexity along VMS.
- https://doi.org/10.7554/eLife.38069.015
Figure 2—figure supplement 1
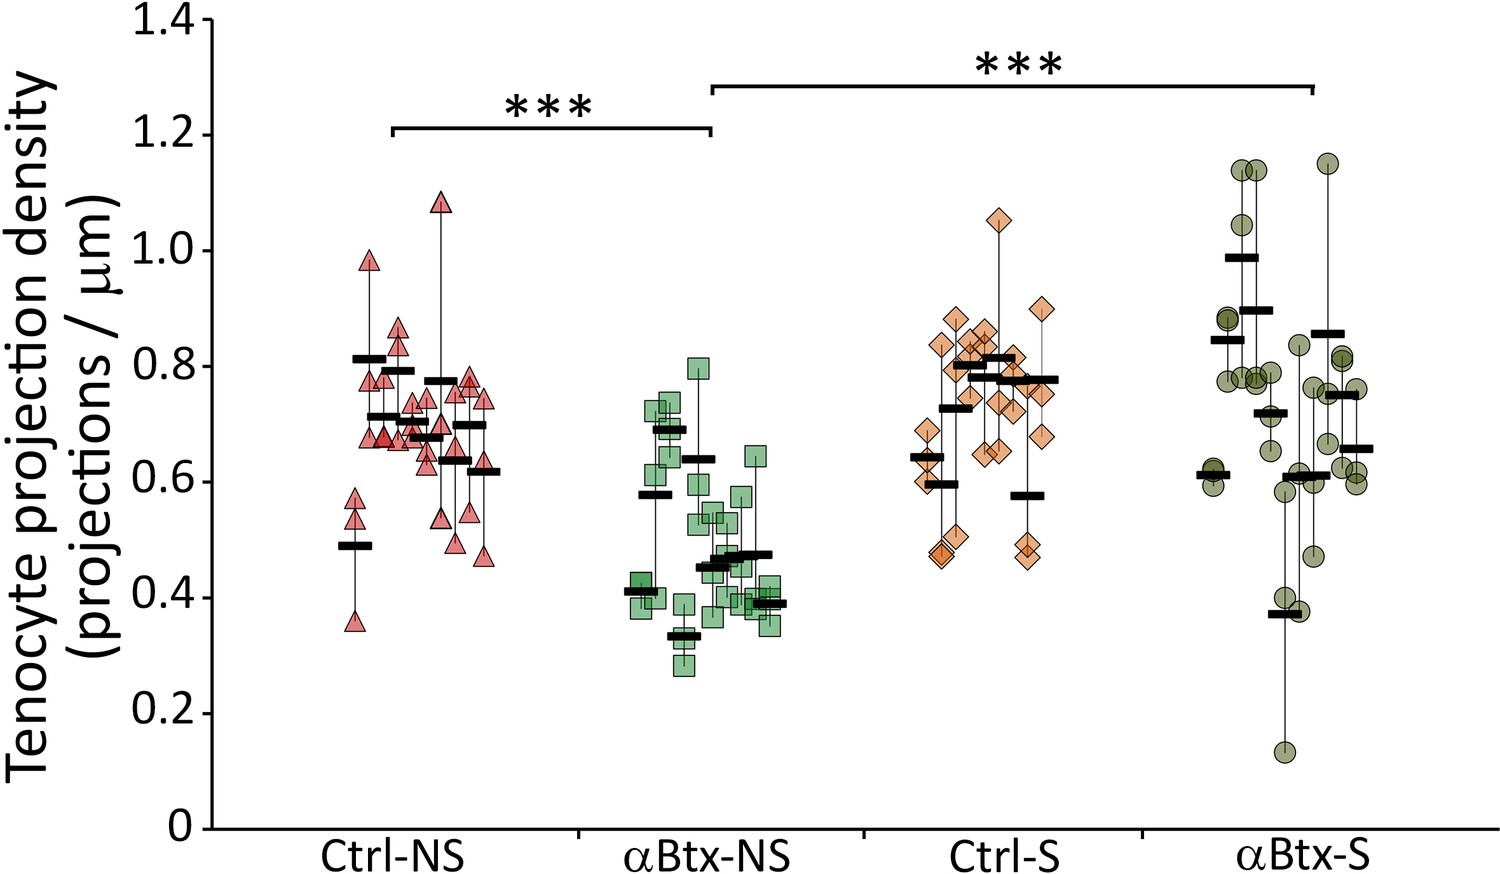
Density of tenocyte projections is regulated by mechanical force.
Dot plot shows individual data points of tenocyte projection density at the ventral VMS in embryos injected with αBtx and imaged without and with stimulation. The data points from three VMSs in each embryo are connected by a vertical line. NS – Not Stimulated, S – Stimulated. (n ~ 10 embryos/sample, p value was determined through ANOVA 1-way analysis and Tukey test ***<0.00001). The measurements used for quantitative analysis and creation of the plots can be accessed from Figure 2—figure supplement 1—source data 1.
-
Figure 2—figure supplement 1—source data 1
Measurements of projection density along VMS.
- https://doi.org/10.7554/eLife.38069.010
Figure 2—figure supplement 2
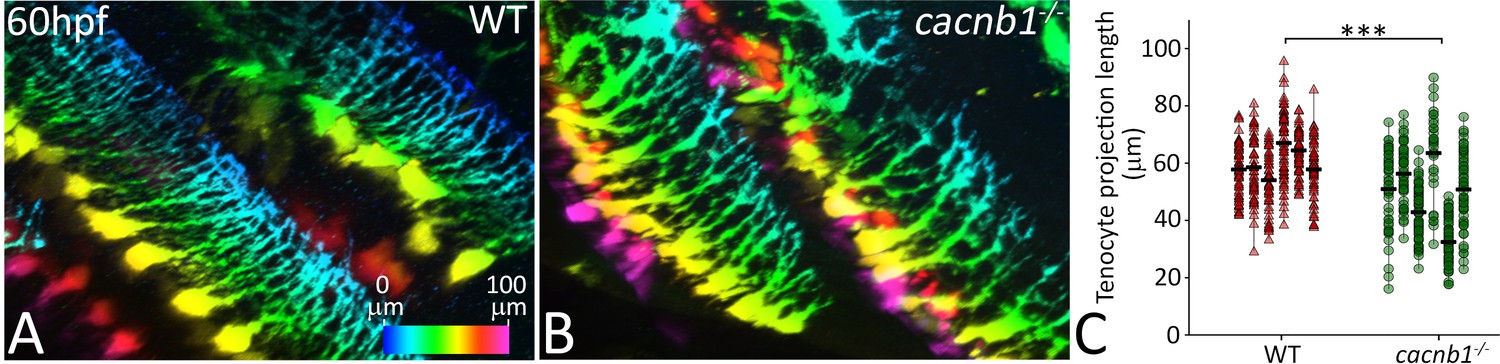
cacnb1 mutants show reduced length and branching of tenocyte projections.
Lateral views of immunostained (A) sibling and (B) cacnb1 mutant embryos carrying the Tg(scx:mCherry) transgene showing tenocyte projections in a pseuodocolored, depth-coded pattern. (C) Dot plot shows individual data points of tenocyte projection length in sibling and cacnb1 mutant embryos (n = 50 data points/embryo in eight embryos/sample, p-value was determined by Wilcoxon Rank Sum Test - < 0.0001). The measurements used for quantitative analysis and creation of the plots can be accessed from Figure 2—figure supplement 2—source data 1.
-
Figure 2—figure supplement 2—source data 1
Measurements of Tsp4b localization area.
- https://doi.org/10.7554/eLife.38069.012
Figure 2—figure supplement 3
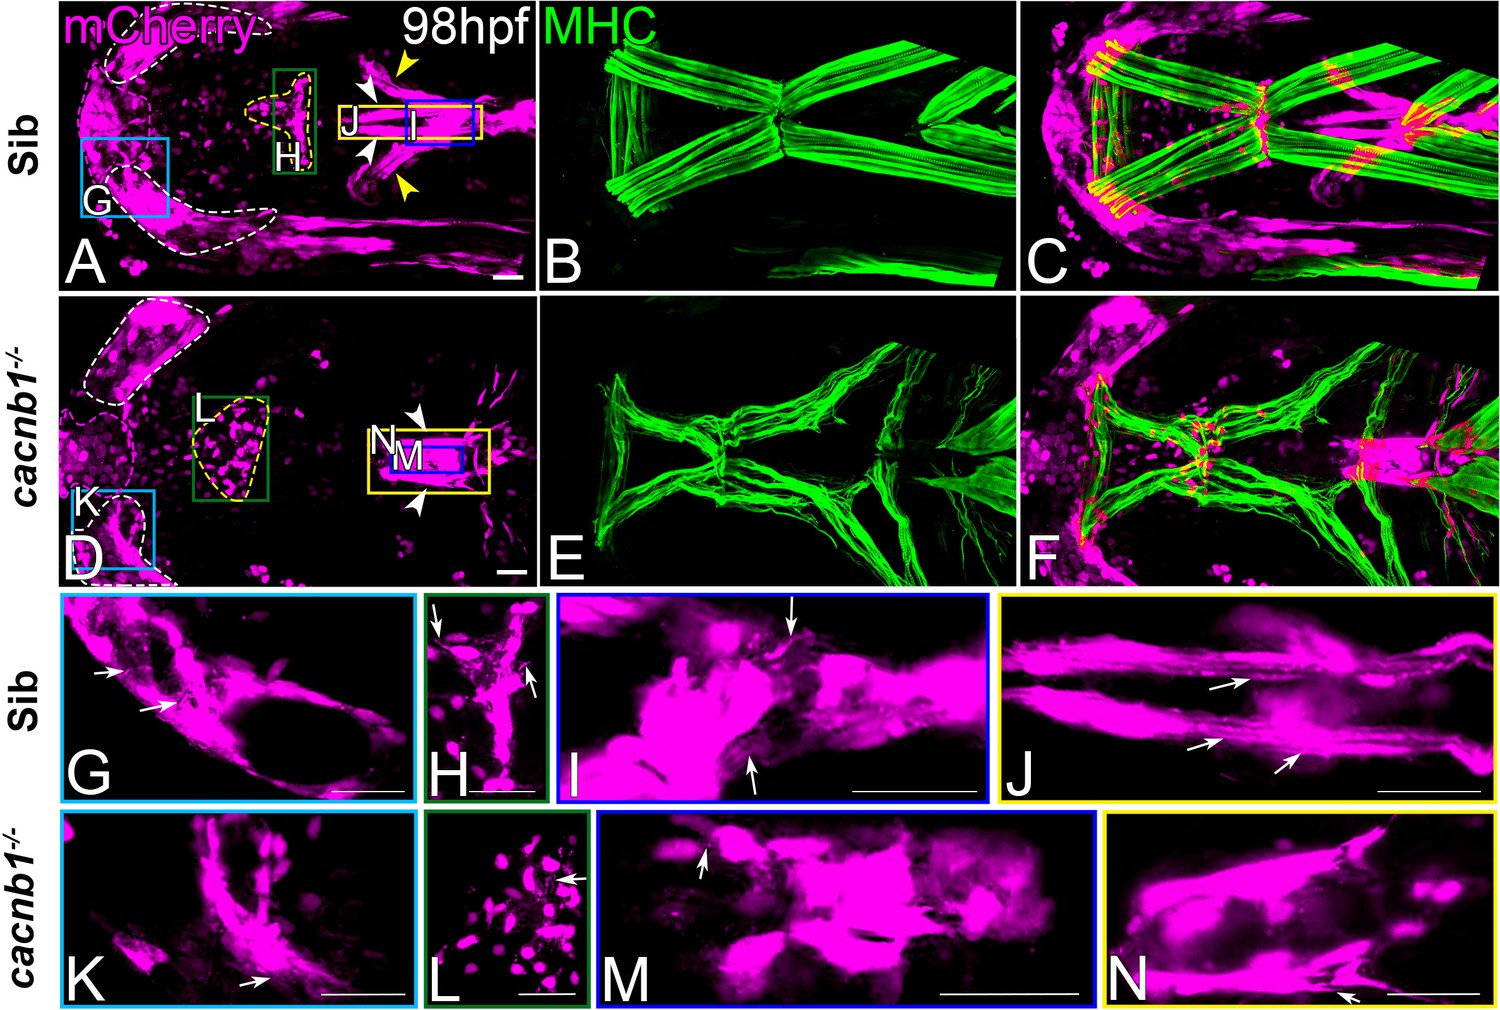
Cranial tenocyte patterning and morphogenesis is disrupted in pet mutants.
Ventral views of 98 hpf wild-type (A–C) and cacnb1; scx:mCherry (D–F) embryonic heads showing muscle fibers (green) and corresponding tenocytes (red). (G–J) Higher magnification views of control Tg(scx:mCherry) embryonic heads (panel A insets - color coded boxes) and (K–N) higher magnification views of cacnb1; scx:mCherry embryonic heads (panel D insets - color-coded boxes) showing tenocyte projections in different tendons (arrows). Scale bars = 20 microns.
Figure 3 with 3 supplements
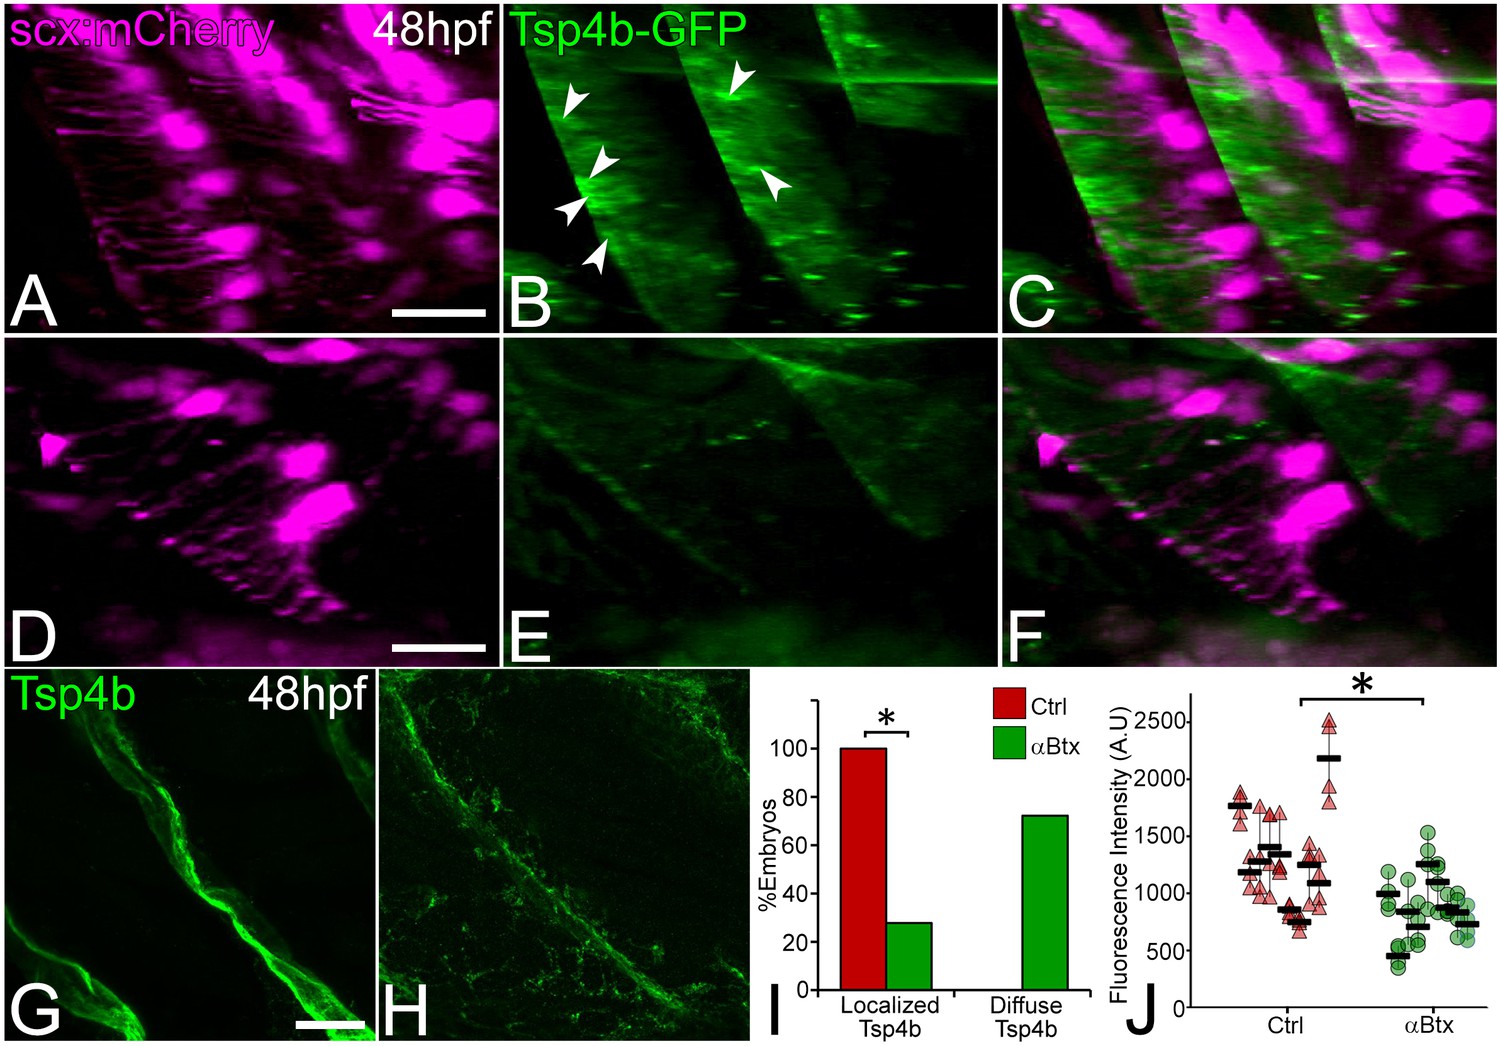
Tsp4b localization to VMS and tenocyte projections requires mechanical force.
Lateral views of live control (A–C) and αBtx injected (D–F) Tg(scx:mCherry) embryos (48 hpf), injected with tsp4b-gfp mRNA showing localization of Tsp4b-GFP (green) (arrowheads) along the VMS and tenocyte projections (red). (I) Histogram shows the percentage of embryos with Tsp4b-GFP localized to VMS (n = 27, p value calculated by chi-squared test <0.05). (G–H) Lateral views of immunostained embryos showing Tsp4b protein localization detected immunohistochemically along VMS in control (G) and αBtx injected (H) embryos. (J) Dot plot shows individual data points of the fluorescent intensity of localized Tsp4b along the VMS in control and αBtx injected embryos. Three VMSs/embryo were sampled in control and αBtx-injected embryos. (n = 9, p value calculated by Wilcoxon Rank Sum Test - < 0.0001). Scale bars = 20 microns. The measurements used for quantitative analysis and creation of the plots can be accessed from Figure 3—source data 1 and Figure 3—source data 2.
-
Figure 3—source data 1
Count of embryos showing localized or diffuse Tsp4b-GFP.
- https://doi.org/10.7554/eLife.38069.023
-
Figure 3—source data 2
Measurements of Tsp4b fluorescence intensities along VMS.
- https://doi.org/10.7554/eLife.38069.024
Figure 3—figure supplement 1
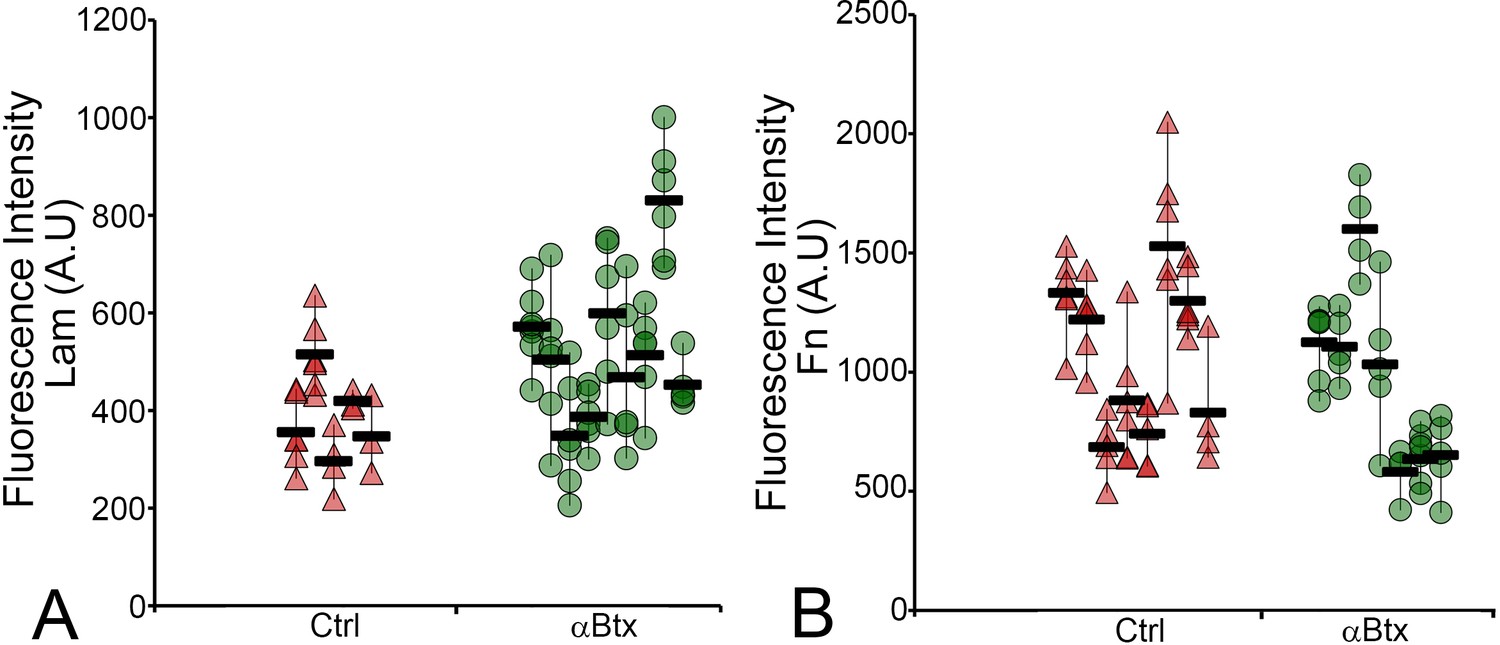
Early Lam and Fn organization do not depend on mechanical force.
Dot plot shows individual data points of the fluorescent intensity of localized Lam (A) and Fn (B) at MTJs along the VMS in control and αBtx-injected embryos at 48 hpf (A) and 24 hpf (B). Three VMSs/embryo were sampled in control and αBtx-injected embryos. (n = 9, p value calculated by ANOVA 1-way analysis and Tukey -*<0.002). Scale bars = 20 microns. The measurements used for quantitative analysis and creation of the plots can be accessed from Figure 3—figure supplement 1—source data 1 and Figure 3—figure supplement 1—source data 2.
-
Figure 3—figure supplement 1—source data 1
Measurement of Laminin fluoresence intensity along VMS.
- https://doi.org/10.7554/eLife.38069.018
-
Figure 3—figure supplement 1—source data 2
Measurement of Fibronectin fluoresence intensity along VMS.
- https://doi.org/10.7554/eLife.38069.019
Figure 3—figure supplement 2
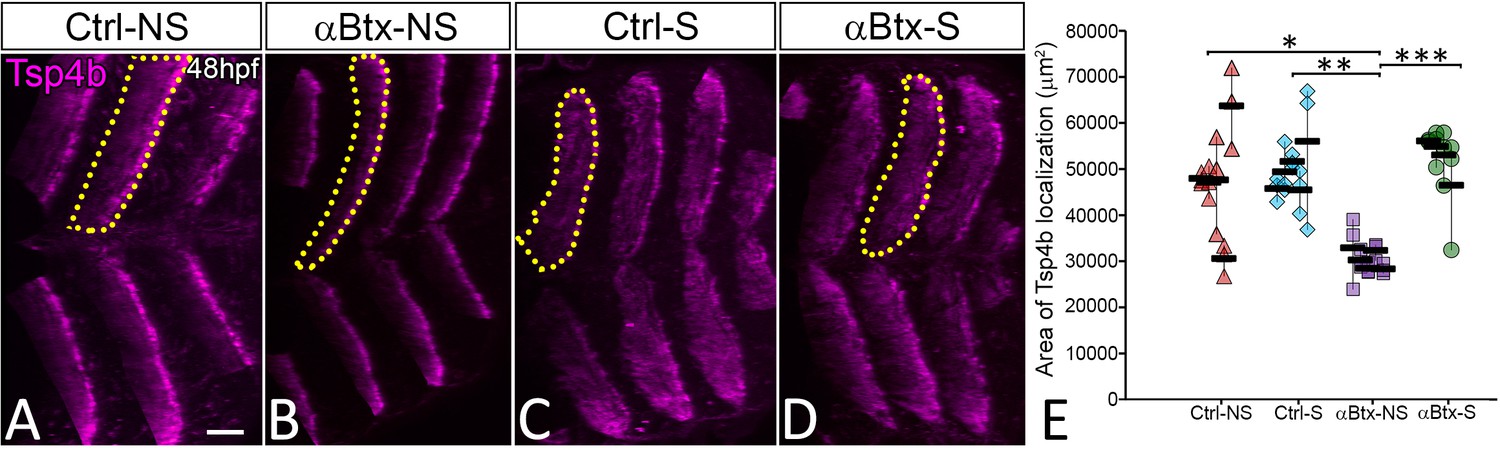
Tsp4b organization requires mechanical force.
Lateral view of immunostained 48 hpf embryos showing the localization of Tsp4b in control embryos without (A) and with stimulation (C), and αBtx-injected embryos without (B) and with stimulation (D). Histogram shows the mean area of Tsp4b localization in VMS (dotted region) (E). NS – Not Stimulated, S – Stimulated. Scale bar = 20 microns. The measurements used for quantitative analysis and creation of the plots can be accessed from Figure 3—figure supplement 2—source data 1.
-
Figure 3—figure supplement 2—source data 1
Measurements of Tsp4b localization area.
- https://doi.org/10.7554/eLife.38069.021
Figure 3—figure supplement 3
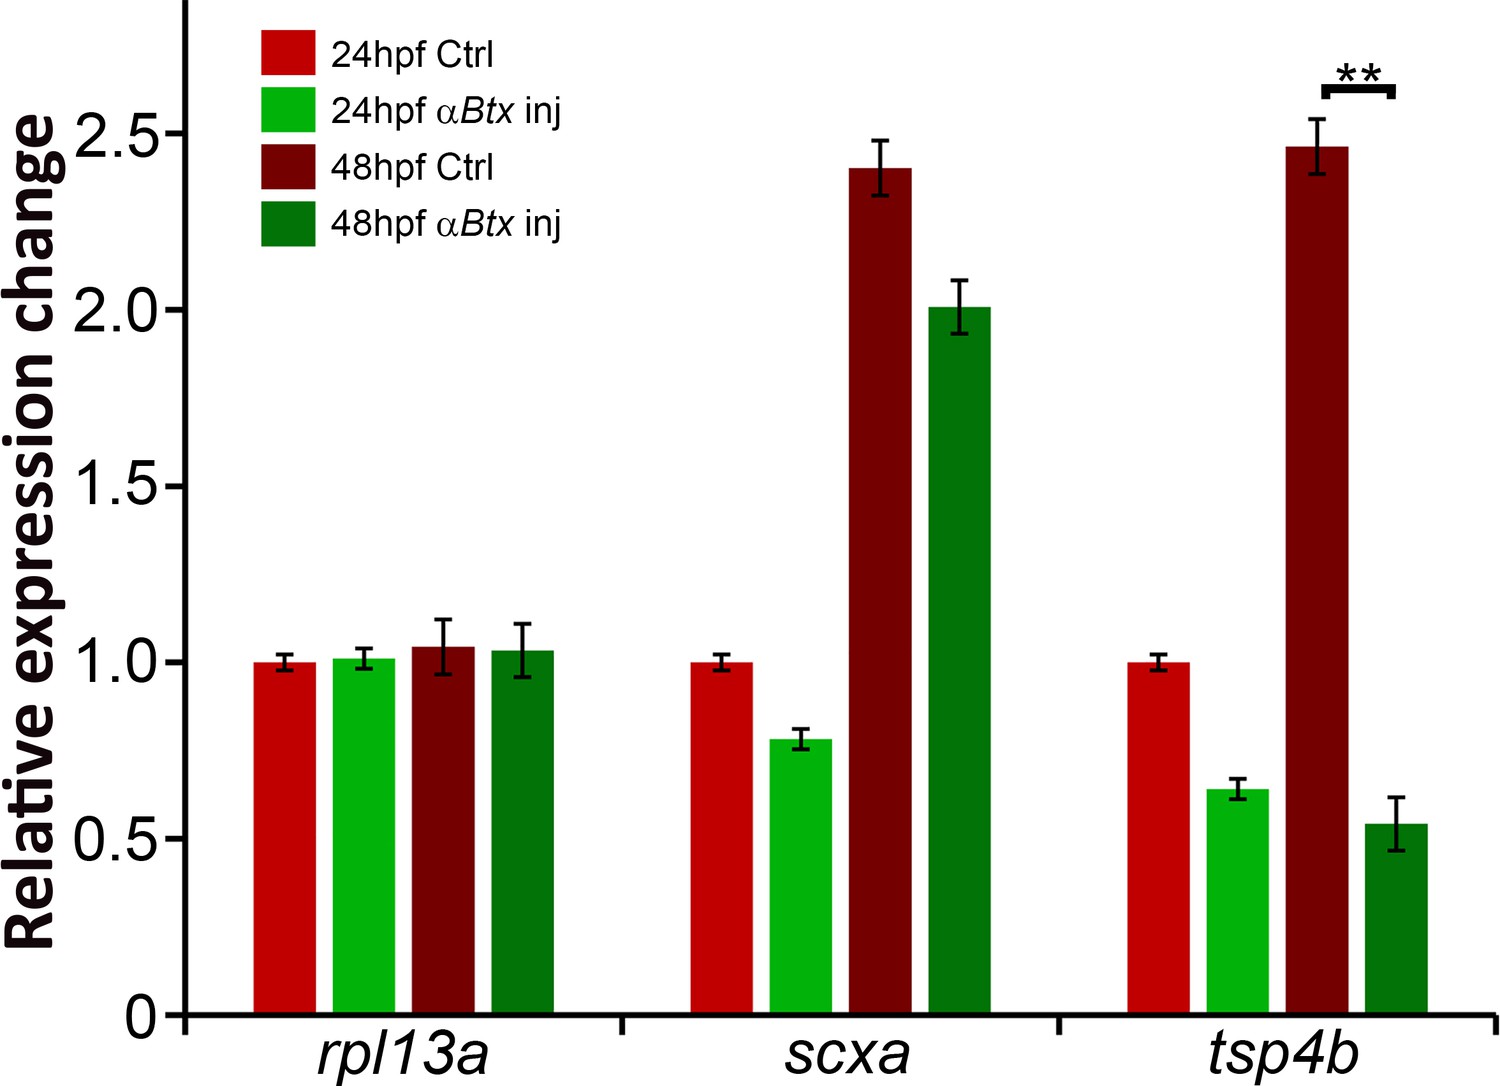
Mechanical force regulates expression of Tsp4b.
Histogram shows relative expression of rpl13a, scxa and tsp4b in 24 hpf and 48 hpf control and αBtx-injected embryos. (p value calculated by ANOVA 1-way analysis and Tukey test -**<0.001).
Figure 4
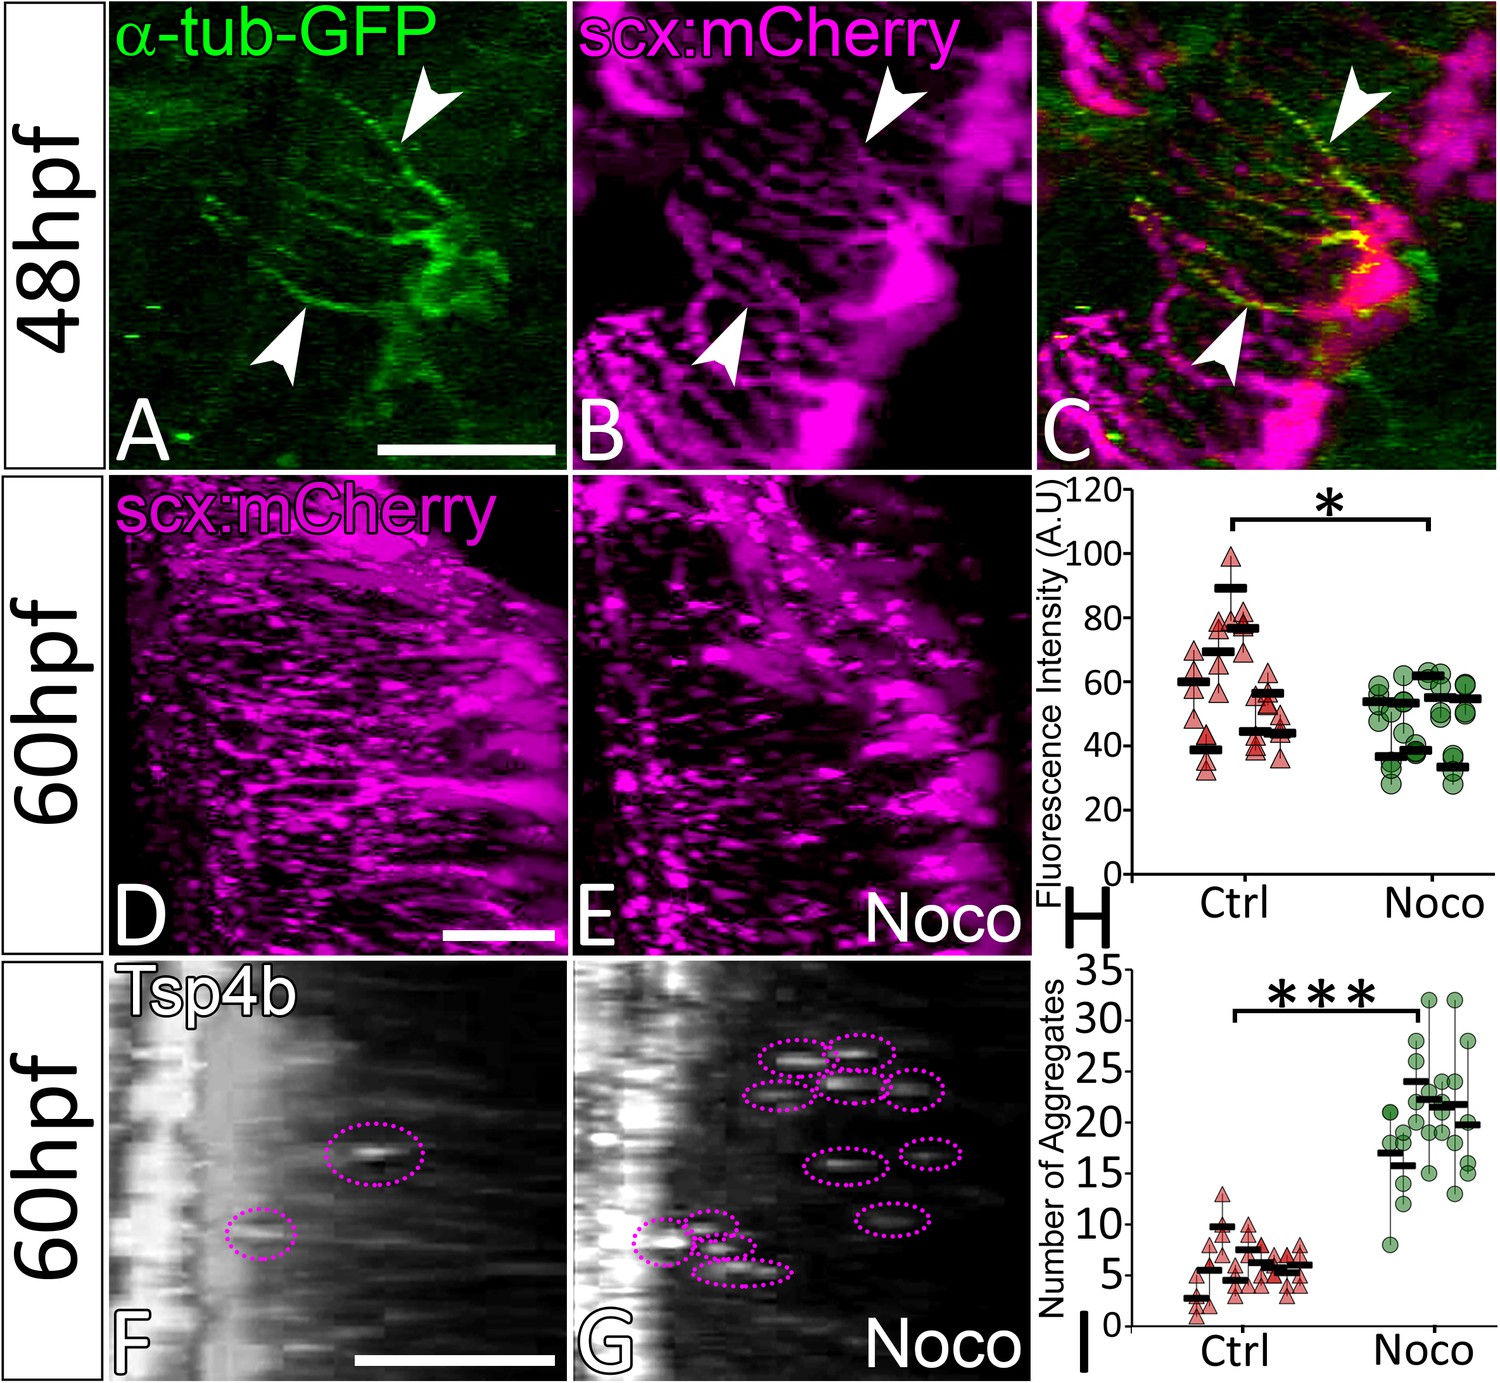
Microtubule-rich tenocyte projections control tendon ECM localization.
Lateral views of live 48 hpf Tg(scx:mCherry) embryos injected with EGFP-alpha-Tubulin mRNA (A–C) showing localization of a-Tubulin along the length of projections colocalized with mCherry to mark in tenocytes. Transverse views of 3-D reconstructed live 60 hpf embryos showing tenocyte projections in DMSO-treated (D) and Nocodazole (Noco)-treated (E) embryos. Transverse view of 3-D reconstructed 60 hpf embryos immunostained for Tsp4b showing localization of Tsp4b in DMSO treated (F) and Noco treated (G) samples. Quantification of Tsp4b localization intensity in VMS (H) and distribution of Tsp4b aggregates in VMS (I) of DMSO-treated and Noco-treated embryos. (p value calculated by t-test for samples with unequal variance *<0.05, ***<0.0005). Scale bars = 20 microns. The measurements used for quantitative analysis and creation of the plots can be accessed from Figure 4—source data 1 and Figure 4—source data 2.
-
Figure 4—source data 1
Mesurements of Tsp4b fluorescence intensities along VMS.
- https://doi.org/10.7554/eLife.38069.026
-
Figure 4—source data 2
Count of Tsp4b aggregates along VMS.
- https://doi.org/10.7554/eLife.38069.027
Figure 5
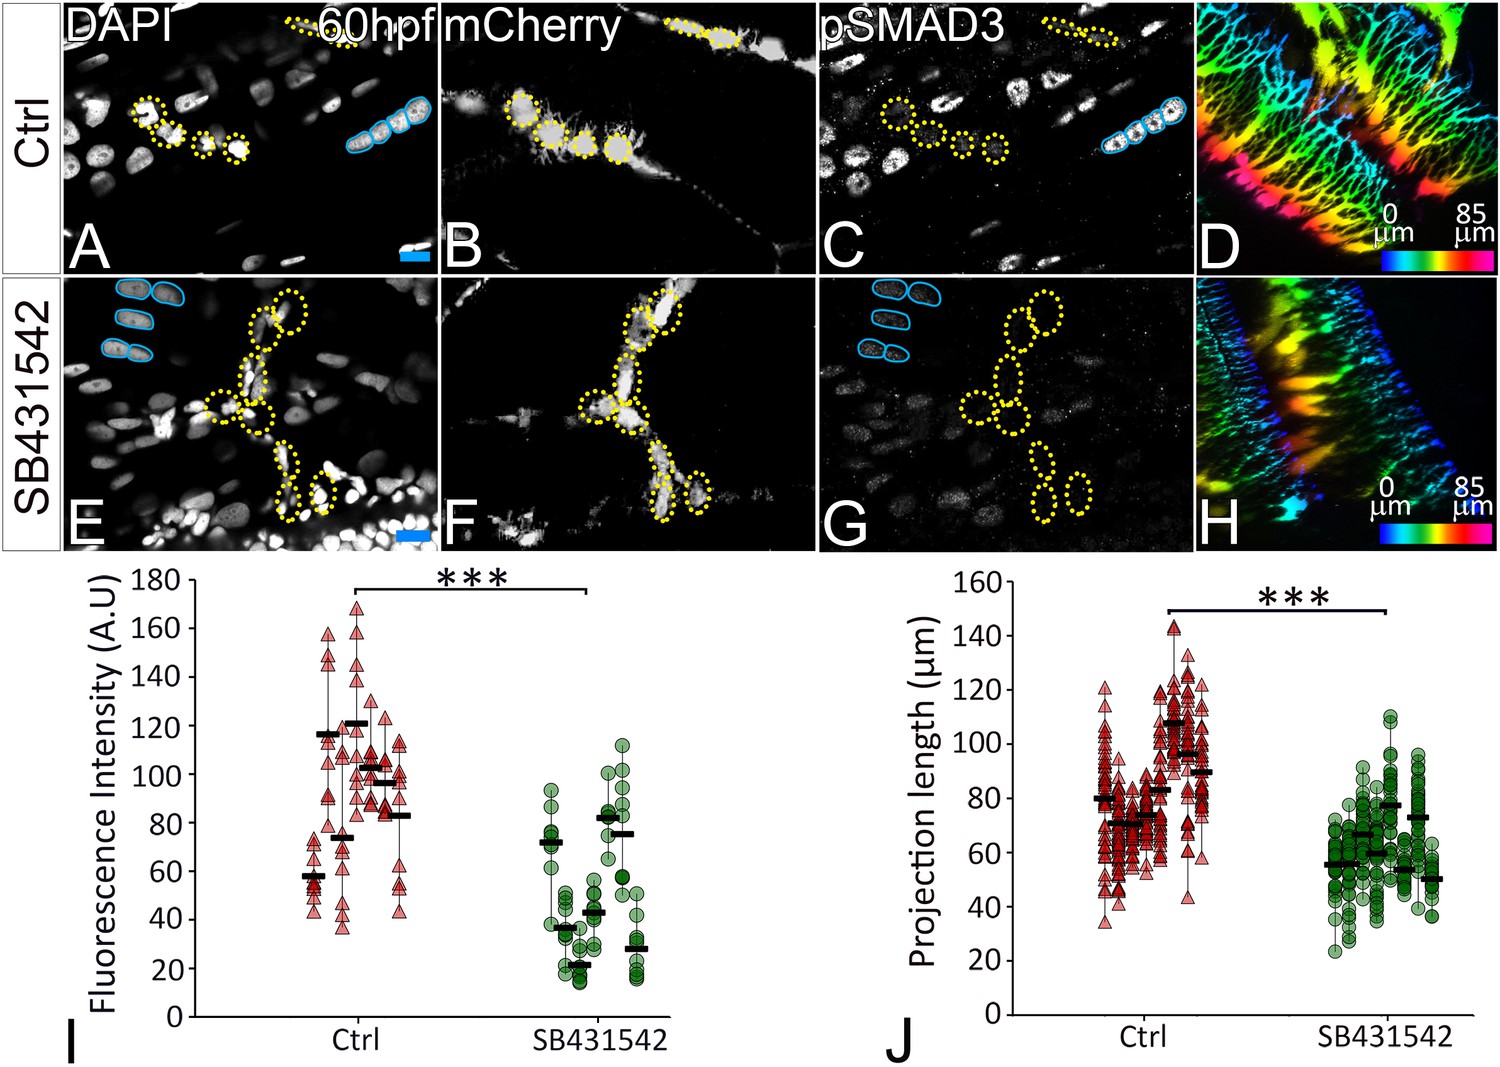
TGFβ signaling regulates tenocyte morphogenesis.
Lateral views of immunostained Tg(scx:mCherry) control (A–D) and SB431542-treated (E–H) embryos showing nuclei (DAPI), tenocytes (anti-mCherry) and pSMAD3 (anti-pSMAD3). (I) Localization of pSMAD3 was quantified as fluorescent intensity of nuclear pSMAD3 signal (marked by yellow dotted ROI) and plotted as a dot plot showing data points (n = 9, p value was calculated by t test ***<0.000005). (D, H) Pseudocolored 3D projections show tenocyte cell projections in control (D) and SB 431542 treated embryos (H). (J) Dot plot shows individual data points representing tenocyte projection lengths (n = 50 data points/embryo in nine embryos/sample, p value was calculated by Wilcoxon Rank Sum test ***<0.00005). Representative muscle nuclei are marked by a blue continuous ROI. Scale bars = 10 microns. The measurements used for quantitative analysis and creation of the plots can be accessed from Figure 5—source data 1 and Figure 5—source data 2.
-
Figure 5—source data 1
Measurements of pSMAD3 fluorescence intensities in tenocyte nuclei along VMS.
- https://doi.org/10.7554/eLife.38069.029
-
Figure 5—source data 2
Measurements of tenocyte projection length along VMS.
- https://doi.org/10.7554/eLife.38069.030
Figure 6 with 3 supplements
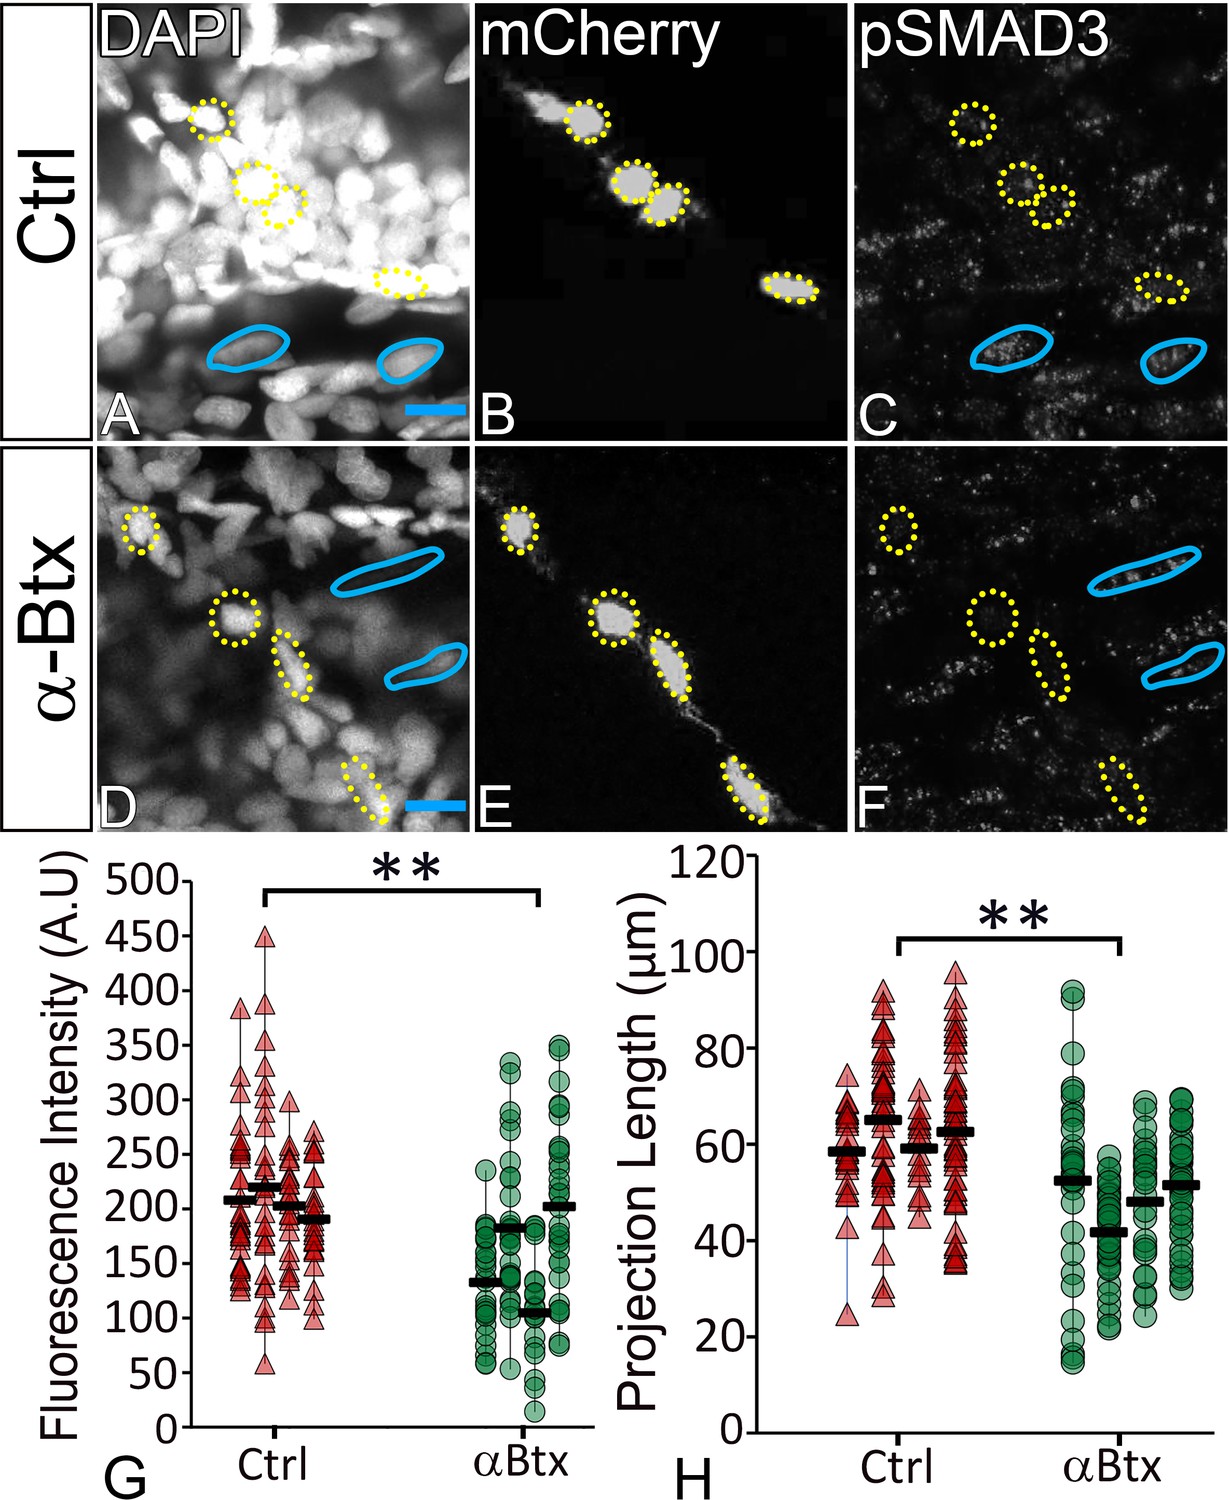
TGFβ signaling in tenocytes requires mechanical force.
Lateral views of 48 hpf immunostained Tg(scx:mCherry) control (A–C) and αBtx injected (D–F) embryos showing nuclei (DAPI), tenocytes (anti-mCherry) and pSMAD3 (anti-pSMAD3) (marked by yellow-dotted ROI). (G) Localization of pSMAD3 was quantified as fluorescent intensity of nuclear pSMAD3 signal and plotted as a dot plot (n = 4, p value was calculated by t-test **<0.005). (H) Dot plot shows individual tenocyte projection lengths (p value was calculated by t-test **<0.00005). Representative muscle nuclei are marked by a blue continuous ROI. Scale bar = 10 microns. The measurements used for quantitative analysis and creation of the plots can be accessed from Figure 6—source data 1 and Figure 6—source data 2.
-
Figure 6—source data 1
Measurements of Tenocyte projection length along VMS.
- https://doi.org/10.7554/eLife.38069.036
-
Figure 6—source data 2
Measurements of tenocyte nuclei pSMAD3 fluorescence intensity along VMS.
- https://doi.org/10.7554/eLife.38069.037
Figure 6—figure supplement 1
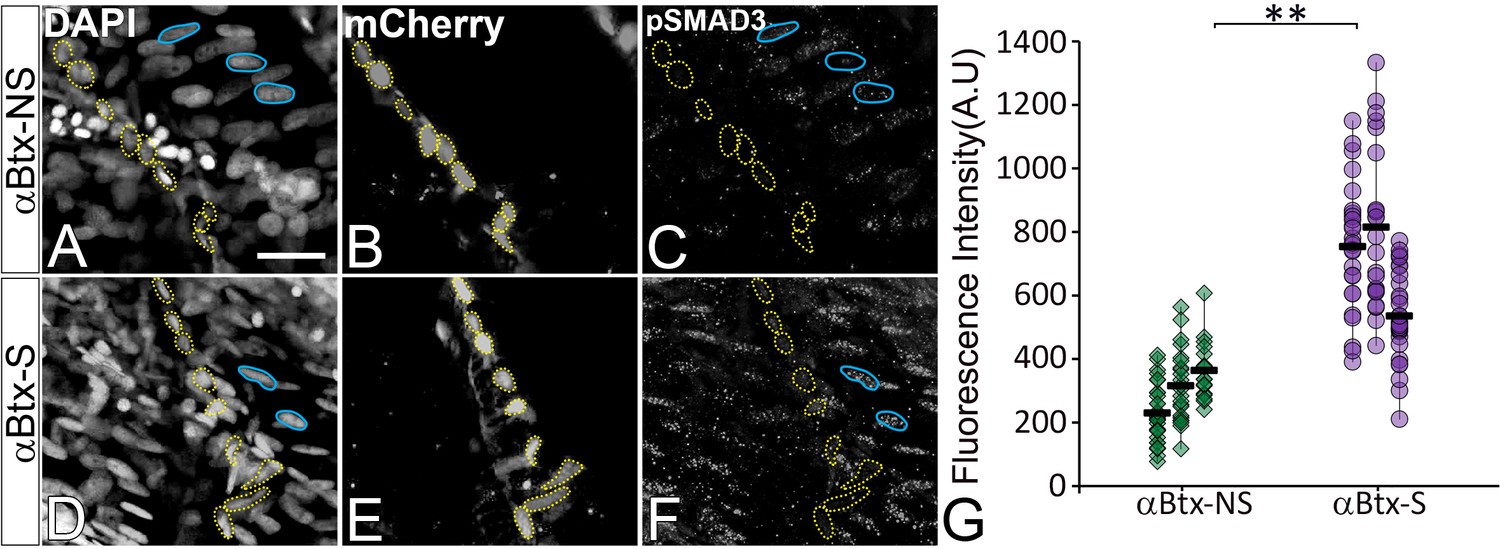
TGFβ signaling is elevated in response to mechanical force.
(A–F) Single plane images showing lateral views of paralyzed (αBtx) 48 hpf embryos without stimulation (A–C) and after stimulation (D–F), immunostained to show nuclei (DAPI), tenocytes (anti-mCherry) and pSMAD3 (anti-pSMAD3) (marked by yellow dotted ROI). Cell bodies are outlined by dotted lines. (G) pSMAD3 localization was quantified as fluorescent intensity of nuclear pSMAD3 signal and plotted as a dot plot (n = 3, p value was calculated by Wilcoxon Rank Sum test **<0.0005). NS – Not Stimulated, S – Stimulated. Representative muscle nuclei are marked by a blue continuous ROB. Scale bar = 10 microns. The measurements used for quantitative analysis and creation of the plots can be accessed from Figure 6—figure supplement 1—source data 1.
-
Figure 6—figure supplement 1—source data 1
Measurements of tenocyte nuclei pSMAD3 fluorescence intensity along VMS.
- https://doi.org/10.7554/eLife.38069.033
Figure 6—figure supplement 2

Mechanical force regulates expression of genes involved in tendon development.
(A) qRT-PCR analysis shows relative expression of scxa, tsp4b, tgfbip and ctgfa2 genes in control (wild-type) embryos and paralyzed embryos (αBtx-inj) (without and with stimulation) (p value was calculated by ANOVA 1-way analysis and Tukey test **<.005). (B) ddPCR analysis shows absolute expression level of scxa, tsp4b, tgfbip and ctgfa2 genes in control (wild-type) embryos and paralyzed embryos (αBtx-injected) (without and with stimulation) in whole embryos.
Figure 6—figure supplement 3
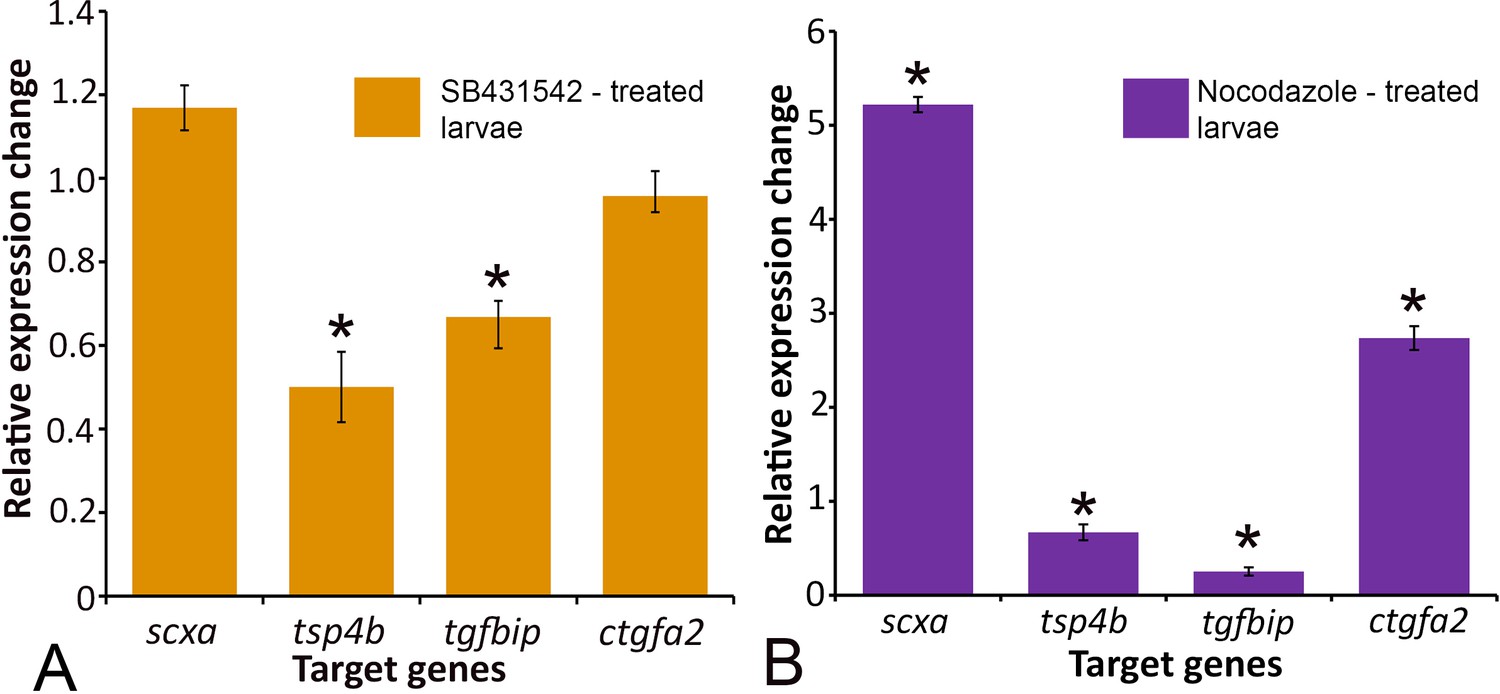
TGFβ signaling and tenocyte projection integrity affect tendon gene expression.
Real time PCR analysis shows relative expression of scxa, tsp4b, tgfbip and ctgfa2 genes in control (DMSO treated) embryos, SB431542-treated embryos (A) and Nocodazole-treated embryos (B).
Figure 7
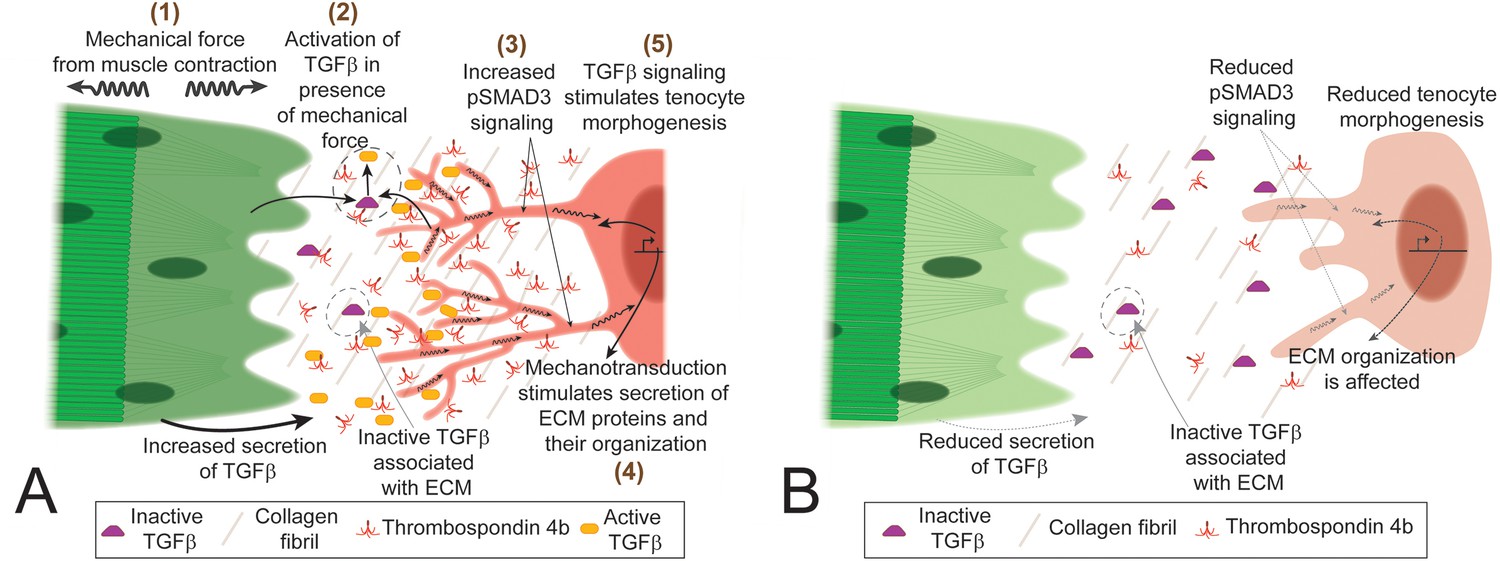
TGFβ-mediated mechanotransduction is essential for tenocyte differentiation and morphogenesis.
(A) In the presence of tensile force from muscle contraction (1) changes in ECM organization and other factors lead to release of active Tgfβ ligand (2). Tgfβ ligand binds to receptors on tenocytes to increase pSMAD3 signaling (3), secretion of ECM components (4) and growth/branching of microtubule rich projections (5). Cartoon depiction of tenocyte morphogenesis in the presence of mechanical force (during onset of muscle contraction in embryonic development or through electrical stimulation of paralyzed embryos). (B) In the absence of mechanical force (before onset of muscle contraction or in paralyzed embryos) there is reduced active Tgfβ ligand, pSMAD3 signaling, expression of ECM proteins and growth/branching of projections. Depiction of tenocyte morphogenesis in the absence of mechanical force.
Tables
Key resources table
| Reagent type (species) or resource | Designation | Source or reference | Identifiers | Additional information |
|---|---|---|---|---|
| Antibody | Rabbit anti Tsp4b | Schilling lab | RRID: AB_2725793 | 1:500 dilution |
| Antibody | Mouse anti Myosin heavy chain | DSHB | Cat# A4.1025, RRID: AB_528356 | 1:250 dilution |
| Antibody | Chicken anti GFP | Abcam | Cat# ab13970, RRID: AB_300798 | 1:1000 dulution |
| Antibody | Rat anti mCherry | Molecular Probes | Cat# M11217, RRID: AB_2536611 | 1:500 dilution |
| Antibody | Rabbit anti Fibronectin | Abcam | Cat# ab2413, RRID: AB_2262874 | 1:200 dilution |
| Antibody | Rabbit anti Laminin | Abcam | Cat# ab11575, RRID: AB_298179 | 1:200 dilution |
| Antibody | Rabbit anti pSMAD3 | Antibodies-online | Cat# ABIN1043888, RRID: AB_2725792 | 1:500 dilution |
| Antibody | Alexa Fluor 488 conjugated Donkey anti Chicken IgY | Jackson Immunoresearch | Cat# 712-586-153 | 1:1000 dulution |
| Antibody | DyLight 549 conjugated Donkey anti Rabbit IgG | Jackson Immunoresearch | Cat# 711-506-152, RRID: AB_2616595 | 1:1000 dulution |
| Antibody | Alexa Fluor 488 conjugated Donkey anti Rabbit IgG | Jackson Immunoresearch | Cat# 711-545-152, RRID: AB_2313584 | 1:1000 dulution |
| Antibody | Cy5 conjugated anti Mouse IgG | Jackson Immunoresearch | Cat# 115-176-071 | 1:1000 dulution |
| Antibody | Alexa Fluor 594 conjugated Donkey anti Rat IgG | Jackson Immunoresearch | Cat# 712-586-153, RRID: AB_2340691 | 1:1000 dulution |
| Antibody | Alexa Fluor 488 conjugated anti Mouse IgG | Jackson Immunoresearch | Cat# 715-546-150; RRID: AB_2340849 | 1:1000 dulution |
| Antibody | DiAmino PhyenylIndole (DAPI) | Invitrogen | Cat# D1306, RRID: AB_2629482 | 1:1000 dulution |
| Cell line (E. coli) | Chemically competent DH5alpha cells | Schilling Lab | ||
| Chemical compound, drug | SB431542 | Tocris | Cat# 1614, SID: 241182574 | 50 mM stock solution, 10 µM final concentration |
| Chemical compound, drug | Nocodazole | Sigma-Aldrich | Cat#1404, SID: 24278535 | 33 mM stock solution, 0.33 mM final concentration |
| Chemical compound, drug | Trizol | Invitrogen | Cat# 15596018 | |
| Chemical compound, drug | 3-aminobenzoic acid ethyl ester methanesulfonate | Sigma-Aldrich | Cat# A5040, SID: 329770864 | |
| Commercial assay or kit | mMessage mMachine T7 ultra transcription kit | Ambion | Cat# AM1345, RRID: SCR_016222 | |
| Commercial assay or kit | mMessage mMachine T3 transcription kit | Ambion | Cat# AM1348, RRID: SCR_016223 | |
| Commercial assay or kit | mMessage mMachine SP6 transcription kit | Ambion | Cat# AM1340, RRID: SCR_016224 | |
| Commercial assay or kit | Protoscript II first strand cDNA synthesis kit | New England Biolabs | Cat# E6560, RRID: SCR_016225 | |
| Commercial assay or kit | Luna universal qPCR master mix | New England Biolabs | Cat# M3003, RRID: SCR_016226 | |
| Commercial assay or kit | Direct-zol RNA Miniprep | Zymo Research | Cat# R2061, RRID: SCR_016227 | |
| Commercial assay or kit | QX200 EvaGreen 653 ddPCR Supermix | Bio-Rad | Cat# 1864033 RRID: SCR_008426 | |
| Commercial assay or kit | QX200 Droplet Generation Oil for EvaGreen | Bio-Rad | Cat# 1864005, RRID: SCR_008426 | |
| Commercial assay or kit | QX200 Droplet Generator | Bio-Rad | Cat# 1864002, RRID: SCR_008426 | |
| Commercial assay or kit | QX200 Droplet 657 Reader | Bio-Rad | Cat# 1864003, RRID: SCR_008426 | |
| Commercial assay or kit | Qubit SSDNA assay kit | Invitrogen | Cat# Q10212, SCR_008817 | |
| Commercial assay or kit | Qubit 2.0 fluorometer | Invitrogen | Cat# Q32866, SCR_008817 | |
| Gene (Danio rerio) | Tg(scx:mCherry) | Galloway lab | N/A | |
| Gene (Danio rerio) | Cacnb1+/- | Schilling lab | N/A | |
| Sequence-based reagent | Primers for RT-PCR, see Table S1 | This paper | N/A | 0.5 µM final concentration |
| Recombinant DNA reagent | pmtb-t7-alpha-bungarotoxin | Addgene | Cat# 69542, RRID: SCR_002037 | |
| Recombinant DNA reagent | pIRESneo-EGFP-alpha tubulin | Addgene | Cat# 12298, RRID: SCR_002037 | |
| Recombinant DNA reagent | pmEGFP-Lifeact-7 | Addgene | Cat# 54610, RRID: SCR_002037 | |
| Software, algorithm | Simple Neurite Tracer | Fiji |
Table 1
List of primer sequences used for RT-PCR.
https://doi.org/10.7554/eLife.38069.039| Name | Sequence | Gene |
|---|---|---|
| rpl13a-fp-qpcr | TCTGGAGGACTGTAAGAGGTATGC | ribosomal protein L13a |
| rpl13a-rp-qpcr | AGACGCACAATCTTGAGAGCAG | |
| rps13-fp-qpcr | ATAGGCGAAGTGTCCCCACA | ribosomal protein S13 |
| rps13-fp-qpcr | CAGTGACGAAACGCACCTGA | |
| scxa-fp-qpcr | GGAGAACTCGCAGCCCAAA | scleraxis A |
| scxa-rp-qpcr | AATCCCTTCACGTCGTGGTTT | |
| tsp4b-fp-qpcr | ACAATCCACGAGACAACAGC | thrombospondin 4b |
| tsp4b-rp-qpcr | GCACTCATCCTGCCATCTCT | |
| ctgfa-fp-qpcr | CTTTACTGTGACTACGGCTCC | connective tissue growth factor a |
| ctgfa-rp-qpcr | ACAACTGCTCTGGAAAGACTC | |
| tgfbip-fp-qpcr | CCCCAATGTTTGTGCTATGC | tgfβ induced peptide |
| tgfbip-rp-qpcr | CTCCAATCACCTTCTCATATCCAG |
Additional files
-
Transparent reporting form
- https://doi.org/10.7554/eLife.38069.040
Download links
A two-part list of links to download the article, or parts of the article, in various formats.
Downloads (link to download the article as PDF)
Open citations (links to open the citations from this article in various online reference manager services)
Cite this article (links to download the citations from this article in formats compatible with various reference manager tools)
Mechanical force regulates tendon extracellular matrix organization and tenocyte morphogenesis through TGFbeta signaling
eLife 7:e38069.
https://doi.org/10.7554/eLife.38069


