Feedback regulation of cytoneme-mediated transport shapes a tissue-specific FGF morphogen gradient
- University of Maryland, United States
Figures
Figure 1 with 2 supplements
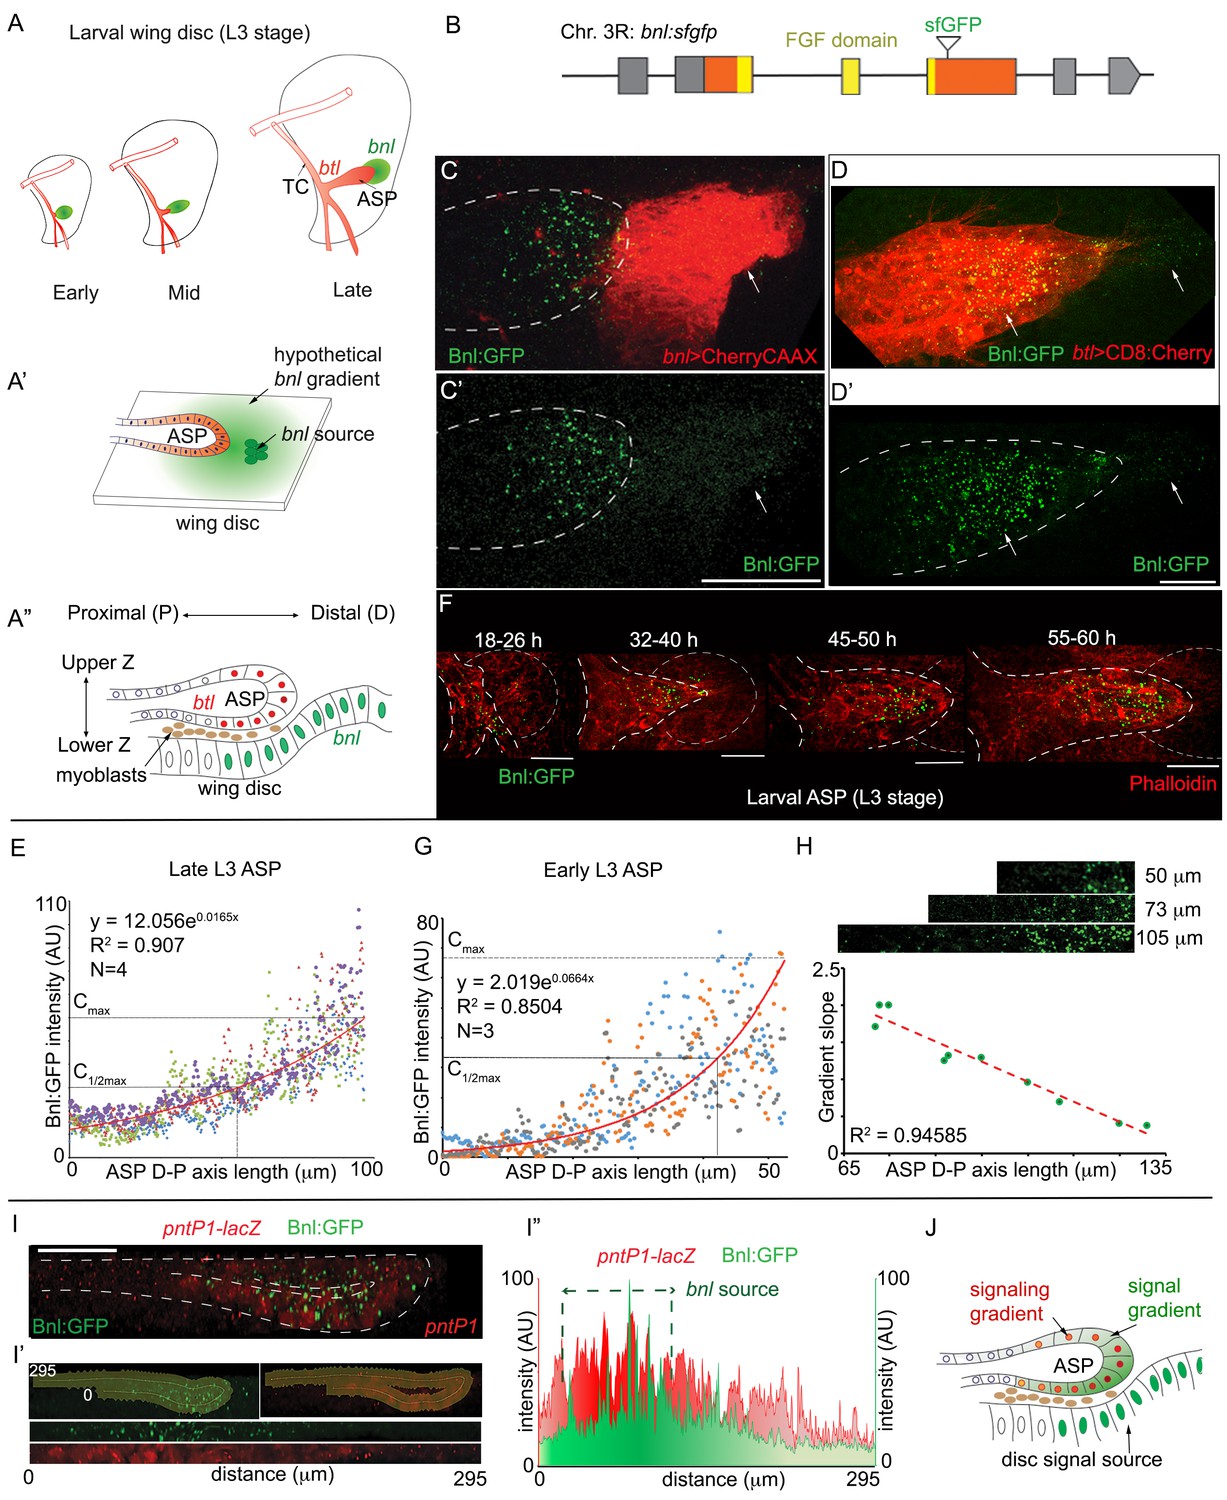
A concentration gradient of Bnl:GFP adopts precise morphologies of the recipient ASP.
(A) Drawings depicting budding and directed growth of the third instar larval ASP (red, btl expression) regulated by Bnl produced in a restricted group of cells in the wing disc (green); Bnl source spatiotemporally changes position ahead of the growing ASP; TC, transverse connective. (A’) Drawing depicting hypothetical chemotactic gradient of secreted Bnl (green) that was predicted to guide the directed ASP (red) growth toward the Bnl expressing cells (green circle). (A’’) Drawing depicting a cross-section of the late third instar larval ASP and wing disc, showing their epithelial contours, relative position in X-Z-Y dimension, putative Bnl- responsive cells (red), and disc bnl-expressing cells (green); upper/lower Z. (B) A schematic map of bnl:gfpendo knock-in allele; grey box, non-coding exons; orange box, coding exons; line, introns. (C–D’) Z-projected images showing that Bnl:GFP, produced at physiological level from the bnl:gfpendo allele, moved from the disc bnl-source to the ASP and distributed along the distal to proximal direction of the recipient tissue; (C,C’) bnl-source marked by CherryCAAX expression (bnl-LexA, lexO-CherryCAAX/bnl:gfpendo); (D,D’) recipient ASP marked by CD8:Cherry expression (btl-Gal4,UAS-CD8:Cherry/+; bnl:gfpendo); (C,D) merged red and green channels; (C’,D’) only the green channel; arrows, Bnl:GFP signal detected specifically in the wing disc source and recipient ASP. (E) Graph showing the Bnl:GFP concentration gradient along the ASP D-P axis in late third instar larvae (N = 4 independent samples). (F) Coordination of Bnl:GFP gradient formation with the ASP growth; time points, hours (h) after third instar larval molt; relative position of bnl-source marked by dashed-line. (G) Narrow range of Bnl:GFP gradient in shorter ASPs from early third instar larvae (N = 3 independent samples). (E,G) Red line graph, trend-line of the X-Y scatter plot with exponential fit from the averaged value; Cmax, maximum average Y value (Bnl:GFP intensity); (H) Negative correlation of the ASP D-P axis length and the slope (Cmax to C1/2max) of the Bnl:GFP gradient; each coordinate represents a single disc-ASP tissue; upper panels, Bnl:GFP distribution in three examples of ASPs with different lengths of D-P axis (the cropped region). (I) A 3D sagittal view showing a continuous long-range Bnl:GFP distribution across the entire recipient ASP epithelium adopting its tubular contour; expression of a target gene reporter of Bnl signaling, pntP1-lacZ (red, anti-βGal) showing corresponding signaling response; (I’,I’’) Intensity plots of Bnl:GFP (green) and pntP1-lacZ (red) (I’’) across the entire ASP epithelium derived from the digitally straightening ASP epithelium shown in I’. (J) Drawing of a cross section of the ASP-wing disc, summarizing the observations from C,D,I. (C–I’) Fixed samples, Z-projection, except I-I’; AU, arbitrary unit; dashed line, ASP or wing disc outline. Scale bars, 30 μm.
-
Figure 1—source data 1
Data for the intensity profile plot of Bnl:GFP along the D-P axis of the late 3rd instar larval ASP in Figure 1E.
- https://doi.org/10.7554/eLife.38137.006
-
Figure 1—source data 2
Data for the intensity profile plot of Bnl:GFP along the D-P axis of the early 3rd instar larval ASP in Figure 1G.
- https://doi.org/10.7554/eLife.38137.007
-
Figure 1—source data 3
Numerical data for correlation of the length of the D-P axis of the ASP and the slope of the Bnl:GFP gradient in Figure 1H.
- https://doi.org/10.7554/eLife.38137.008
-
Figure 1—source data 4
Data for the intensity profile plots of Bnl:GFP and pntP1-lacZ along the digitally straightened tubular ASP epithelium in Figure 1I”, Figure 1—figure supplement 2D”, and Figure 1—figure supplement 2E”.
- https://doi.org/10.7554/eLife.38137.009
Figure 1—figure supplement 1
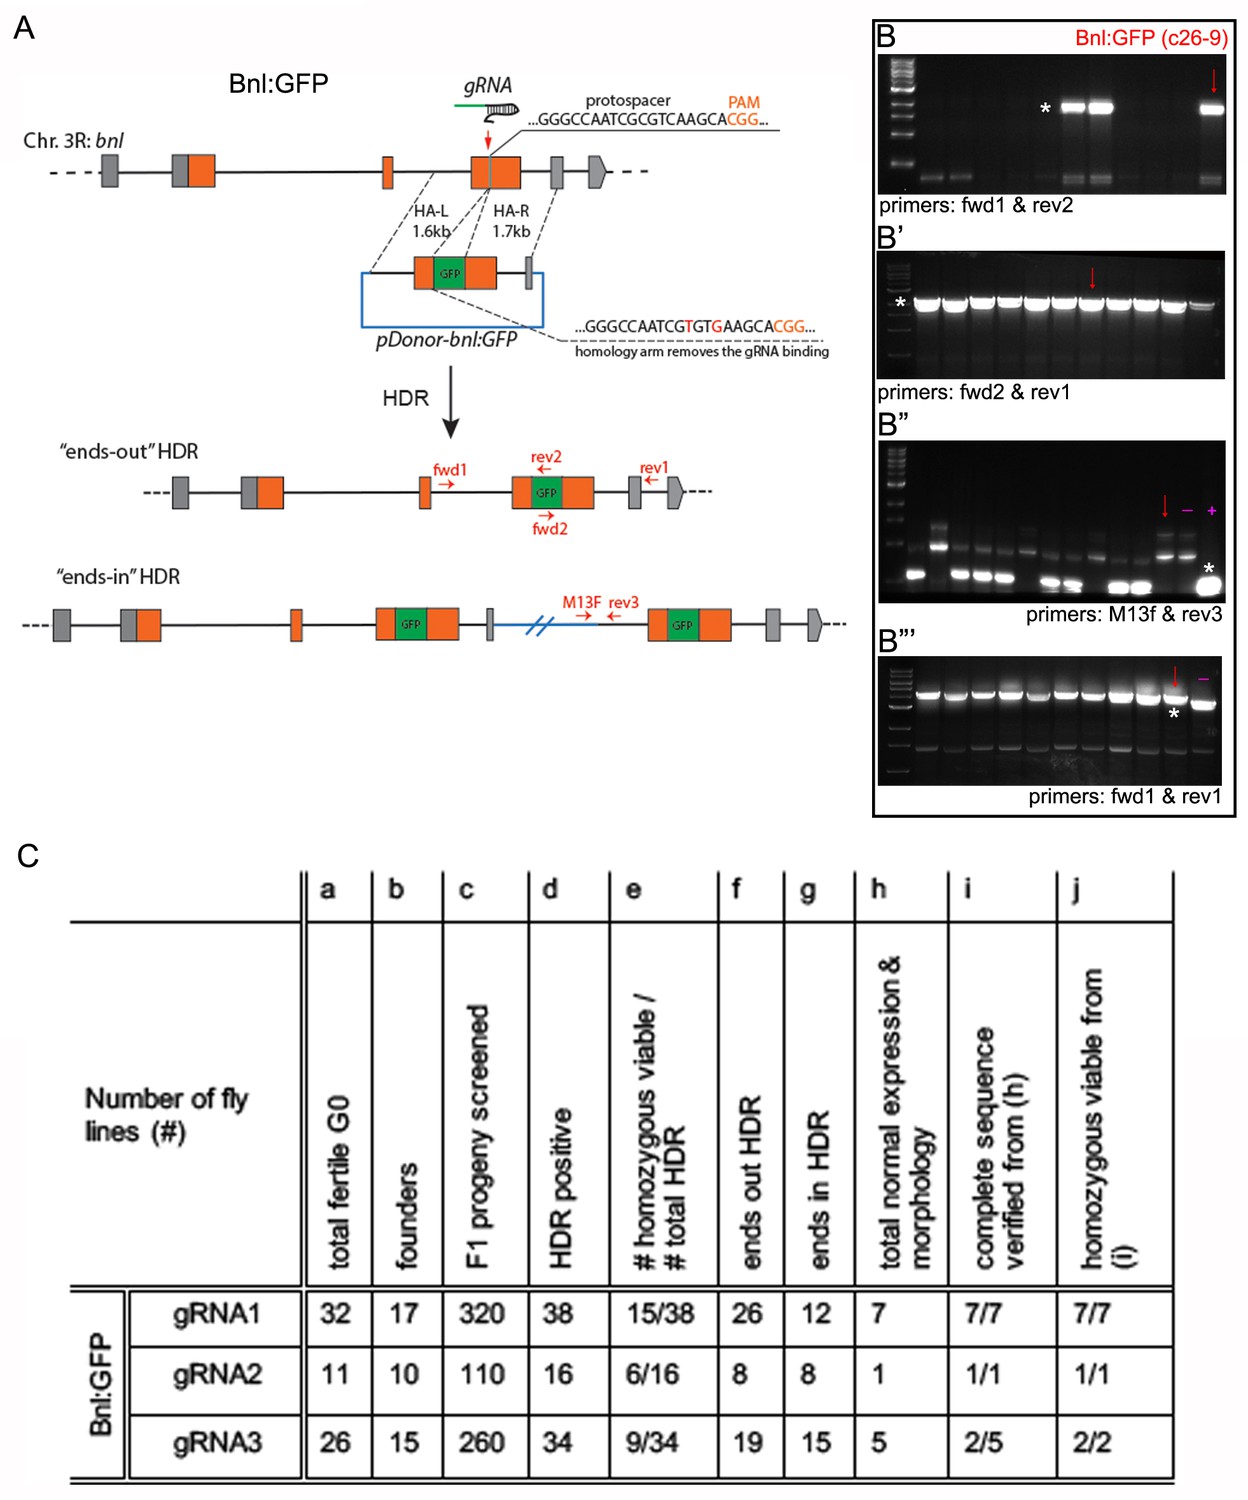
Generating genome-edited flies harboring a bnl:gfpendo allele.
(A) Scheme for CRISPR/Cas9-based generation of bnl:gfpendo and two possible outcomes from the HDR; orange box, coding exon; grey box, non-coding exon; line, introns; red vertical arrow, approximate gRNA target site; horizontal red arrows, approximate primer binding sites. (B-B’’’) Representative agarose gel pictures showing examples of the three-step PCR-based CRISPR screening process; red arrows, amplicons from gDNA of the c26-9 line used in this study; (B) PCR amplification products (*) obtained from the gDNA of different lines using primers fwd1-rev2 identified the gfp sequence containing positive HDR lines; (B’) HDR positive lines identified in B (e.g., c26-9), were reconfirmed by PCR using fwd2-rev1 primers; (B’’) the HDR positive lines identified in B,B’, were subjected to PCR screening using primers M13F and rev3; the lower-most bands (*) indicated unintended ‘ends-in’ HDR; Absence of the band showed probable ends-out HDR; (B’’’) the putative ‘ends-out’ HDR were confirmed with PCR amplification of the correct sized product with fwd1-rev1 primers, both of which annealed to the flanking gDNA regions outside of the inserted cassette; the correct ends-out HDR amplified ~700 bp longer product due to the presence of gfp sequence than the negative control untagged parental gDNA; markers, 1 kb DNA ladder from NEB; (B’’,B’’’) (-) represents PCR product amplification from negative control: gDNA from the nos-Cas9 parental line; (+) represents PCR product amplification from positive control: pDonor-bnl:GFP plasmid. (C) A table showing efficiency of generating bnl:gfpendo lines using CRISPR/Cas9; numbers of HDR progenies in (d,f,g) were determined by PCR based screen similar to B-B’’’; gene expression in (h) was verified in the larval imaginal discs, trachea, brain and embryo; normal morphology in (h) was verified in embryonic and larval trachea, and overall tissue morphology.
Figure 1—figure supplement 2
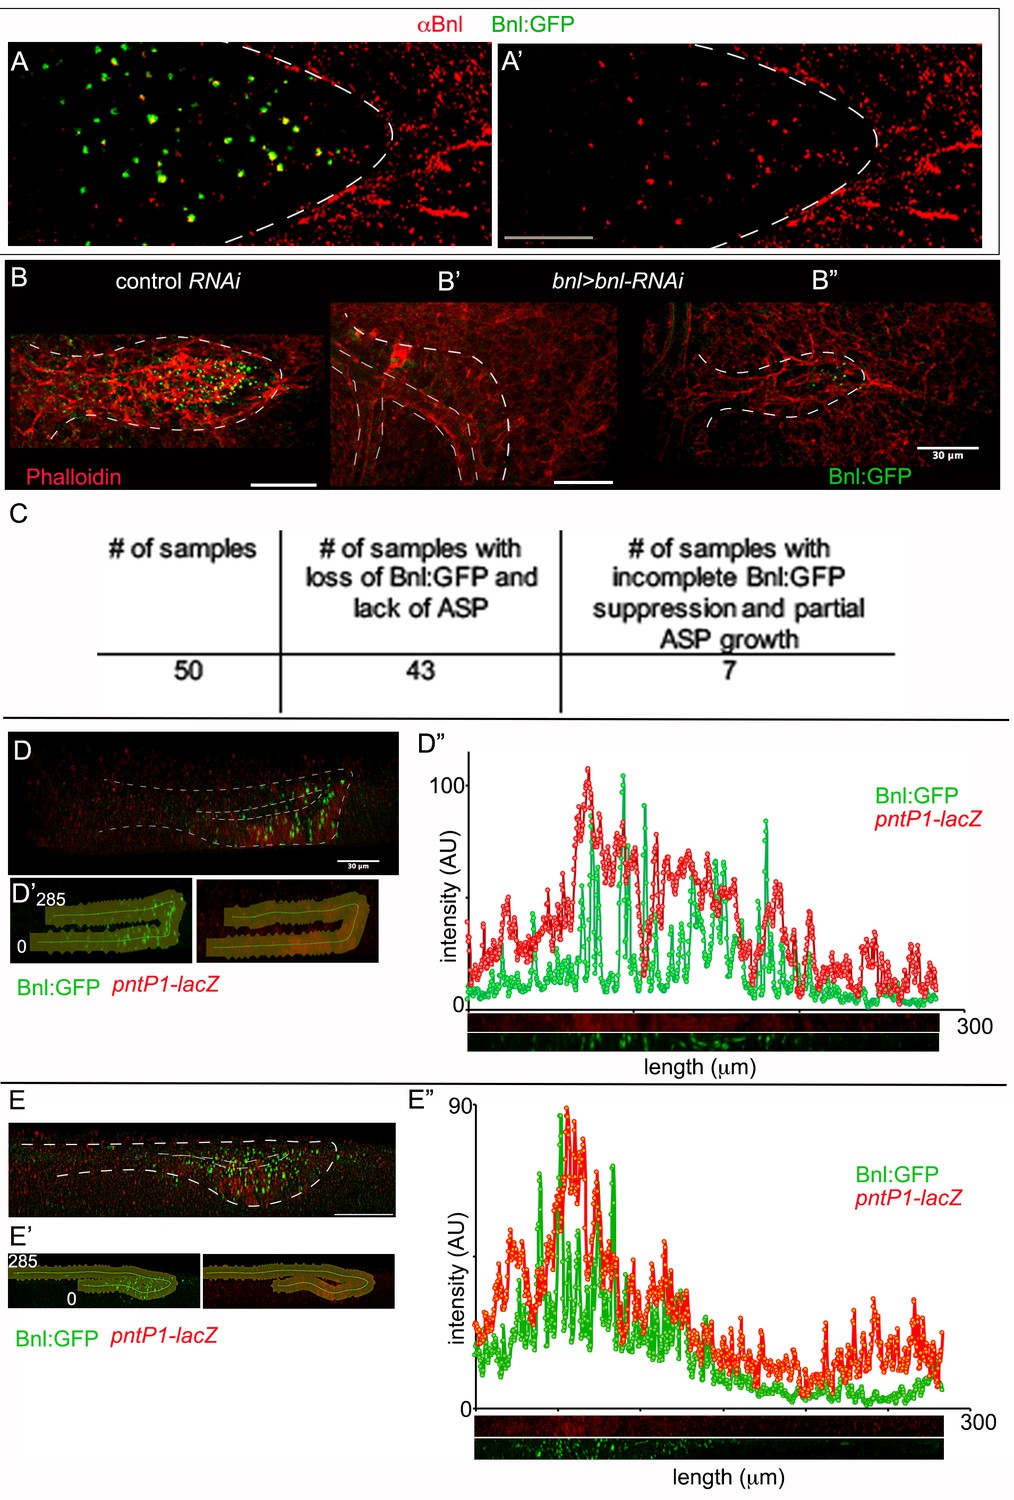
Characterization of Bnl:GFP distribution in the ASP.
(A, A’) Immunostaining with αBnl antibody (red) recognized Bnl:GFP puncta in the ASP; (A) merged channels; (A’) only the red channel. (B-C) Effect on the ASP (outlined by white dashed line) growth by knocking-down of bnl:gfpendo expression with bnlRNAi (bnl-Gal4/UAS-bnlRNAi,bnl:gfpendo); (B) control (bnl-Gal4/bnl:gfpendo); (B’,B’’) bnl-RNAi (bnl-Gal4/UAS-bnlRNAi,bnl:gfpendo); (B’) complete knock down and growth suppression; (B’’) partial knock down and growth suppression; red, phalloidin; (C) a table showing phenotypic consequences of bnlRNAi-mediated knock down of bnl:grpendo. (D-E’’) 3D sagittal views showing long-range Bnl:GFP distribution adopting the ASP tubular morphology; expression of a target gene reporter of Bnl signaling, pntP1-lacZ (red, anti-βGal) showing corresponding signaling response; (D’,E’) outline of the ASP epithelium selected for the digital straightening; (D’’,E’’) intensity plots from the digitally straightened (lower panels) epithelium from (D’ and E’) respectively. (A-B’,D,E) white dashed lines, ASP outlines. Scale bars, 30 μm.
Figure 2 with 2 supplements

A receptor-bound Bnl:GFP gradient.
(A) A schematic map of btl:cherryendo knock-in allele; orange box, coding exon; grey box, non-coding exon; line, introns. (B) Btl:Cherry, expressed at physiological levels from the btl:cherryendo allele, was detected as densely packed puncta marking the ASP cell membrane. (C,C’) Bright colocalized Bnl:GFP-Btl:Cherry puncta visible at low exposure imaging, 100% of the Bnl:GFP puncta in the ASP are Btl:Cherry bound; (C’) only red channel shown. (D) Graded Btl:Cherry expression and distribution in the ASP coincided with the Bnl:GFP gradient in the ASP; N = 3 independent samples; lower panel, an example of the region of ASP used for generating the intensity plot in the upper panel; AU, arbitrary unit. (E-E’’’) About 90 ± 1.6% colocalized Bnl:GFP-Btl:Cherry puncta in the ASP also localized in αRab7-marked endosomes (arrowhead); (E) merged colors; (E’) zoomed in region marked by dashed box in E; (E’’) only green and blue channels showing endosome localized Bnl:GFP in the ASP; (E’) only blue channel. (C,C’,E-E’’’) arrow, basally localized Bnl:GFP-Btl:Cherry puncta that were not in the endosomes; arrowhead, apically localized receptor-ligand puncta that were also in the endosomes; all images, Z-projection of 5–6 selected optical planes; dashed line, ASP outline. (C–E’’’) bnl:gfpendo/btl:cherryendo larvae. (B–E’’’) fixed samples. (B,D) Z-projection of 30–40 optical planes. Scale bars, 30 μm; 10 μm (E); 5 μm (E’).
-
Figure 2—source data 1
Data for the intensity profile plots of Bnl:GFP and Btl:Cherry in Figure 2D.
- https://doi.org/10.7554/eLife.38137.015
-
Figure 2—source data 2
Data for the intensity profile plot of Btl:Cherry in Figure 2—figure supplement 1D.
- https://doi.org/10.7554/eLife.38137.016
-
Figure 2—source data 3
Numerical data showing frequency of colocalization of Bnl:GFP puncta in the ASP with Btl:Cherry, early-, late-, and recycling- endosomes, and lysosomes in Figure 2C,E, and Figure 2—figure supplement 2A,B,C.
- https://doi.org/10.7554/eLife.38137.017
Figure 2—figure supplement 1
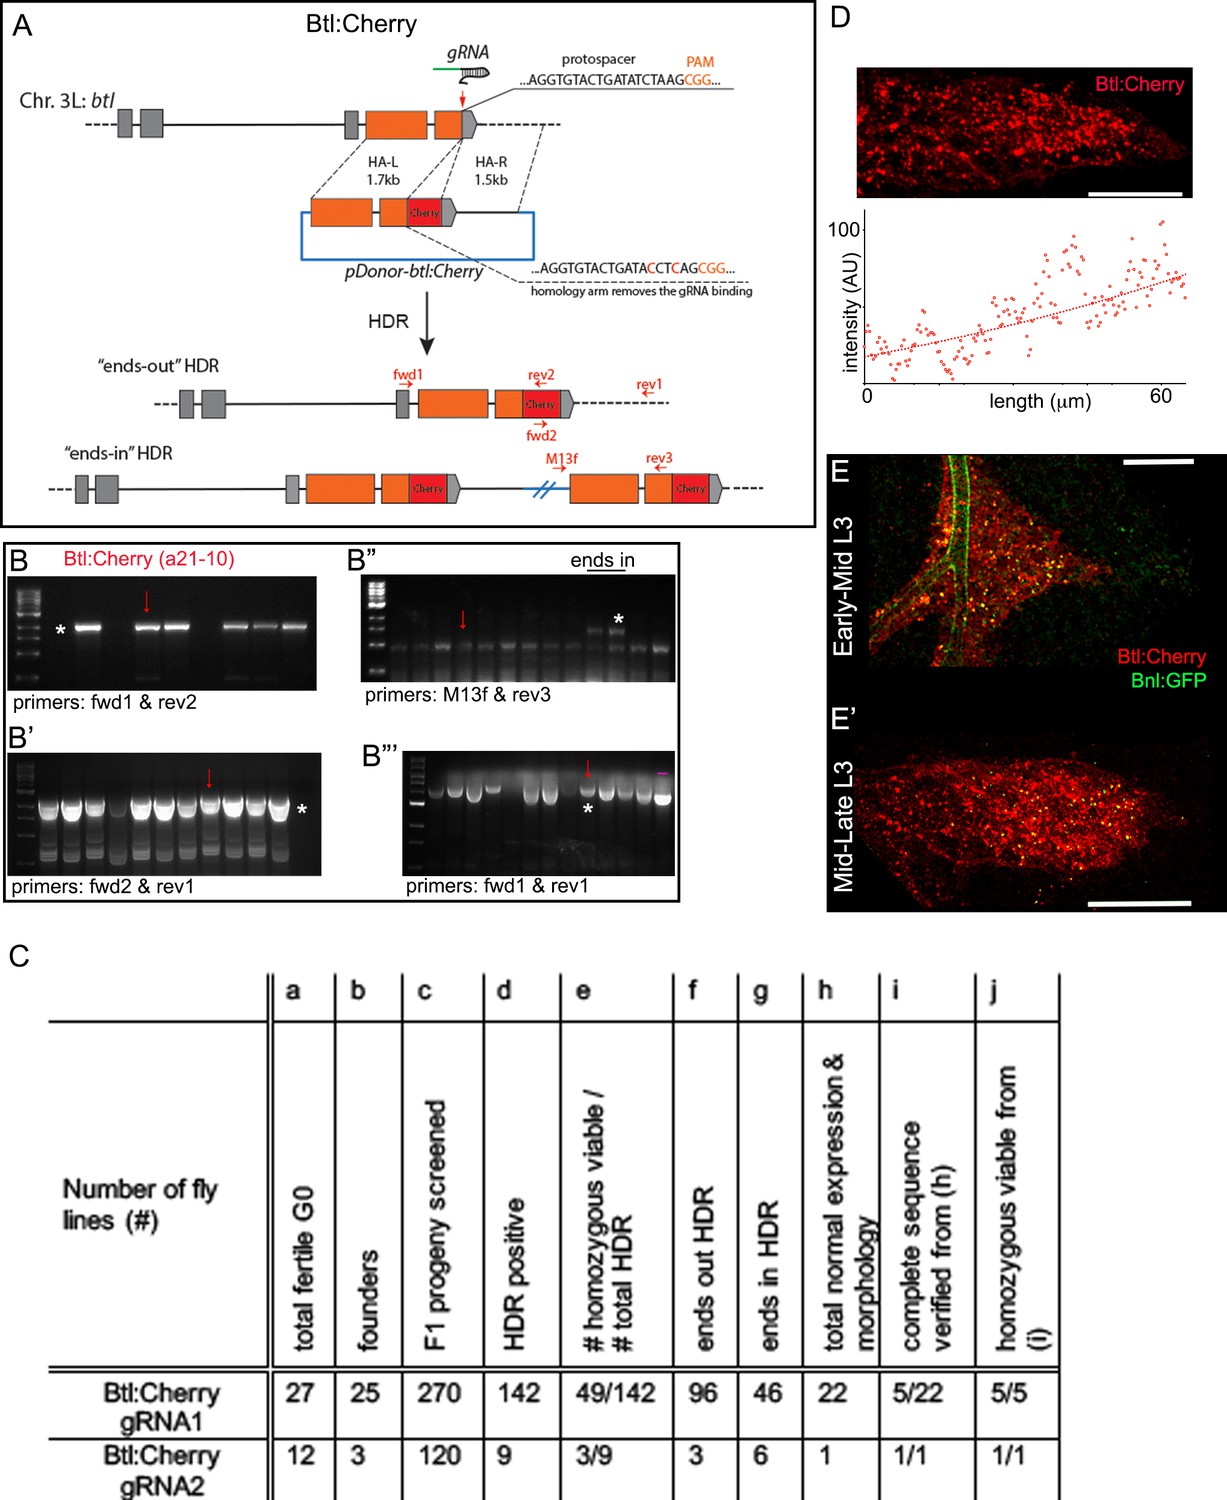
Generating genome-edited flies harboring a btl:cherryendo allele.
(A) Scheme for CRISPR/Cas9-based generation of btl:cherryendo allele and two possible outcomes from the HDR; orange box, coding exon; grey box, non-coding exon; line, introns; red vertical arrow, approximate gRNA target site; horizontal red arrows, approximate primer binding sites. (B-B’’’) Representative agarose gel pictures from CRISPR screening, showing examples of PCR-amplified products obtained from the genomic DNA (gDNA) of putative ‘ends-out’ and ‘ends-in’ HDR; red arrow, amplicons from line a21-10 used in this study; markers, 1 kb DNA ladder from NEB; (B) PCR amplification product (*) obtained from the gDNA of different lines using primers fwd1-rev2 identified the positive HDR harboring mCherry sequence; (B’) HDR positive lines identified using PCR primers fwd1-rev2 were reconfirmed by performing another PCR using fwd2-rev1 primers; *, the expected band; (B’’) The HDR positive lines identified in B and B’ steps were subjected to PCR screen with M13F and rev3 primers; amplification of a large product (*) indicated unintended ‘ends-in’ HDR lines; two ends-in lines were shown in the gel; (B’’’) The putative ‘ends-out’ HDR lines from step B’’ were further confirmed with PCR amplification with fwd1-rev1, both of which anneal to the flanking gDNA regions outside of the inserted cassette; the intended ends-out HDR lines amplified a ~ 700 bp longer PCR product than the control amplicon derived from the parental gDNA (nos-Cas9 parental line); (B’’’) (-), negative control- PCR product amplified from the genomic DNA of nos-Cas9 parental line. (C) A table showing efficiency of generating btl:cherryendo lines using CRISPR/Cas9; numbers of HDR progenies in (d,f,g) were determined by PCR based screen as described in Materials and methods and in B-B’’’; gene expression in (h) was verified in the larval and embryonic trachea; normal morphology in (h) was verified in embryonic and larval tracheal branching and overall tissue morphology. (D) Btl:Cherry, expressed from the btl:cherryendo allele, marked the ASP membrane and formed a gradient (lower panel) along the D-P axis of ASP. (E,E’) Btl:Cherry bound Bnl:GFP gradient in early (E) and late (E’) stage ASP; genotype: bnl:gfpendo/btl:cherryendo. Scale bars, 30 μm.
Figure 2—figure supplement 2
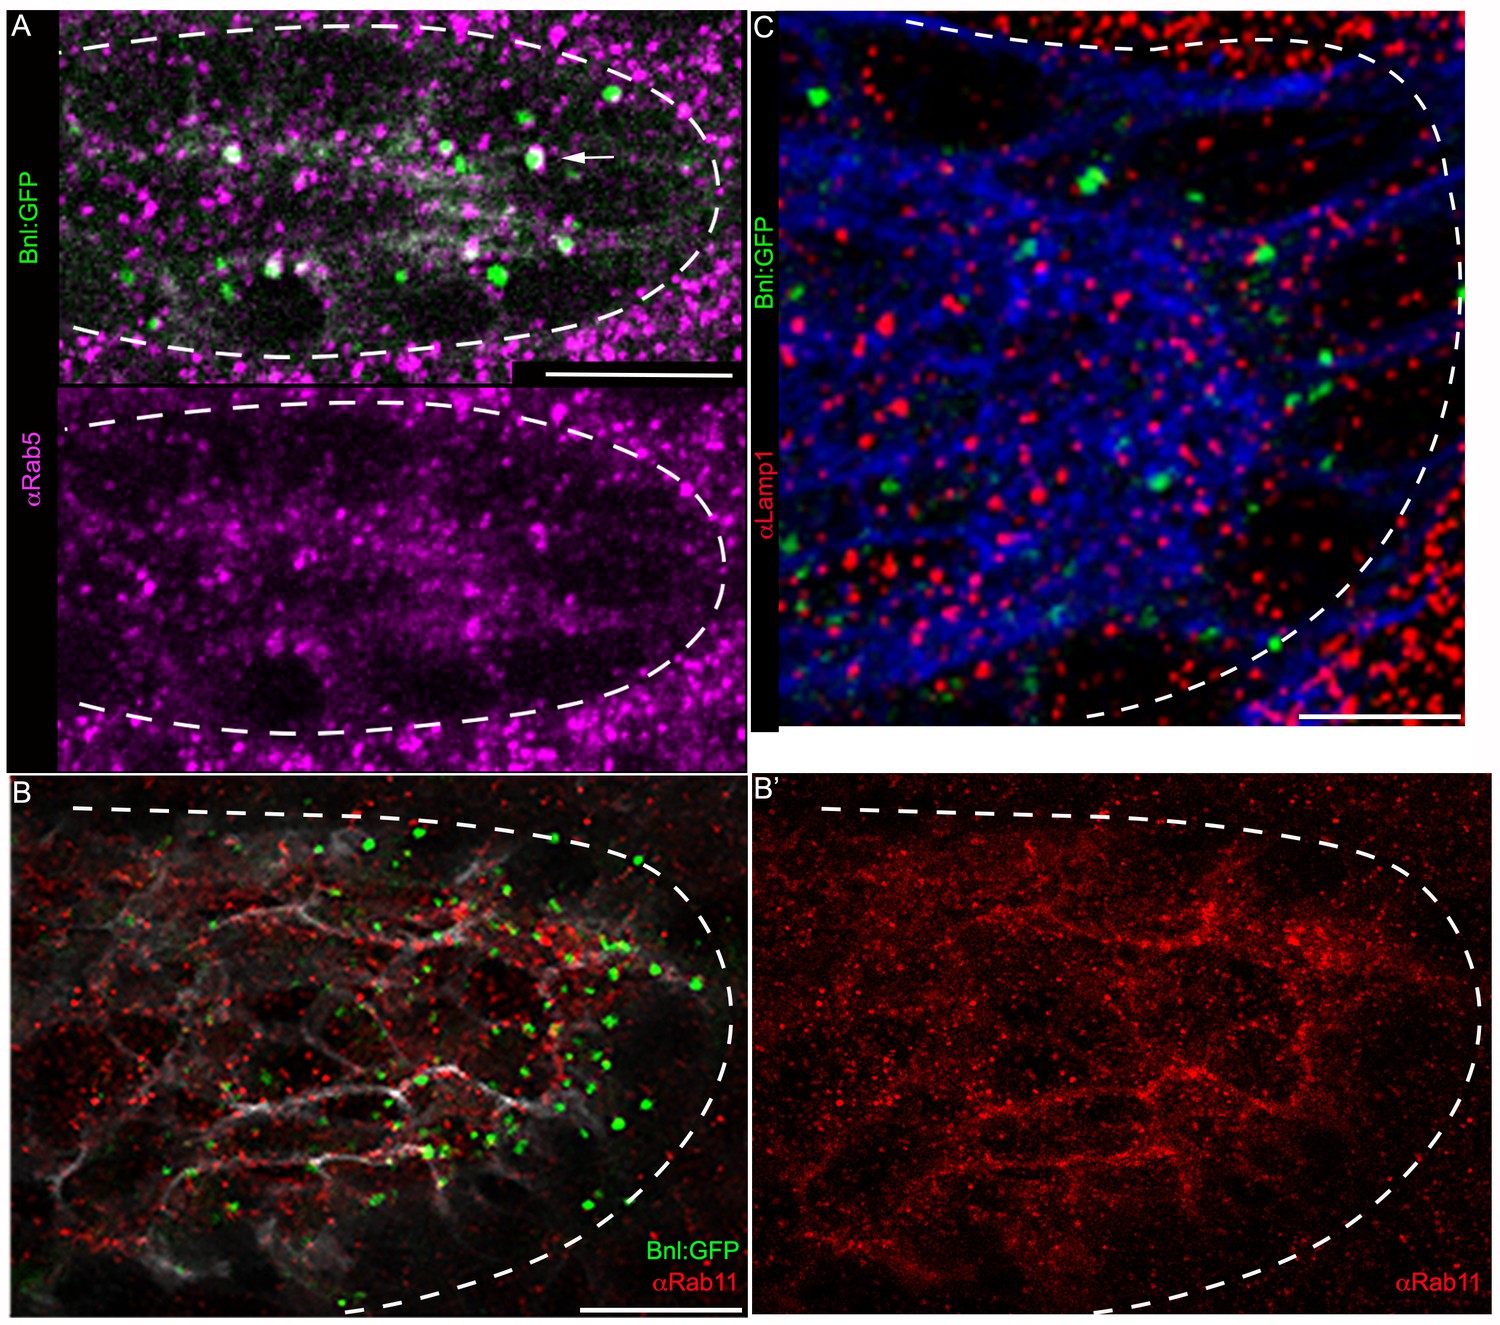
Intracellular distribution of the receptor-bound Bnl:GFP puncta.
(A) Bnl:GFP puncta colocalized with early endosomes (pink) recognized by αRab5 antibody (arrow); lower panel, showing only Rab5 (pink) distribution from merged channels in upper panel. (B,B’,C) Bnl:GFP puncta in the ASP did not colocalize with the recycling endosome marker, Rab11 (red, αRab11, B,B’), or the lysosome marker, Lamp1 (red, αLamp1, C). White dashed line, ASP outline. Scale bars, 10 μm.
Figure 3 with 3 supplements
ASP cells receive Bnl:GFP through Btl-containing cytonemes.
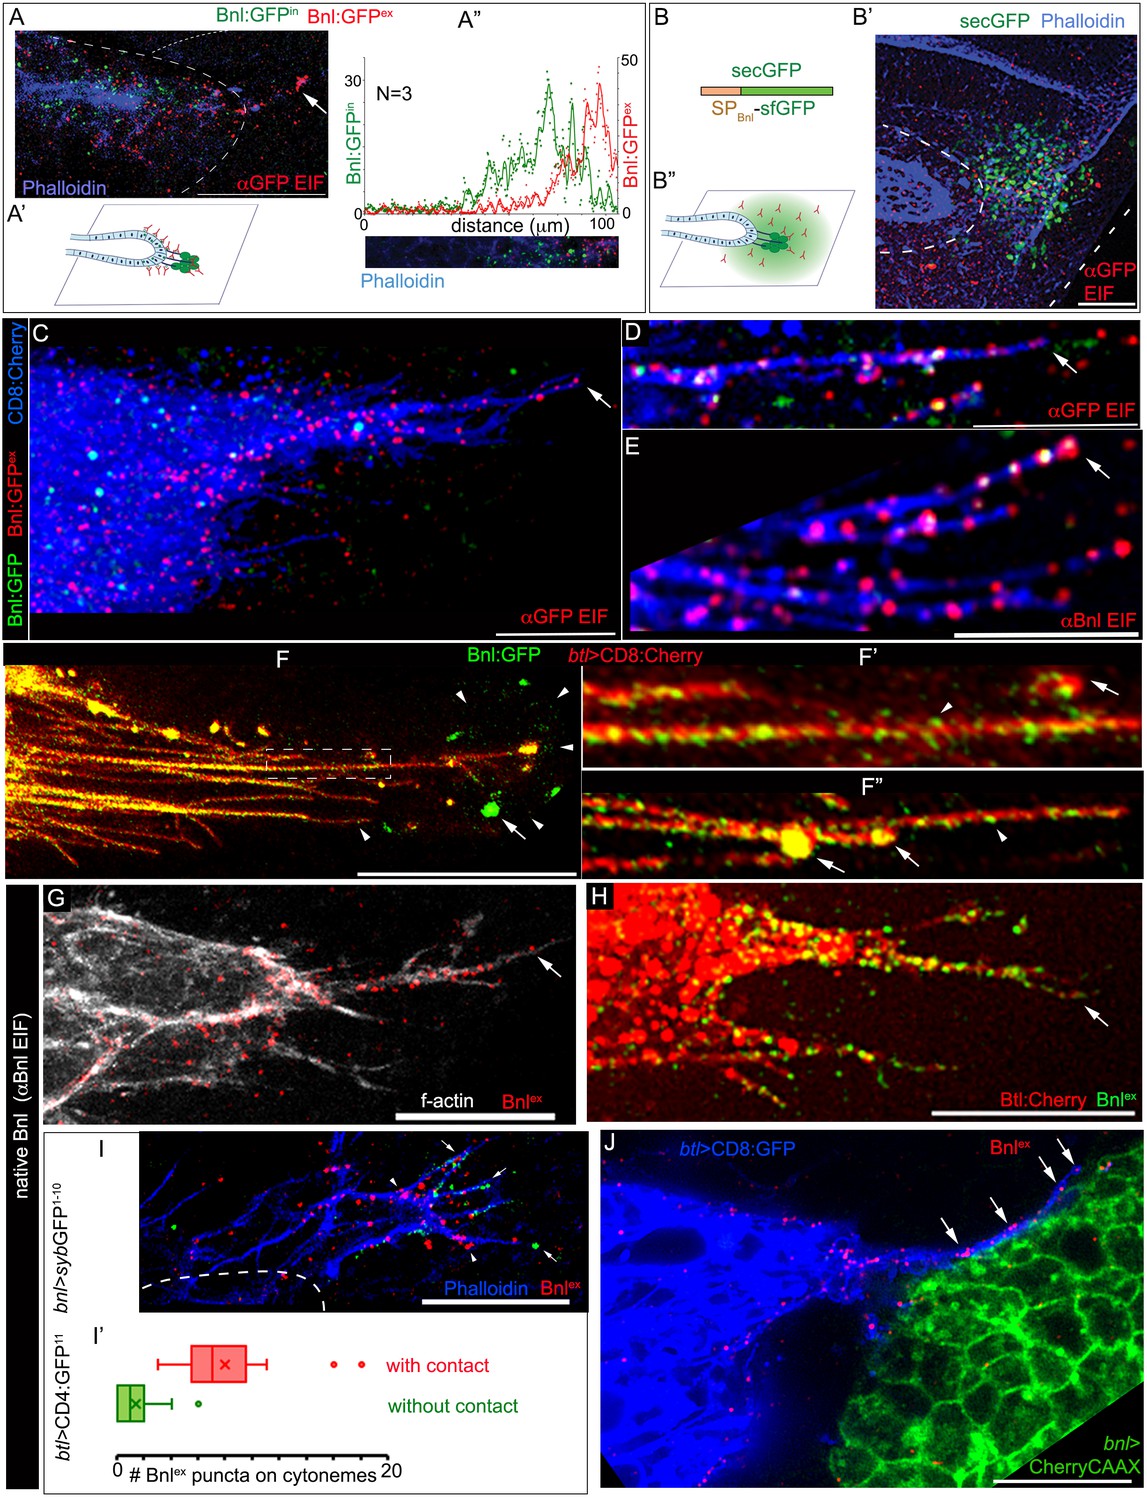
(A-A’’) An αGFP-based EIF assay under the detergent-free conditions (Materials and methods), identified externalized Bnl:GFP (red, Bnl:GFPex) that localized specifically on the surfaces of the ASP, actin-rich ASP protrusion (arrow), and, at a low level, on wing disc signal producing cells (area within the dotted line); (A’) concentration gradient of surface-localized Bnl:GFPex similar to that of the intracellular Bnl:GFPin along the D-P axis of the ASP (N = 3 independent samples); bright Bnl:GFPin puncta were unrecognized by the EIF method; EIF-stained Bnl:GFPex puncta (red) emitted poor GFP fluorescence. (B-B’’) Control experiment for (A), showing random non-specific distribution (red, αGFP EIF) of extracellular secreted-GFP (secGFP; drawing in B; Materials and methods) when expressed from the disc bnl-source (green; see Figure 3—figure supplement 1A); (A’,B’’) drawings explaining distribution patterns in A,B’ respectively; (A,B’) blue, phalloidin-Alexa-647 staining of f-actin marked cell outlines. (C–E) Bnl:GFPex puncta (red; arrow) localized on the surface of CD8:Cherry-marked cytonemes (blue) emanated from the ASP (btl-Gal4, UAS-CD8:Cherry/+; bnl:gfpendo); (C,D) αGFP-EIF; (E) αBnl-EIF. (F-F’) Enhanced-gain super-resolution images (Materials and methods), showing a sub-resolution distribution of faint Bnl:GFP molecules (nanopuncta) in live CD8:Cherry-marked ASP and ASP cytonemes (see Figure 3—figure supplement 2A–B’); genotype: btl-Gal4, UAS-CD8:Cherry/+; bnl:gfpendo; (F’) zoomed-in area indicated by the ROI box in (F); (F’’) cytonemes from a different sample showing difference of nano-puncta (arrowheads) and large puncta representing clusters (arrow) of nano-puncta. (G) An αBnl EIF showing biased distribution of the native externalized Bnl puncta (Bnlex, arrow) in wild type (w-) background; grey, phalloidin-Alexa-647. (H) Bnlex puncta colocalized with endogenous Btl:Cherry on cytonemes extended from the btl:cherryendo ASP. (I,I’) Comparison of Bnlex (αBnl EIF, red; arrowhead) localization on the actin-rich ASP cytonemes (blue, phalloidin-Alexa 647) with and without a direct contact (green dots, arrow) with the disc bnl-source; genotype: btl-Gal4/lexO-nsyb:GFP1-10, UAS-CD4:GFP11; bnl-LexA/+; (I’) a graph showing the comparative numbers; N = 14 ASP; p<0.0001 (two-tailed t-test). (J) A high-resolution image showing contacts between the ASP cytronemes (blue) and wing disc source (green) and enrichment of native externalized Bnl (red; Bnlex, detected with αBnl EIF) at these contact points; genotype: btl-Gal4, UAS-CD8:GFP/+; bnl-LexA, lexO-CherryCAAX/+. Scale bars, 20 μm.
-
Figure 3—source data 1
Numerical data for measuring and plotting intensity profiles of Bnl:GFPex (αGFP EIF) in Figure 3A”.
- https://doi.org/10.7554/eLife.38137.022
-
Figure 3—source data 2
Numerical data for comparing the numbers of Bnlex puncta on cytonemes with and without a direct contact with the disc bnl source in Figure 3I’.
- https://doi.org/10.7554/eLife.38137.023
Figure 3—figure supplement 1
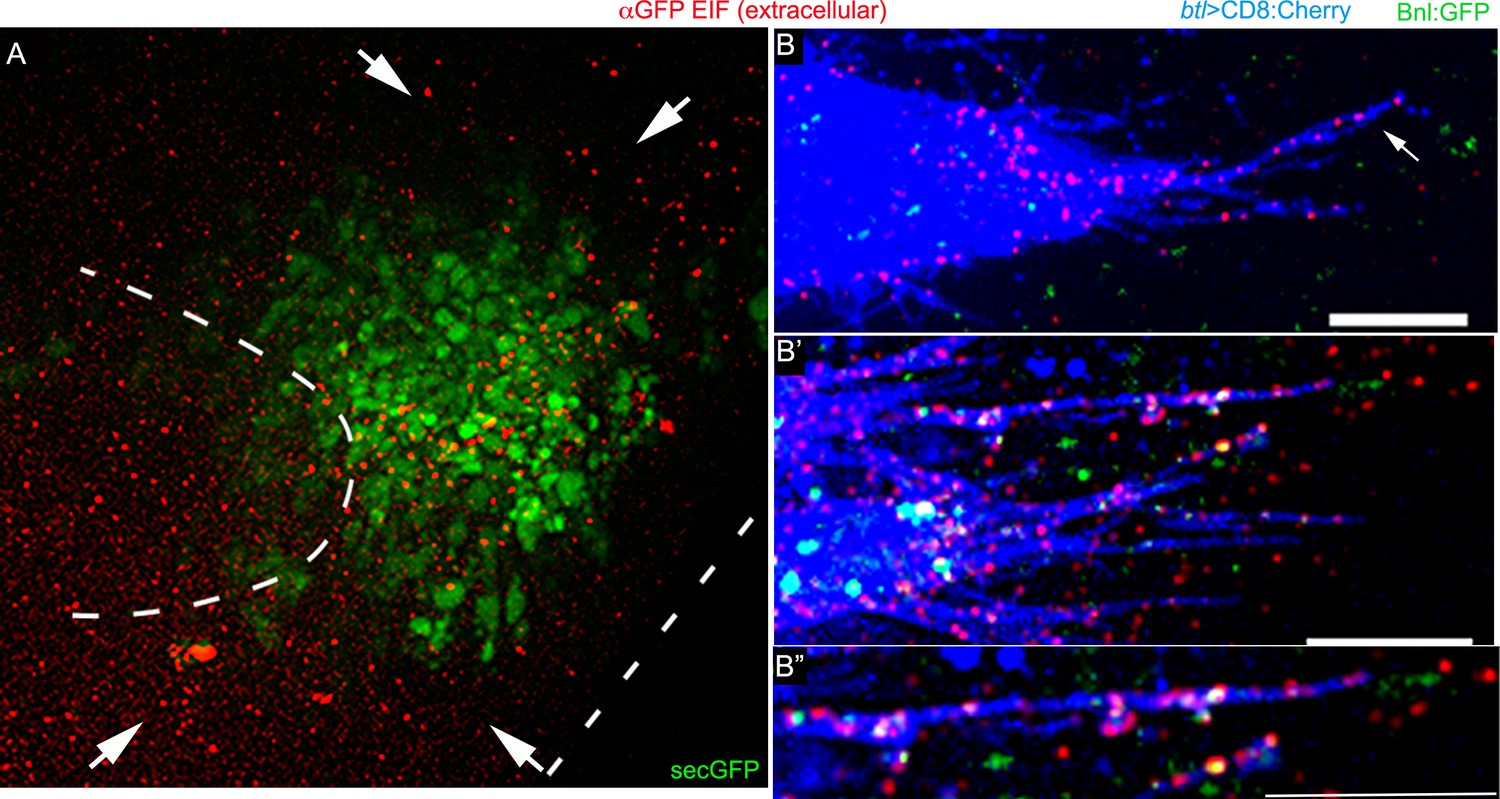
Cytoneme-mediated Bnl:GFP transport.
(A) green and red channels of Figure 3B’, showing αGFP EIF staining of a secGFP construct expressed from the bnl-source; red extracellular signal shows random distribution. (B-B’’) Examples of αGFP EIF-probed Bnl:GFPex (red) on the surfaces of CD8:Cherry (blue)-marked cytonemes (btl-Gal4, UAS-CD8:Cherry/+; bnl:gfpendo); note that only some of the Bnl:GFPex on cytonemes were detected with GFP-fluorescence; (B’’) zoomed in image of one cytoneme from B’. Scale bars, 20 μm.
Figure 3—figure supplement 2
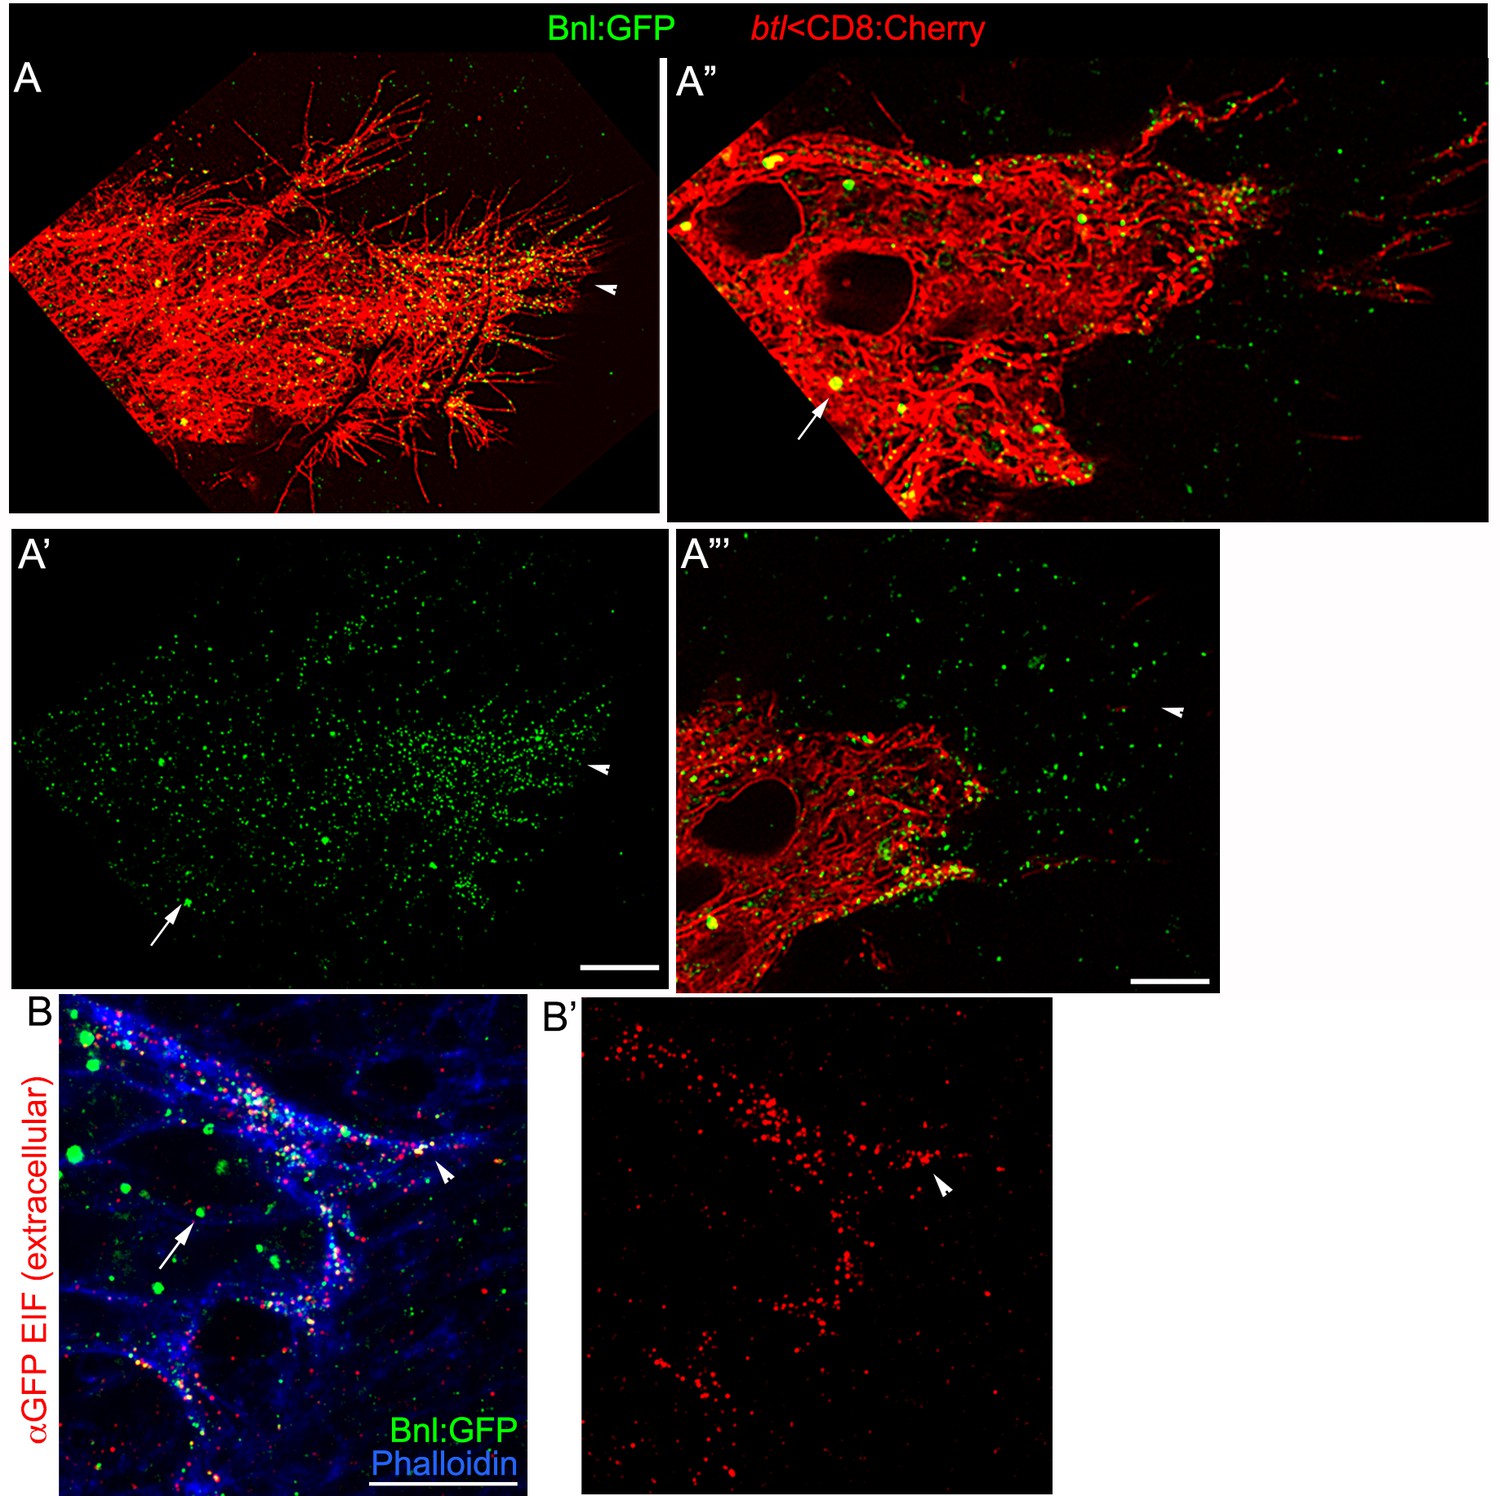
Distribution of Bnl:GFP on cytonemes and cell surfaces.
(A-A’’’) Bnl:GFP nanopuncta (<200 nm diameter; arrowhead) on ASP (A,A’), cytonemes (A,A’’), and the source cells (A”’); intracellular Bnl:GFP puncta (arrow) are larger in diameter (>500 nm diameter). (B,B’) αGFP EIF stain (red signal) recognized Bnl:GFP nanopuncta on the cell surface detected by super-resolution imaging; blue, phalloidin-Alexa 647 marks the ASP outline. All panels, only the selected Z-sections are shown. All samples, fixed tissues.Genotypes: (A-A’’’) btl-Gal4, UAS-CD8:Cherry/+; bnl:gfpendo; (B,B’) bnl:gfpendo. Scale bars, 10 μm; 5 μm (A”,A”’).
Figure 3—figure supplement 3
Live imaging of Bnl:GFP and Btl:Cherry on cytonemes.
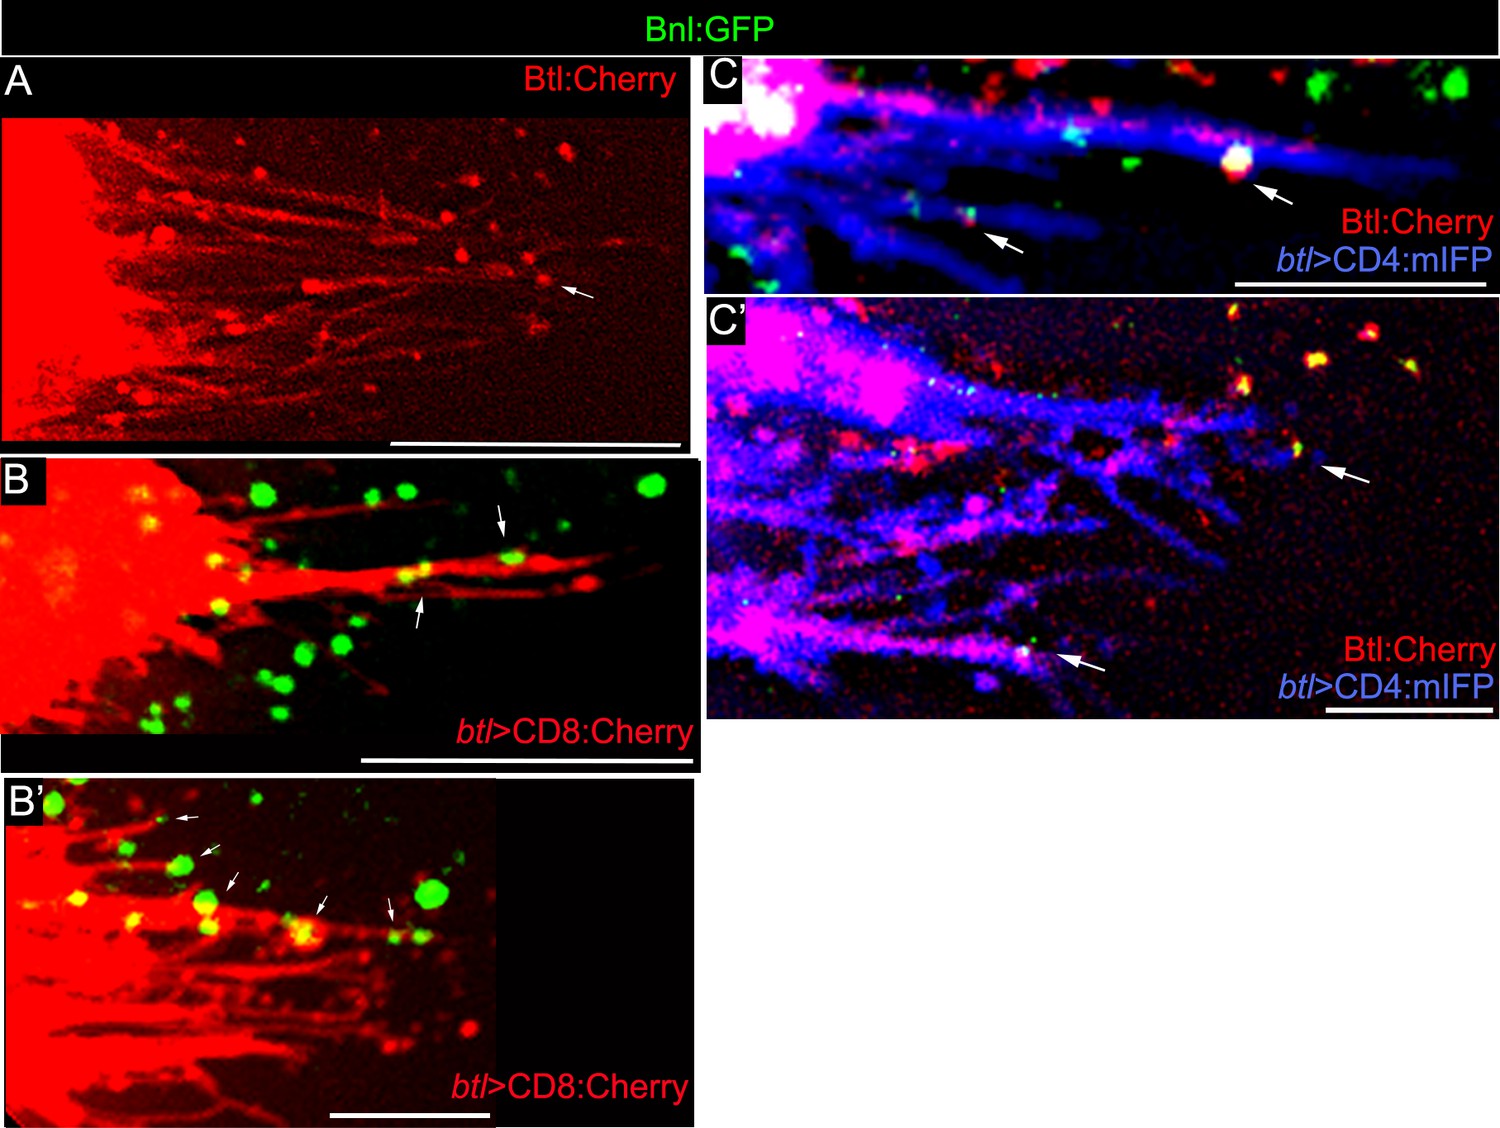
(A) Endogenous Btl:Cherry marked the ASP cytonemes; Genotype: btl:cherryendo. (B,B’) CD8:Cherry-marked cytonemes localized Bnl:GFP (arrow); (B) upper layer; (B’) lower layer; Genotype: btl-Gal4, UAS-CD8:Cherry/+; bnl:gfpendo. (C,C’) CD4:mIFP-marked cytonemes with colocalized Btl:Cherry and Bnl:GFP puncta (arrow); genotype: btl-Gal4, UAS-CD4:mIFP/+; bnl:gfpendo/btl:cherryendo. All samples, Z projected image; Scale bars, 20 μm.
Figure 4 with 1 supplement
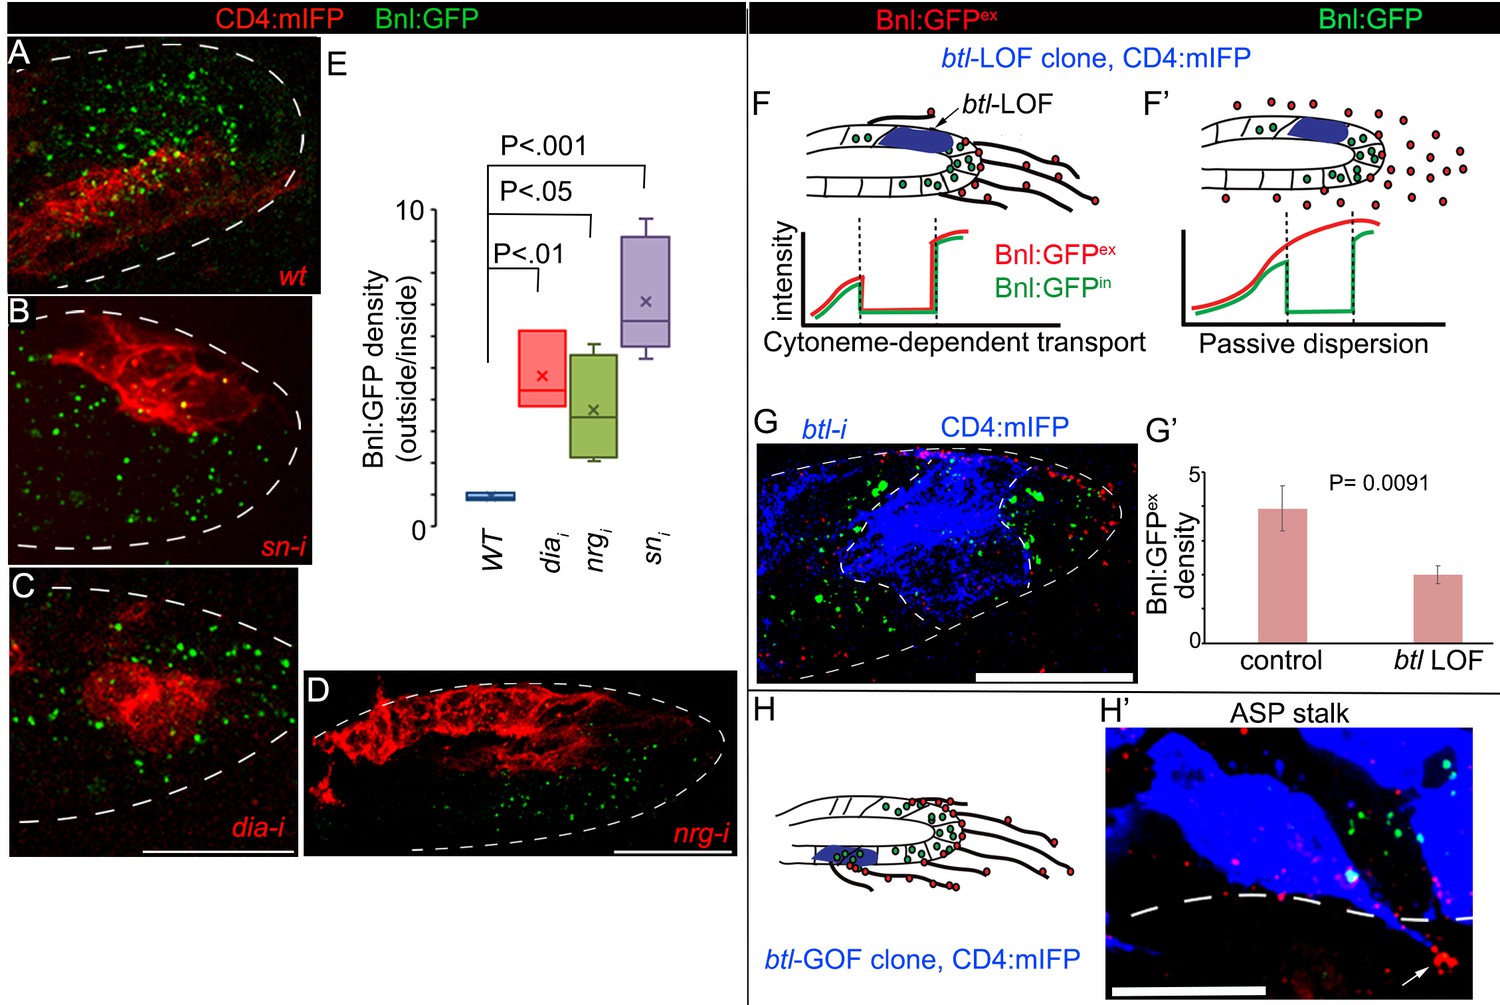
Cytonemes are essential for tissue-specific Bnl:GFP gradient profile.
(A-D) Representative images of Bnl:GFP uptake in CD4:mIFP-marked (red) clones in the ASP: (A) wt; (B) snRNAi, (C) diaRNAi; (D) nrgRNAi. (E) A box plot comparing the ratios of Bnl:GFP concentration outside (unmarked WT area) to inside (marked mutant area) of the CD4:mIFP-marked cytoneme-deficient mutant clones, expressing either diaRNAi (N = 3), nrgRNAi (N = 4), or snRNAi (N = 6) with that of the control marked WT clones (N = 3); P values, two-tailed t-test. (F,F’) Schematic models predicting differences expected in distribution patterns of EIF-stained Bnl:GFPex (red) on btl LOF clones (blue) either in diffusion-based (F’) or cytoneme-dependent (F) Bnl:GFP transport mechanism. Intracellular Bnl:GFP (green, Bnl:GFPin) level is expected to be reduced in both modes of signal transport. (G) Representative image showing autonomous loss of distribution of Bnl:GFPex (red, αGFP EIF-stained) in CD4:mIFP-marked (blue) btl LOF (btlRNAi) clone. (G’) Plot comparing relative Bnl:GFPex (red) density inside (mutant area) versus outside (WT area, control) of btl LOF clones (N = 3 independent ASPs); P values, two-tailed t-test. (H,H’) Representative image showing enrichment of αGFP EIF stained Bnl:GFPex (red) on long cytonemes (arrow) projected from btlGOF clones in the ASP stalk. Genotypes: hs-FLP/+; btl>y+>Gal4/+; UAS-CD4:mIFP, bnl:gfpendo/+ (A) or UAS-‘x’-RNAi (B–G) or UAS-btl (H’). Scale bars, 30 μm.
-
Figure 4—source data 1
Numerical data for measuring the ratio of Bnl:GFP concentration outside:inside of the marked clones in Figure 4E.
- https://doi.org/10.7554/eLife.38137.027
-
Figure 4—source data 2
Numerical data for measuring Bnl:GFPex levels between btl LOF clones and the neighboring wt area in Figure 4—figure supplement 1G’.
- https://doi.org/10.7554/eLife.38137.028
-
Figure 4—source data 3
Numerical data for measuring the relative Bnl:GFPex density in btl GOF clones and the neighboring wt area in Figure 4—figure supplement 1B.
- https://doi.org/10.7554/eLife.38137.029
Figure 4—figure supplement 1
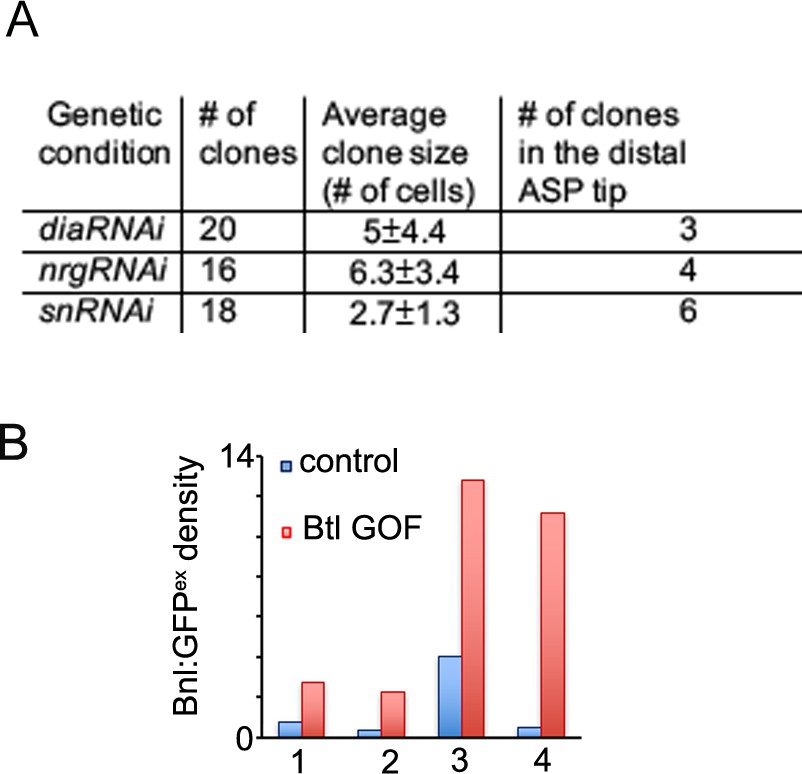
Cytonemes are essential for Bnl:GFP gradient.
(A) Table showing numerical data of clonal analyses for dia, nrg, and sn knockdown within the ASP. (B) Bar graphs comparing relative Bnl:GFPex (red) density inside versus outside (WT control, blue) of four different clones overexpressing Btl (btl GOF) in the ASP stalk region; each clone is from an independent biological sample.
Figure 5 with 1 supplement

A graded pattern of cytoneme formation in the ASP.
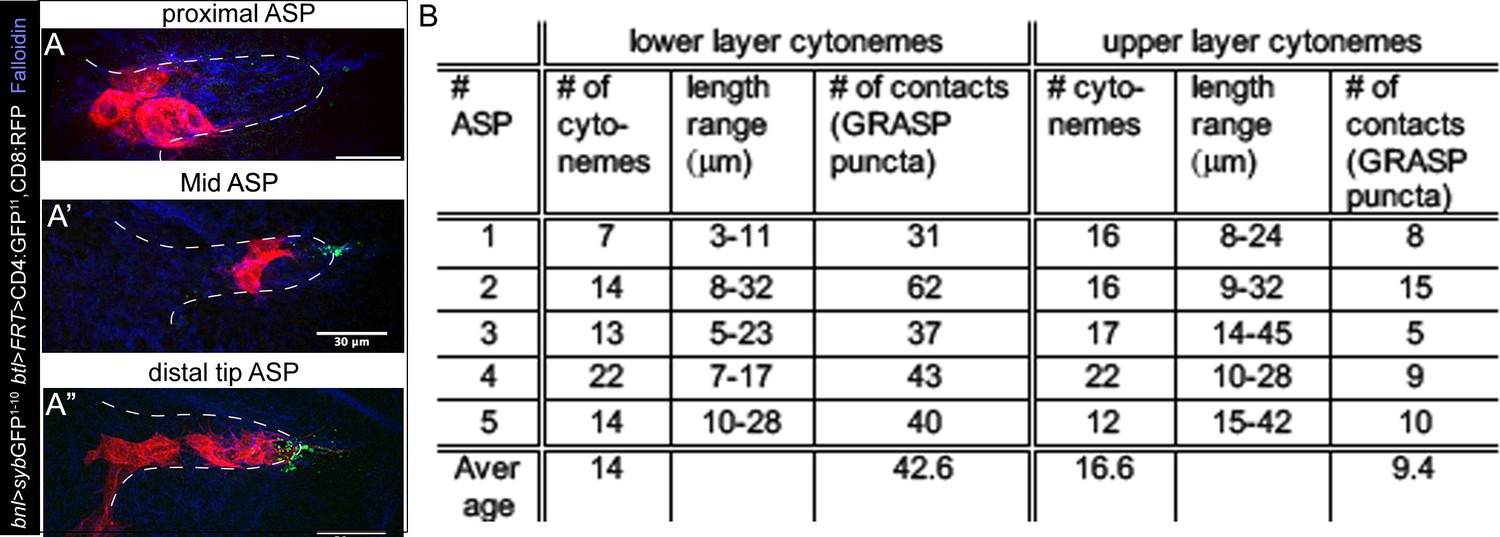
(A-C) Live images of ASPs showing variability in the number of long, oriented cytonemes emanating from the CD8:GFP-marked clones located in different ASP zones: (A) proximal stalk (>7th cells from distal tip of 12 cell long D-P axis); (A’) mid-region (4th-7th cells along the D-P axis); (A’’) distal tip (1st-3rd cells along D-P axis); red, btl>RFPmoe; lower panels, drawing showing approximate location of the clones and the corresponding cytoneme patterns, dashed line, bnl-source; (B) graphs comparing the number of long (>15 μm) and short (<15 μm) cytonemes from clones in the distal tip (N = 8), mid (N = 5), and proximal (N = 6) regions in the ASP; (C) rose plots comparing number and orientation of cytonemes of different lengths emanated from CD8:GFP-marked clones at distal tip-to-mid region (1st-7th cell along D-P; N = 7) and proximal stalk (>7 cells away from distal tip along D-P axis; N = 11) of the ASP; genotype: hs-FLP/+; UAS-mCD8:GFP/+; btl>y+>Gal4, btl-mRFP1moe/+. (D-D’’) Clones of cells expressing CD8:RFP and CD4:GFP11 from tip-, mid-, and stalk- region of the ASP established variable number of contacts with sybGFP1-10 expressing disc bnl-source; green puncta, GFP-reconstitution signal representing contact sites between the ASP cells and the source; (D’’) plots comparing the number of contacts established by cells from different regions of the ASP with the disc bnl source; blue, phalloidin-Alexa 647; genotype: hs-FLP/+; btl>y+>Gal4/lexO-nsyb:GFP1-10, UAS-CD4:GFP11; bnl-LexA/UAS-CD8:RFP. All panels except D-D’’, live imaging. Scale bars, 30 μm.
-
Figure 5—source data 1
Numerical data for the number of long (>15 μm) and short (<15 μm) cytonemes from wt clones in different regions of the ASP in Figure 5B.
- https://doi.org/10.7554/eLife.38137.032
-
Figure 5—source data 2
Numerical data for the number of cytonemes oriented in different directions from wt clones in Figure 5C.
- https://doi.org/10.7554/eLife.38137.033
-
Figure 5—source data 3
Numerical data for comparing the number of contacts established by cytonemes emanated from clones at different regions of the ASP in Figure 5D”.
- https://doi.org/10.7554/eLife.38137.034
Figure 5—figure supplement 1
A graded pattern of cytoneme contacts.
(A-A’’) Representative examples of clonal sybGRASP analyses to assess the number of contact sites (green) established by different parts (A, proximal; A’, mid; A’’, distal tip) of the ASP with the disc bnl-source; red, randomly localized ASP clones co-expressing CD8:RFP and CD4:GFP11; bnl-source expressing nsyb:GFP1-10 (hs-FLP/+; btl>y+>Gal4/lexO-nsyb:GFP1-10, UAS-CD4:GFP11; bnl-LexA/UAS-CD8:RFP). (B) Frequency of cytoneme-mediated contacts established by upper and lower layers of the ASP with the bnl-source; genotype: btl-Gal4, UAS-CD8:Cherry/LexO-syb:GFP1-10, UAS-CD4:GFP11; bnl-LexA/+ (see Videos 3 and 5). Scale bars, 30 μm.
Figure 6 with 2 supplements
Bnl:GFP acts as a morphogen to activate concentration-dependent gene expression.
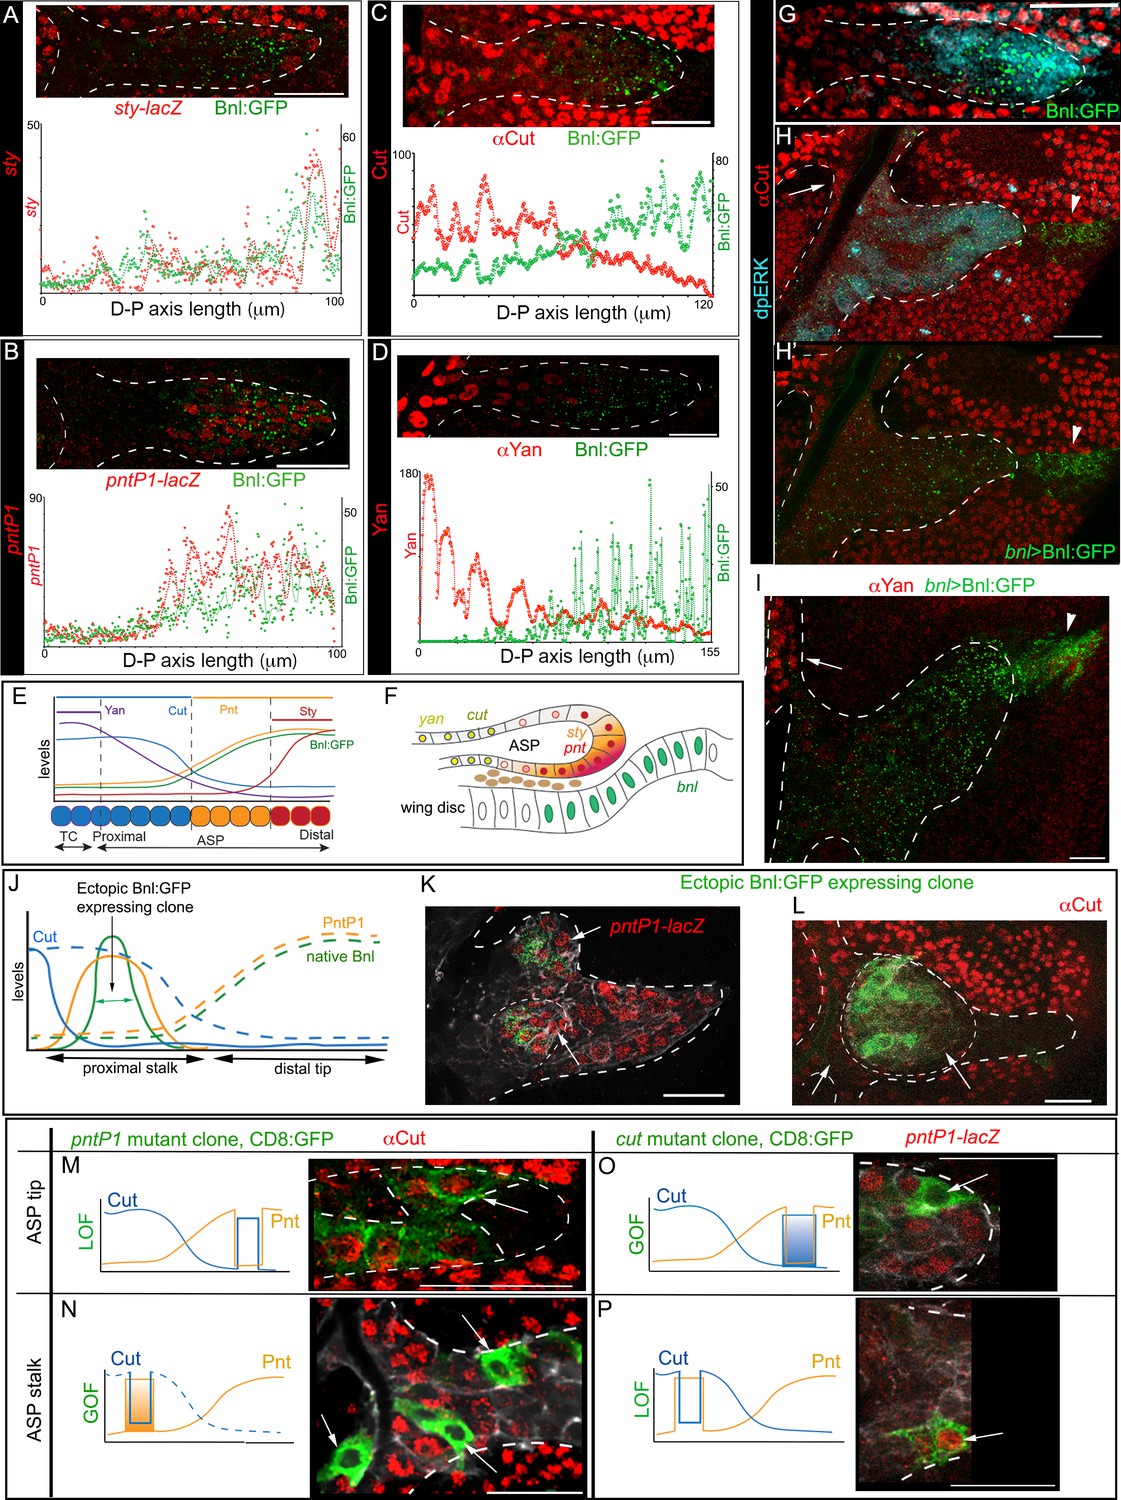
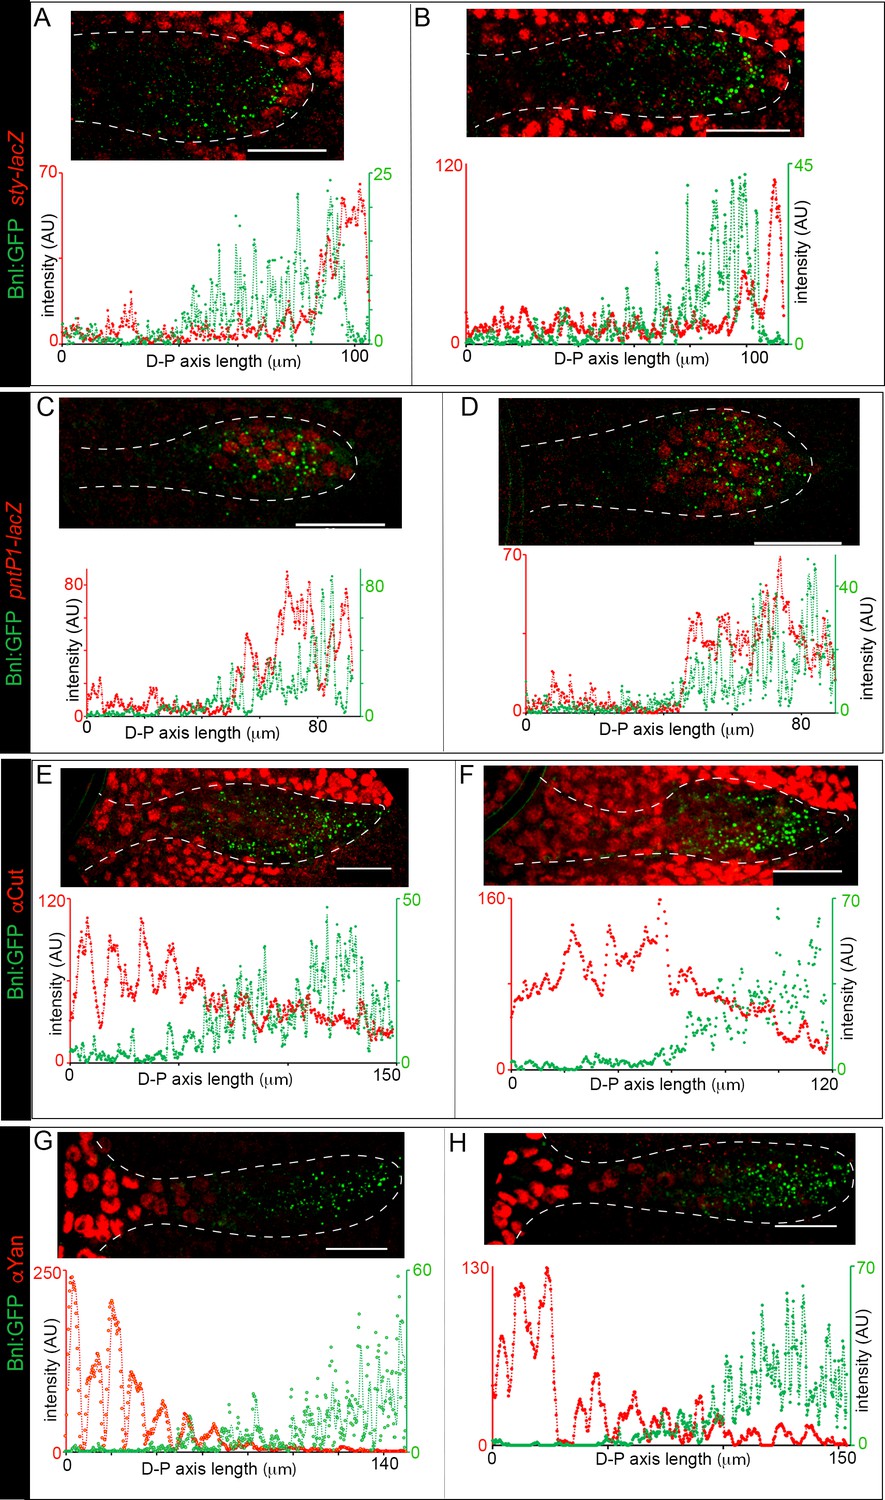
(A-D) Representative images showing correlation of the Bnl:GFP gradient with spatial expression domains (red) of sty (A; sty-lacZ), pntP1 (B; pntP1-lacZ), cut (C; αCut), and yan (D; αYan); lower panels, intensity plots along the D-P axis of the ASP. (E) Drawing depicting the expression domains of sty, pntP1, cut, and yan within 1st-3rd, 1st-7th, 7th-14th, and 11th-14th cells, respectively, from the distal tip of a 14 cell long D-P axis of ASP including TC (2 cell wide). (F) Drawing of a sagittal section of an ASP depicting relative gene expression domains in Z axis (see Figure 6—figure supplement 1C). (G) Correlation of spatial range of endogenous Bnl:GFP gradient with induction of pMAPK signaling (α-dpERK, blue) and Cut expression (α-Cut, red). (H–I) Overexpression of Bnl:GFP from the disc bnl-source (arrowhead) expanded the range of Bnl:GFP and pMAPK signaling (H,H’) to the ASP stalk, suppressing/retracting the cut (H, arrow) and yan (I, arrow) domains to the farthest part that received little or no Bnl:GFP (arrow; red). (J) A hypothetical expression pattern (solid lines) of PntP1 (orange) and Cut (blue) induced by an ectopic Bnl:GFP (green) expressing clone in the ASP stalk; dashed lines, original native Bnl, PntP1, and Cut expression pattern. (K,L) Small Bnl:GFP overexpressing clones (green) at the ASP stalk non-autonomously suppressed cut (L; red; arrow), induced pntP1 (K; red; arrow), and organized the surrounding cells to induce ectopic branch (dashed outlines); genetic crosses: hs-FLP; btl>y+>Gal4, btl-mRFP1moe X UAS-Bnl:GFP (L), or UAS-Bnl:GFP; pntP1-lacZ/TM6 (K). (M–P) Cut and PntP1 reciprocally antagonized each other’s expression (red); GOF/LOF, Gain/Loss of function; (M,N) hs-FLP; UAS-mCD8GFP; btl>y+>Gal4,btl-mRFP1moe X UAS-pntRNAi (M), or UAS-PntP1 (N); (O) hs-FLP; btl>y+>Gal4,btl-mRFP1moe X UAS-Cut, UAS-CD8:GFP; pntP1-lacZ/TM6; (P) hs-FLP; UAS-mCD8GFP; btl >y+>Gal4, btl-mRFP1moe X UAS-cutRNAi, pntP1-lacZ/TM6. (M,O) ASP tip/mid-region; (N,P) ASP stalk/TC region; LOF, RNAi-mediated knockdown; arrows, the intended GOF/LOF clones. (A–P) white dashed line, ASP or clone outlines. (C,G,H,H’,L,M,N) αCut; (A,B,K,O,P) anti-βGal for pntP1-lacZ (B,K,O,P) and sty-lacZ (A). Genotypes, see Materials and methods. Scale bars, 30 μm.
-
Figure 6—source data 1
Data for the intensity profile plots of Bnl:GFP and sty (sty-LacZ) in Figure 6A.
- https://doi.org/10.7554/eLife.38137.040
-
Figure 6—source data 2
Data for the intensity profile plots of Bnl:GFP and pntP1 (pntP1-LacZ) in Figure 6B.
- https://doi.org/10.7554/eLife.38137.041
-
Figure 6—source data 3
Data for the intensity profile plots of Bnl:GFP and cut (αCut) in Figure 6C.
- https://doi.org/10.7554/eLife.38137.042
-
Figure 6—source data 4
Data for the intensity profile plots of Bnl:GFP and yan (αYan) in Figure 6D.
- https://doi.org/10.7554/eLife.38137.043
-
Figure 6—source data 5
Numerical data of showing effects of bnl:gfp GOF clones in the ASP stalk in Figure 6K,L; Figure 6—figure supplement 1D.
- https://doi.org/10.7554/eLife.38137.044
-
Figure 6—source data 6
Numerical data of clonal analysis showing reciprocal inhibition of pntP1 and cut in the ASP in Figure 6M–P.
- https://doi.org/10.7554/eLife.38137.045
-
Figure 6—source data 7
Data for the additional intensity profile plots of Bnl:GFP and sty, pntP1, cut, and yan in Figure 6—figure supplement 2A–H
- https://doi.org/10.7554/eLife.38137.046
Figure 6—figure supplement 1
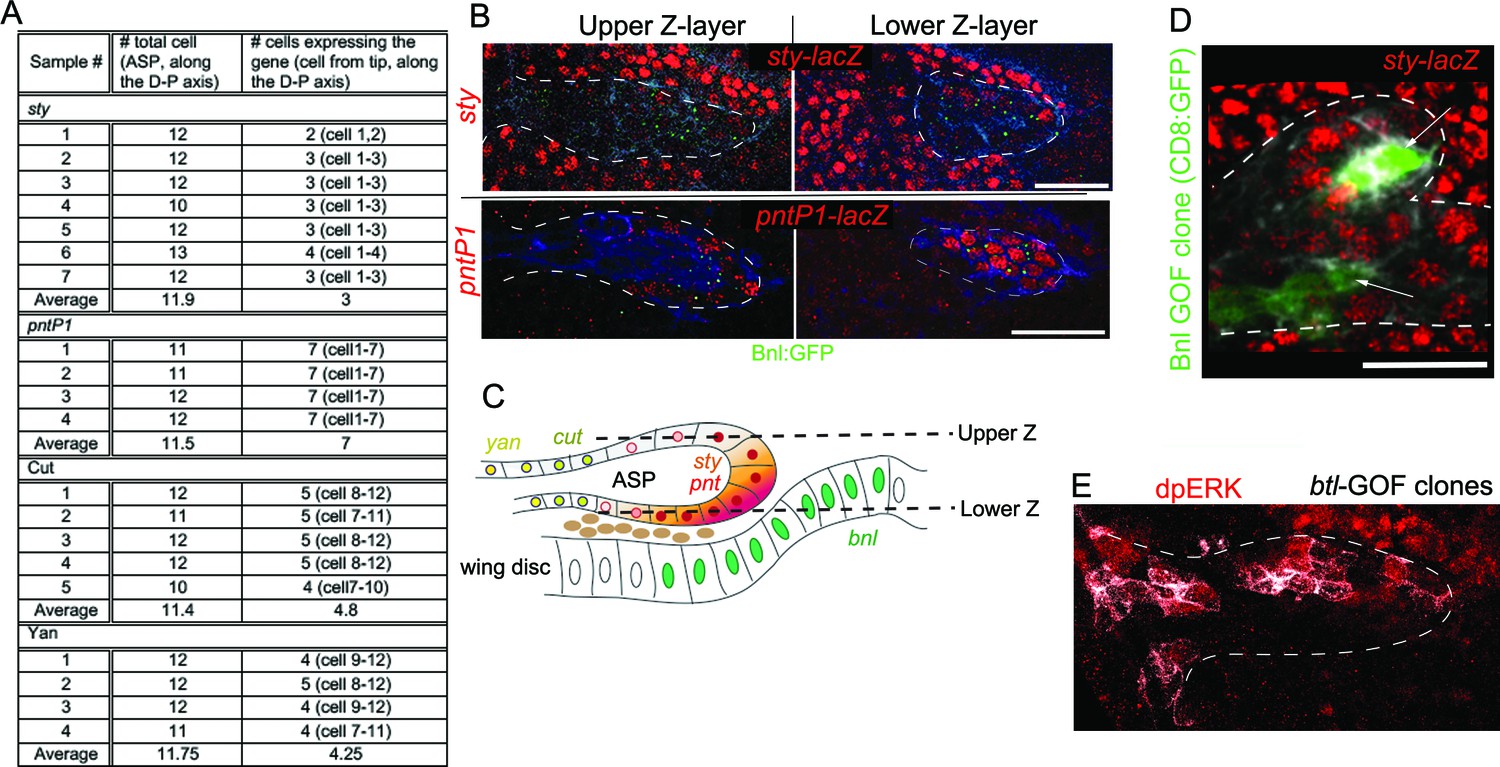
Bnl:GFP acts as a morphogen.
(A) Domains of sty, pntP1, cut, and yan expression in the ASP; cell numbers were determined along the longest D-P axis of the Z-projected ASP images. (B) Differential levels of expression of sty and pntP1 in the upper and lower Z sections of the ASP. (C) Schematic drawing explaining the results in B. (D) Small Bnl overexpressing clones (green, arrow) at the ASP stalk non-autonomously induced sty (red, sty-lacZ); genetic cross: hs-FLP; UAS-mCD8:GFP; btl>y+>Gal4, btl-mRFP1moe X UAS-Bnl; sty-lacZ/TM6. (E) Btl overexpression clones (white, pseudocolored) induced dpERK (red) signaling autonomously; genetic cross: hs-FLP; btl>y+>Gal4; UAS-CD4:mIFP, bnl:gfpendo X UAS-Btl. Scale bars, 30 μm.
Figure 6—figure supplement 2
Bnl:GFP acts as a morphogen.
(A-H) Examples from two independent biological samples showing correlation of the Bnl:GFP gradient with spatial expression domains (red) of sty (A,B; sty-lacZ), pntP1 (C,D; pntP1-lacZ), cut (E,F; αCut), and yan (G,H; αYan); lower panels, corresponding intensity plots along the D-P axis of the ASPs shown. Scale bars, 30 μm.
Figure 7 with 1 supplement
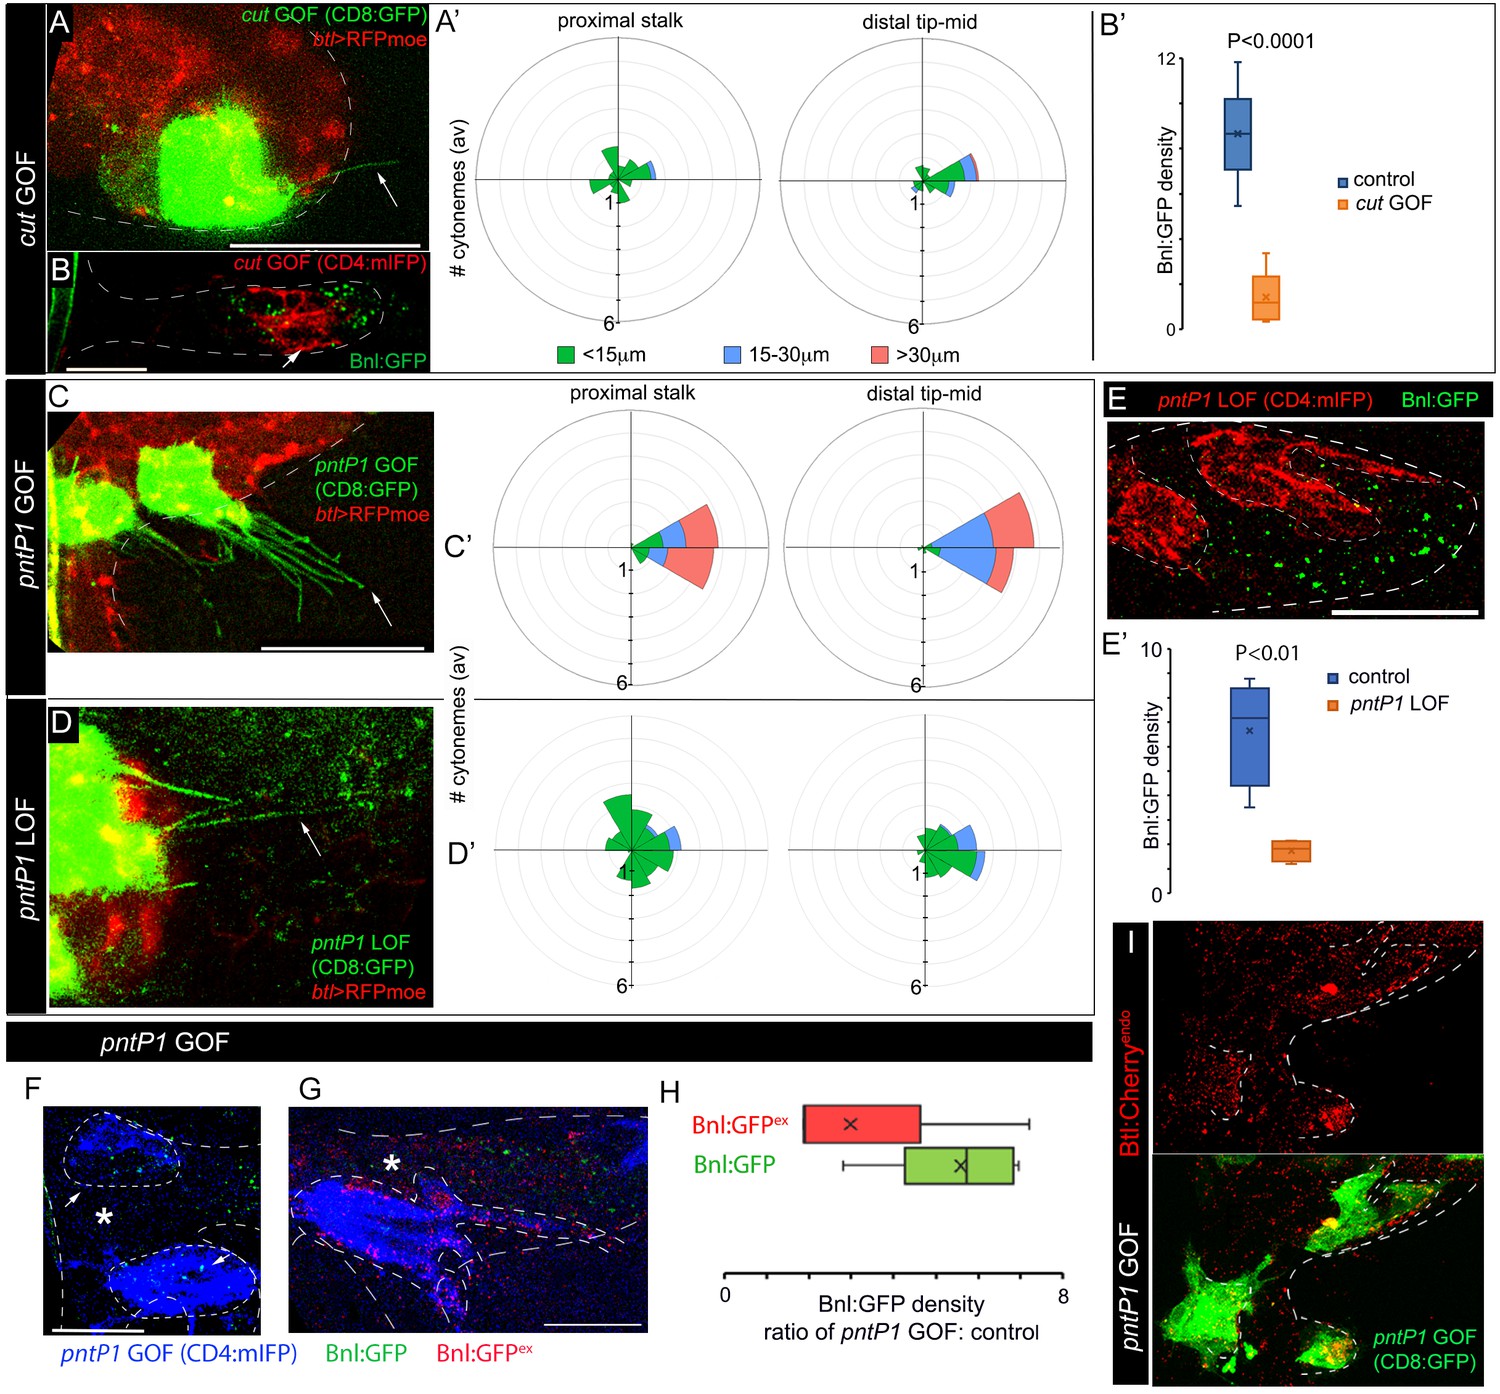
Positive and negative feedback regulations of cytoneme formation by differential levels of Bnl signaling.
(A,A’) CD8:GFP-marked cut-GOF clones at the ASP tip suppressed long oriented cytoneme (arrow) formation; A’, rose plots showing number and orientation of cytonemes of different lengths from distal tip (N = 12) and proximal stalk (N = 6) regions of the ASP. (B,B’) A cut-GOF clone (red, CD4:mIFP) suppressed Bnl:GFP uptake cell-autonomously; B’, A graph comparing Bnl:GFP concentration in cut-GOF clones and corresponding neighboring control area in the ASP (N = 6); p value, two-tailed t-test. (C,C’) pntP1-GOF clones induced long oriented cytonemes (arrow) at the ASP stalk; C’, rose plots showing number and orientation of cytonemes of different lengths from proximal (N = 5) and distal tip (N = 8) clones in the ASP. (D,D’) pntP1-LOF clones suppressed long oriented cytonemes (arrow) at the ASP tip; D’, rose plots showing number and orientation of cytonemes of different lengths from proximal stalk (N = 6) and distal tip (N = 11) clones in the ASP. (A,A’,C,C’,D,D’) see control in Figure 5A–C. (E,E’) A CD4:mIFP-marked pntP1-LOF clone at the ASP tip suppressed Bnl:GFP uptake; E’, plot comparing Bnl:GFP uptake in the pntP1 LOF clone and corresponding neighboring control area in the ASP (N = 4). (F) pnt-P1 GOF clones in the ASP stalk showed higher levels of Bnl:GFP in the clones compared to the WT neighboring area. (G) αGFP EIF showed high Bnl:GFPex on cytonemes and the clonal cell body on pnt-P1 GOF clones in the ASP stalk; (F,G) *, wt neighboring area. (H) A graph showing fold difference of Bnl:GFP and Bnl:GFPex density inside to outside (WT control area) of the pntP1 GOF clones (N = 5 each). (I) pntP1 GOF clones induced btl:cherryendo expression and polarized graded organization of Btl:Cherry molecules. Genotypes: (A,A’,C-D’) hs-FLP/+; UAS-mCD8:GFP/+; btl>y+>Gal4, btl-mRFP1moe/UAS-cut or -pntP1 or -pntRNAi; (B,B’,E-H) hs-FLP/+; btl>y+>Gal4/+; UAS-CD4:mIFP, bnl:gfpendo/UAS-cut or -pntRNAi or pntP1; (I) hs-FLP/+; btl>y+>Gal4/+; btl:cherryendo/UAS-pntP1, UAS-mCD8:GFP. Scale bars, 30 μm.
-
Figure 7—source data 1
Numerical data for the number of cytonemes oriented in different directions from various clones in Figure 7A’,C’,D’.
- https://doi.org/10.7554/eLife.38137.049
-
Figure 7—source data 2
Numerical data for measuring the Bnl:GFP concentration in cut-GOF clones and the neighboring control area in Figure 7B’.
- https://doi.org/10.7554/eLife.38137.050
-
Figure 7—source data 3
Numerical data for measuring the Bnl:GFP concentration in pntP1-LOF clones and the neighboring control area in Figure 7E’.
- https://doi.org/10.7554/eLife.38137.051
-
Figure 7—source data 4
Numerical data for comparing the Bnl:GFP and Bnl:GFPex concentrations in pntP1-GOF clones and WT neighbors in Figure 7H.
- https://doi.org/10.7554/eLife.38137.052
-
Figure 7—source data 5
Numerical data for the number of cytonemes oriented in different directions from the yan GOF clones in Figure 7—figure supplement 1A’,B’.
- https://doi.org/10.7554/eLife.38137.053
Figure 7—figure supplement 1
Yan negatively feedback regulates cytoneme numbers.
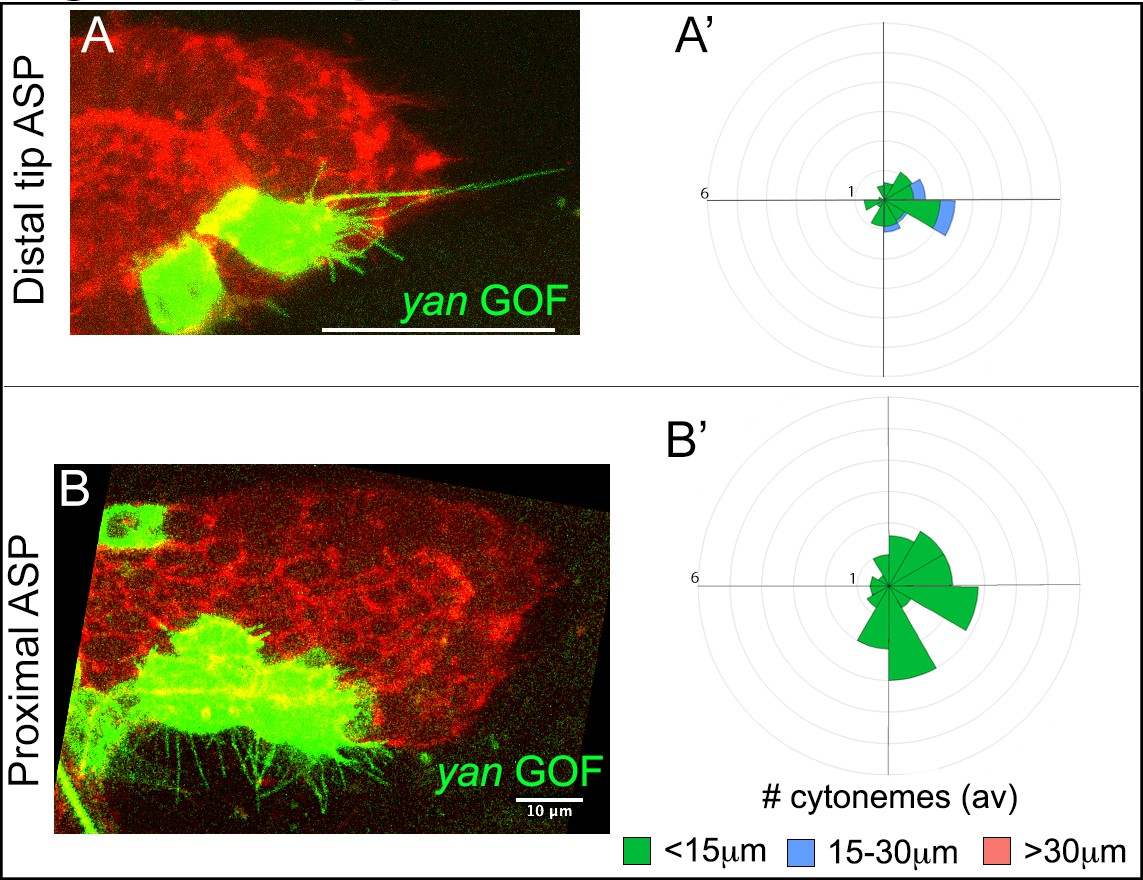
(A-B’) Examples of cytonemes from CD8:GFP-marked yan GOF clone at the tip (A) and the stalk (B) of the ASP; (A’,B’) respective R-plots indicating number and orientation of cytonemes of different lengths from the yan GOF clones. Genotype: hs-FLP/+; UAS-mCD8:GFP/+; btl>y+>Gal4, btl-mRFP1moe/UAS-yan. Scale bars, 30 μm unless otherwise labeled.
Figure 8
Feedback mechanisms regulating cytoneme-mediated Bnl gradient formation.
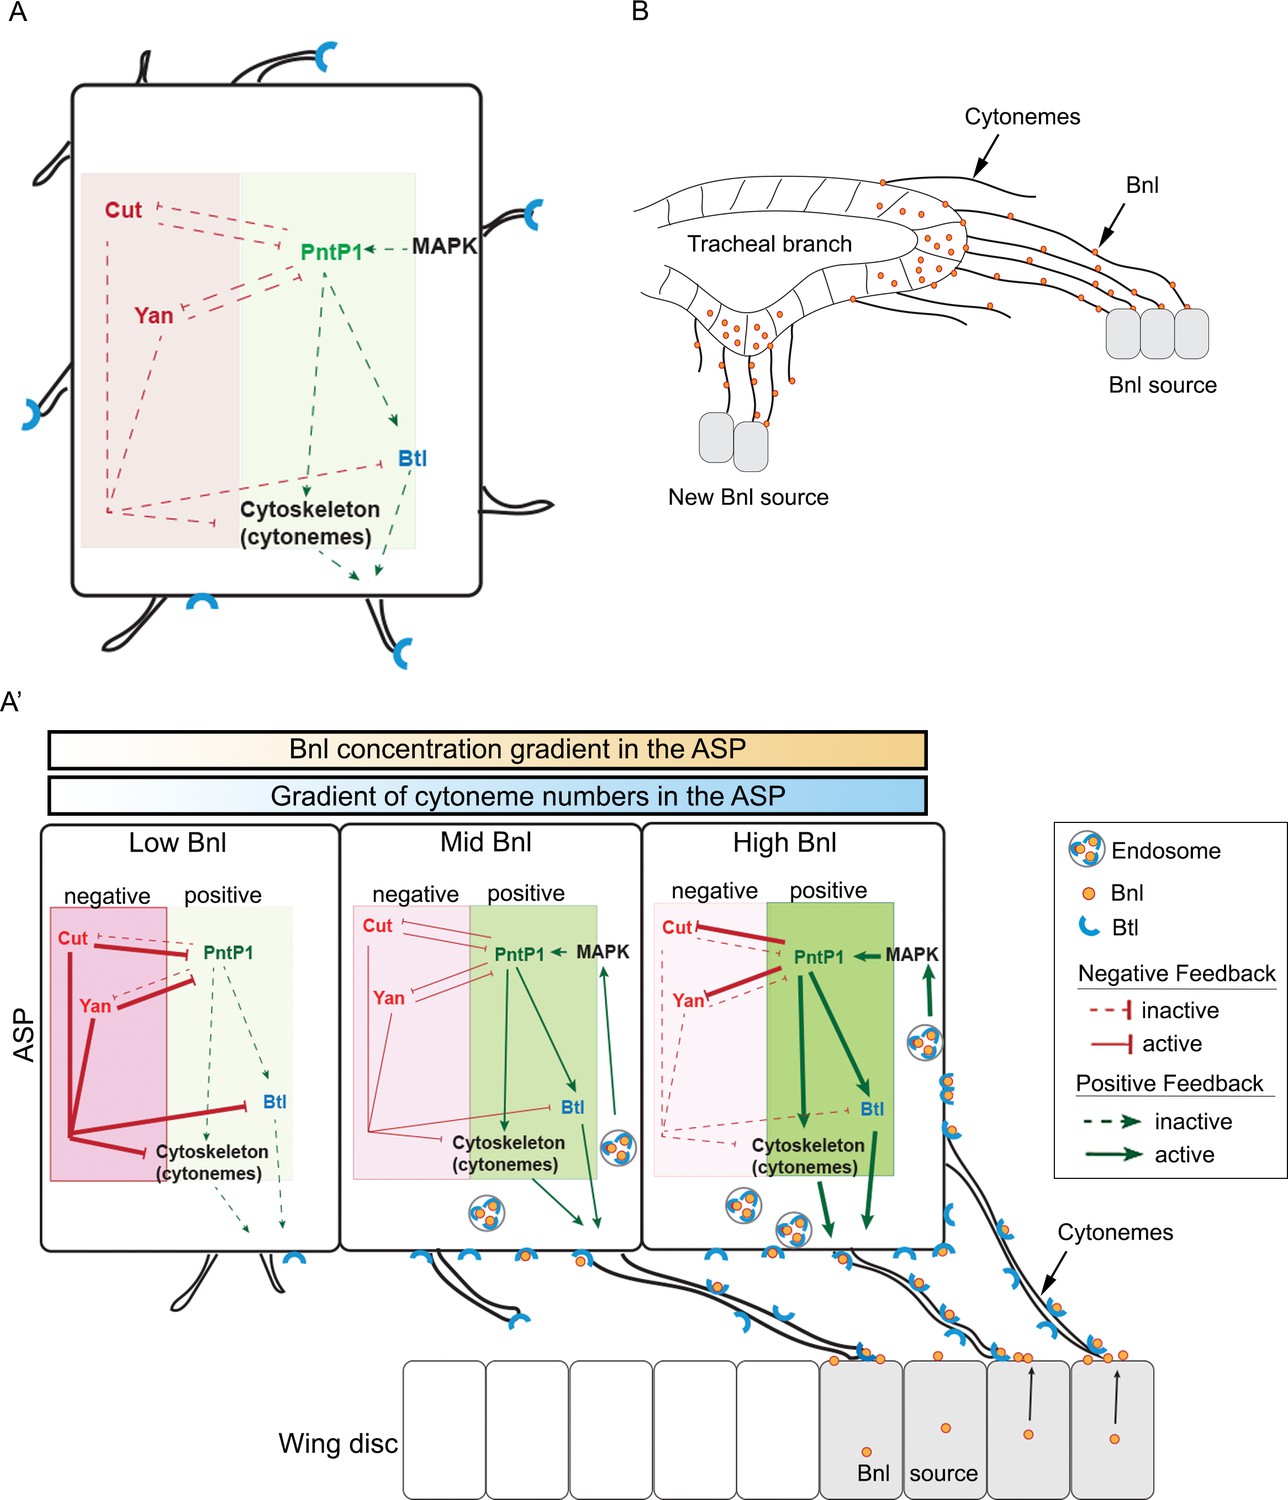
(A) A hypothetical state of an isolated tracheal epithelial cell projecting cytonemes in random orientation prior to its establishment of cytoneme-mediated contact with a bnl source; Each recipient cell is endowed with a PntP1-dependent positive (green area) and Cut/Yan-dependent negative (red area) feedback, controlling the number of cytonemes and Btl (blue). (A’) Gradient formation is initiated when one or few tracheal cell(s) establish contact with a Bnl source. The ASP cells projecting Btl-containing cytonemes contact the bnl-source and directly receive Bnl signal (orange circles). Receptor-bound Bnl ligands move along the cytoneme surface and are endocytosed in the ASP cell to activate concentration-dependent gene activities: PntP1 at high-moderate levels, and Cut and Yan at gradually lower levels. PntP1 elicits positive feedback while Cut and Yan elicit negative feedback on production of Btl and cytonemes in tracheal cells, creating a steady-state graded pattern of Bnl-receiving cytonemes. Signaling through these cytonemes generates and reinforces the Bnl gradient. The positive (PntP1) and negative (Cut/Yan) feedback also inhibit each other, and thereby can shape the gradient following recipient tissue-specific morphology. (B) When few tracheal cells from a pre-existing branch establish contacts with a new proximal source, this mechanism can initiate a new local gradient and a new epithelial branch organization.
Videos
Video 1
Asymmetric distribution of Bnl:GFP produced from the wing disc source.
Serial Z-stacks of the CD8:Cherry-marked ASP and underlying wing disc Bnl:GFP producing cells shown from lower to upper optical sections; only the green channel is shown to highlight asymmetric Bnl:GFP localization; genotype: btl-Gal4, UAS-CD8:Cherry/+; bnl:gfpendo.
Video 2
A recipient ASP-specific Bnl:GFP distribution.
Same sample and Z-stacks of the CD8:Cherry-marked ASP as shown in Video 1, but now with both red and green channels to highlight that the asymmetric Bnl:GFP distribution was due to dispersion of Bnl:GFP only in the recipient ASP epithelium; genotype: btl-Gal4, UAS-CD8:Cherry/+; bnl:gfpendo.
Video 3
3D rendered views of the CD8:Cherry-marked ASP showing that each of the ASP cytonemes established multiple physical contacts (green dots) with the underlying wing disc bnl source (unmarked).
Cytoneme contact sites were marked by sybGRASP, a GFP-reconstitution method, where the ASP expressed CD4:GFP11 and the wing disc bnl-source expressed syb:GFP1-10; genotype: btl-Gal4, UAS-CD8:Cherry/LexO-syb:GFP1-10, UAS-CD4:GFP11; bnl-LexA/+.
Video 4
3D rendered views of the ASP and wing disc showing that the CD8:RFP- marked clones of cells in the ASP tip had higher number of cytoneme-mediated contacts (green) with the bnl-source than the clones in the ASP stalk; ASP outline was marked by phalloidin (blue); CD8:RFP marked clones of ASP cells at different positions expressed CD4:GFP11 and disc bnl-source (unmarked) expressed sybGFP1-10.
GFP-reconstitution indicated physical contacts between the wing disc source and the clonal part of the ASP; genotype: hs-FLP/+; btl>y+>Gal4/lexO-nsyb:GFP1-10, UAS-CD4:GFP11; bnl-LexA/UAS-CD8:RFP.
Video 5
3D rendered views of the CD8:Cherry-marked ASP showing the differences in the number of cytoneme contacts with the disc bnl-source from the upper and lower layers of ASP cells; cytonemes from the lower layer ASP cells, which are proximal to the underlying disc source (unmarked) have higher number of contacts than the upper layer ASP cells; cytoneme contact sites (green) were marked by sybGRASP; genotype: btl-Gal4, UAS-CD8:Cherry/LexO-syb:GFP1-10, UAS-CD4:GFP11; bnl-LexA/+.
https://doi.org/10.7554/eLife.38137.036Tables
Key resources table
| Reagent type (species) or Resource | Designation | Source or reference | Identifiers | Additional information |
|---|---|---|---|---|
| Antibody | mouse anti-Discs large | DSHB | DSHB:4F3 RRID:AB_528203 | IHC (1:100) |
| Antibody | rabbit anti-dpERK (Phospho-p44/42 MAPK (Erk1/2) (Thr202/Tyr204) Rabbit mAb | Cell signaling Technology | Cell signaling Technology:4370 RRID:AB_11207064 | IHC (1:100) |
| Antibody | mouse anti-Cut | DSHB | DSHB:2B10 RRID:AB_528186 | IHC (1:50) |
| Antibody | mouse anti- beta-galactosidase | DSHB | DSHB:40-1a RRID:AB_528100 | IHC (1:50) |
| Antibody | rabbit anti-Rab5 | Abcam | Abcam:ab31261 RRID:AB_882240 | IHC (1:10000) |
| Antibody | rabbit anti-Rab7 | (Tanaka and Nakamura, 2008) | N/A | IHC (1:3000) |
| Antibody | rabbit anti-Rab11 | (Tanaka and Nakamura, 2008) | N/A | IHC (1:8000) |
| Antibody | rabbit anti-Lamp1 | Abcam | Abcam:ab30687 RRID:AB_775973 | IHC (1:10000) |
| Antibody | mouse anti-Yan | DSHB | DSHB:8B12H9 RRID:AB_531807 | IHC (1:200) |
| Antibody | rabbit anti-Bnl | This paper | N/A | IHC (1:1000), EIF (1:500) |
| Antibody | rabbit anti-GFP | Abcam | Abcam:ab6556 RRID:AB_305564 | EIF (1:3000) |
| Chemical compound, drug | Alexa Fluor 647 Phalloidin | Thermo Fisher Scientific | Cat. #: A22287 RRID:AB_2620155 | (1:1000) |
| Genetic reagent (Drosophila melanogaster) | {nos-Cas9}ZH-2A | Bloomington Drosophila stock center | RRID:BDSC_54591 | |
| Genetic reagent (Drosophila melanogaster) | UAS-CD8:GFP | Bloomington Drosophila stock center | RRID:BDSC_5137 | |
| Genetic reagent (Drosophila melanogaster) | UAS-nlsGFP | Bloomington Drosophila stock center | RRID:BDSC_4776 | |
| Genetic reagent (Drosophila melanogaster) | UAS-CD8:RFP | Bloomington Drosophila stock center | RRID:BDSC_32218 | |
| Genetic reagent (Drosophila melanogaster) | UAS-CD4:mIFP | Bloomington Drosophila stock center | RRID:BDSC_64182 | |
| Genetic reagent (Drosophila melanogaster) | lexO-nsyb:GFP1-10, UAS-CD4:GFP11 | Bloomington Drosophila stock center | RRID:BDSC_64315 | |
| Genetic reagent (Drosophila melanogaster) | UAS-BtlDN | (Reichman-Fried and Shilo, 1995) | N/A | |
| Genetic reagent (Drosophila melanogaster) | UAS-bnlRNAi | Bloomington Drosophila stock center | RRID:BDSC_34572 | |
| Genetic reagent (Drosophila melanogaster) | UAS-pntRNAi | Bloomington Drosophila stock center | RRID:BDSC_35038 | |
| Genetic reagent (Drosophila melanogaster) | UAS-cutRNAi | Bloomington Drosophila stock center | RRID:BDSC_33967 | |
| Genetic reagent (Drosophila melanogaster) | UAS-btlRNAi | Bloomington Drosophila stock center | RRID:BDSC_40871 | |
| Genetic reagent (Drosophila melanogaster) | UAS-diaRNAi | Bloomington Drosophila stock center | RRID:BDSC_33424 | |
| Genetic reagent (Drosophila melanogaster) | UAS-nrgRNAi | Bloomington Drosophila stock center | RRID:BDSC_37496 | |
| Genetic reagent (Drosophila melanogaster) | UAS-snRNAi | Bloomington Drosophila stock center | RRID:BDSC_42615 | |
| Genetic reagent (Drosophila melanogaster) | pnt-lacZ[07825] | Bloomington Drosophila stock center | RRID:BDSC_11724 | |
| Genetic reagent (Drosophila melanogaster) | sty-lacZ | Bloomington Drosophila stock center | RRID:BDSC_11735 | |
| Genetic reagent (Drosophila melanogaster) | bnl-LexA | (Du et al., 2017) | ||
| Genetic reagent (Drosophila melanogaster) | bnl-Gal4 | Bloomington Drosophila stock center | RRID:BDSC_112825 | |
| Genetic reagent (Drosophila melanogaster) | btl-Gal4 | (Sato and Kornberg, 2002) | N/A | |
| Genetic reagent (Drosophila melanogaster) | btl-LHG | (Roy et al., 2014) | N/A | |
| Genetic reagent (Drosophila melanogaster) | UAS-Btl | (Roy et al., 2011a) | N/A | |
| Genetic reagent (Drosophila melanogaster) | UAS-CD8:Cherry | (Roy et al., 2011a) | N/A | |
| Genetic reagent (Drosophila melanogaster) | lexO-CD2:GFP | (Yagi et al., 2010) | N/A | |
| Genetic reagent (Drosophila melanogaster) | hs-FLP; btl>y+>Gal4, btl-mRFP1moe | (Cabernard and Affolter, 2005) | N/A | |
| Genetic reagent (Drosophila melanogaster) | hs-FLP; btl>y+>Gal4; btl-mRFP1moe | (Cabernard and Affolter, 2005) | N/A | |
| Genetic reagent (Drosophila melanogaster) | bnl:gfpendo | This paper | N/A | Functional genomic knock-in allele by CRISPR |
| Genetic reagent (Drosophila melanogaster) | btl:cherryendo | This paper | N/A | Functional genomic knock-in allele by CRISPR |
| Genetic reagent (Drosophila melanogaster) | UAS-secGFP | This paper | N/A | Secreted GFP overexpression construct |
| Sequence-based reagent | 5’-GTCGGGG CCAATCGCGTCAAGCA-3’ | This paper | N/A | Guide RNA-1 for bnl:gfpendo |
| Sequence-based reagent | 5’-AAACTGCT TGACGCGATTGGCCC-3’ | This paper | N/A | Guide RNA-1 for bnl:gfpendo |
| Sequence-based reagent | 5’-GTCGATAT TAGCAGTAGCCTTAG-3’ | This paper | N/A | Guide RNA-2 for bnl:gfpendo |
| Sequence-based reagent | 5’-AAACCTAA GGCTACTGCTAATAT-3’ | This paper | N/A | Guide RNA-2 for bnl:gfpendo |
| Sequence-based reagent | 5’-GTCGCAT CACGGAGACGGTGCCGC-3’ | This paper | N/A | Guide RNA-3 for bnl:gfpendo |
| Sequence-based reagent | 5’-AAACGCGG CACCGTCTCCGTGATG-3’ | This paper | N/A | Guide RNA-3 for bnl:gfpendo |
| Sequence-based reagent | 5’-GTCGAGG TGTACTGATATCTAAG-3’ | This paper | N/A | Guide RNA-1 for btl:cherryendo |
| Sequence-based reagent | 5’-AAACCTTA GATATCAGTACACCT-3’ | This paper | N/A | Guide RNA-1 for btl:cherryendo |
| Sequence-based reagent | 5’-GTCGCGG CATCGAAAGGTCCAGAT-3’ | This paper | N/A | Guide RNA-2 for btl:cherryendo |
| Sequence-based reagent | 5’-AAACATCT GGACCTTTCGATGCCG-3’ | This paper | N/A | Guide RNA-2 for btl:cherryendo |
| Sequence-based reagent | 5’-CGTATGGG ATTCCGATTGTGTG-3’ | This paper | N/A | Primer to amplify N fragment of HDR donor for bnl:gfpendo |
| Sequence-based reagent | 5’-CAGCTCCT CGCCCTTGGACATAGTG TTGCTGCTGCAATGTGGCGG-3’ | This paper | N/A | Primer to amplify N fragment of HDR donor for bnl:gfpendo |
| Sequence-based reagent | 5’-CCGCCACA TTGCAGCAGCAACACTA TGTCCAAGGGCGAGGAGCT-3’ | This paper | N/A | Primer to amplify mid fragment of HDR donor for bnl:gfpendo |
| Sequence-based reagent | 5’-CTGCTGA TGCTGCTGCTGCTGCCAC TCTTGTACAGCTCATC CATGCCCAG-3’ | This paper | N/A | Primer to amplify mid fragment of HDR donor for bnl:gfpendo |
| Sequence-based reagent | 5’-CTGGGCA TGGATGAGCTGTACAAG AGTGGCAGCAGCAGCA GCATCAGCAG-3’ | This paper | N/A | Primer to amplify C fragment of HDR donor for bnl:gfpendo |
| Sequence-based reagent | 5’-GGCTTGA GAGGTTCTTATAAAA TACTCGAG-3’ | This paper | N/A | Primer to amplify C fragment of HDR donor for bnl:gfpendo |
| Sequence-based reagent | 5’-CTCAACTT CACCGTGACGAATGAC-3’ | This paper | N/A | Primer to amplify N fragment of HDR donor for btl:cherryendo |
| Sequence-based reagent | 5’-GTTTCTCC ATGCGCTGACCCGT AATCAG-3’ | This paper | N/A | Primer to amplify N fragment of HDR donor for btl:cherryendo |
| Sequence-based reagent | 5’-CTGATTAC GGGTCAGCGCATG GAGAAAC-3’ | This paper | N/A | Primer to amplify mid fragment of HDR donor for btl:cherryendo |
| Sequence-based reagent | 5’-GGAATTCT TTTTGGTCTCCTTAT ACTACGAA-3’ | This paper | N/A | Primer to amplify mid fragment of HDR donor for btl:cherryendo |
| Sequence-based reagent | 5’-TTCGTAGT ATAAGGAGACCAAA AAGAATTCC-3’ | This paper | N/A | Primer to amplify C fragment of HDR donor for btl:cherryendo |
| Sequence-based reagent | 5’-GGTTCCTC TTCCATCCAAGGTTG-3’ | This paper | N/A | Primer to amplify C fragment of HDR donor for btl:cherryendo |
| Sequence-based reagent | 5’-TTTTGGG GCCAATCGTGTGAAGC ACGGCGTGCGG-3’ | This paper | N/A | Primer to introduce synonymous mutation at bnl-gRNA-1 recognition site in HDR donor |
| Sequence-based reagent | 5’-CCGCACG CCGTGCTTCACACGAT TGGCCCCAAAA-3’ | This paper | N/A | Primer to introduce synonymous mutation at bnl-gRNA-1 recognition site in HDR donor |
| Sequence-based reagent | 5’-CCATATTA GCAGTAGTCTGAGCGG TAGCAGTAAC-3’ | This paper | N/A | Primer to introduce synonymous mutation at bnl-gRNA-2 recognition site in HDR donor |
| Sequence-based reagent | 5’-GTTACTGC TACCGCTCAGACTACT GCTAATATGG-3’ | This paper | N/A | Primer to introduce synonymous mutation at bnl-gRNA-2 recognition site in HDR donor |
| Sequence-based reagent | 5’-GGAGACG GTGCCGCAAGAGCGG GTCGAGCAG-3’ | This paper | N/A | Primer to introduce synonymous mutation at bnl-gRNA-3 recognition site in HDR donor |
| Sequence-based reagent | 5’-CTGCTCG ACCCGCTCTTGCGGC ACCGTCTCC-3’ | This paper | N/A | Primer to introduce synonymous mutation at bnl-gRNA-3 recognition site in HDR donor |
| Sequence-based reagent | 5’-CCGGGAA ACGTCCCCGCTGAGGT ATCAGTACACCTATAAG-3’ | This paper | N/A | Primer to introduce synonymous mutation at btl-gRNA-1 recognition site in HDR donor |
| Sequence-based reagent | 5’-CTTATAGG TGTACTGATACCTCAG CGGGGACGTTTCCCGG-3’ | This paper | N/A | Primer to introduce synonymous mutation at btl-gRNA-1 recognition site in HDR donor |
| sequence-based reagent | 5’-GTAGCAAT CCAAACGATGCGTAT CTGGACCTTTCGATGC-3’ | This paper | N/A | Primer to introduce synonymous mutation at btl-gRNA-2 recognition site in HDR donor |
| Sequence-based reagent | 5’-GCATCGA AAGGTCCAGATACGCA TCGTTTGGATTGCTAC-3’ | This paper | N/A | Primer to introduce synonymous mutation at btl-gRNA-2 recognition site in HDR donor |
| Sequence-based reagent | 5’-GTCCTGTT TAGGGGCGATAAGTGG-3’ | This paper | N/A | Primer for bnl:gfpendo HDR screening and sequencing |
| Sequence-based reagent | 5’-GTGTTGCG TAAGGTTAGGGCTTCG-3’ | This paper | N/A | Primer for bnl:gfpendo HDR screening and sequencing |
| Sequence-based reagent | 5’-GAAGCAG CACGATTTCTTCAAGAGCG-3’ | This paper | N/A | Primer for bnl:gfpendo HDR screening and sequencing |
| Sequence-based reagent | 5’-CGCTCTTG AAGAAATCGTGCTGCTTC-3’ | This paper | N/A | Primer for bnl:gfpendo HDR screening and sequencing |
| Sequence-based reagent | 5’-CGCCAGC CAGGCAAT-3’ | This paper | N/A | Primer for bnl:gfpendo HDR screening and sequencing |
| Sequence-based reagent | 5’-GTCCTCAA GAATGCCTCCTTGGAC-3’ | This paper | N/A | Primer for btl:cherryendo HDR screening and sequencing |
| Sequence-based reagent | 5’-GTCTATGA TACCTCTGACAGCTTC-3’ | This paper | N/A | Primer for btl:cherryendo HDR screening and sequencing |
| Sequence-based reagent | 5’-CTTCCCC GAGGGCTTCAAGTG-3’ | This paper | N/A | Primer for btl:cherryendo HDR screening and sequencing |
| Sequence-based reagent | 5’-CACTTGAA GCCCTCGGGGAAG-3’ | This paper | N/A | Primer for btl:cherryendo HDR screening and sequencing |
| Sequence-based reagent | 5’-GTTTCTCC ATGCGCTGACCCG TAATCAG-3’ | This paper | N/A | Primer for btl:cherryendo HDR screening and sequencing |
| Sequence-based reagent | 5’-AATTCGAG CTCGGTACAGATCTA TGCGAAGAAACCTGCGC-3’ | This paper | N/A | Primer for UAS-SPBnl-sfGFP cloning |
| Sequence-based reagent | 5’-CCTCGCCC TTGGACATCATCGCA GATACAAGGCCCC-3’ | This paper | N/A | Primer for UAS-SPBnl-sfGFP cloning |
| Sequence-based reagent | 5’-GGCCTTGT ATCTGCGATGATGTC CAAGGGCGAGGAG-3’ | This paper | N/A | Primer for UAS-SPBnl-sfGFP cloning |
| Sequence-based reagent | 5’-GCCAAGC TTGCATGCCGGTACCT TACTTGTACAGCTC ATCCATGCCC-3’ | This paper | N/A | Primer for UAS-SPBnl-sfGFP cloning |
| Recombinant DNA reagent | pCR4Blunt-TOPO | Thermo Fisher Scientific | N/A | |
| Recombinant DNA reagent | pUC19 | Addgene | Addgene:50005 | |
| Recombinant DNA reagent | pUAST | Drosophila Genomics Resource center | DGRC:1000 | |
| Recombinant DNA reagent | pCFD3 | (Port et al., 2014) | N/A | |
| Recombinant DNA reagent | pCFD3-bnl_gRNA-1 | This paper | N/A | Plasmid for generation of bnl_gRNA-1 flies |
| Recombinant DNA reagent | pCFD3-bnl_gRNA-2 | This paper | N/A | Plasmid for generation of bnl_gRNA-2 flies |
| Recombinant DNA reagent | pCFD3-bnl_gRNA-3 | This paper | N/A | Plasmid for generation of bnl_gRNA-3 flies |
| Recombinant DNA reagent | pCFD3-btl_gRNA-1 | This paper | N/A | Plasmid for generation of btl_gRNA-1 flies |
| Recombinant DNA reagent | pCFD3-btl_gRNA-2 | This paper | N/A | Plasmid for generation of btl_gRNA-2 flies |
| Recombinant DNA reagent | pCR4Blunt-TOPO -bnl:GFP-1 | This paper | N/A | HDR donor for making bnl:gfpendo flies |
| Recombinant DNA reagent | pCR4Blunt-TOPO -bnl:GFP-2 | This paper | N/A | HDR donor for making bnl:gfpendo flies |
| Recombinant DNA reagent | pCR4Blunt-TOPO -bnl:GFP-3 | This paper | N/A | HDR donor for making bnl:gfpendo flies |
| Recombinant DNA reagent | pCR4Blunt-TOPO- btl:Cherry-1 | This paper | N/A | HDR donor for making btl:cherryendo flies |
| Recombinant DNA reagent | pCR4Blunt-TOPO -btl:Cherry-2 | This paper | N/A | HDR donor for making btl:cherryendo flies |
| Recombinant DNA reagent | pUAST-SPBnl-sfGFP | This paper | N/A | Plasmid for generation of UAS-secGFP flies |
| Software, algorithm | Fiji (ImageJ v2.0) | (Schindelin et al., 2012) | RRID:SCR_002285 | |
| Software, algorithm | Adobe Photoshop | Adobe | RRID:SCR_014199 | |
| Software, algorithm | Microsoft Excel | Microsoft | RRID:SCR_016137 | |
| Software, algorithm | SnapGene | snapgene.com | RRID:SCR_015052 | |
| Software, algorithm | VassarStats | vassarstats.net | RRID:SCR_010263 | |
| Software, algorithm | R | r-project.org | RRID:SCR_001905 |
Additional files
-
Source code 1
Source code for the rose plots shown in Figure 5, Figure 7, and Figure 7—figure supplement 1.
- https://doi.org/10.7554/eLife.38137.055
-
Transparent reporting form
- https://doi.org/10.7554/eLife.38137.056
Download links
A two-part list of links to download the article, or parts of the article, in various formats.
Downloads (link to download the article as PDF)
Open citations (links to open the citations from this article in various online reference manager services)
Cite this article (links to download the citations from this article in formats compatible with various reference manager tools)
Feedback regulation of cytoneme-mediated transport shapes a tissue-specific FGF morphogen gradient
eLife 7:e38137.
https://doi.org/10.7554/eLife.38137


