The retromer complex safeguards against neural progenitor-derived tumorigenesis by regulating Notch receptor trafficking
- Peking University, China
- PKU-IDG/McGovern Institute for Brain Research, China
Figures
Figure 1 with 4 supplements
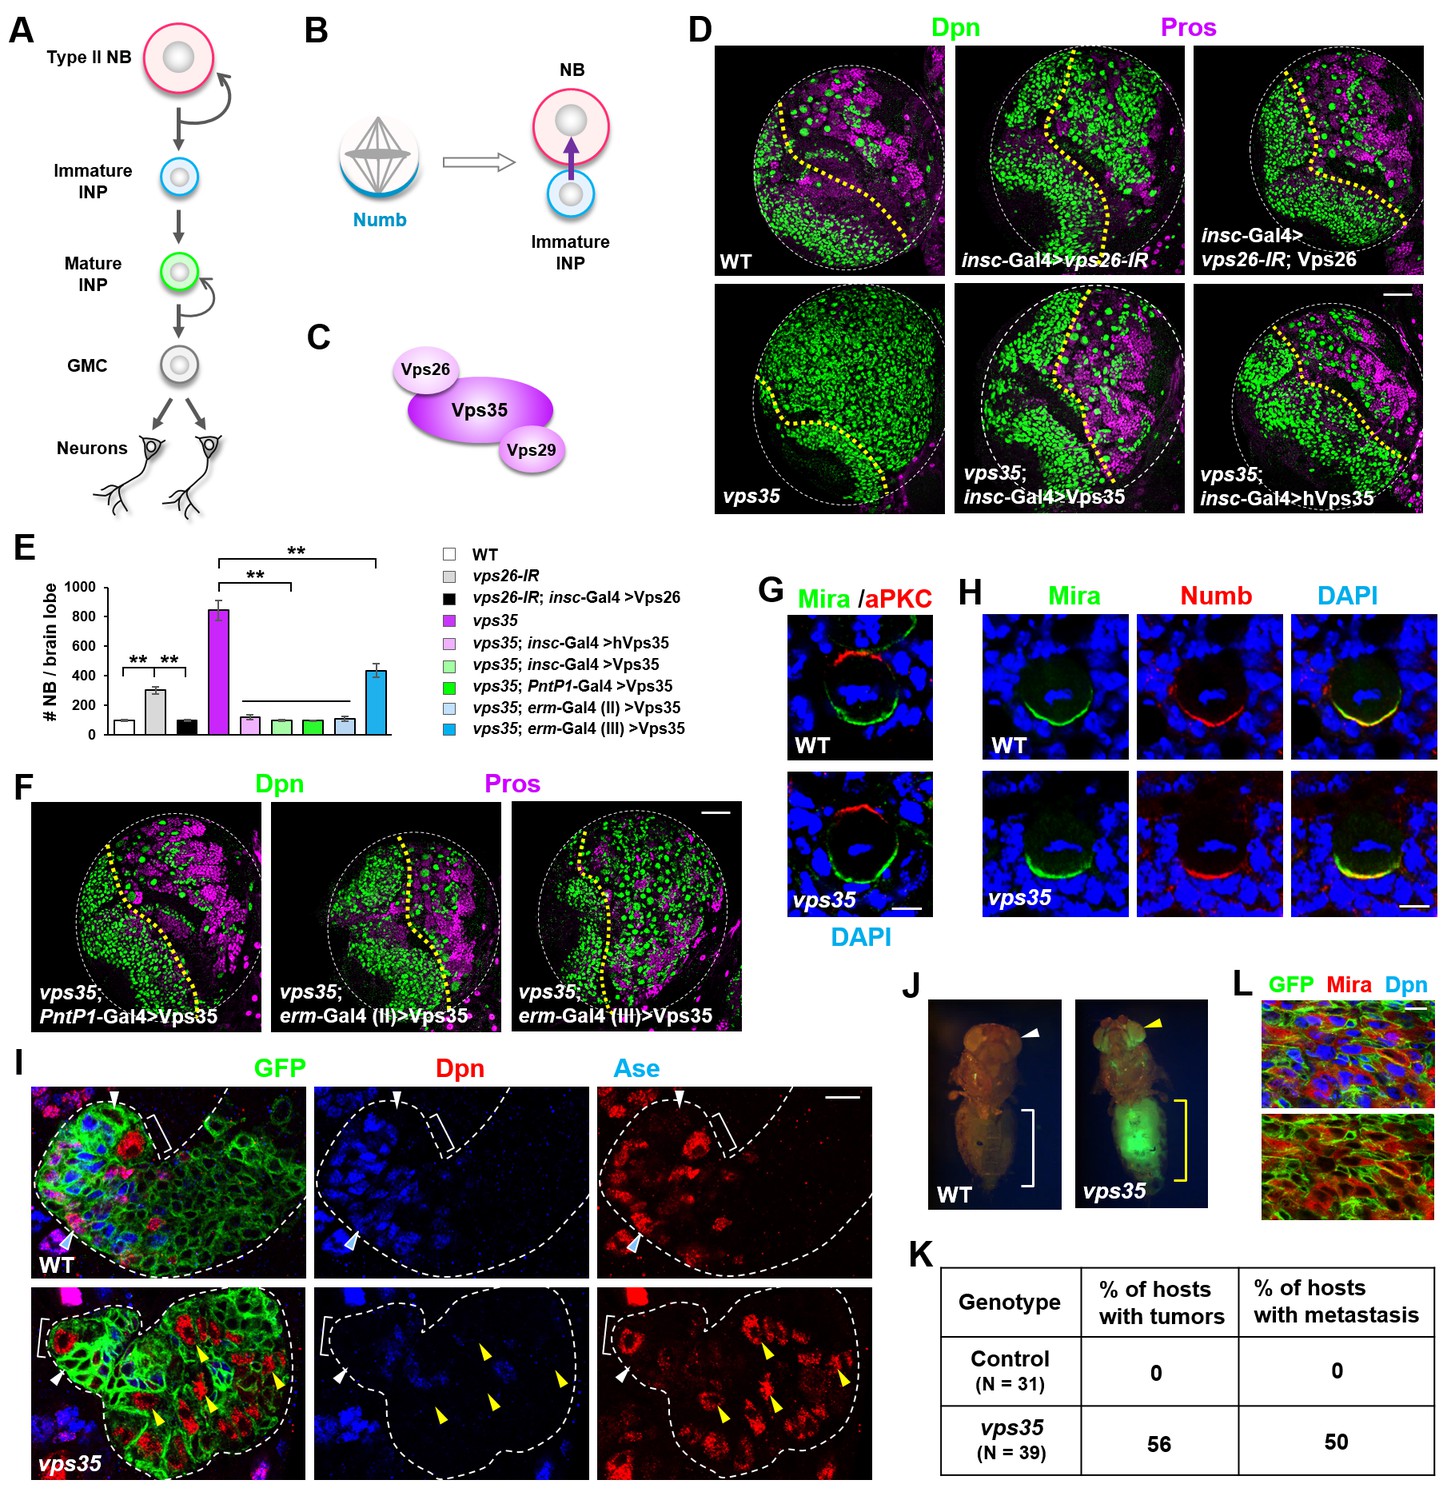
Dedifferentiation of vps35 mutant neural progenitors causes the formation of transplantable tumors.
(A) Diagram depicting the lineage hierarchy of Drosophila type II neuroblasts in the central brain area. (B) Schematic showing how asymmetric distribution and segregation of the endocytic protein Numb (cyan) initiates unidirectional Notch signaling (purple arrow) from a neural progenitor (light blue) to its sibling type II neuroblast (pink). (C) Schematic of the cargo-recognition retromer complex. (D–F) Larval brain lobes of indicated genotypes were stained for neuroblast marker Deadpan (Dpn) and ganglion mother cell (GMC)/neuronal marker Prospero (nuclear Pros) (D,F). In this and subsequent micrographs, yellow dotted line marks the boundary between the optic lobe (left) and the central brain (right) areas. Quantification of total neuroblast number per brain lobe is shown in (E). **p<0.001 (n = 12–16). (G) Asymmetric cortical distribution of apical marker atypical PKC (aPKC) and basal marker Miranda (Mira) in wild type (WT) or vps35 mutant metaphase neuroblasts. (H) Colocalization of Mira and cell fate determinant Numb at the basal cortex of WT or vps35 mutant metaphase neuroblasts. (I) MARCM clonal analysis of type II neuroblast lineages in WT control or vps35 mutant backgrounds. In this and subsequent micrographs, type II neuroblast MARCM clones are marked by CD8-GFP and outlined by white dashed lines, whereas neuroblasts, immature intermediate neural progenitors (INPs), mature INPs and neuroblast-like dedifferentiating progenitors are marked with brackets, white arrowheads, cyan arrowheads and yellow arrowheads respectively. (J) Transplantation of GFP+ tissue from WT control larval brains into the abdomens of adult host flies caused neither tumorous growth (while bracket) nor metastasis (white arrowhead). In sharp contrast, transplantation of GFP+ tumor tissue from vps35 mutant larval brains caused massive tumor formation (yellow bracket) and metastasis to distal organs such as the eyes (yellow arrowhead). (K) Table showing the frequency of tumor formation or metastasis 14 days after transplantation of GFP+ tissue from larval brains of indicated genotypes. (L) GFP+ tumor tissues from the transplanted hosts were isolated and stained for neuroblast markers Mira and Dpn. Note that most of the extracted GFP+ tumor cells were Mira+ and Dpn+ neuroblast-like cells. Scale bars, 50 μm (D,F); 5 μm (G,H) and 10 μm (I,L).
-
Figure 1—source data 1
Input data for bar graph Figure 1E.
- https://doi.org/10.7554/eLife.38181.008
Figure 1—figure supplement 1
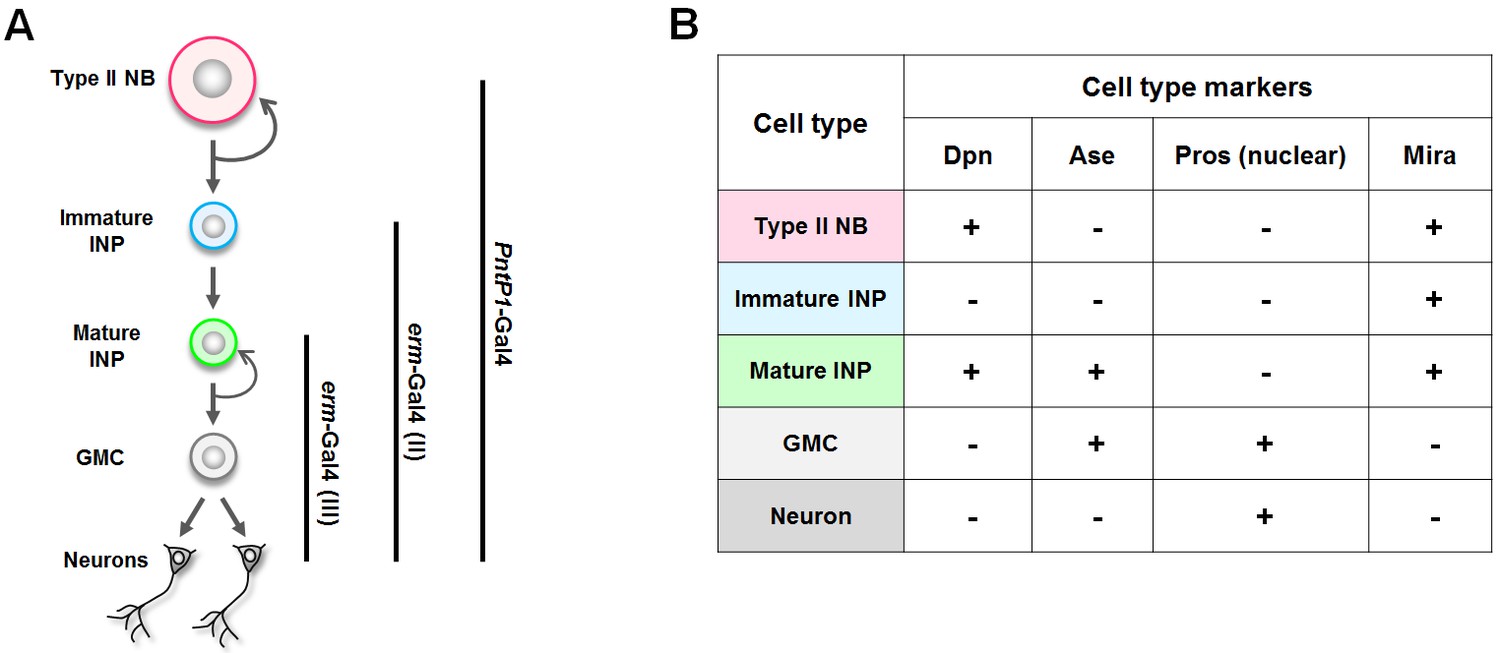
A summary of the Gal4 drivers and cell type markers used in this study.
(A) The expression patterns of the Gal4 drivers. (B) The identity of each cell type in type II neuroblast lineages can be unambiguously determined by a combination of cell type markers. NB: neuroblast.
Figure 1—figure supplement 2

Ectopic neuroblasts formed upon retromer dysfunction are originated from immature INPs.
(A,B) Larval brain lobes of indicated genotypes were stained for Dpn and Pros. Quantification of total neuroblast number per brain lobe is shown in (B). **p<0.001; NS: not significant (n = 10–12). Note that whereas downregulation of vps26 in type II neuroblast lineages or immature INP lineages, driven by PntP1-Gal4 or erm-Gal4(II) respectively, resulted in supernumerary neuroblast phenotype, its knockdown in mature INP lineages or type I neuroblast lineages, driven by erm-Gal4 (III) or ase-Gal4 respectively, failed to induce ectopic neuroblasts. Scale bar, 50 μm (A).
Figure 1—figure supplement 3
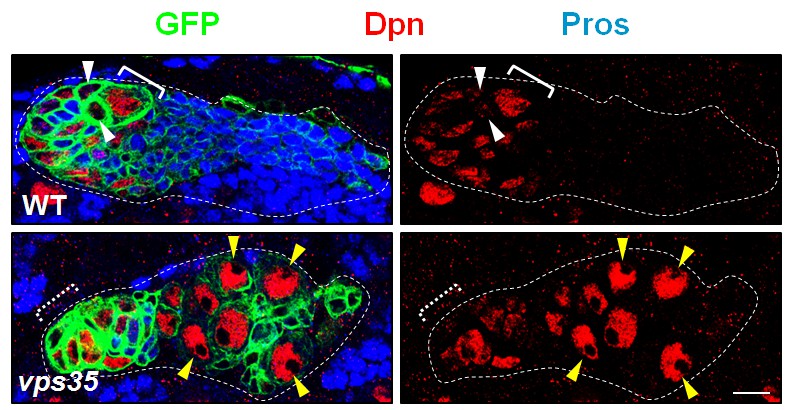
MARCM clonal analysis of wild type and vps35 mutant neuroblasts.
MARCM clones were marked by CD8-GFP and stained with Dpn and Pros. Immature INPs in WT neuroblast clone and ectopic neuroblast-like cells in vps35 mutant clone were marked by white arrowheads and yellow arrowheads respectively. Note that Dpn+ Pros- ectopic neuroblasts (yellow arrowheads) were several cell diameters away from the primary neuroblast (dashed white bracket, out of the current focal plane). Scale bar, 10 μm.
Figure 1—figure supplement 4

Lineage-tracing analysis of wild type and vps35 mutant immature neural progenitors.
Lineage-traced cells were marked by nlsGFP and stained with Dpn and Ase. vps35 mutant immature INPs could dedifferentiate back into Dpn+ Ase- ectopic neuroblasts (yellow arrowheads), while WT control immature INPs differentiated into Dpn+ Ase+ mature INPs (white arrowhead), Dpn- Ase+ GMCs or Dpn- Ase- neurons (cyan arrowhead). Note that some glial cells and occasionally a couple of type I NB lineages are marked by nlsGFP in the WT control background. Scale bar, 10 μm.
Figure 2
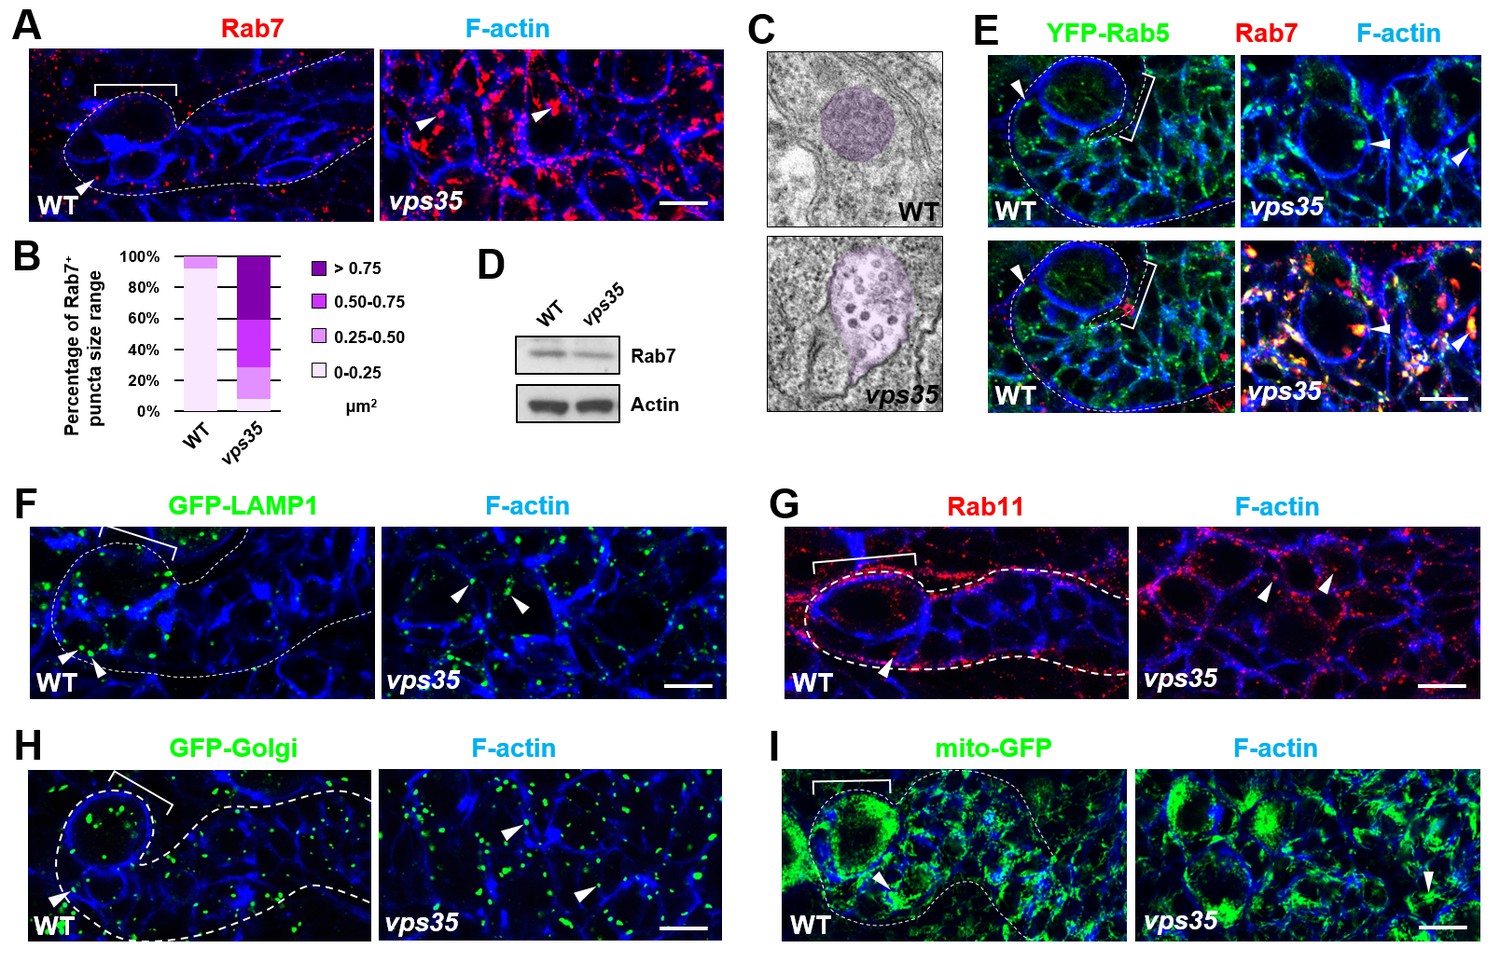
Rab7+ endosomes are drastically enlarged in vps35 mutant neuroblast lineages.
(A,B) Compared to WT control immature INPs, Rab7+ endosomes were dramatically enlarged in vps35 mutant dedifferentiating neural progenitors (arrowheads in A). Quantification of the size range of Rab7+ puncta in immature INPs of indicated genotypes was shown in (B). (C) Transmission electron micrograph of wild type or vps35 mutant larval brain neuroblasts. The mean size of MVBs, identified by the presence of intraluminal vesicles, was greatly enlarged in vps35 mutant neuroblasts. Note that neuroblasts were identified by their large cellular and nuclear sizes and MVBs are highlighted in purple. (D) Western blot analysis of larval brain extracts of indicated genotypes using anti-Rab7 antibody. Anti-β-actin blot served as a loading control. (E) The enlarged Rab7+ endosomes in vps35 mutant neuroblast-like cells were also positive for YFP-Rab5 (arrowheads). (F–I) Compared to WT control immature INPs, the sizes of GFP-LAMP1+ lysosomes (F), Rab11+ recycling endosomes (G), Golgi (H) or mitochondria marked by mito-GFP (I) remained unaltered in vps35 mutant dedifferentiating neural progenitors (arrowheads). Scale bars, 10 μm (A,E–I).
Figure 3 with 3 supplements
Retromer regulates Notch signaling by mediating Notch receptor endosomal trafficking.
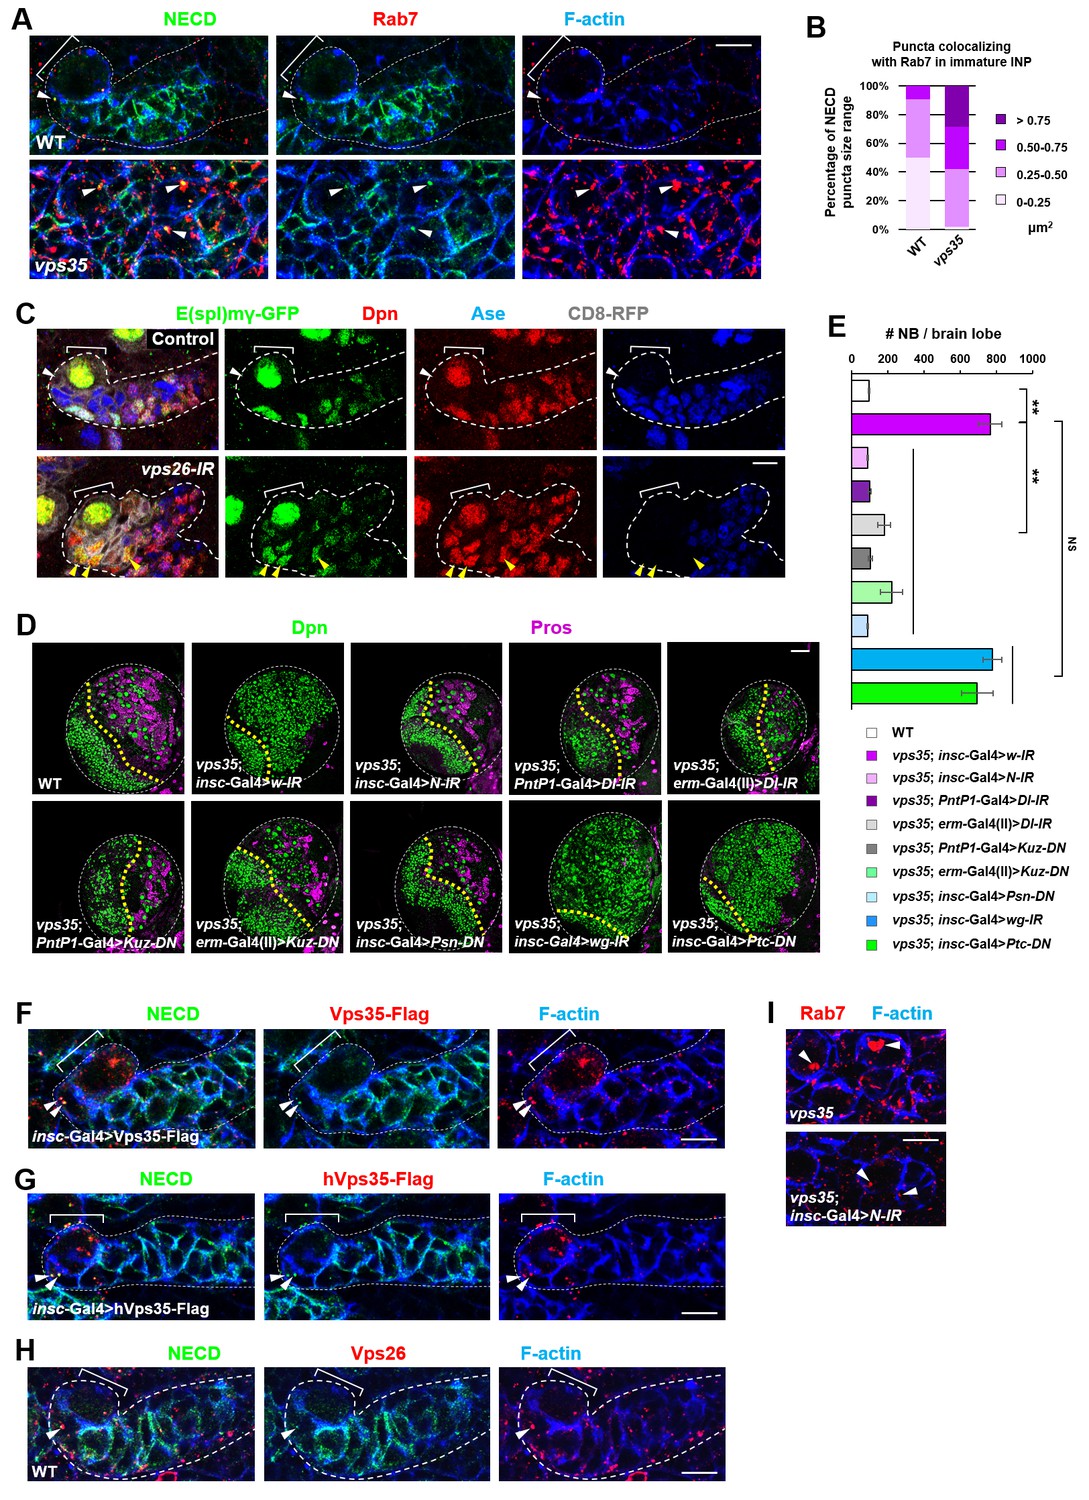
(A,B) Compared to WT control immature INPs, Notch puncta colocalizing with Rab7+ endosomes were enlarged in vps35 mutant dedifferentiating neural progenitors (arrowheads in A). Quantification of the size range of Notch puncta colocalizing with Rab7+ endosomes is shown in (B). (C) The expression pattern of Notch signaling reporter E(spl)mγ-GFP in wild type control or vps26-RNAi type II neuroblast lineages. Note that immature INPs (Dpn- Ase-) in control type II neuroblast lineages and dedifferentiating neural progenitors (Dpn+ Ase-) in vps26-RNAi lineages are marked with white arrowheads and yellow arrowheads respectively. (D,E) Larval brain lobes of indicated genotypes were stained for Dpn and Pros. Quantification of total neuroblast number per brain lobe is shown in (E). **p<0.001 (n = 10–18). NS, not significant. (F) Type II neuroblast lineages expressing Vps35-FLAG were stained for Notch extracellular domain (NECD) and FLAG. Note that NECD puncta (arrowheads) colocalized with Vps35-FLAG in immature INPs. (G,H) NECD puncta colocalized with FLAG-tagged human Vps35 (hVps35-FLAG; G) and endogenous Vps26 (H) in immature INPs (arrowheads). (I) Type II neuroblast lineages of indicated genotypes were stained for Rab7 and F-actin. Rab7 puncta are marked with arrowheads. Scale bars, 10 μm (A,C,F–I) and 50 μm (D).
-
Figure 3—source data 1
Input data for bar graph Figure 3E.
- https://doi.org/10.7554/eLife.38181.014
Figure 3—figure supplement 1
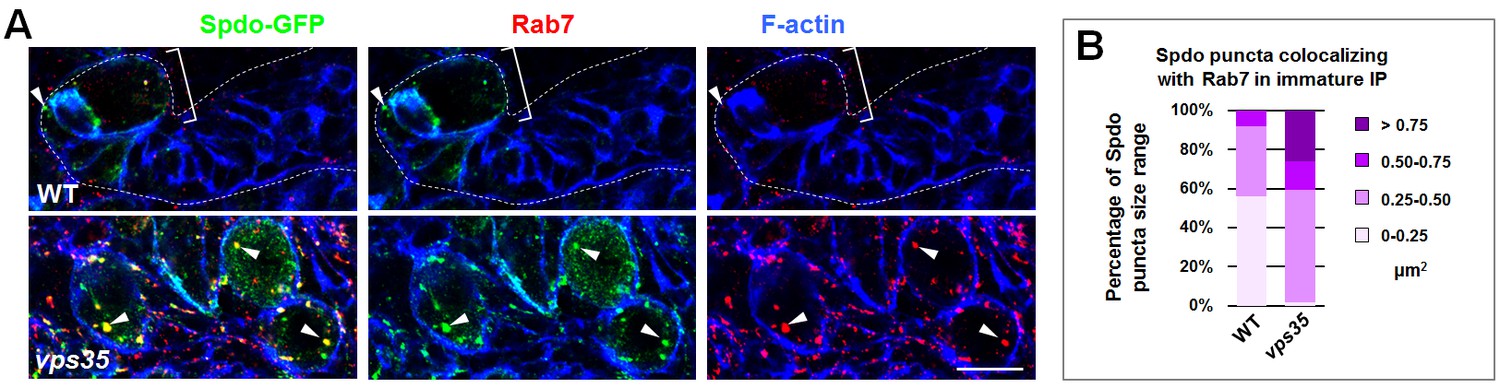
Retromer regulates endosomal trafficking of Notch cofactor Sanpodo (Spdo).
(A,B) Compared to WT control immature INPs, Spdo-GFP puncta colocalizing with Rab7+ endosomes were enlarged in vps35 mutant dedifferentiating neural progenitors (arrowheads in A). Quantification of the size range of Spdo-GFP puncta colocalizing with Rab7+ endosomes is shown in (B). Scale bar, 10 μm.
Figure 3—figure supplement 2
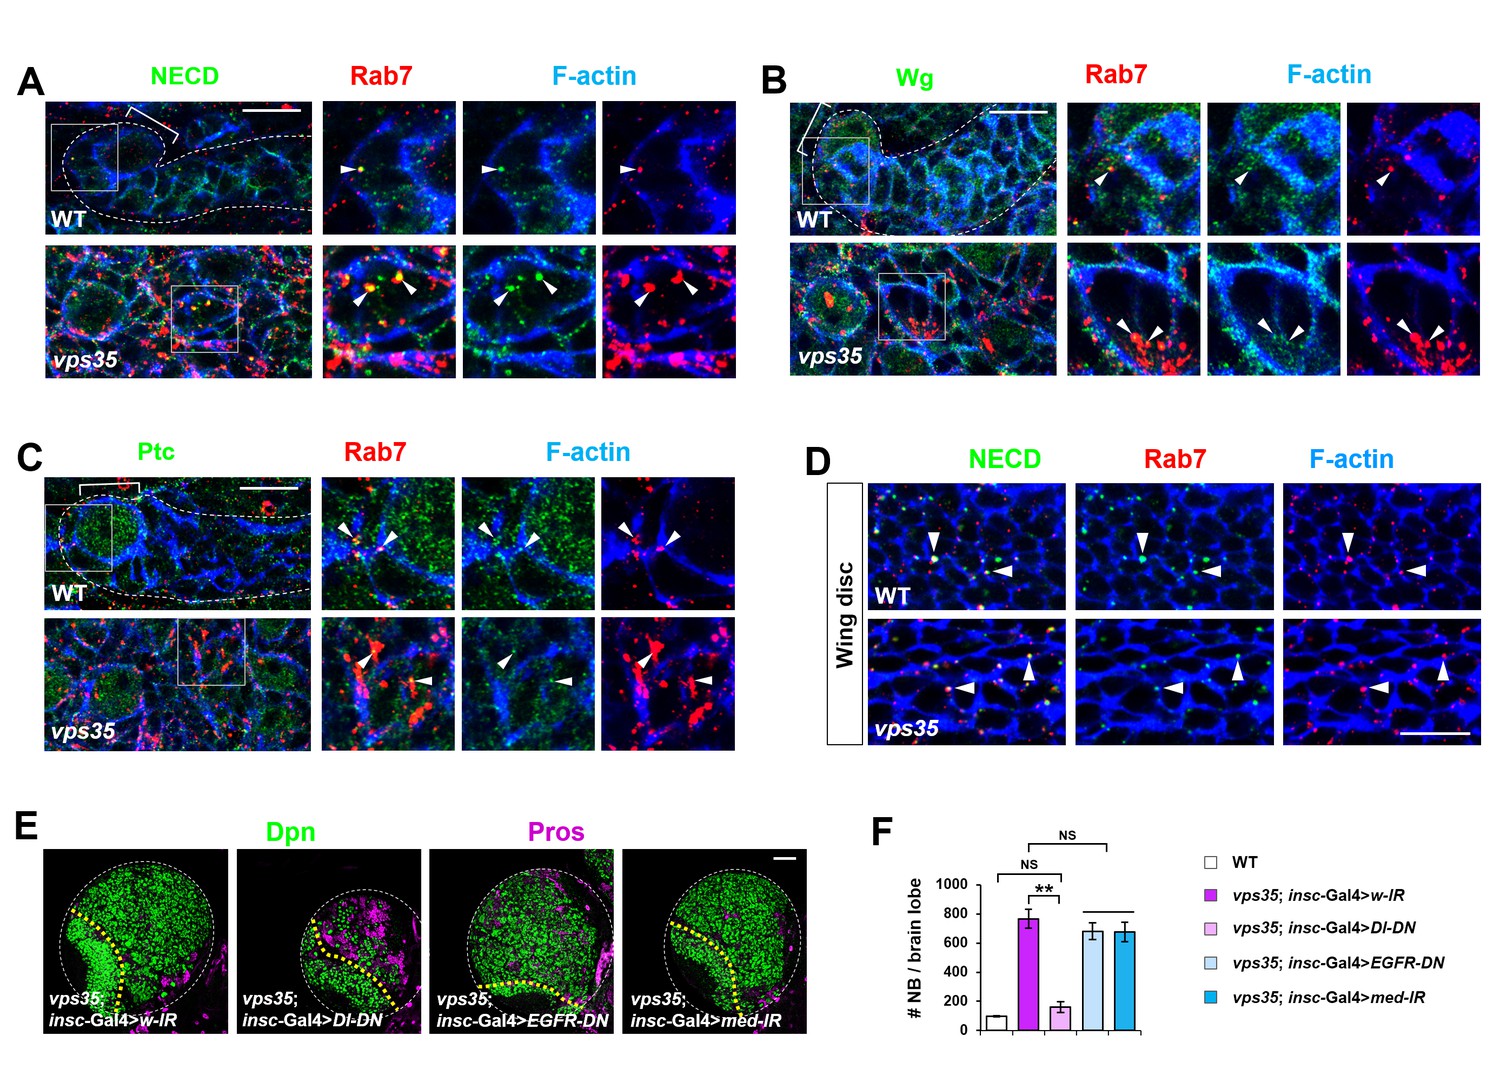
Retromer regulates Notch signaling in fly neuroblast lineages with high specificity.
(A–C) Compared to WT control immature INPs, Notch (A) but not Wingless (Wg, B) or Patched (Ptc, (C) puncta colocalizing with Rab7+ endosomes were enlarged in vps35 mutant dedifferentiating neural progenitors (arrowheads in islets in A–C). (D) In fly late third instar larval wing discs, Notch puncta colocalizing with Rab7+ endosomes (arrowheads) remained unaltered in vps35 mutant cells. (E,F) Larval brain lobes of indicated genotypes were stained for Dpn and Pros. Quantification of total neuroblast number per brain lobe is shown in (F). **p<0.001; NS, not significant (n = 10–12). Scale bars, 50 μm (E); 10 μm (A–D).
Figure 3—figure supplement 3
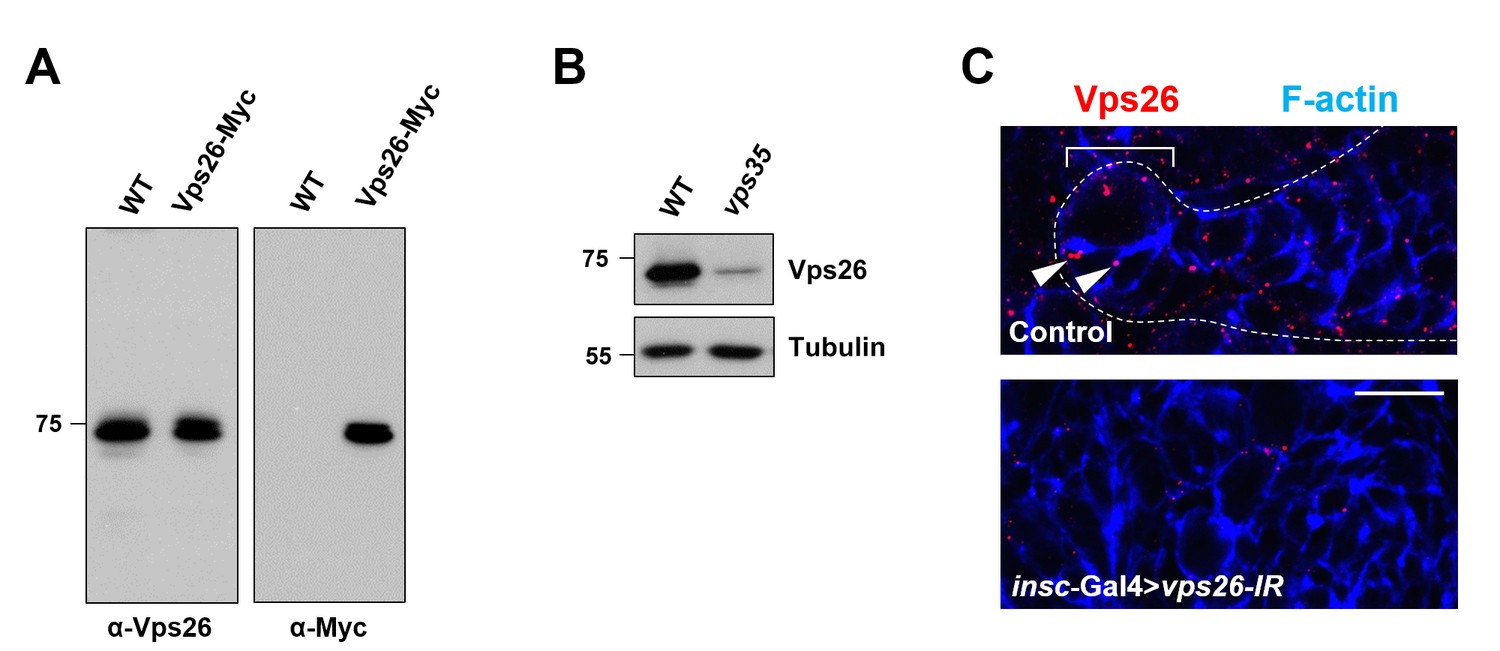
Antibody raised against Vps26 is highly specific.
(A) Western blot analysis of wild type or insc-Gal4 >UAS-Vps26-Myc larval brain extracts using anti-Vps26 (left) or anti-Myc (right) antibody. (B) Compared to WT control, Vps26 expression levels in vps35 mutant larval brain extracts were drastically reduced. Anti-α-Tubulin blot serves as loading control. (C) High and punctuated expression of Vps26 in type II neuroblast lineage (arrowheads) was diminished upon neuroblast-specific knockdown of vps26. Scale bar, 10 μm.
Figure 4
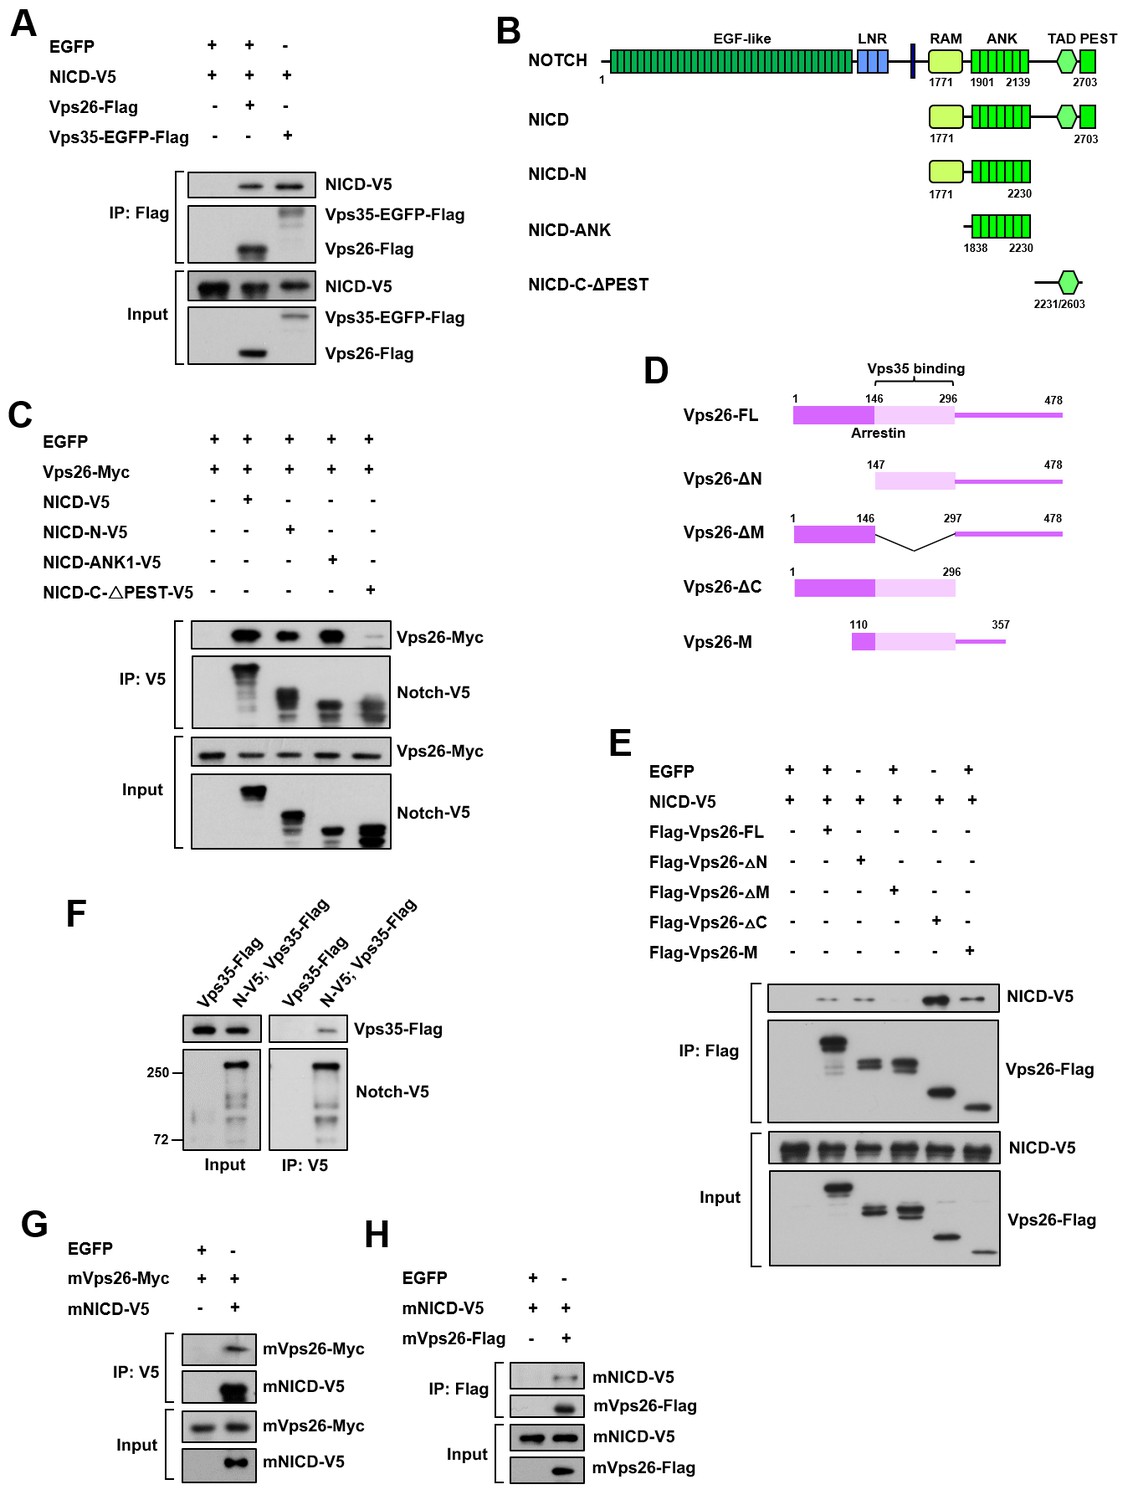
Retromer physically interacts with Notch.
(A) Coimmunoprecipitation (CoIP) of FLAG-tagged Vps26 or Vps35 and V5-tagged Notch intracellular domain (NICD) in HEK293T cell extracts. Note that in these and subsequent panels, EGFP served as a negative control. (B) Schematic drawings of NICD protein domains and truncated constructs. (C) CoIP of full-length (FL) or truncated NICD-V5 and Vps26-Myc in HEK293T cells. (D) Schematic drawings of Vps26 protein domains and truncated constructs. (E) The reciprocal coIP of full-length (FL) or truncated FLAG-Vps26 and NICD-V5 in HEK293T cells. (F) CoIP of Vps35-FLAG and Notch-V5 (N–V5) in fly larval brain extracts. Note that Vps35-FLAG and N-V5 were specifically expressed in neuroblast lineages by insc-Gal4. (G,H) CoIP of Myc-tagged mouse Vps26 (mVps26-Myc) and V5-tagged mouse NICD (mNICD-V5) and the reciprocal coIP of mVps26-FLAG and mNICD-V5 in HEK293T cell extracts.
Figure 5 with 2 supplements
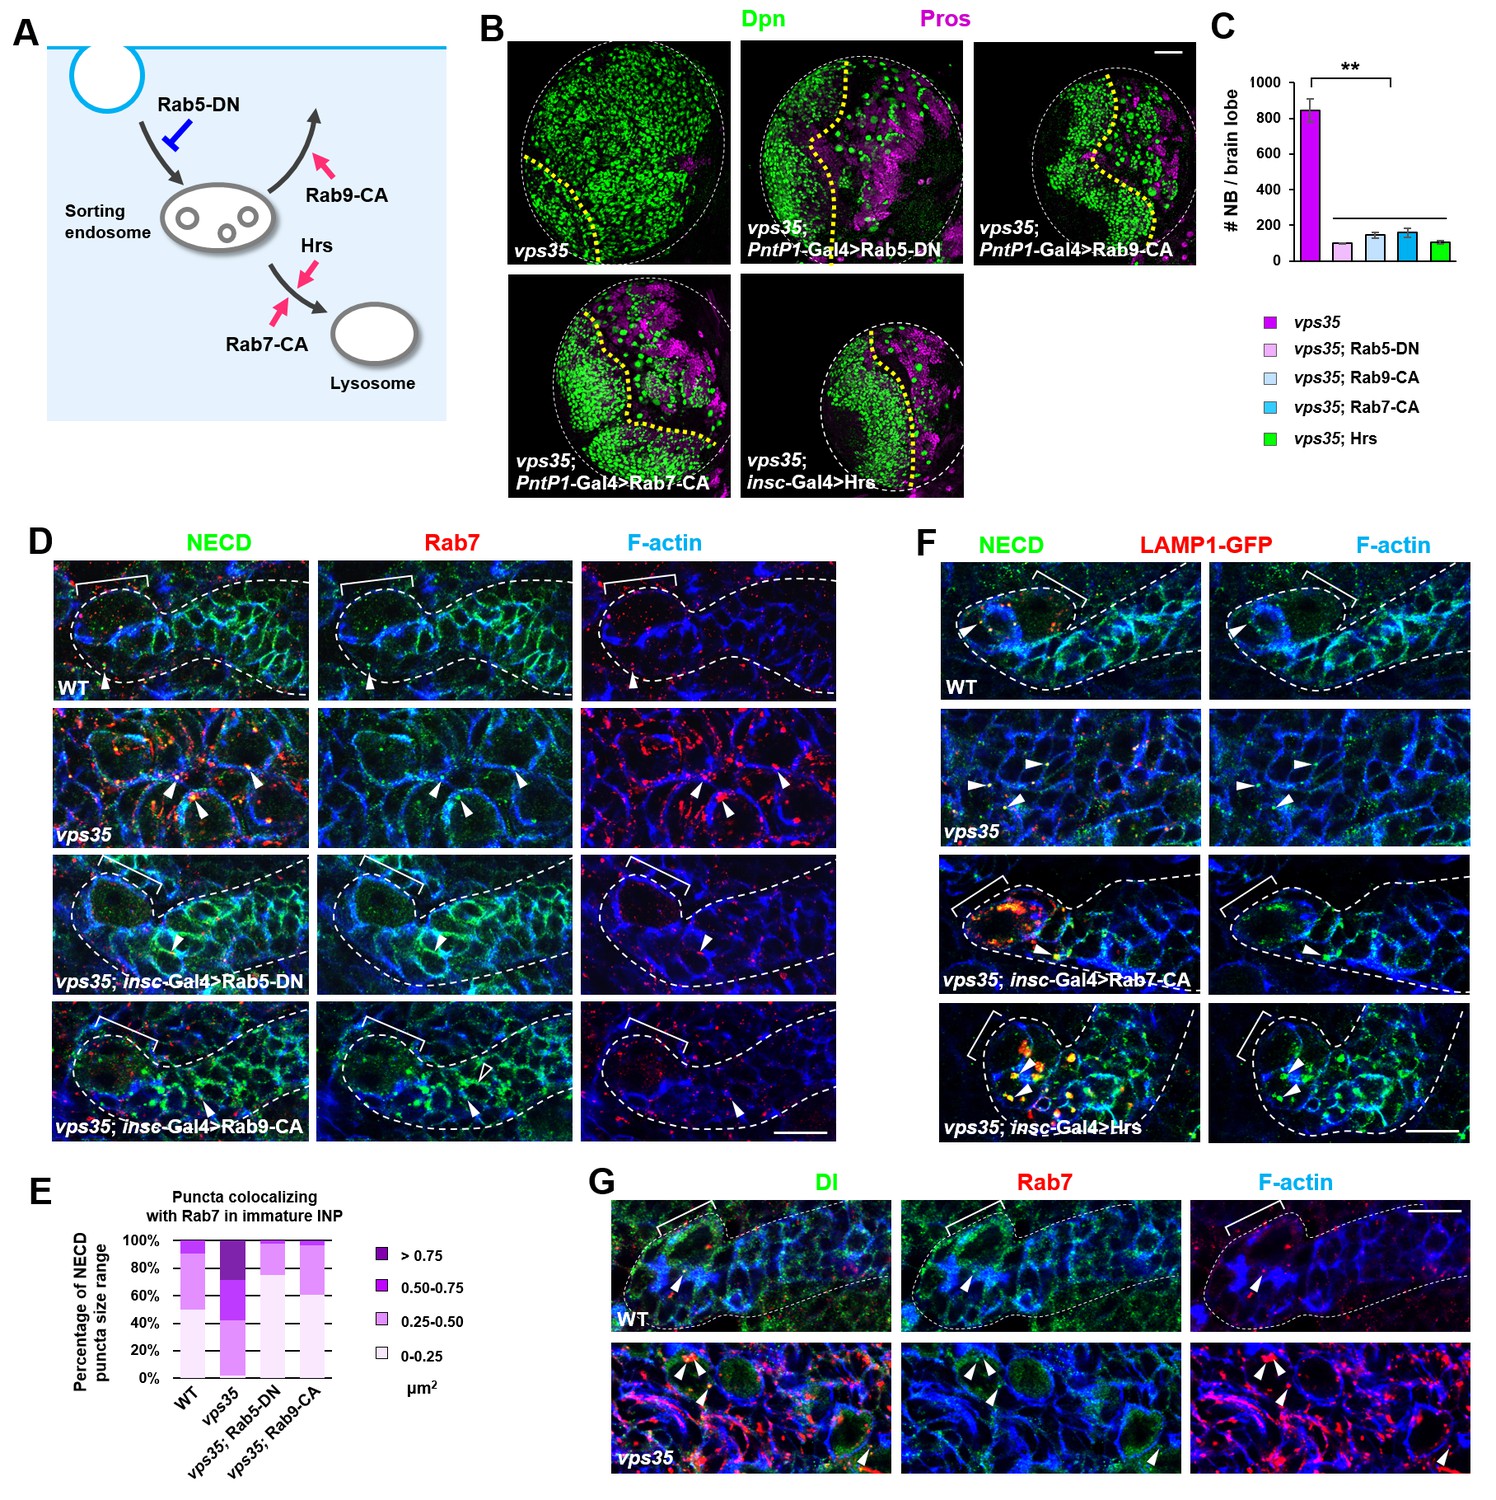
Retromer prevents intracellular ectopic cleavage of Notch receptors.
(A) Schematic depicting a simplified endocytic pathway. Red arrow: promotion; blue flat line: inhibition. (B,C) Larval brain lobes of indicated genotypes were stained for Dpn and Pros. Quantification of total neuroblast number per brain lobe is shown in (C). **p<0.001 (n = 10–12). (D,E) Type II neuroblast lineages of indicated genotypes were stained for NECD, Rab7 and F-actin. NECD puncta colocalizing with Rab7 are marked with arrowheads. Quantification of the size range of Notch puncta colocalizing with Rab7+ endosomes is shown in (E). (F) Type II neuroblast lineages of indicated genotypes were stained for NECD, GFP and F-actin. (G) Type II neuroblast lineages of indicated genotypes were stained for Delta, Rab7 and F-actin. Scale bars, 50 μm (B) and 10 μm (D,F,G).
-
Figure 5—source data 1
Input data for bar graph Figure 5C.
- https://doi.org/10.7554/eLife.38181.019
Figure 5—figure supplement 1
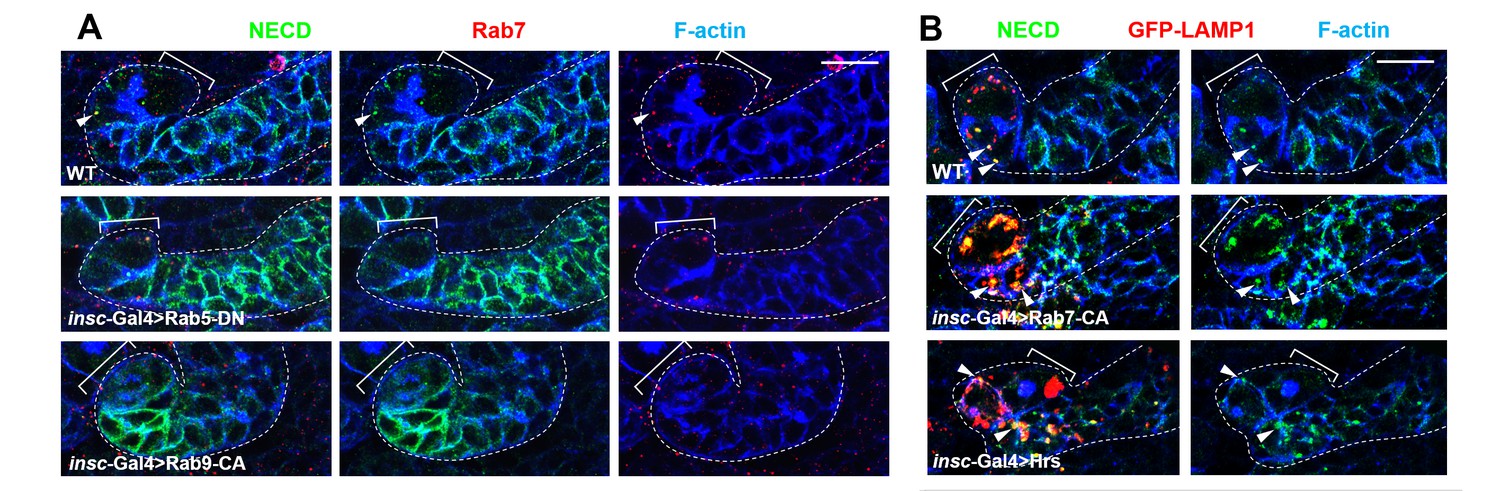
The effects of Rab5-DN, Rab9-CA, Rab7-CA or Hrs expression on Notch receptor trafficking.
(A) Type II neuroblast lineages of indicated genotypes were stained for NECD, Rab7 and F-actin. NECD puncta colocalizing with Rab7 were marked with arrowheads. Note that expression of Rab5-DN or Rab9-CA resulted in increased cortical distribution of Notch and decreased colocalization between Notch and Rab7. (B) Type II neuroblast lineages of indicated genotypes were stained for NECD, GFP-LAMP1 and F-actin. Scale bars, 10 μm (A,B).
Figure 5—figure supplement 2
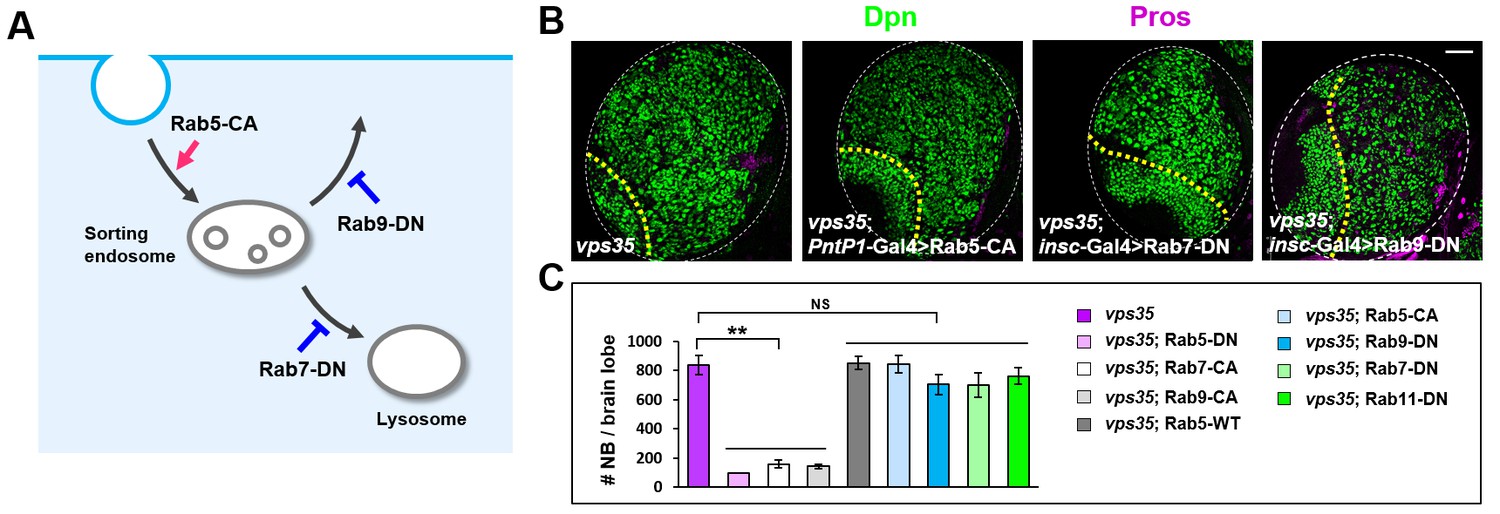
Overexpression of Rab5-CA, Rab7-DN or Rab9-DN failed to inhibit the brain tumor phenotype in vps35 mutants.
(A) Cartoon depicting a simplified endocytic pathway. Red arrow: promotion; blue flat line: inhibition. (B,C) Larval brain lobes of indicated genotypes were stained for Dpn and Pros. Quantification of total neuroblast number per brain lobe is shown in (C). **p<0.001; NS, not significant (n = 10–12). Scale bar, 50 μm.
Figure 6 with 4 supplements
Retromer compensates for the inefficient Notch polyubiquitination and lysosomal degradation.
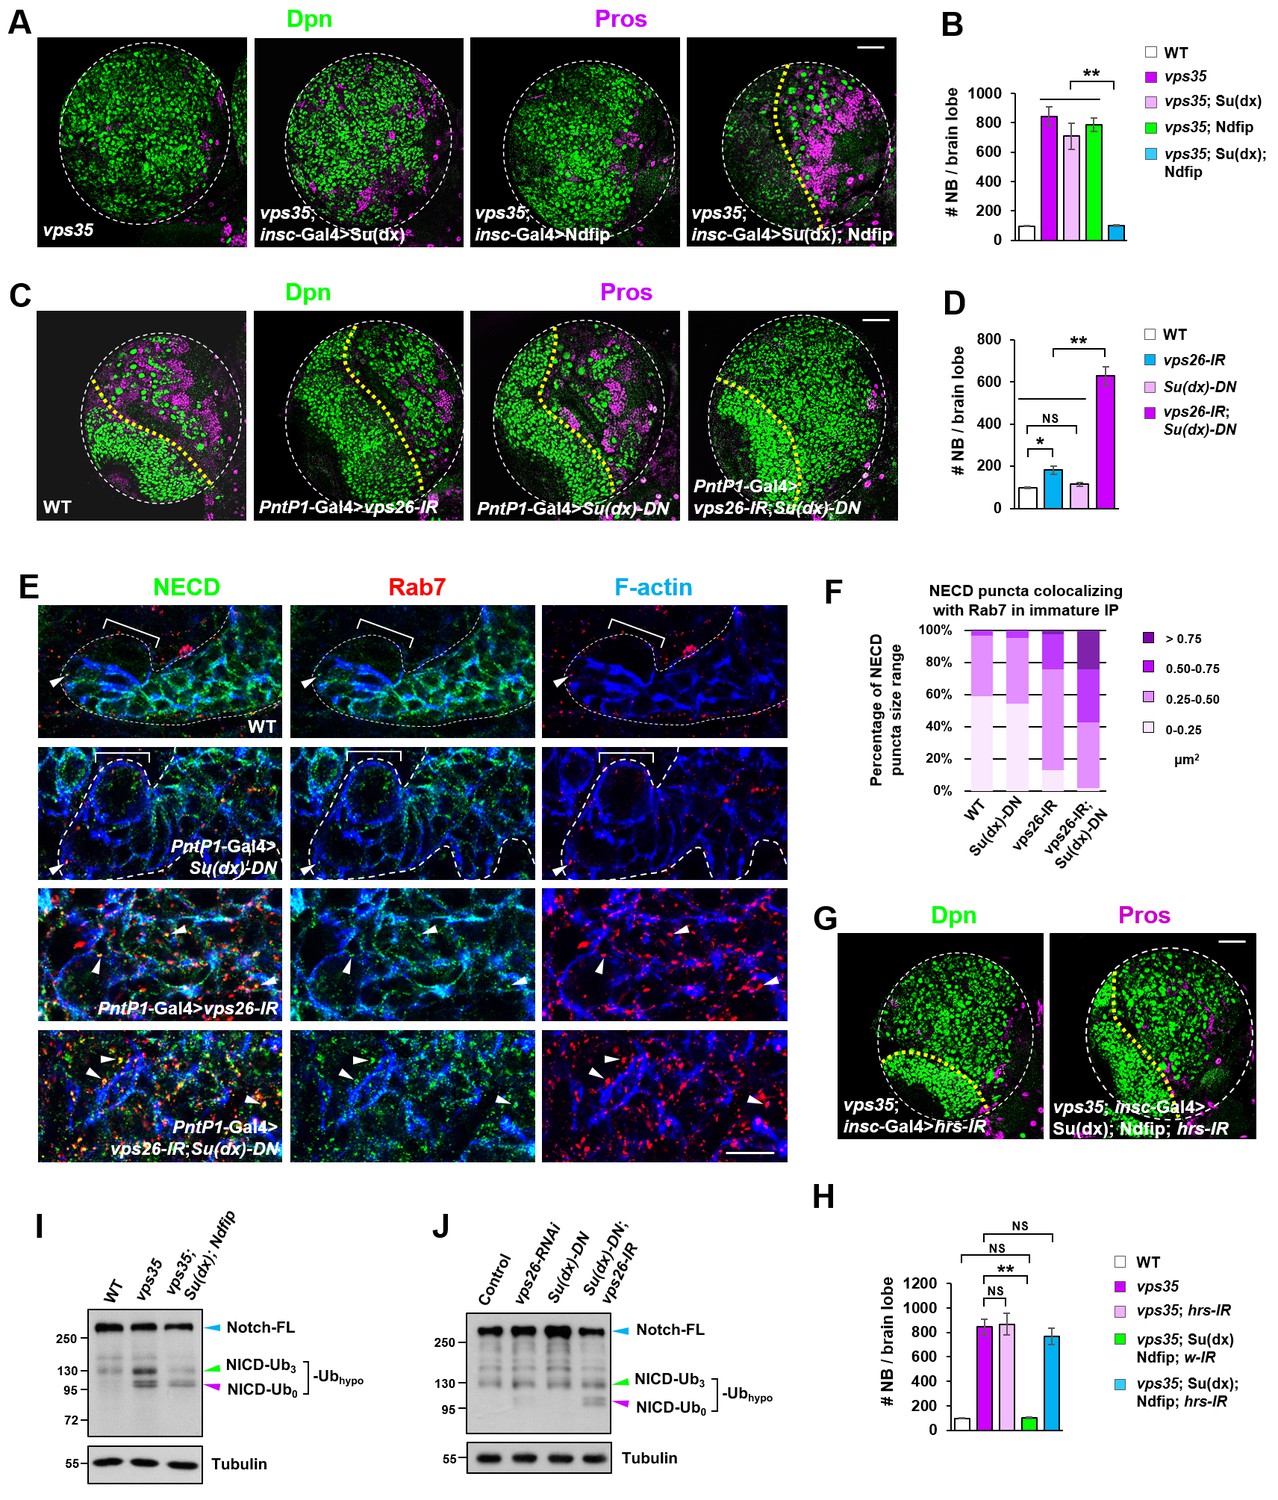
(A,B) Neuroblast-specific coexpression of both Su(dx) and Ndfip but not either alone potently inhibited brain tumor phenotype in vps35 mutants. Quantification of total neuroblast number of indicated genotypes is shown in (B). **p<0.001 (n = 12–15). (C,D) Larval brain lobes of indicated genotypes were stained for Dpn and Pros. Quantification of total neuroblast number per brain lobe is shown in (D). **p<0.001; *p<0.01; NS, not significant (n = 13–15). (E) Type II neuroblast lineages of indicated genotypes were stained for NECD, Rab7 and F-actin. NECD puncta colocalizing with Rab7 are marked with arrowheads. (F) Quantification of the size range of Notch puncta colocalizing with Rab7+ endosomes in immature or dedifferentiating neural progenitors of indicated genotypes. (G,H) Larval brain lobes of indicated genotypes were stained for Dpn and Pros. Quantification of total neuroblast number per brain lobe is shown in (H). **p<0.001; NS, not significant (n = 11–15). (I,J) Western blot analysis of larval brain extracts of indicated genotypes using anti-NICD antibody. Anti-α-tubulin blot served as a loading control. Note that hypo-ubiquitinated NICD fragments included NICD carrying approximately three ubiquitin moieties (NICD-Ub3) and un-ubiquitinated NICD (NICD-Ub0). Scale bars, 10 μm (E) and 50 μm (A,C,G).
-
Figure 6—source data 1
Input data for bar graph Figure 6B,D,H.
- https://doi.org/10.7554/eLife.38181.025
Figure 6—figure supplement 1

Coexpression of Su(dx) and Ndfip specifically suppresses brain tumor phenotypes in vps35 mutants.
(A,B) Larval brain lobes of indicated genotypes were stained for Dpn and Pros. Quantification of total neuroblast number per brain lobe is shown in (B). **p<0.001; NS, not significant (n = 10–15). Note that coexpression of Nedd4 with Ndfip or Su(dx) failed to suppress the supernumerary neuroblast phenotype in vps35 mutants. (C) Simultaneous expression of Su(dx) and Ndfip or Nedd4 and Ndfip potently inhibited Wg expression in wing discs, indicating that the Nedd4 transgene is functional. (D,E) Enlarged NECD puncta colocalizing with Rab7+ endosomes in vps35 mutant dedifferentiating neural progenitors drastically shrank upon coexpression of Su(dx) and Ndfip (arrowheads in D). Quantification of the size range of NECD puncta colocalizing with Rab7+ endosomes is shown in (E). Scale bars, 50 μm (A) and 10 μm (D).
Figure 6—figure supplement 2

Distribution patterns of Su(dx) and Ndfip in type II neuroblast lineages.
(A,B) Antibodies raised against Su(dx) (A) and Ndfip (B) are highly specific. Western blot analysis of wild type and insc-Gal4 >UAS-Myc-Su(dx) larval brain extracts (left) or wild type and insc-GAL4 >UAS Flag-Ndfip larval brain extracts (right) confirmed the specificity of Su(dx) and Ndfip antibodies respectively. (C,D) Su(dx) displayed cortical distribution in type II neuroblast lineages (C), whereas Ndfip showed largely punctuated distribution in type II neuroblast lineages (D). Scale bars, 10 μm (C,D).
Figure 6—figure supplement 3
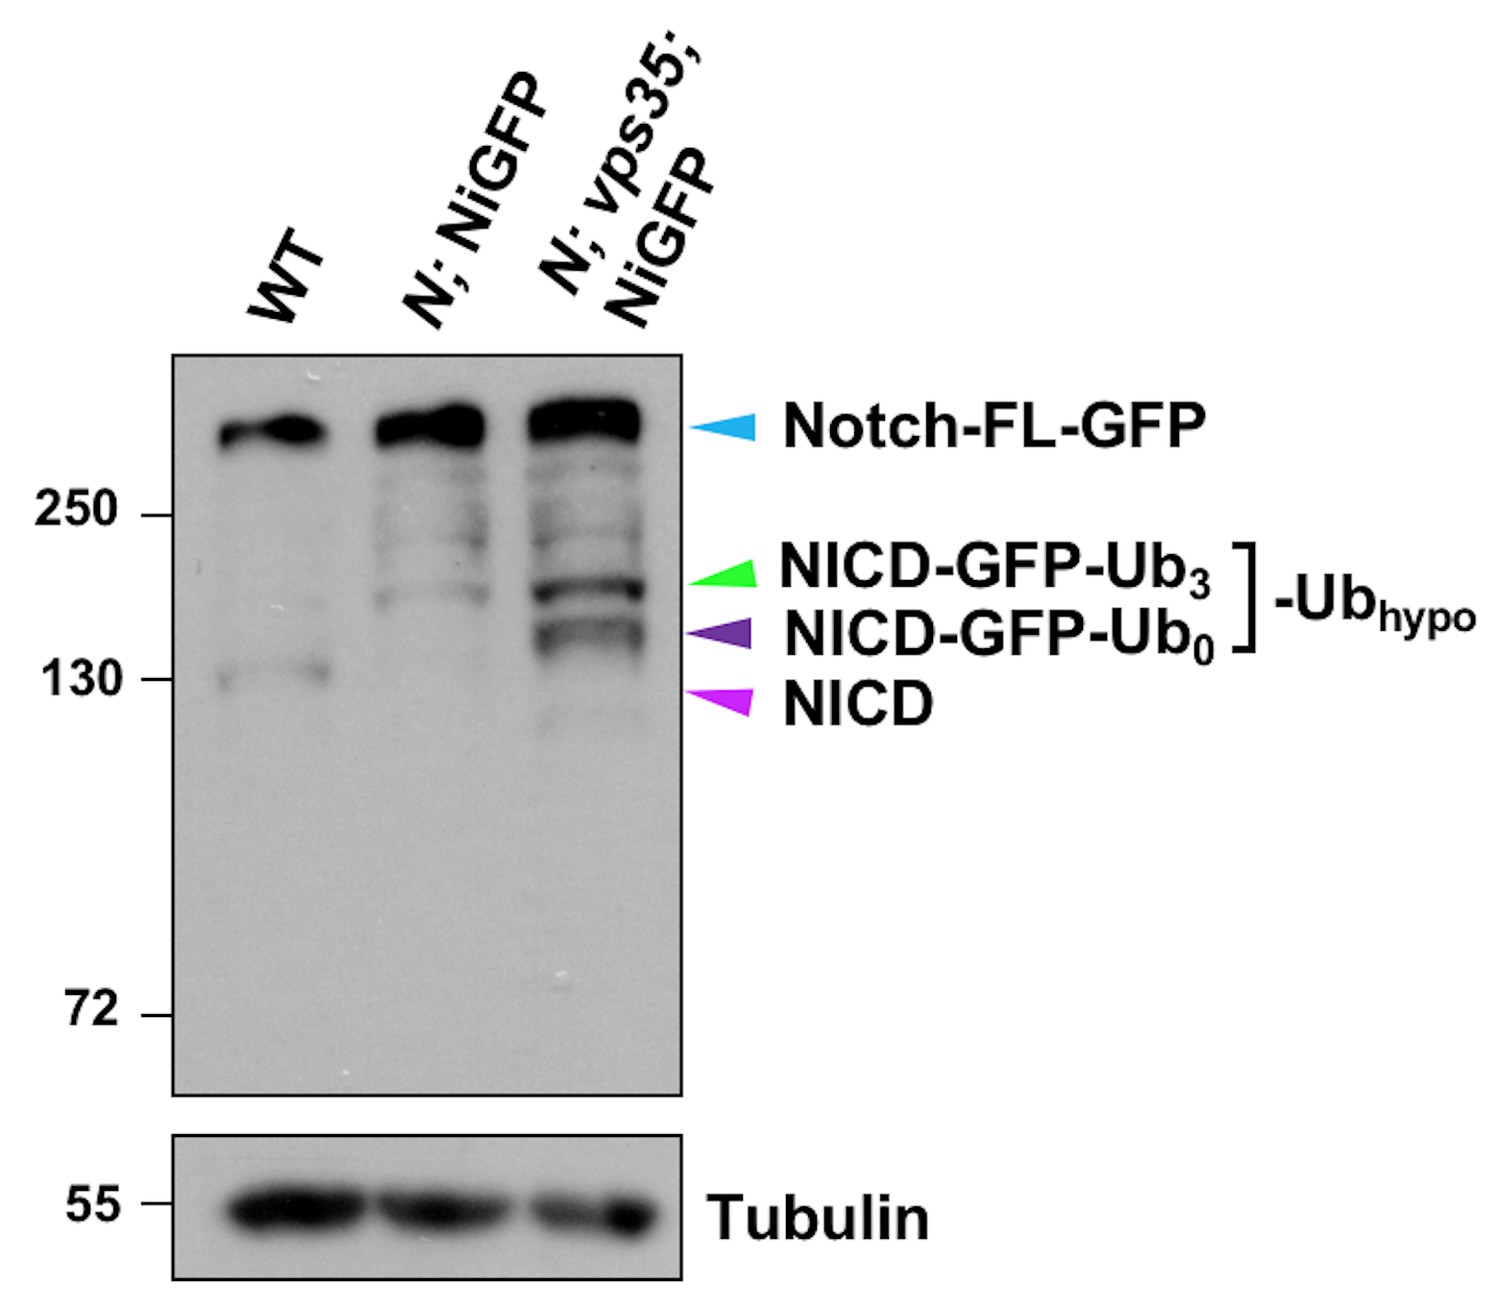
Proteolytic processing of NiGFP in Notch mutant or Notch; vps35 double mutant larval brain extracts.
Western blot analysis of wild type, N55e11; NiGFP or N55e11; NiGFP; vps35 larval brain extracts using anti-NICD antibody. Anti-α-Tubulin blot serves here as a loading control. Note that NiGFP is a BAC transgene expressing a fully functional GFP-tagged Notch, whereas N55e11 is a null mutant allele of Notch. Note that hypo-ubiquitinated NICD-GFP fusion includes NICD-GFP carrying approximately three ubiquitin moieties (NICD-GFP-Ub3; green arrowhead) and un-ubiquitinated NICD-GFP (NICD-GFP-Ub0; dark purple arrowhead) fragments. Also note that the cyan and light purple arrowheads indicate full-length Notch-GFP fusion (cyan) and NICD (purple) bands respectively.
Figure 6—figure supplement 4
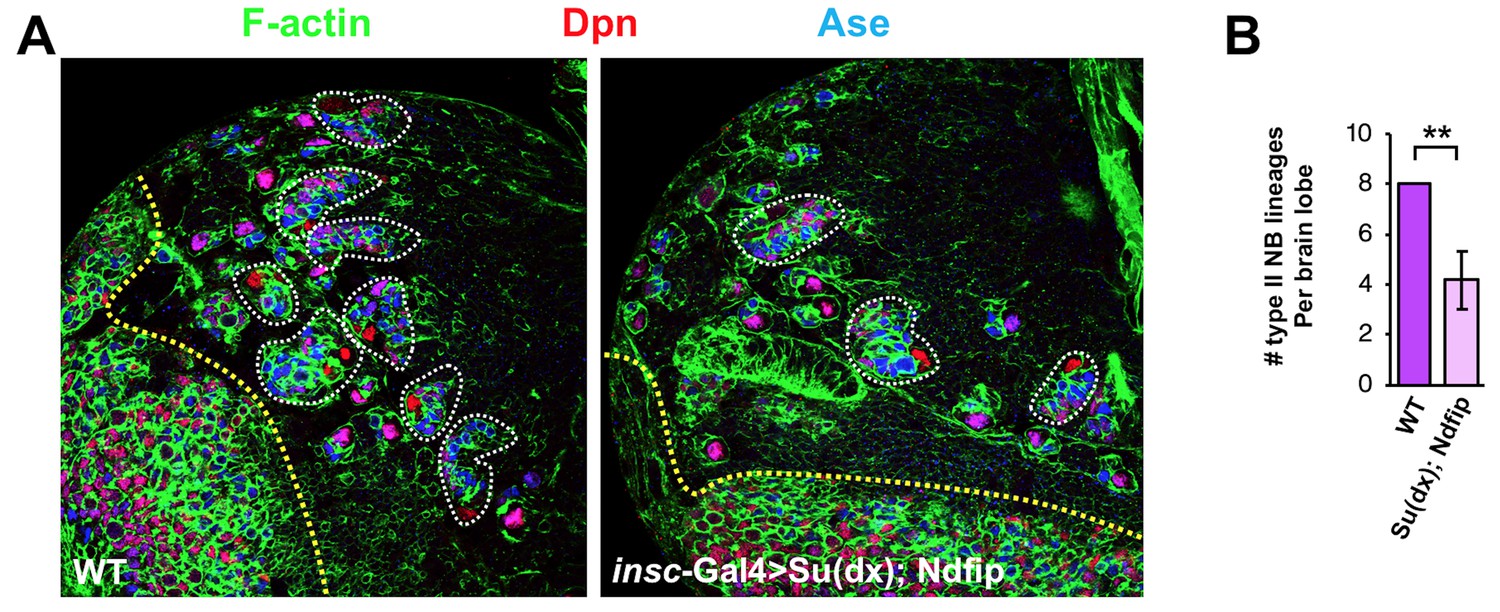
Co-overexpression of Su(dx) and Ndfip caused loss of type II neuroblast lineages and brain tissue atrophy.
Larval brain lobes of WT or insc-Gal4 >Su(dx); Ndfip background were stained for Dpn and Ase. Each type II neuroblast lineage is encircled by dashed line. Quantification of type II neuroblast lineage number per brain lobe is shown in (B). **p<0.001 (n = 10–12).
Figure 7

Working model.
A graphic model depicting a safeguard mechanism whereby retromer ensures unidirectional Notch signaling (purple arrow) from neural progenitor (light blue) to neural stem cell (NSC; pink) by preventing cell-autonomous ectopic Notch signaling activation in neural progenitors. Retromer (purple) normally interacts with Notch (green) and retrieves the pool of hypoubiquitinated Notch evading the ESCRT (cyan)-lysosomal degradation pathway and sends it back to the cell surface (left panel). Upon retromer dysfunction, hypoubiquitinated Notch is accumulate in MVBs and aberrantly cleaved by γ-secretase (brown) in a ligand (light purple)-dependent manner, causing neural progenitor-originated tumorigenesis (right panel).
Author response image 1
Retromer regulates Notch signalling in fly neuroblast lineages with high specificity.
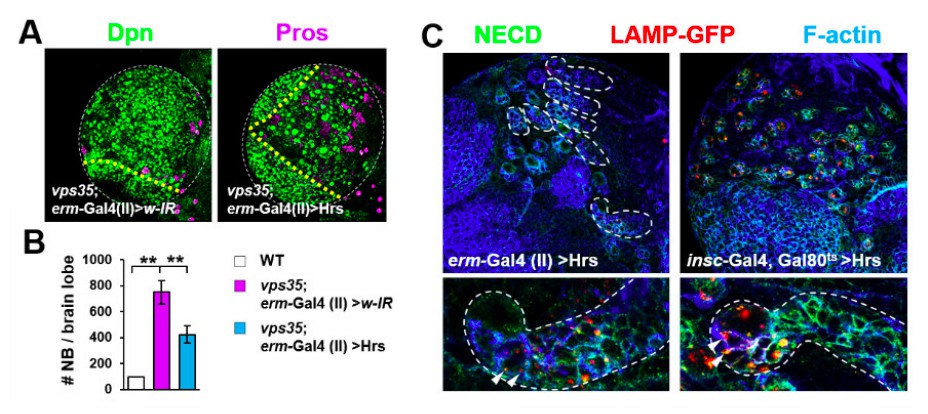
(A,B) Larval brain lobes of indicated genotypes were stained for Dpn and Pros. Quantification of total neuroblast number per brain lobe is shown in (B). **p < 0.001; (n=10-15). (C) Hrs driven by erm-Gal4 (II) showed much weaker effects in reducing type II neuroblast lineage number (upper panel) or transporting Notch receptor into LAMP-GFP+ lysosomes (arrowheads) in INPS (bottom panel) than driven by insc-Gal4. Close-up images of type II neuroblast lineages are displayed at the bottom panel. Note that type II neuroblast lineages are encircled by white dashed lines.
Tables
Key resources table
| Reagent type (species) or resource | Designation | Source or reference | Identifiers | Additional information |
|---|---|---|---|---|
| Genetic reagent (D. melanogaster) | insc-Gal4 | (Luo et al., 1994) | N/A | |
| Genetic reagent (D. melanogaster) | PntP1-Gal4 | (Zhu et al., 2011) | N/A | |
| Genetic reagent (D. melanogaster) | ase-Gal4 | (Zhu et al., 2006) | N/A | |
| Genetic reagent (D. melanogaster) | erm-Gal4 (II) | (Xiao et al., 2012) | N/A | |
| Genetic reagent (D. melanogaster) | erm-Gal4 (III) | (Pfeiffer et al., 2008; Weng et al., 2010) | N/A | |
| Genetic reagent (D. melanogaster) | UAS-vps26-RNAi | Bloomington Drosophila Stock Center | RRID: BDSC_38937 | |
| Genetic reagent (D. melanogaster) | UAS-Notch-RNAi | Vienna Drosophila RNAi Center | RRID: VDRC_27229 | |
| Genetic reagent (D. melanogaster) | UAS-Delta-RNAi | Bloomington Drosophila Stock Center | RRID: BDSC_34322 | |
| Genetic reagent (D. melanogaster) | UAS-wg-RNAi | Bloomington Drosophila Stock Center | RRID: BDSC_32994 | |
| Genetic reagent (D. melanogaster) | UAS-med-RNAi | Bloomington Drosophila Stock Center | RRID: BDSC_52214 | |
| Genetic reagent (D. melanogaster) | UAS-Hrs-RNAi | Bloomington Drosophila Stock Center | RRID: BDSC_34086; BDSC_33900 | |
| Genetic reagent (D. melanogaster) | UAS-white-RNAi | Bloomington Drosophila Stock Center | RRID: BDSC_33644 | |
| Genetic reagent (D. melanogaster) | UAS-Vps26-Myc | This paper | N/A | |
| Genetic reagent (D. melanogaster) | UAS-Vps35-FLAG | This paper | N/A | |
| Genetic reagent (D. melanogaster) | UAS-hVps35-FLAG | This paper | N/A | |
| Genetic reagent (D. melanogaster) | UAS-HA-Rab9-CA | This paper | N/A | |
| Genetic reagent (D. melanogaster) | UAS-Myc-Su(dx) | This paper | N/A | |
| Genetic reagent (D. melanogaster) | UAS-Myc-Su(dx)-C917A | This paper | N/A | |
| Genetic reagent (D. melanogaster) | UAS-Myc-Nedd4 | This paper | N/A | |
| Genetic reagent (D. melanogaster) | UAS-FLAG-Ndfip | This paper | N/A | |
| Genetic reagent (D. melanogaster) | UAS-Su(dx) | Bloomington Drosophila Stock Center | RRID: BDSC_51664 | |
| Genetic reagent (D. melanogaster) | UAS-Hrs | (Lloyd et al., 2002) | N/A | |
| Genetic reagent (D. melanogaster) | UAS-Spdo-GFP | (Song and Lu, 2012) | N/A | |
| Genetic reagent (D. melanogaster) | UAS-Dl-DN | Bloomington Drosophila Stock Center | RRID: BDSC_26698 | |
| Genetic reagent (D. melanogaster) | UAS-Psn-DN | Bloomington Drosophila Stock Center | RRID: BDSC_8323 | |
| Genetic reagent (D. melanogaster) | UAS-Kuz-DN | Bloomington Drosophila Stock Center | RRID: BDSC_6578 | |
| Genetic reagent (D. melanogaster) | UAS-EGFR-DN | Bloomington Drosophila Stock Center | RRID: BDSC_5364 | |
| Genetic reagent (D. melanogaster) | UAS-ptc-DN | Bloomington Drosophila Stock Center | RRID: BDSC_31928 | |
| Genetic reagent (D. melanogaster) | UAS-GFP-LAMP1 | Bloomington Drosophila Stock Center | RRID: BDSC_42714 | |
| Genetic reagent (D. melanogaster) | UAS-mito-GFP | Bloomington Drosophila Stock Center | RRID: BDSC_8442 | |
| Genetic reagent (D. melanogaster) | sqh-EYFP-Golgi | Bloomington Drosophila Stock Center | RRID: BDSC_7193 | |
| Genetic reagent (D. melanogaster) | UAS-YFP-Rab5-WT | Bloomington Drosophila Stock Center | RRID: BDSC_24616 | |
| Genetic reagent (D. melanogaster) | UAS-YFP-Rab5-CA | Bloomington Drosophila Stock Center | RRID: BDSC_9773 | |
| Genetic reagent (D. melanogaster) | UAS-Rab5-DN | Bloomington Drosophila Stock Center | RRID: BDSC_42704 | |
| Genetic reagent (D. melanogaster) | UASp-YFP-Rab7-DN | Bloomington Drosophila Stock Center | RRID: BDSC_9778 | |
| Genetic reagent (D. melanogaster) | UAS-Rab7-CA | Bloomington Drosophila Stock Center | RRID: BDSC_42707 | |
| Genetic reagent (D. melanogaster) | UASp-YFP-Rab9-WT | Bloomington Drosophila Stock Center | RRID: BDSC_9784 | |
| Genetic reagent (D. melanogaster) | UASp-YFP-Rab9-CA | Bloomington Drosophila Stock Center | RRID: BDSC_9785 | |
| Genetic reagent (D. melanogaster) | UASp-YFP-Rab9-DN | Bloomington Drosophila Stock Center | RRID: BDSC_23642 | |
| Genetic reagent (D. melanogaster) | UAS-YFP-Rab11-DN | Bloomington Drosophila Stock Center | RRID: BDSC_9792 | |
| Genetic reagent (D. melanogaster) | vps35E42 | Gift from Xinhua Lin (Belenkaya et al., 2008) | N/A | |
| Genetic reagent (D. melanogaster) | vps351 | Gift from Xinhua Lin (Belenkaya et al., 2008) | N/A | |
| Genetic reagent (D. melanogaster) | N55e11; NiGFP | (Couturier et al., 2012) | N/A | |
| Genetic reagent (D. melanogaster) | UAS-FLP, Ubi-p63E- FRT-nlsGFP | Bloomington Drosophila Stock Center | RRID: BDSC_28282 | |
| Antibody | Mouse anti-NotchECD (C458.2H) | Developmental Studies Hybridoma Bank | RRID: AB_528408 | IHC (1:80) |
| Antibody | Mouse anti-Pros (MR1A) | Developmental Studies Hybridoma Bank | RRID: AB_528440 | IHC (1:100) |
| Antibody | Rat anti-Mira | Abcam | Cat#Ab197788 | IHC (1:100) |
| Antibody | Rabbit anti-Dpn | Gift from Y.N. Jan | N/A | IHC (1:1000) |
| Antibody | Guinea pig anti-Numb | Gift from J. Skeath (O'Connor-Giles and Skeath, 2003) | N/A | IHC (1:1000) |
| Antibody | Mouse anti-β- galactosidase (40-1a) | Developmental Studies Hybridoma Bank | RRID: AB_2314509 | IHC (1:100) |
| Antibody | Guinea pig anti-Ase | Gift from Y.N. Jan | N/A | IHC (1:400) |
| Antibody | Rabbit anti-aPKC ζ C20 | Santa Cruz Biotechnologies | RRID: AB_2168668 | IHC (1:1000) |
| Antibody | Rabbit anti-Rab7 | Gift from A. Nakamura (Tanaka and Nakamura, 2008) | N/A | IHC (1:2000) |
| Antibody | Mouse anti-Wg (4D4) | Developmental Studies Hybridoma Bank | RRID: AB_528512 | IHC (1:100) |
| Antibody | Mouse anti-Ptc (Apa 1) | Developmental Studies Hybridoma Bank | RRID: AB_528441 | IHC (1:100) |
| Antibody | Rabbit anti-Myc (71D10) | Cell Signaling Technology | RRID: AB_10693332 | WB (1:2000) |
| Antibody | Rabbit anti-FLAG | Sigma-Aldrich | RRID: AB_439687 | IHC (1:1000) |
| Antibody | Rabbit anti-V5 | Sigma-Aldrich | RRID: AB_261889 | WB (1:1000) |
| Antibody | Mouse anti-c-Myc | CW Biotech | Cat#cw0299M | WB (1:2000) |
| Antibody | Mouse anti-DeltaECD (C594.9B) | Developmental Studies Hybridoma Bank | RRID: AB_528194 | IHC (1:200) |
| Antibody | Mouse anti-NotchICD (C17.9C6) | Developmental Studies Hybridoma Bank | RRID: AB_528410 | WB (1:1000) |
| Antibody | Rabbit anti-Vps26 | This paper | N/A | IHC (1:200) |
| Antibody | Rabbit anti-Su(dx) | This paper | N/A | IHC (1:200) |
| Antibody | Rabbit anti-Ndfip | This paper | N/A | IHC (1:100) |
| Antibody | Anti-V5 affinity gels | Sigma-Aldrich | RRID: AB_10062721 | 15 μl gel per coIP reaction |
| Antibody | Anti-FLAG M2 affinity gels | Sigma-Aldrich | RRID: AB_10063035 | 15 μl gel per coIP reaction |
| Software, algorithm | ImageJ | NIH | N/A | |
| Software, algorithm | Photoshop CS5 | Adobe | N/A | |
| Software, algorithm | The Leica Application Suite 2.6.3 | Leica | N/A | |
| Cell line (Human) | HEK293T | ATCC | RRID: CRL-3216 | |
| Recombinant DNA reagent | pcDNA3.1 | Invitrogen | Cat#: V79020 | |
| Recombinant DNA reagent | vps26 (Drosophila cDNA) | BDGP | LD29140 | |
| Recombinant DNA reagent | vps35-RB (Drosophila cDNA) | BDGP | SD03023 | |
| Recombinant DNA reagent | nedd4-RK (Drosophila cDNA) | BDGP | SD04682 | |
| Recombinant DNA reagent | vps35 (human cDNA) | Human ORFeome | Internal ID: 7965 Genbank Accession: CV029249 | |
| Recombinant DNA reagent | vps26A (human cDNA) | Addgene | Cat#17636 | |
| Recombinant DNA reagent | NICD1 (mouse cDNA) | Addgene | Cat#20183 |
Additional files
-
Transparent reporting form
- https://doi.org/10.7554/eLife.38181.027
Download links
A two-part list of links to download the article, or parts of the article, in various formats.
Downloads (link to download the article as PDF)
Open citations (links to open the citations from this article in various online reference manager services)
Cite this article (links to download the citations from this article in formats compatible with various reference manager tools)
The retromer complex safeguards against neural progenitor-derived tumorigenesis by regulating Notch receptor trafficking
eLife 7:e38181.
https://doi.org/10.7554/eLife.38181


