The chloroplast 2-cysteine peroxiredoxin functions as thioredoxin oxidase in redox regulation of chloroplast metabolism
- University of Bielefeld, Germany
Figures
Figure 1 with 1 supplement
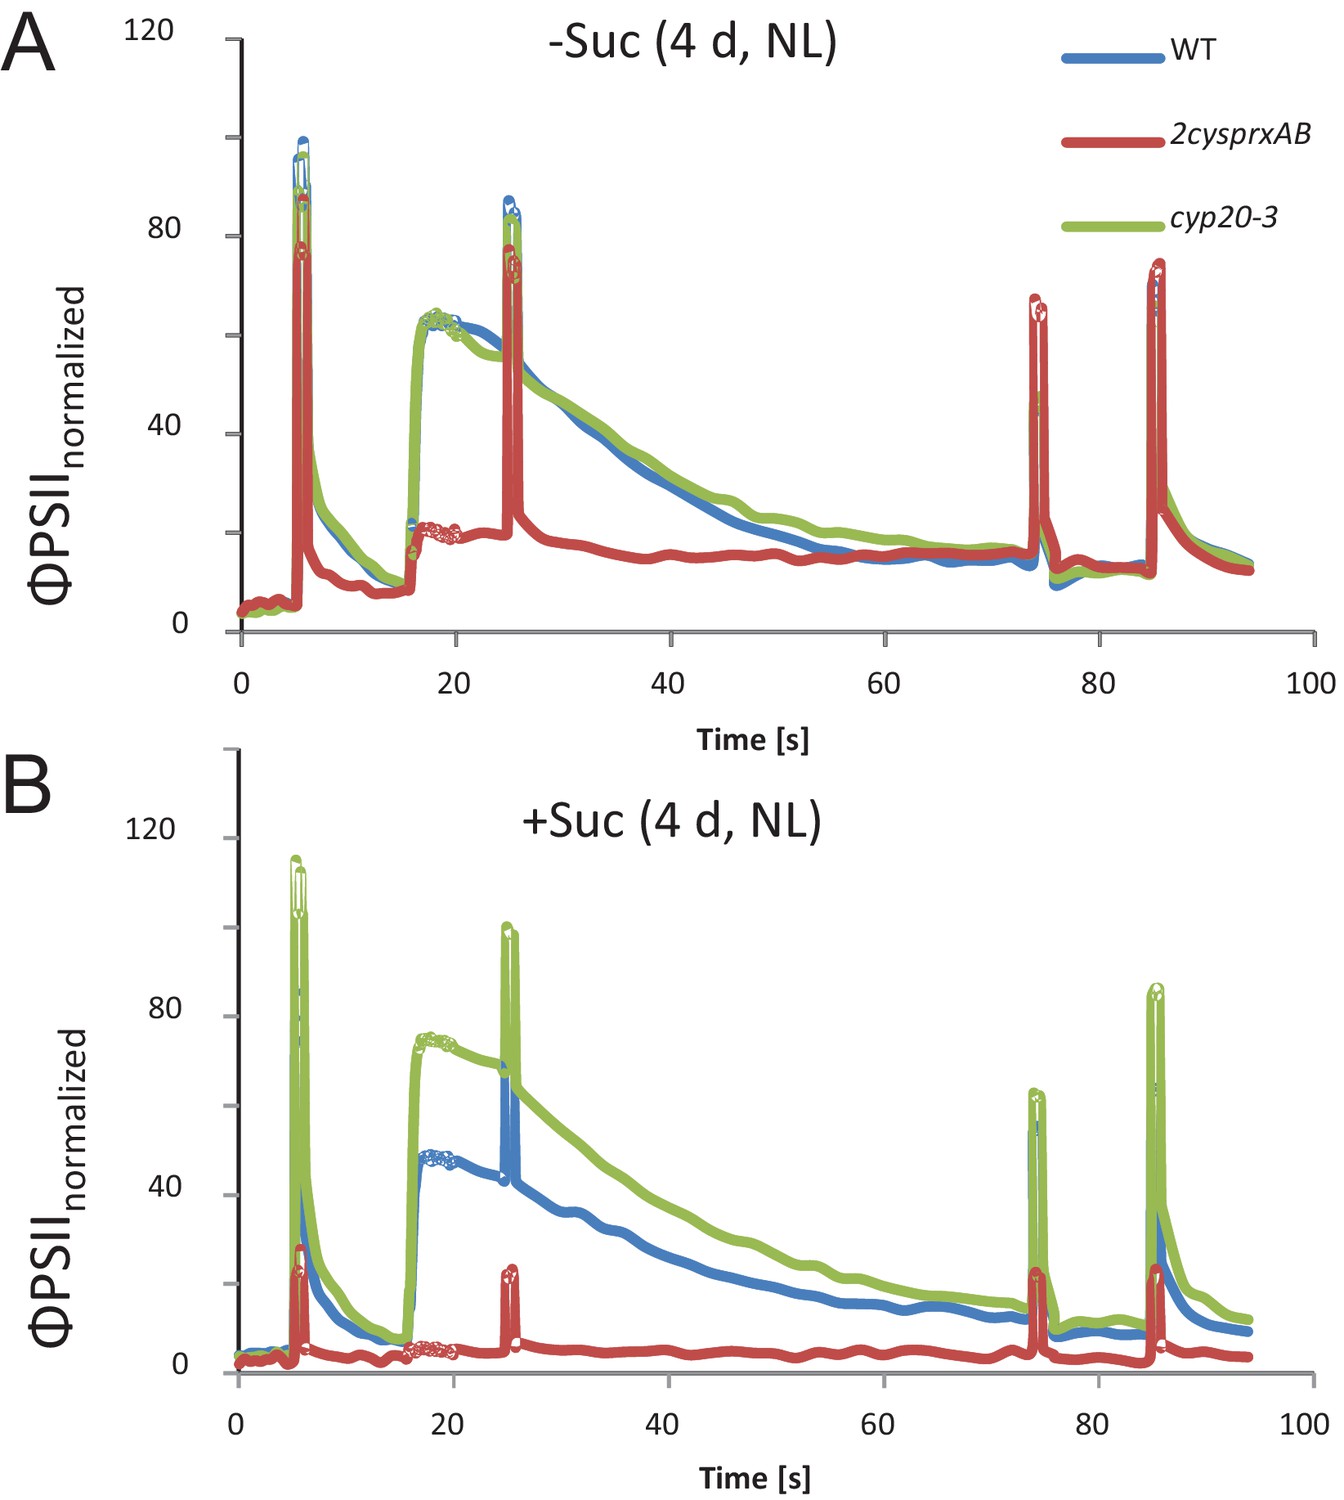
Chlorophyll-a fluorescence kinetics of 4d old wildtype, 2cysprxAB and cyclophilin 20–3 mutants.
Seeds were placed on phytogel-solidified half strength Murashige-Skoog medium with or without 0.5% sucrose, stratified for 2 d and then grown in a growth chamber with 8 hr light, 16 hr dark at 80 µmol quanta m−2 s−1 and 23°C. Chlorophyll a-fluorescence transients of the seedlings on the plates were imaged with the FluoroCam using the following settings: 30 min dark acclimation, measuring light on after 5 s, actinic light with 65 µmol quanta m−2 s−1 after 16.5 s. Actinic light was switched off after 76.5 s and the recording terminated at 94.5 s. Saturating light pulses of 900 µmol quanta m−2 s−1 were applied after 5, 25, 75 and 85 s. Data are means of kinetic data obtained from 34 (2cysprxAB) and 69 – 77 seedlings in three independent experiments. The following figure supplement is available for Figure 1.
Figure 1—figure supplement 1
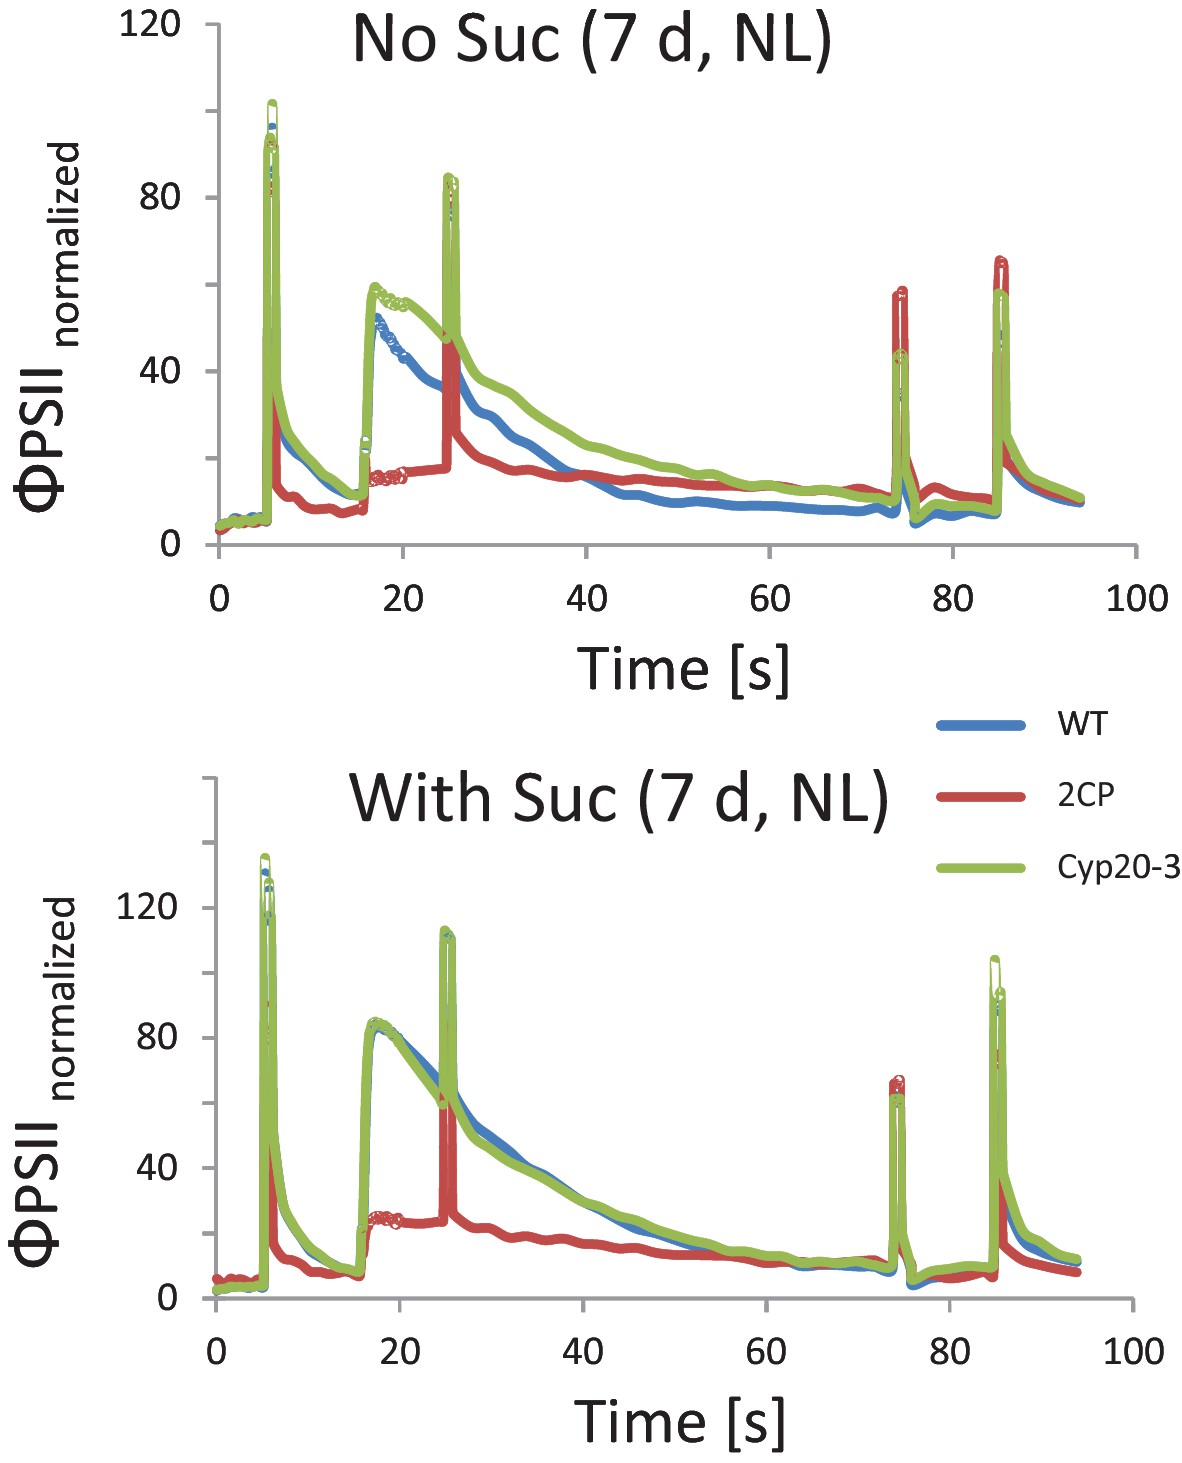
Chlorophyll-fluorescence kinetics of 7 d old wildtype, 2cysprxAB and cyclophilin 20–3 mutants.
Seeds were placed on phytogel-solidified half strength Murashige-Skoog medium with or without 0.5% sucrose, stratified for 2 d and then grown in a growth chamber with 16 hr light, 8 hr dark at 80 µmol quanta m−2 s−1 and 23°C. Chlorophyll a-fluorescence transients of the seedlings on the plates were imaged with the FluorCam with the following settings: 30 min dark acclimation, measuring light on after 5 s, actinic light with 65 µmol quanta m−2 s−1 after 16.5 s. Actinic light was switched off after 76.5 s and the recording terminated at 94.5 s. Saturating light pulses of 900 µmol quanta m−2 s−1 were applied after 5, 25, 75 and 85 s. Data are means of n = 27 (2cysprxAB, with sucrose) and 69–89 seedlings (all others).
Figure 2 with 1 supplement
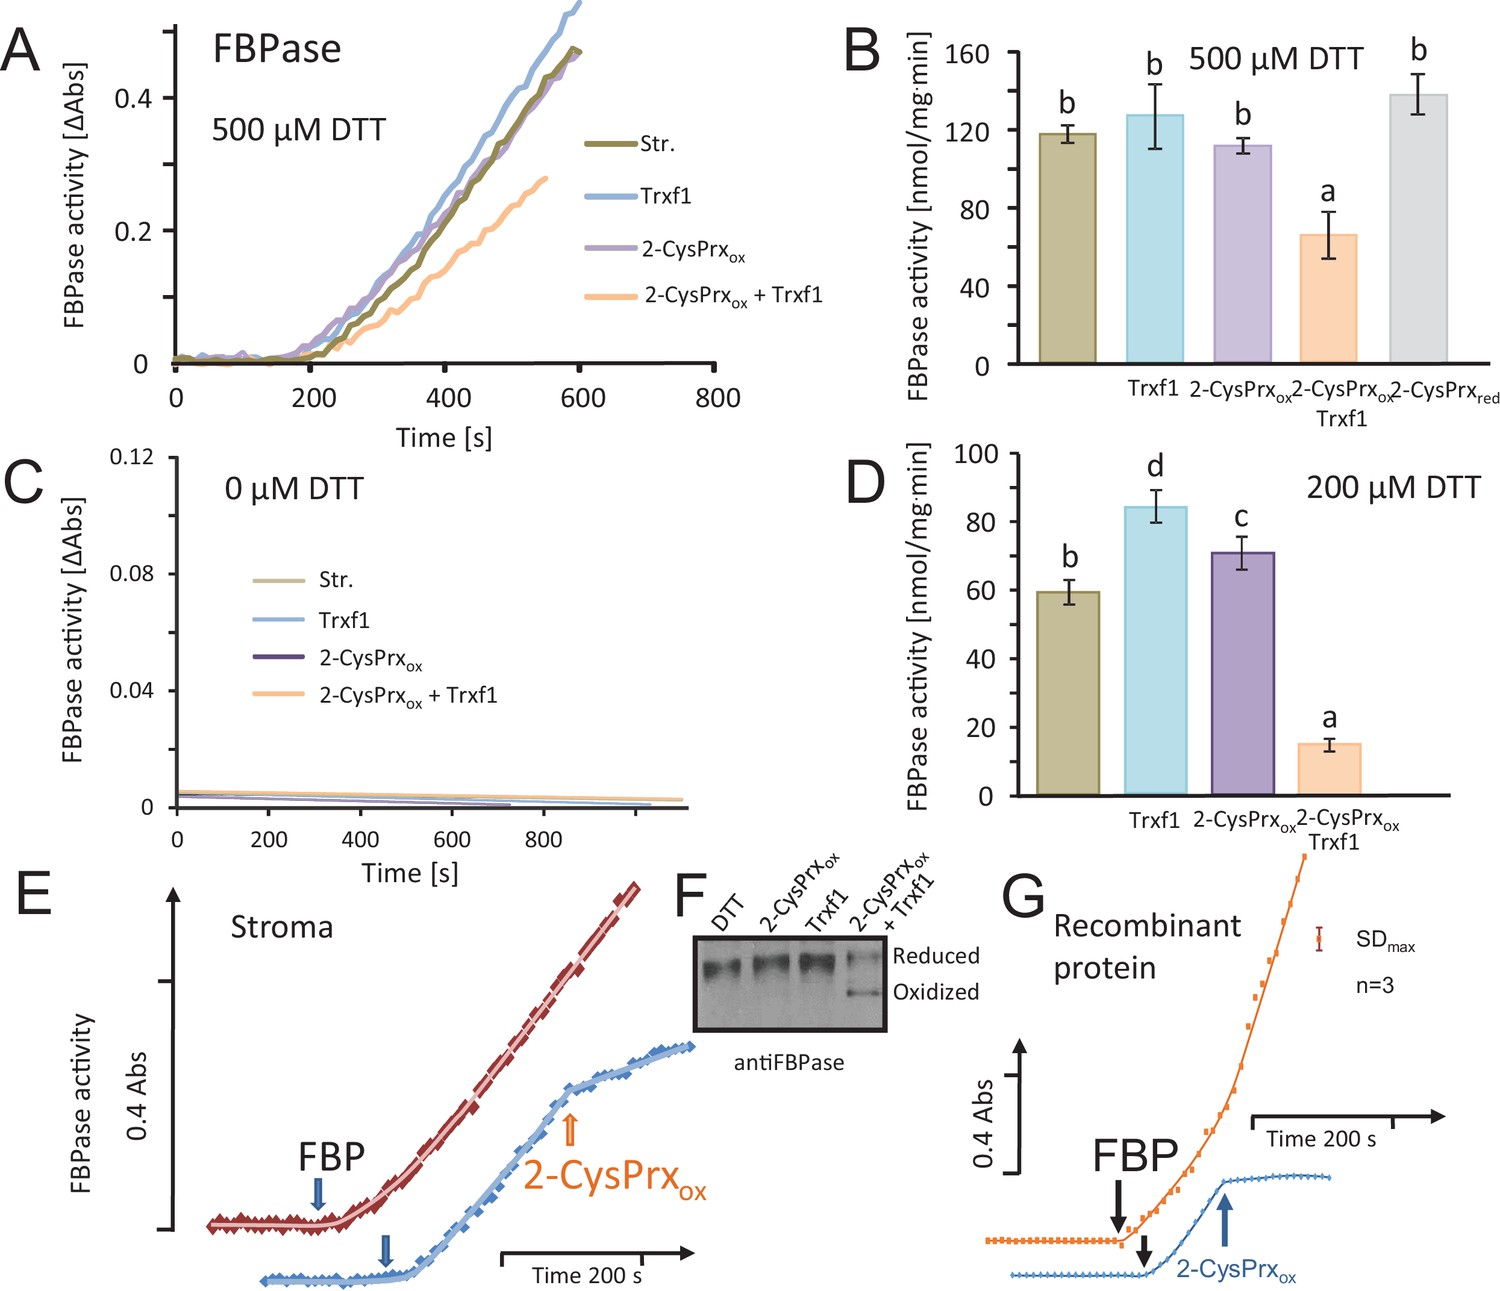
Inhibition of reductively activated FBPase by oxidized 2-CysPrxA.
(A) Isolated stroma was treated with 1 mM dithiothreitol (DTT) plus/minus Trx for pre-activation and then added to the FBPase activity test with a final DTT concentration of 500 µM. Test compounds as indicated were added at t = 0 s. Concentrations were: 5 µM Trx-f1, 5 µM oxidized 2-CysPrx. The enzyme assay was started by addition of 600 µM FBP at t = 180 s. (B) Average activity values were calculated from the maximum slope obtained for the different treatments from independent experiments. Data are means ± SD of n = 3. Statistics was calculated using one-sided ANOVA followed by Tukey’s HSD. Different letters mark significantly different groups. (C) Control measurements without DTT. (D) Activity in the presence of final DTT concentration of 200 µM (pre-activation with 400 µM DTT). (E) The speed of inactivation was documented by addition of 5 µM 2-CysPrxAox in the presence of Trx-f1 at the time point as indicated after establishing the linear rate of FBP hydrolysis. The FBPase activity was rapidly inhibited after addition of 2-CysPrxAox. (F) Redox state of FBPase in the assay shown in Figure 2A after labeling the reduced thiols with mPEG24. Migration of the reduced 2-CysPrx was slowed down and was abundant in the samples treated with DTT, DTT plus 2-CysPrxox or DTT plus Trx-f1 (upper band), but was strongly decreased after addition of the combination of 2-CysPrxox and Trx-f1. Same results were seen in several experiments. (G) Inhibition of recombinant FBPase by oxidized 2-CysPrxA. In this test, following reductive pre-activation of purified recombinant FBPase (2 µM) in the presence of Trx-f1 (5 µM), FBP hydrolysis was initiated by addition of 600 µM FBP. At the time point as indicated, oxidized recombinant 2-CysPrxA at a final concentration of 5 µM was added and caused rapid inhibition of FBPase activity, while the F6P-release continued in the control without 2-CysPrxA. The assay was performed three times with similar result. The error bar (top right) gives the maximum SD observed. The following figure supplement and source data are available for Figure 2.
-
Figure 2—source data 1
Values from the FBPase activity tests shown in Figure 2B and D.
- https://doi.org/10.7554/eLife.38194.006
Figure 2—figure supplement 1
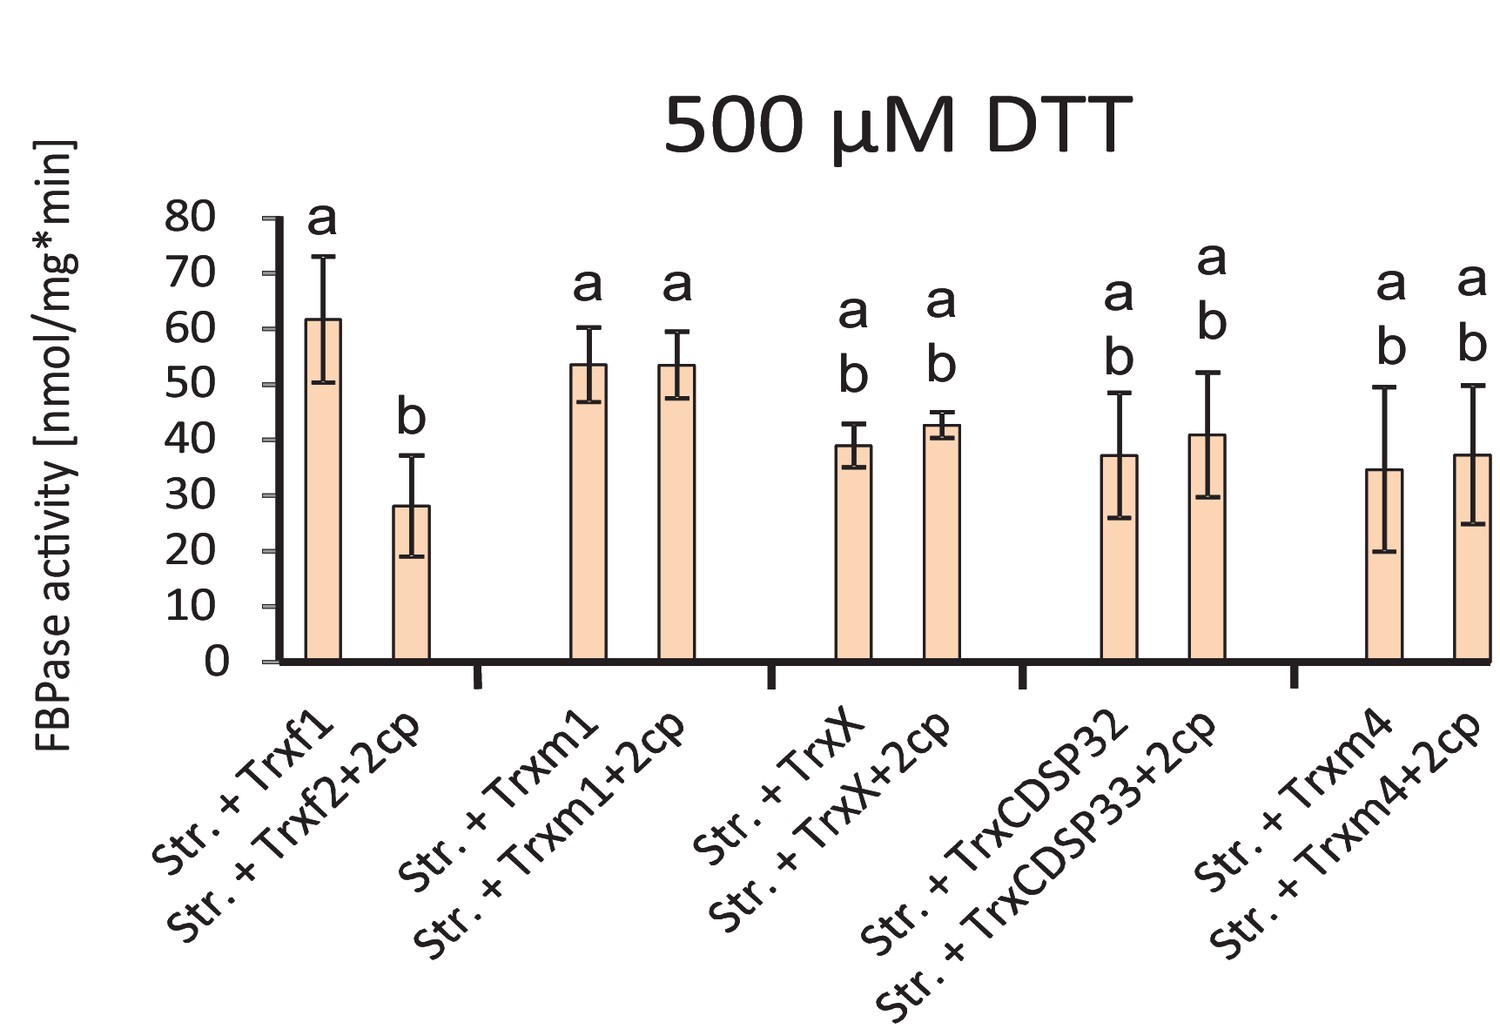
Thioredoxin-specificity of inactivation of FBPase by oxidized 2-CysPrx.
Stroma was preactivated in the presence of 1 mM DTT. After dilution into FBPase assay buffer, various recombinant thioredoxins were added at 5 µM concentration and the reactions was started by addition of FBP. After establishing a linear rate, 5 µM 2-CysPrxA was added in the oxidized state. The turnover rate was determined prior and after addition of 2-CysPrxox. Data are means ± SD of n = 3.
Figure 3 with 1 supplement
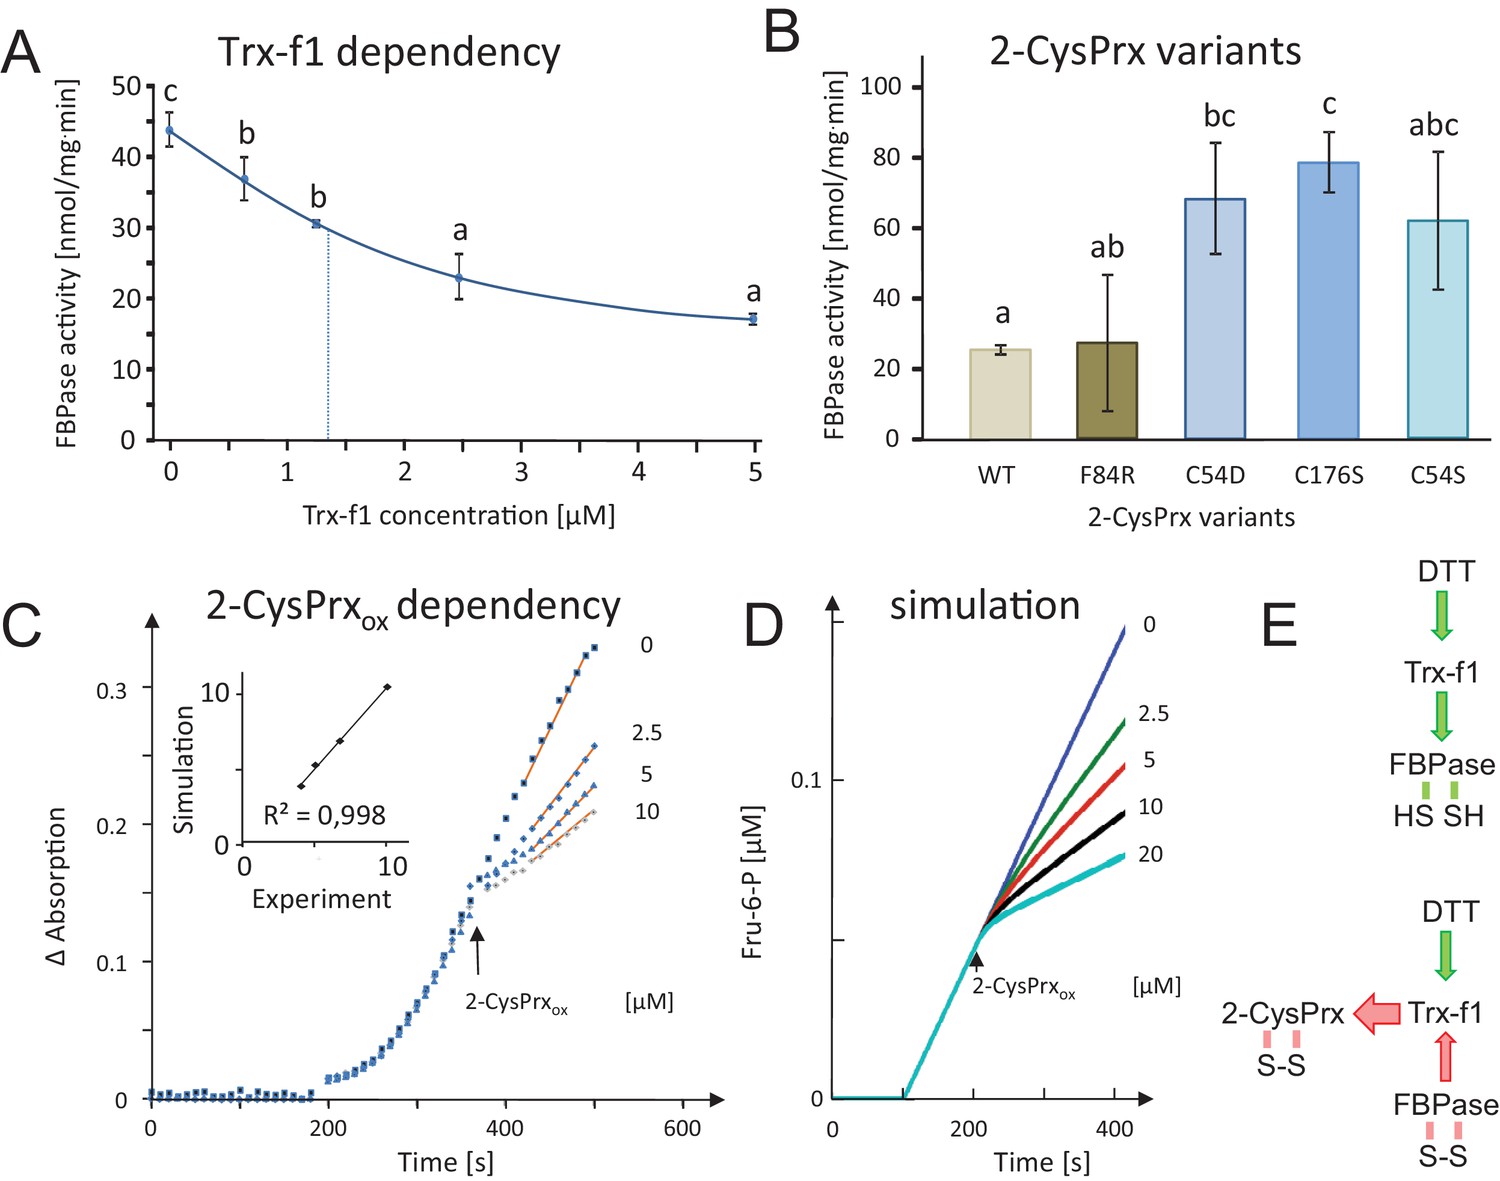
Dependency of FBPase inactivation on Trx-f1 concentration and functionality of the 2-CysPrxA, and mathematical simulation of the in vitro assay by kinetic modeling.
(A) Dependency of FBPase activity on Trx-f1 concentration. At t = 0 min, Trx-f1 was added at concentration between 0 and 5 µM. The FBPase activity test was performed as in Figure 2A. Data are means ± SD of n = 3. Statistics were calculated using one-sided ANOVA followed by Tukey’s HSD. Different letters mark significantly different groups. (B) Requirement of the functional thiol peroxidase for FBPase inhibition. The test contained 5 µM Trx-f1, final concentration of DTT was 500 µM and the 2-CysPrxox variants were added at 5 µM concentration. The WT form of 2-CysPrxox inhibited the FBPase by 75%, as did the F84R variant which is compromised in oligomerization. The variants devoid of the peroxidatic Cys in C54S and C54D, as well as the variant lacking the resolving Cys in C176S were ineffective in inhibiting the reductively activated FBPase. (C) Effect of adding different final 2-CysPrxox concentrations to the ongoing FBPase activity test. Conditions were as described in Figure 2E. The traces are means of n = 3 determinations. (D) Mathematical simulation of the concentration-dependent effect of 2-CysPrxox on FBPase activity. Addition of 0, 2.5, 5 and 10 µM, and also 20 µM 2-CysPrxox was simulated (the effect of 20 µM 2-CysPrxox could not be tested experimentally). The relative slopes after addition of 2-CysPrxox in the experimental and theoretical analyses were plotted and gave a linear dependency with a regression coefficient of 0.998 (inset in Figure 2C). (E) Schematics of the measured and simulated pathways before (upper) and after addition of 2-CysPrxox (lower scheme). Green arrows represent reductive activation, red arrows oxidative inactivation. The following figure supplements are available for Figure 3.
-
Figure 3—source data 1
FBPase activity in the presence of different Trx-f1 concentrations.
- https://doi.org/10.7554/eLife.38194.009
Figure 3—figure supplement 1
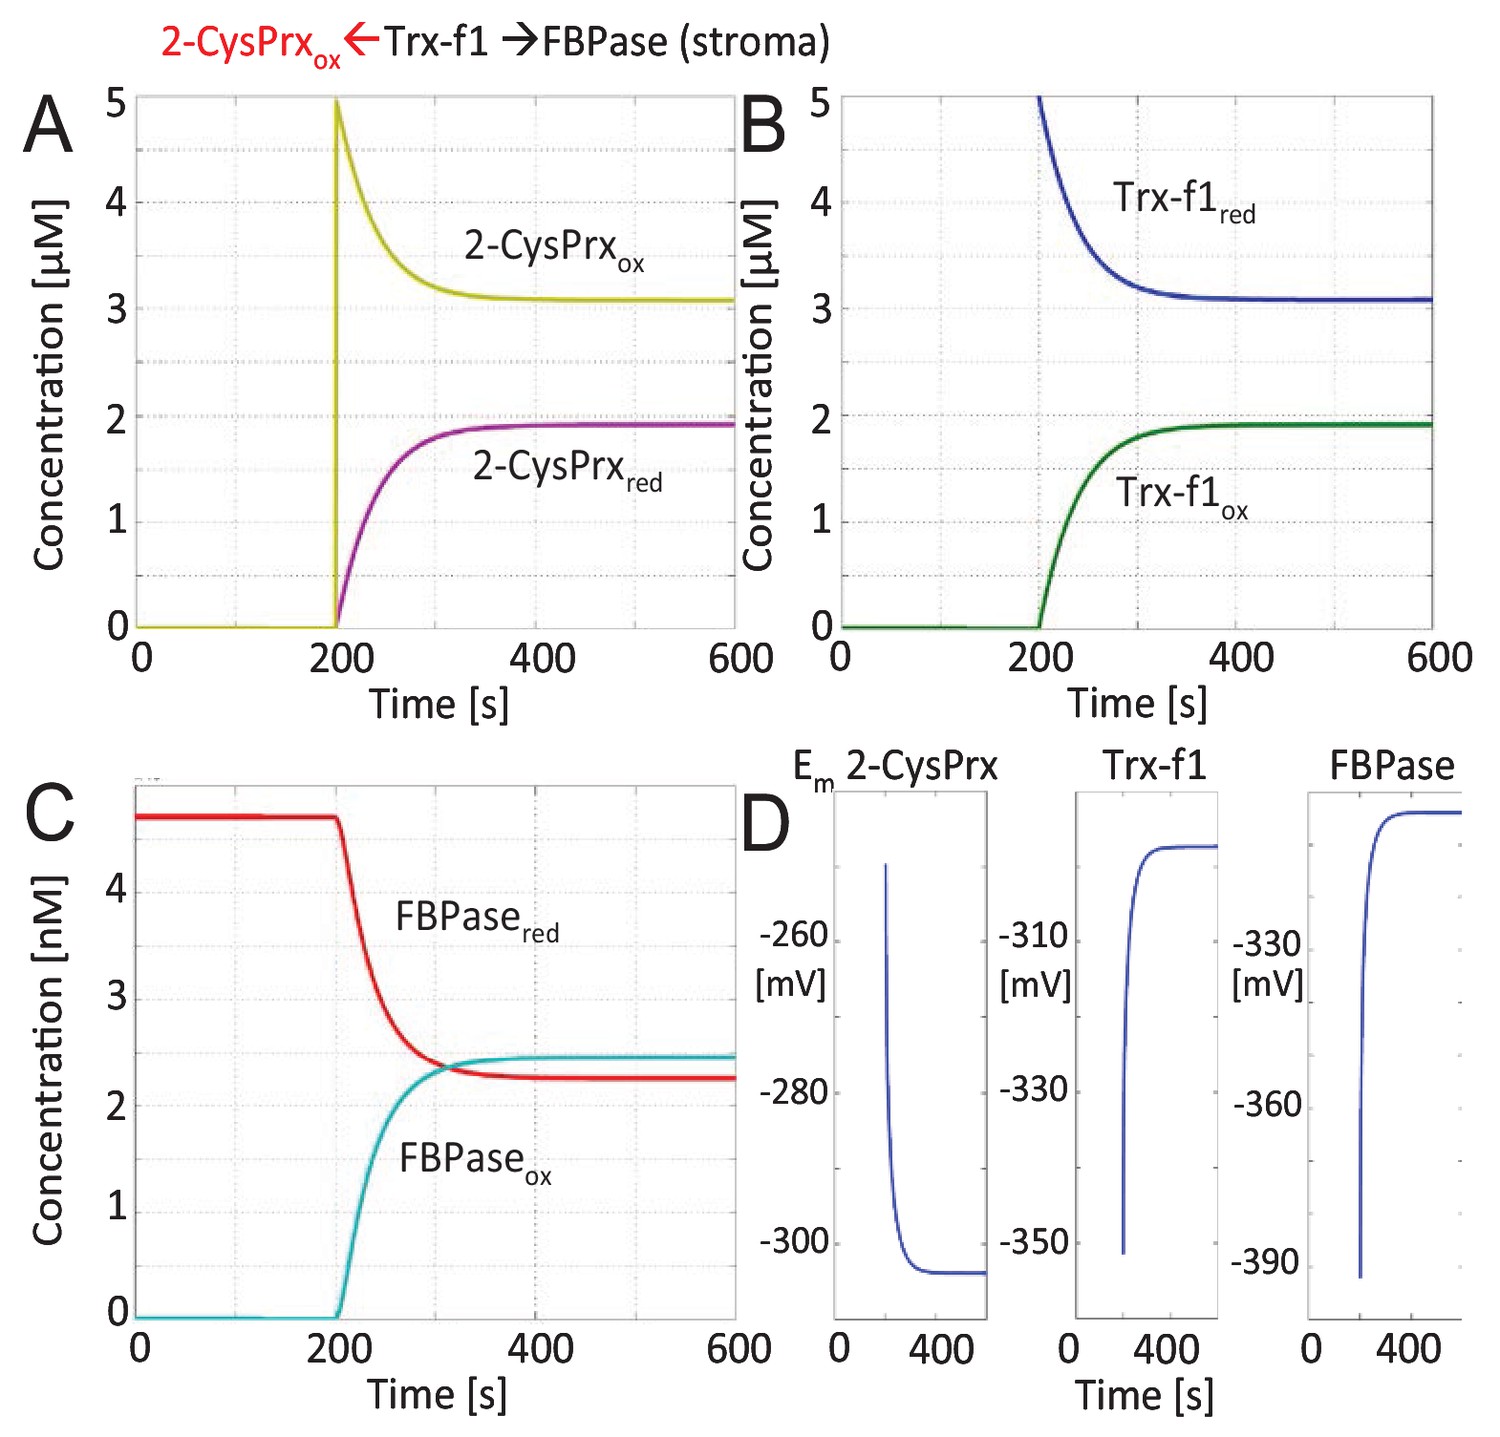
Mathematical modeling and simulation of FBPase inactivation by 2-CysPrxox in the enzyme assay.
The FBPase amount in stroma equivalent to 100 µg protein was estimated to 4.7 nM based on the mass spectrometric data of Peltier et al. (2006). Recombinant Trx-f1 was adjusted to 5 µM. 2-CysPrxox (5 µM) was added after 200 s. The figures show the changes in reduced and oxidized 2-CysPrx (A), Trx-f1 (B), FBPase (C) and the changes in redox potentials (D) over time. The redox state of FBPase was coupled to conversion of FBP to Fru-6-P which is depicted in Figure 2.
Figure 4
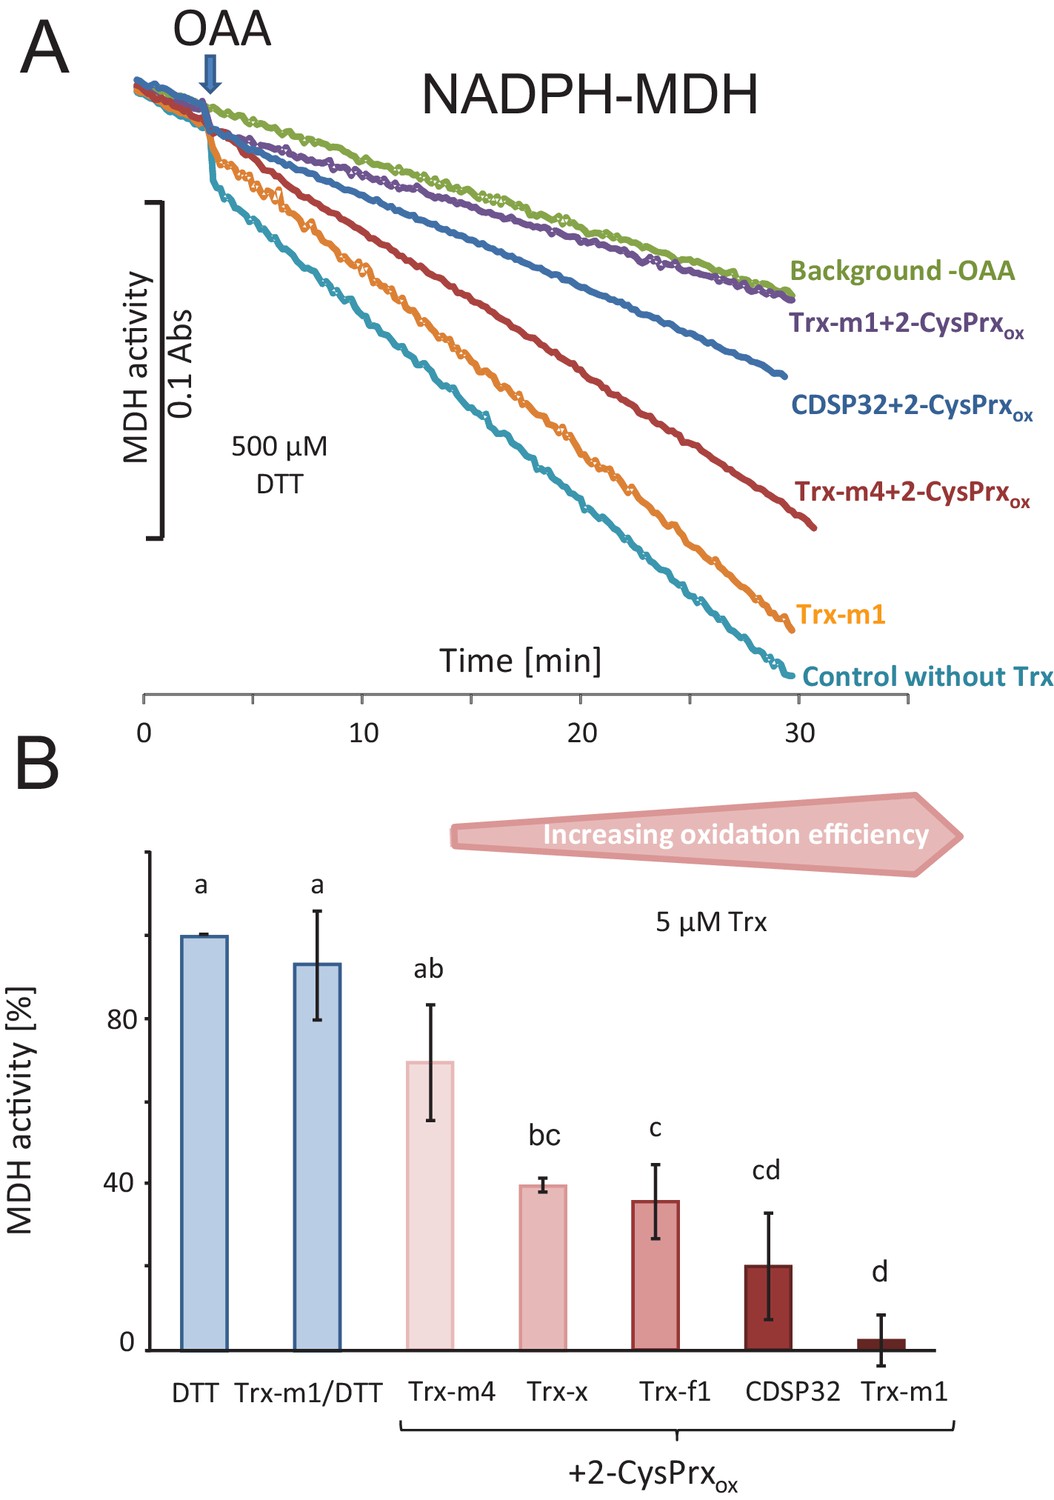
Trx-dependent inactivation of MDH by oxidized 2-CysPrx.
(A) Spectrophotometric recording of MDH activity after addition of 2 mM oxaloacetic acid (OAA). The background was determined without addition of OAA. Addition of 10 µM Trx-m1 did not alter the turnover rate. Supplementation with combinations of different Trxs and 2-CysPrxox inhibited the MDH to a varying degree. (B) Average inhibition of MDH activity in experiments as shown in (A). Data are means ± SD of n = 3–4. Statistics were calculated using one-sided ANOVA followed by Tukey’s HSD. Different letters mark significantly different groups.
-
Figure 4—source data 1
Values of the MDH activity test shown in Figure 4B.
- https://doi.org/10.7554/eLife.38194.011
Figure 5 with 3 supplements
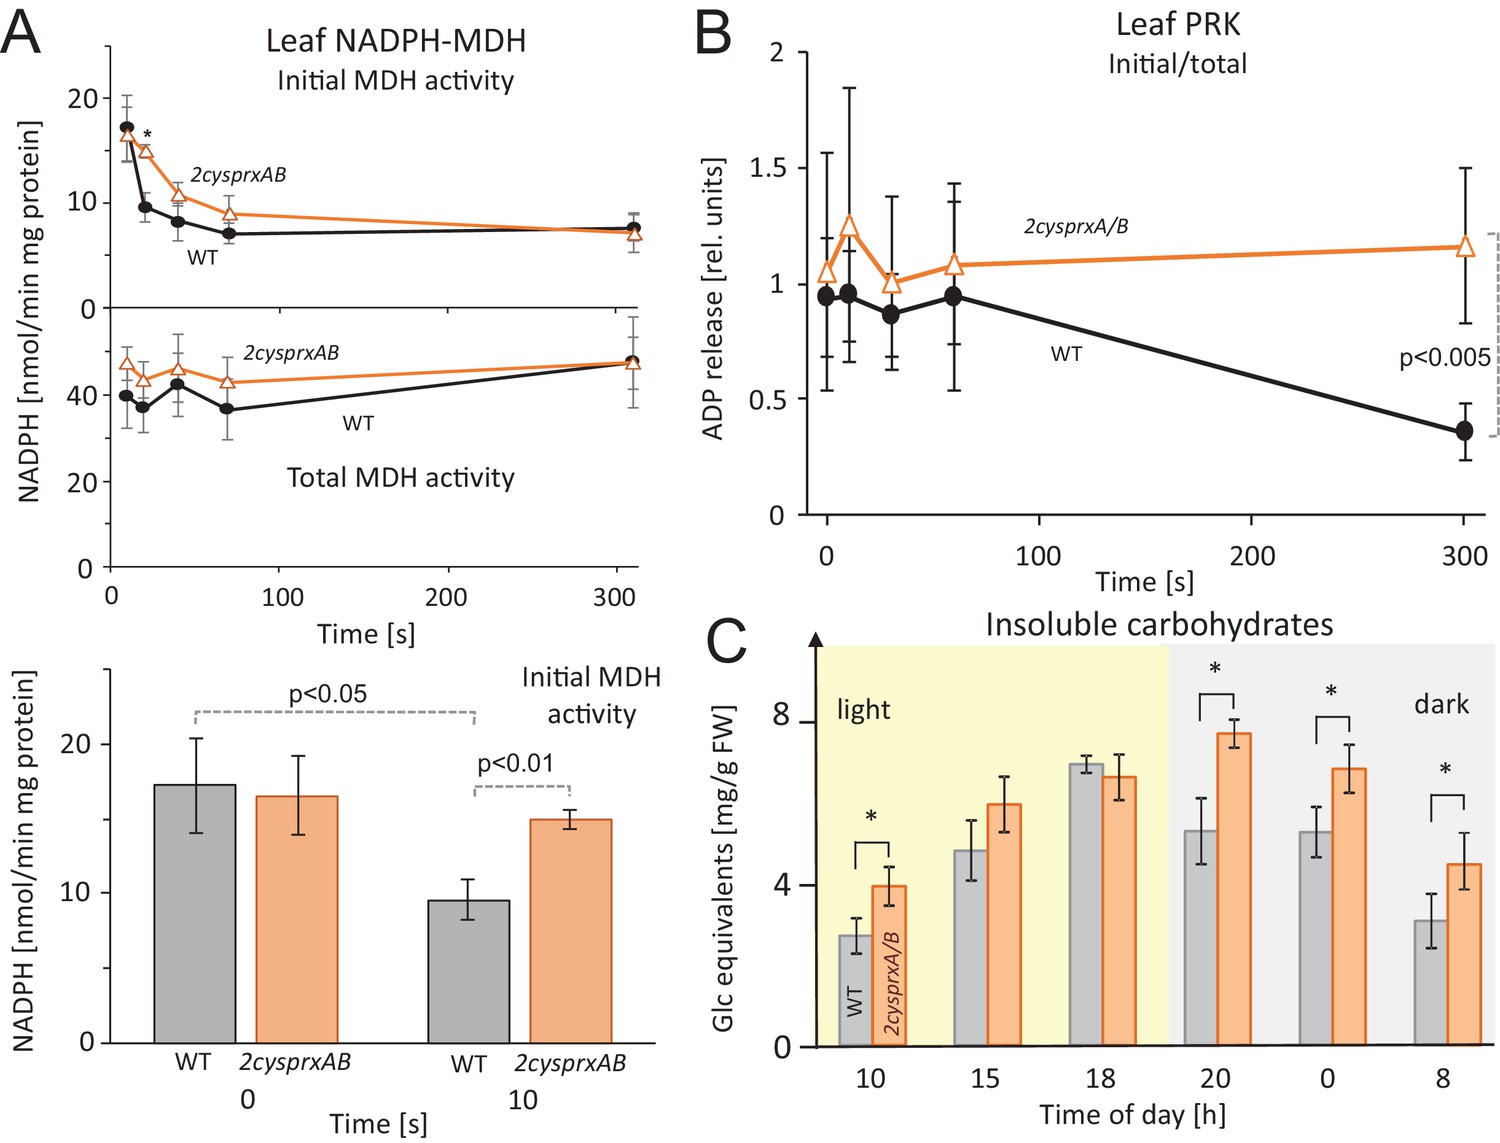
Inhibition of NADPH-MDH and ribulose-5-phosphate kinase in leaves upon light-dark transitions, and non-soluble sugar contents in WT and 2cysprxAB during a 24 hr day-night cycle.
(A) MDH activity during a light-dark transition: WT and 2cysprxAB plants were exposed to 650 µmol quanta m−2 s−1 for 30 min and then darkened at t = 0 s. Proteins were rapidly extracted prior to darkening and after different time points in the dark as indicated. Initial (upper figure) and total MDH activity (lower figure) after full activation with 20 mM DTT were determined. Inactivation of MDH was slightly delayed in 2cysprxAB than in WT. This is shown for the time point 10 s. Data are means ± SD from n ≥ 5 determinations. (B) Ribulose-5-phosphate kinase (PRK) activity during a light-dark transition plotted as ratio of initial to total activity. WT and 2cysprxAB plants were illuminated with 650 µmol quanta m−2s−1 for 30 min and darkened as above. Initial and total PRK activities were determined and are represented as ratio. Initial inactivation was insignificantly delayed in 2cysprxAB, but while PRK in WT continued to be inactivated until 5 min, the PRK activity essentially remained unaltered and became significantly different at t = 300 s (n = 6). Complemented lines behaved like WT (supplements). (C) Changes in insoluble carbohydrates during a 24 hr day-night cycle. Leaves of WT and 2cysprxAB plants were harvested at 10 o’clock (1 hr after start of light phase), 15, 18, 20 (1 hr after end of light phase), 0 and 8 (1 hr before end of dark phase). Insoluble acid hydrolysable carbohydrates were quantified in the washed sediment of leaf homogenates using the Anthrone reagent following 1 hr boiling in sulfuric acid. Data are means ± SD of n = 3 extracts of different plants with three technical replicates each in Anthrone quantification. Statistics was calculated using one-sided ANOVA followed by Tukey’s HSD, while * = p ≤ 0.05.
-
Figure 5—source data 1
Altered MDH and PRK activities in 2cysprxAB mutants after light-dark transitions.
- https://doi.org/10.7554/eLife.38194.016
Figure 5—figure supplement 1
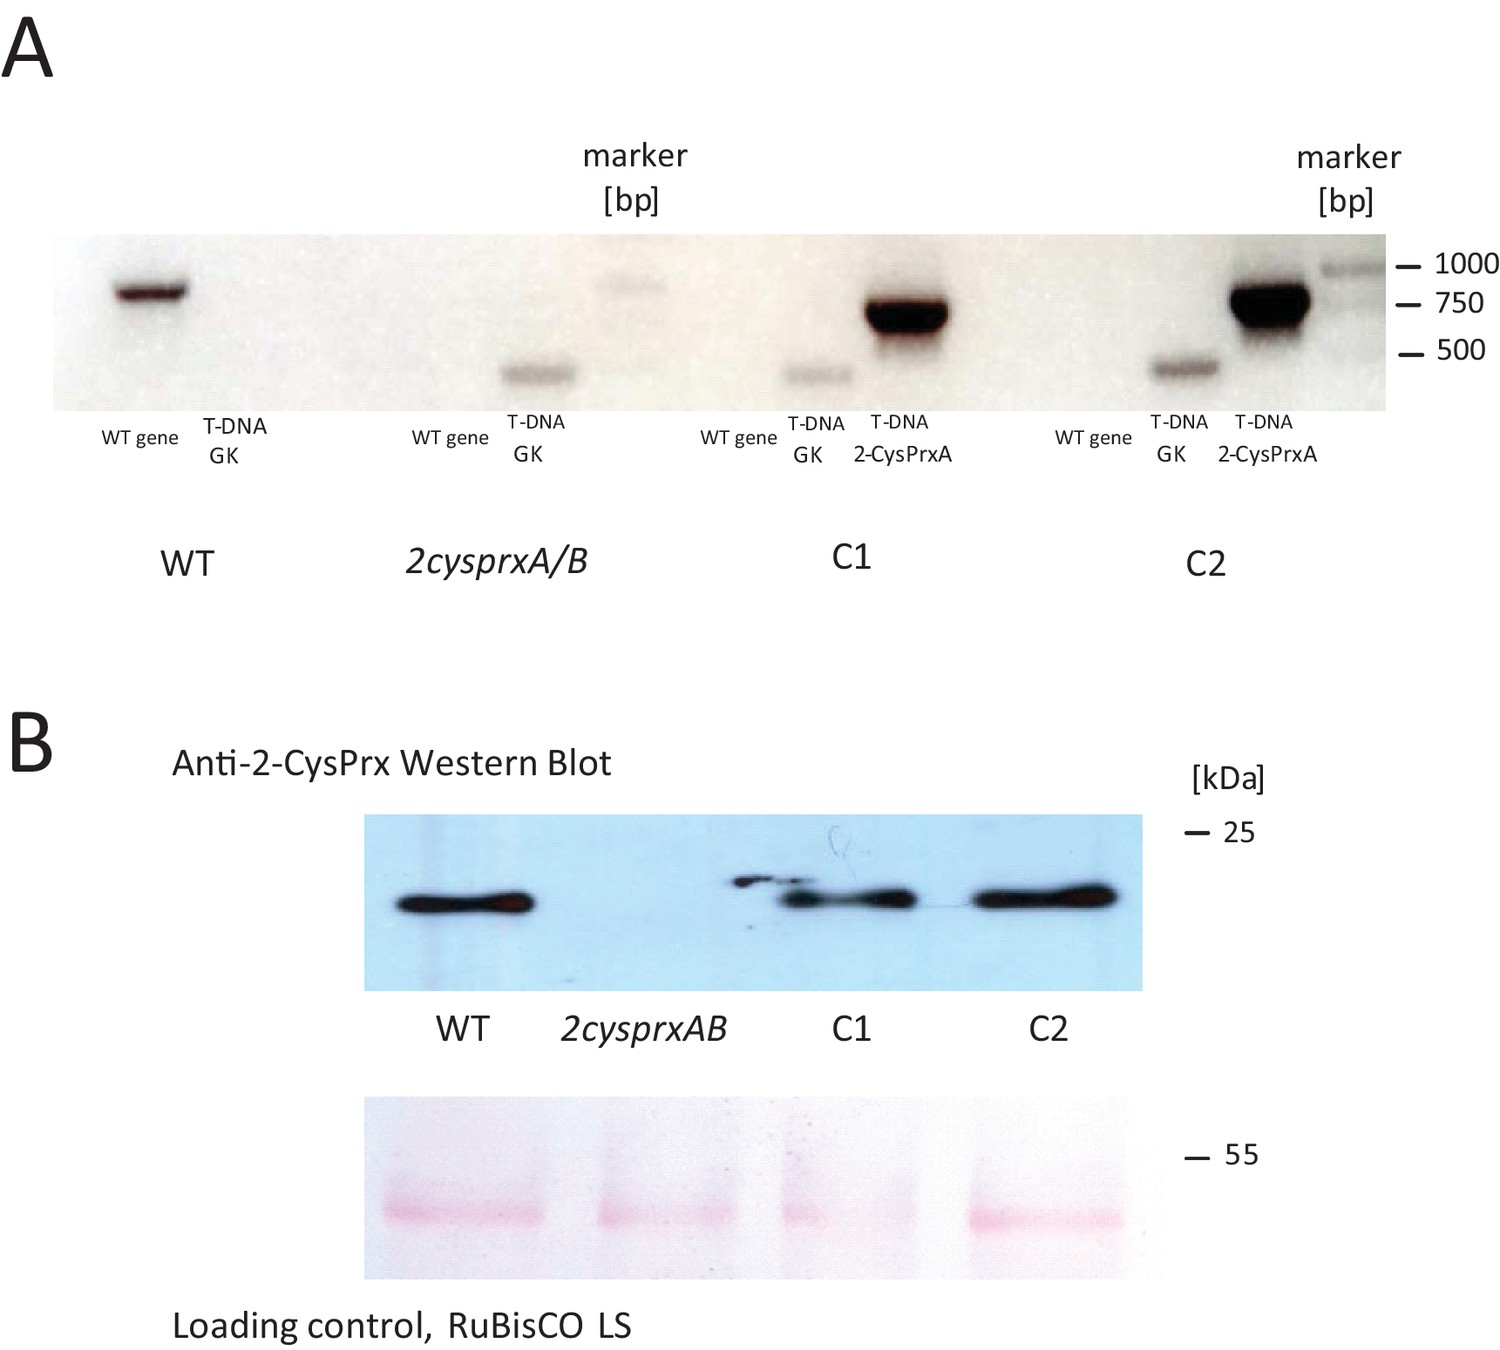
Genotyping and protein detection in 2cysprxAB and two independent 2-CysPrxA-complemented lines (C1 and C2).
(A) PCR-based genotyping: Used primers are found in Supplementary file 1. The target sequence confirming T-DNA insertion in 2cysprxA had a length of 479 bp (At2-CysPrxgenR + GK RBfor), the PCR product from the WT gene: 1160 bp (At2-CysPrxgenF + At2 CysPrxgenR), and the complementation with p2cysprxA:2CysPrxA (cds) gave 801 bp (At2CPCDS-NcoIrev + At2 CPCDS-XhoIfor). (B) 2-CysPrx detection by Western Blot for plant extracts. Loading control for large RuBisCO LS subunit and Ponceau red stain.
Figure 5—figure supplement 2
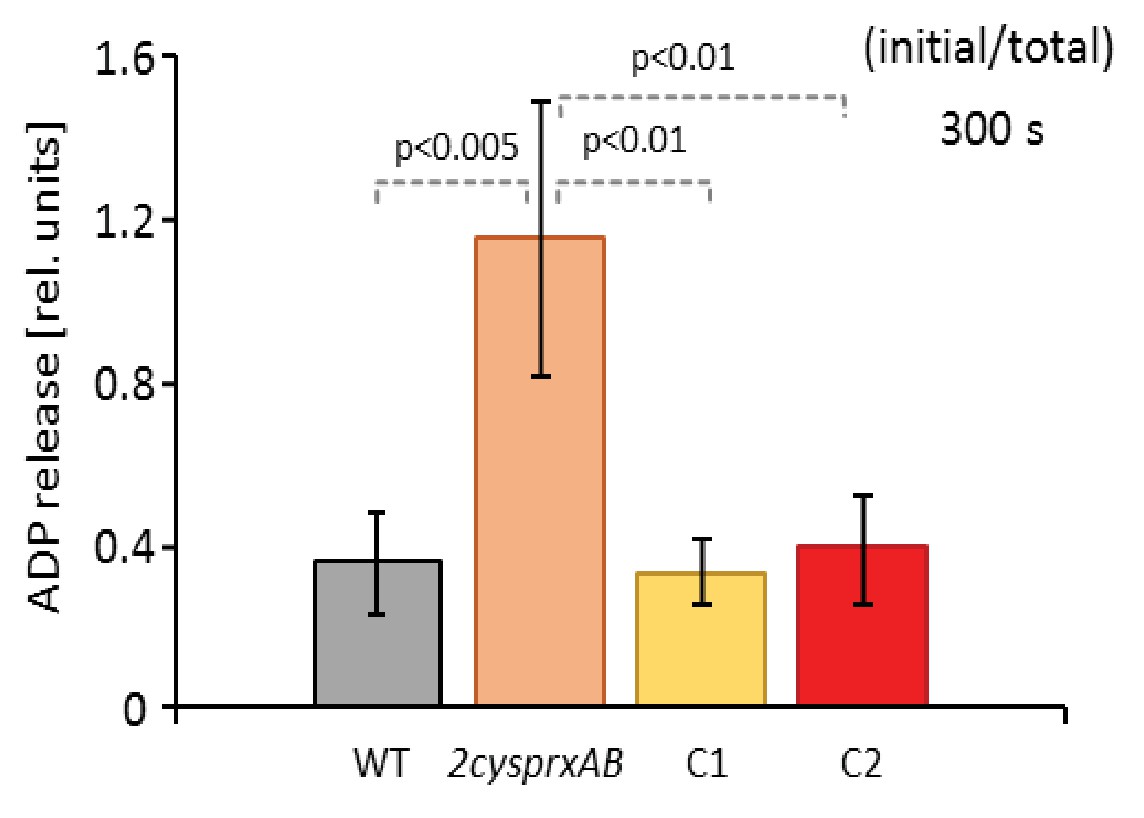
PRK activity in the complemented lines C1 and C2 in comparison to WT and 2cysprxAB.
PRK activity was determined 300 s after transfer of light-exposed plants to darkness. PRK was efficiently inhibited in WT and both complemented lines C1 and C2 after darkening, but was still highly active in the 2cysprxAB-line. Data are means ± SD of n = 6 for WT and 2cysprxAB and n = 3 for C1 and C2. Statistics was calculated using one-sided ANOVA followed by Tukey’s HSD.
Figure 5—figure supplement 3
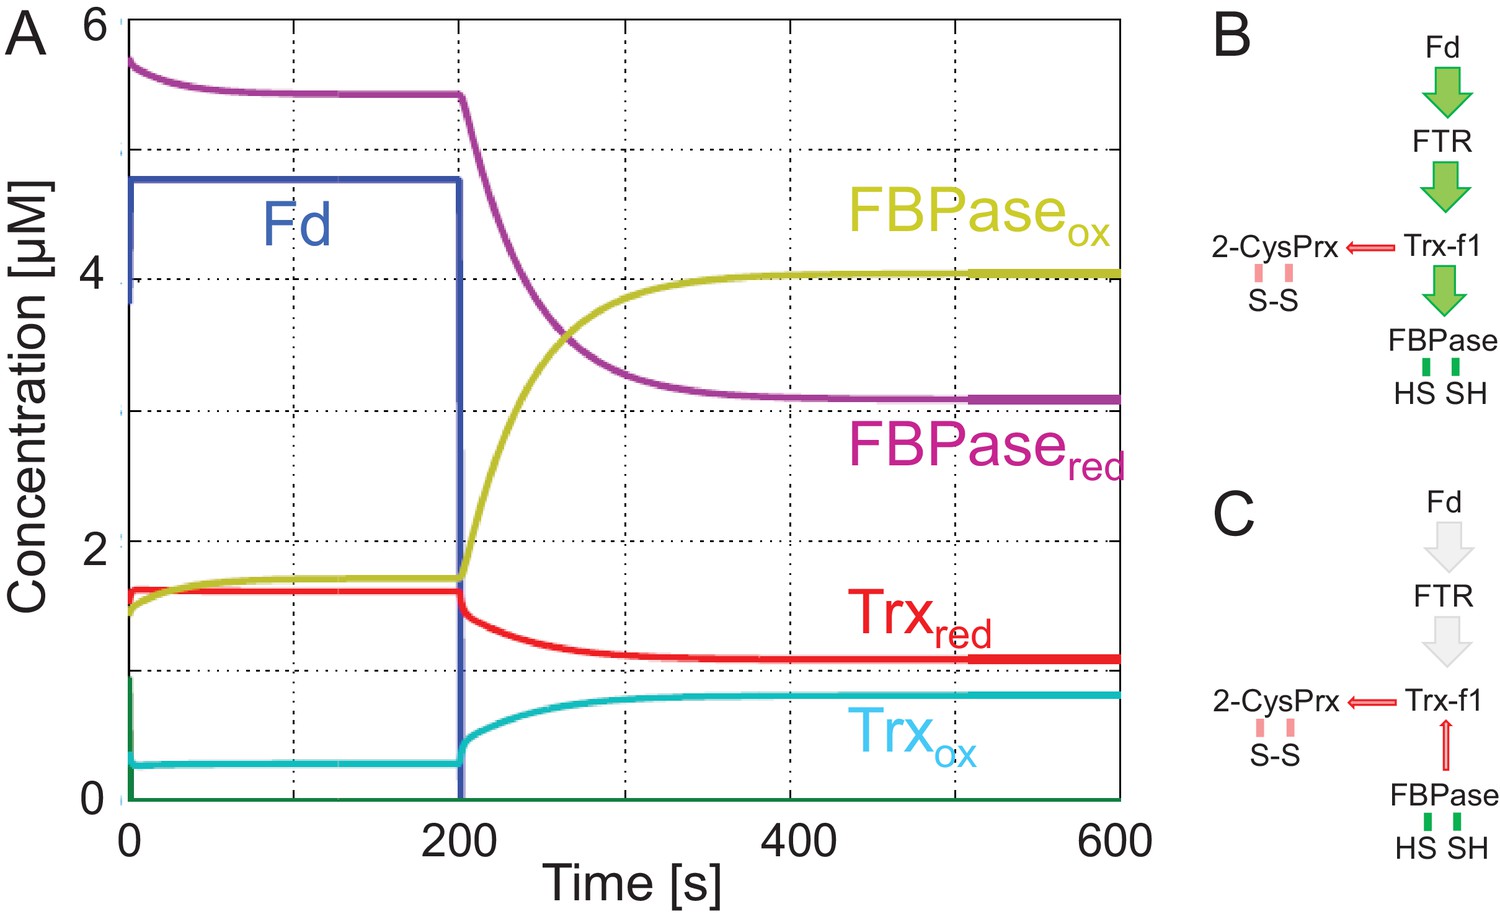
Simulation of redox change of FBPase upon darkening.
(A) The model assumes reduction of ferredoxin (Fd) by the photosynthetic electron transport chain in the light during the first 200 s. This process also reduces Fd-dependent thioredoxin reductase. Then Fd and FTR are set to full oxidation. Following this simulation of light switch off, the oxidized fractions of Trx and FBPase increase at the expense of reduced fraction. (B) Pathway of regulatory electron flow at the start of the experiment. (C) Pathway of electrons simulating darkness after 200 s. The parameters and equations employed in this model are found in Appendix 2.
Figure 6 with 3 supplements
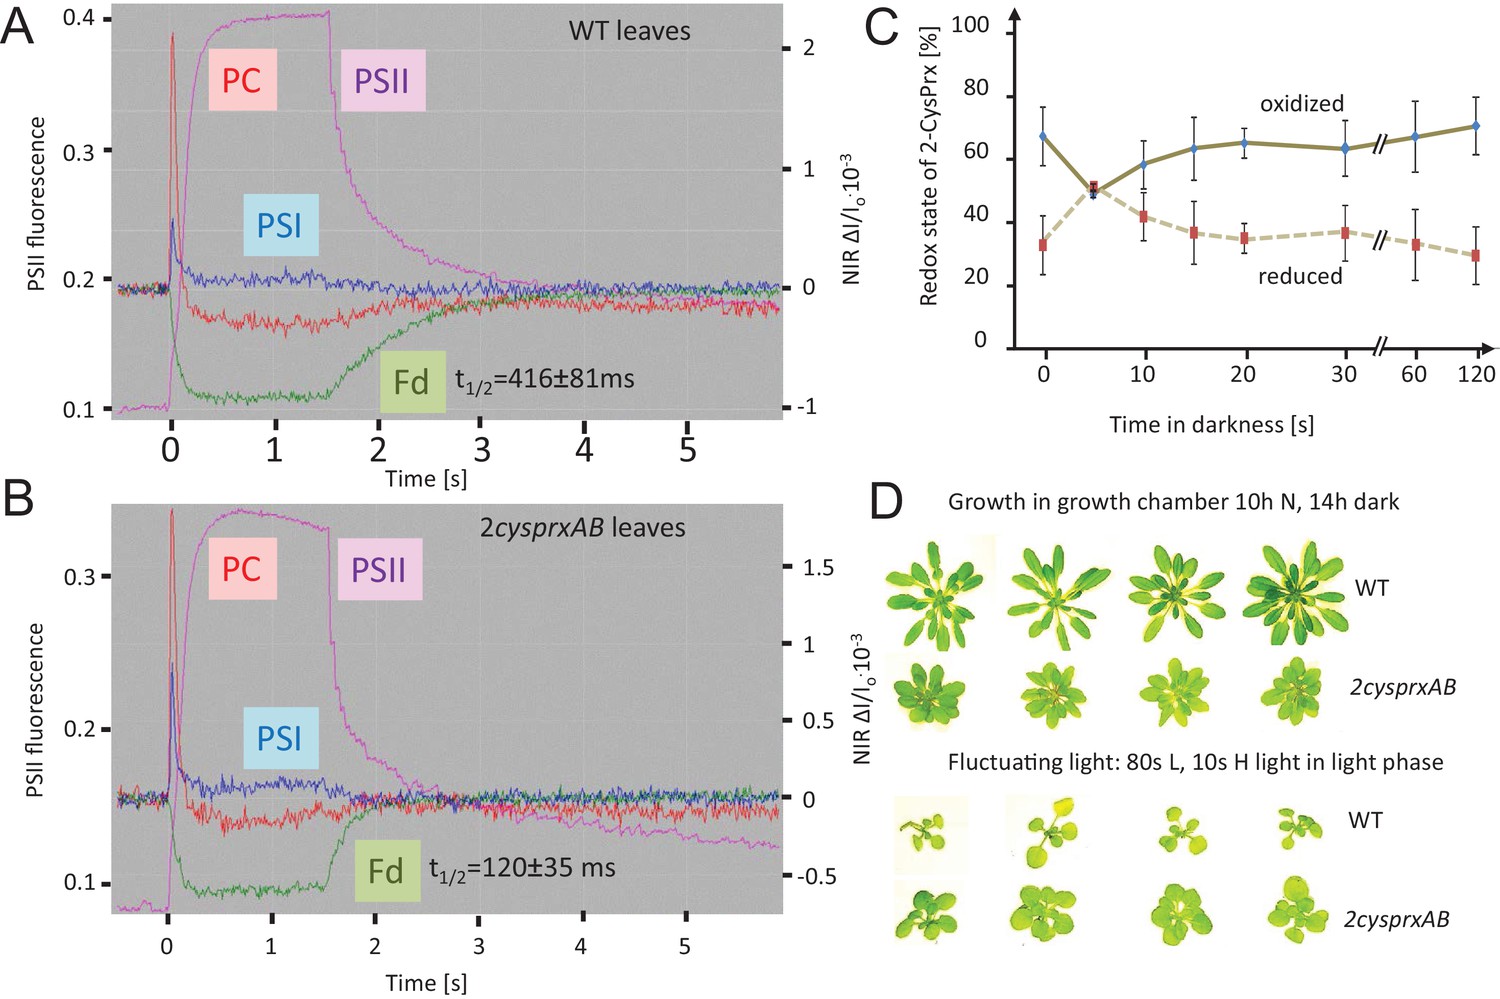
Reversal of light-induced changes of photosynthetic parameters.
(A) WT and (B) 2cysprxAB plants were acclimated to darkness. Fluorescence and NIR absorption changes were recorded with the NIR-KLAS-100. Chlorophyll-a fluorescence from photosystem II (PSII, violet trace) (left ordinate) and redox changes from photosystem I (PSI, blue), plastocyanin (PC, red) and ferredoxin (Fd, green) (right ordinate) were measured during a fast kinetics analysis consisting of 1.5 s illumination with 162 µmol quanta m−2 s−1 followed by darkening. The analysis of the fluorescence and absorption decay showed slower half-life times for WT than for 2cysprxAB plants. The figure shows recordings typical for all analysis with n = 5 measurements. Complemented lines behaved like WT (supplement). (C) Redox state of the 2-CysPrx ex vivo during a light dark transition. WT plants were acclimated to 650 µmol quanta m−2 s−1 for 30 min (t = 0 s) and then darkened. Samples were harvested (t = 5 s-120 s) and blocked with 100 mM N-ethylmaleimide, separated by SDS-PAGE, immunodecorated with anti-2-CysPrx antibody and visualized by luminescence detection. The band intensities on shortly exposed films were quantified by ImageJ. Data are means ± SD of n = 4 experiments. (D) WT and 2cysprxAB plants were grown in normal (N) light for 42 d (upper row) or for 14 d in growth light followed by 21 d in fluctuating light with 80 s L (20 µmol quanta m−2 s−1)/10 s H (800 µmol quanta m−2 s−1) during the 10 hr light phase (lower row). Growth of 2cysprxAB was inhibited relative to WT in normal light, but the relative growth performance was reversed in fluctuating light. Four plants are shown for each growth condition and genotype.
Figure 6—figure supplement 1
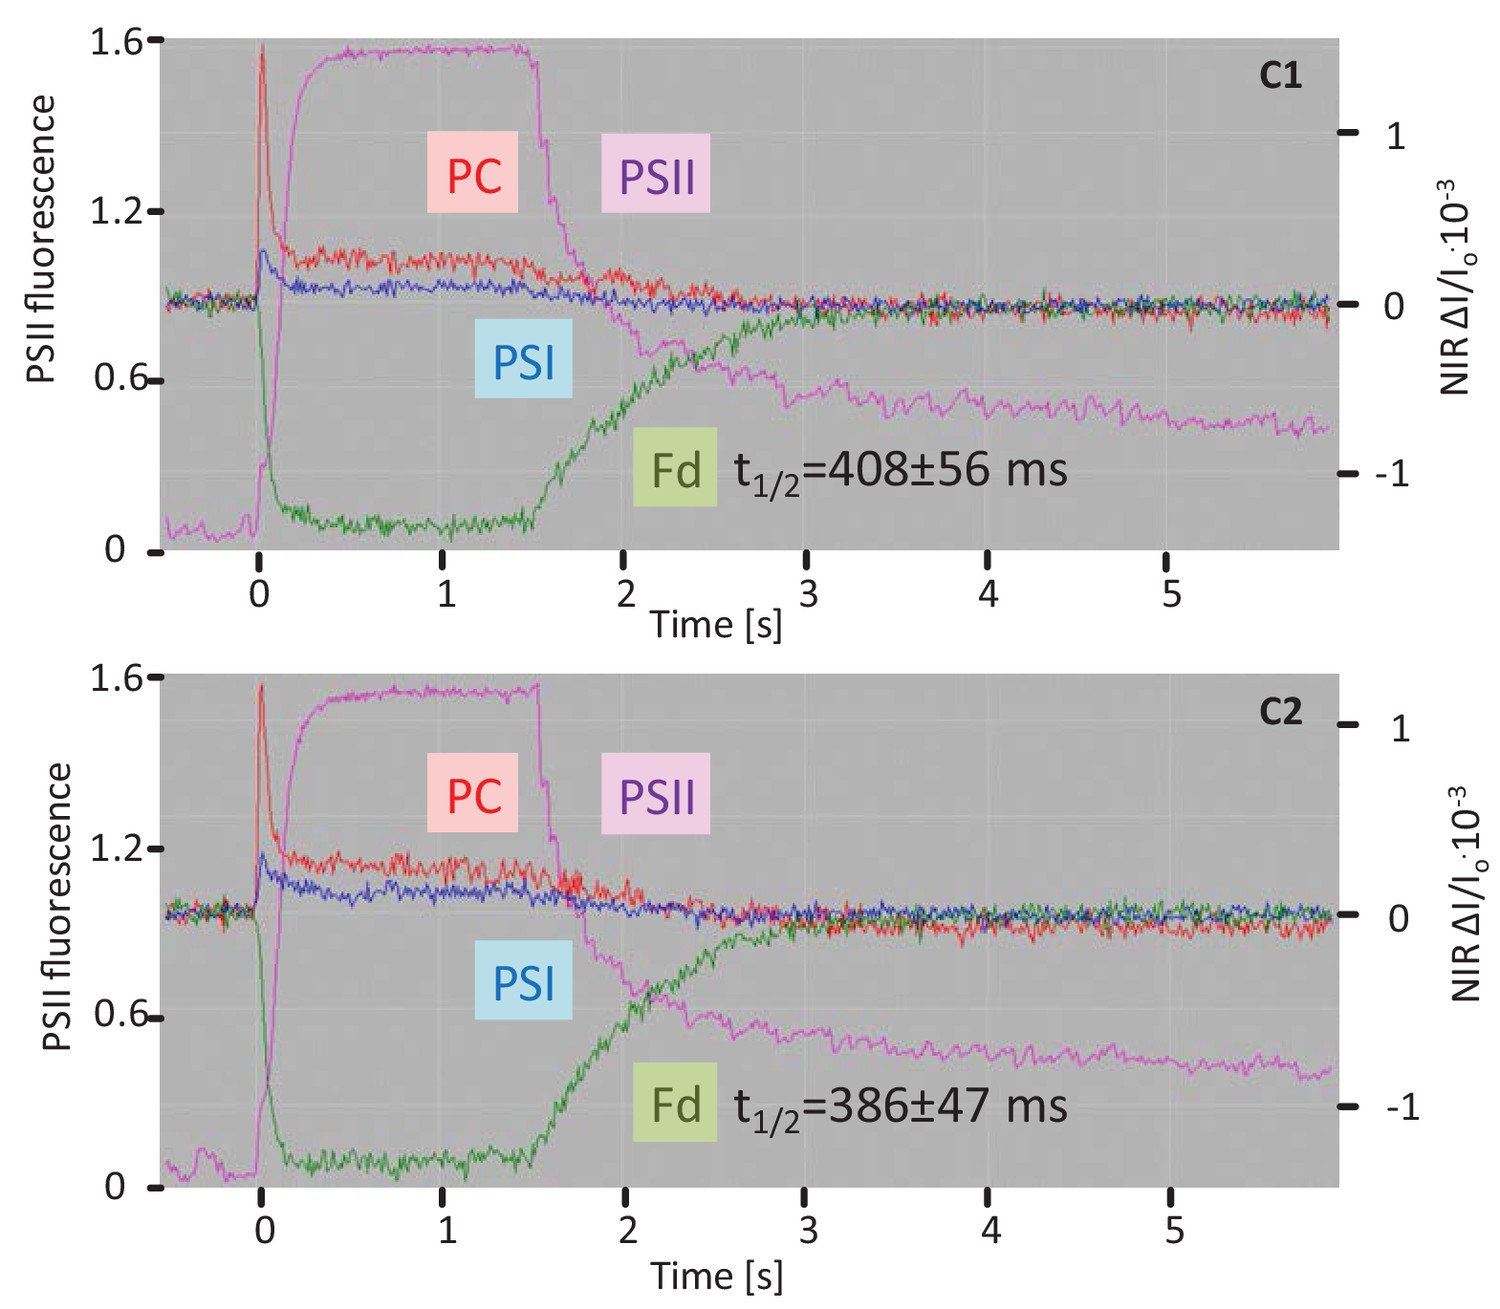
Fluorescence and NIR absorption changes of the complemented lines C1 and C2 measured with the NIR-KLAS-100.
For comparison with WT and 2cysprxAB see Figure 6. Chlorophyll-a fluorescence from photosystem II (PSII, violet trace) (left ordinate) and redox changes from photosystem I (PSI, blue), plastocyanin (PC, red) and ferredoxin (Fd, green) (y-axis) were measured during a fast kinetics analysis consisting of 1.5 s illumination with 162 µmol quanta m−2 s−1 followed by darkening. Ferredoxin reoxidation in the complemented 2cysprxAB lines showed a kinetics similar to WT (416 ± 81 ms). The figure shows recordings typical for all analysis with n = 6 measurements.
Figure 6—figure supplement 2
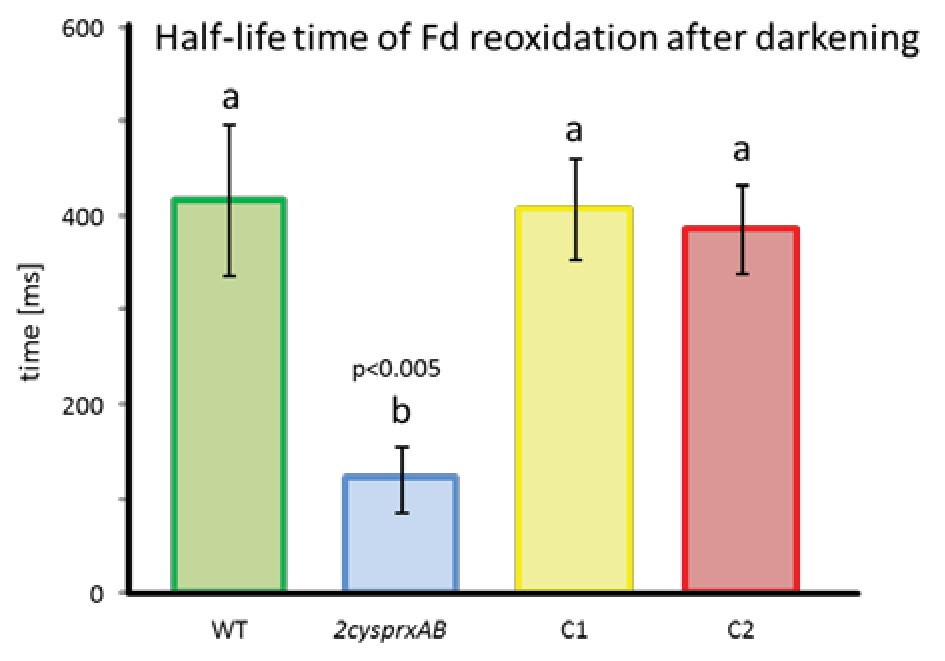
Half-life time of Fd reoxidation in WT and 2-cysprxAB as well as 2cysprxAB complemented with 2-CysPrxA (C1 and C2).
Readings were documented from leaves of n = 5 different dark-adapted plants. Ferredoxin reoxidation was measured with the Walz NIR-KLAS-100 after 1.5 s of illumination. Means ± SD were evaluated with one-sided ANOVA followed by Tukey’s HSD. Different letters mark groups of significant difference with p < 0.005.
Figure 6—figure supplement 3

Exemplary immunoblot with leaf extracts using anti 2-CysPrx antiserum.
Leaves were illuminated at 650 µmol quanta m−2 s−1 for 30 min followed by darkening as indicated. Reduced thiols were blocked by adding 100 mM N-ethylmaleimide in extraction buffer. Plant extract (2 µg protein) was separated by non-reducing 12% SDS-PAGE. The separation into dimer (oxidized)/monomer (reduced) form was quantified by ImageJ following luminescence detection.
Figure 7
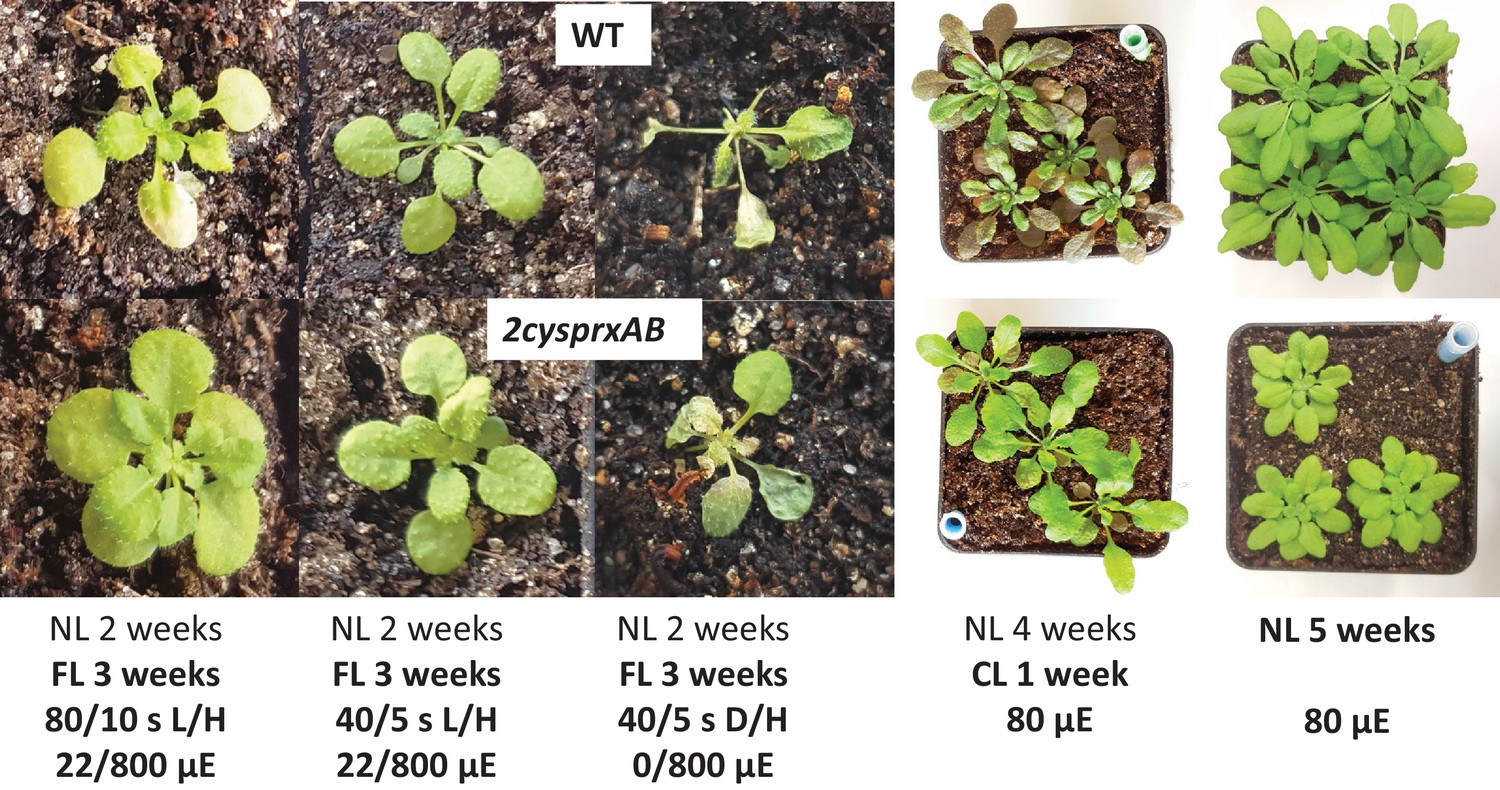
Growth phenotype of WT and 2cysprxAB in different light regimes.
WT (upper image) and 2cysprxAB (lower image) were grown in five different light regimes as indicated, namely from left to right: (i) fluctuating light (FL) for 3 weeks consisting of 80 s/10 s L/H with 22/800 µmol quanta m−2 s−1 (as in Figure 6D). The daily light cycle was maintained at 14 hr dark phase/10 hr light phase. (ii) 3-week FL with 40 s/5 s L/H with 22/800 µmol quanta m−2 s−1. (iii) 3-week FL with 40 s/5 s darkness/H with 0/800 µmol quanta m−2 s−1. (iv) Growth in continuous light without dark phase for 1 week after 4 weeks of growth in the growth chamber. (v) 5-week-old plants grown in the growth chamber with 10 hr light/14 hr dark phase at 80 µmol quanta m−2 s−1. These growth experiments were independently performed three times with same result. Growth data are given in Table 1 and Figure 7—source data 1.
-
Figure 7—source data 1
Fresh weight for two fluctuating light schemes (40 s L/5 s H; 80 s L/10 s H) including complementation lines.
- https://doi.org/10.7554/eLife.38194.022
Tables
Table 1
Effect of fluctuating light on rosette fresh weight of 2cysprxAB and WT.
Plants were grown in fluctuating light for 3 weeks. The program established the following cycles: 40 s L/5 s H, 80 s L/10 s H, 120 s L/15 s H; H corresponds to 800 µmol quanta m−2 s- 1, L to 22 µmol quanta m−2 s-1 and normal growth light (80–100 µmol quanta m−2 s-1). Plants were harvested and analyzed for biomass accumulation depending on different light/dark schemes.
| Light cycle | WT [mg] | 2cysprxAB [mg] | Ratio WT/2cysprxAB |
|---|---|---|---|
| constant | 372 ± 74 | 117 ± 20 | 3.19 |
| 40 s/5 s | 26 ± 5 | 22 ± 4 | 1.21 |
| 80 s/10 s | 21 ± 6 | 24 ± 5 | 0.87 |
| 120 s/15 s | 14 ± 3 | 11 ± 2 | 1.34 |
Appendix 1—table 1
Values of variables used for modeling the enzyme assay.
https://doi.org/10.7554/eLife.38194.027| Component | Start value [µM] | Addition t = 100 [µM] | Addition t = 200 [µM] |
|---|---|---|---|
| FBPaseox FBPasered | 0 4.70756e-3 | 0 0 | 0 0 |
| Trxf1ox | 0 | 0 | 0 |
| Trxf1red | 5 | 0 | 5 |
| 2-CysPrxox 2-CysPrxred | 0 0 | 0 0 | 2.5–20 0 |
| FBP | 0 | 600 | 0 |
| Fru-6-P | 0 | 0 | 0 |
Appendix 1—table 2
Parameters used for modeling the enzyme assay as a reference.
https://doi.org/10.7554/eLife.38194.028| Parameter | Value | Reference/comment |
|---|---|---|
| k1 | 2.9616e-2 µM−1s−1 | Calculated from Collin et al. (2003) |
| k2 | 1.84e-3 µM−1 s−1 | Collin et al. (2003) |
| KM(FBP) | 0.028 µM | Pilkis et al., 1987 |
| kcat_3 | 0.1 s−1 | Villadsen and Nielsen, 2001 |
| Keq_1 | 0.5697 | calculated |
| Keq_2 | 0.3856 | calculated |
| FBPasetotal | 4.70756 µM | calculated |
| 2-CysPrxtotal | 0–20 µM | Enzyme test concentration |
| Trxf1total | 5 µM | Enzyme test concentration |
Appendix 1—table 3
Reaction equations describing the model of the enzyme test.
https://doi.org/10.7554/eLife.38194.029| Reaction number | Reaction |
|---|---|
| 1 | |
| 2 | |
| 3 |
Appendix 1—table 4
Rate expression for the three reactions of the enzyme test model.
https://doi.org/10.7554/eLife.38194.030| Reaction number | Reaction |
|---|---|
| 1 | |
| 2 | |
| 3 |
Appendix 2—table 1
Values of variables used for modeling the light-dark-transitions.
https://doi.org/10.7554/eLife.38194.032| component | start value [µM] | Reference/comment |
|---|---|---|
| FTRox | 0 | Assumption in light 100% reduced |
| FTRred | 4.7727 | calculated from Yoshida and Hisabori (2017) |
| Trxf1ox | 3.798e-1 | 20% oxidized |
| Trxf1red | 1.5192 | 80% reduced |
| FBPaseox FBPasered | 1.426528 5.706112 | 20% oxidized 80% reduced |
Appendix 2—table 2
Parameters used for modeling the light-dark-transitions.
https://doi.org/10.7554/eLife.38194.033| parameter | value | Reference/comment |
|---|---|---|
| k1 | 7.7047e−2 µM−1µM−1s−1 | Fitted |
| k2 | 6.819e−2 µM−1s−1 | Fitted |
| k3 | 2.9616e−2 µM−1s−1 | Calculated from Collin et al. (2003) |
| k4 | 1.84e−3 µM−1s−1 | Collin et al. (2003) |
| Keq_Trxf1FBPase | 0.5697 | Calculated |
| Keq_Trxf12CP | 0.3856 | Calculated |
| Fdtotal | 69 µM | calculated from Peltier et al. (2006) |
| Fdred_fix | 34.5 µM | Estimated (50% reduced) |
| FTRtotal | 4.7727 µM | calculated from Yoshida and Hisabori (2017) |
| Trxf1total | 1.899 µM | calculated from Peltier et al. (2006) |
| FBPasetotal | 7.13267 µM | calculated from Peltier et al. (2006) |
| 2-CysPrxtotal | 63.3 µM | Calculated from Peltier et al. (2006) |
| 2-CysPrxred_fix | 21.522 µM | Calculated |
| 2-CysPrxox_fix | 41.778 | Calculated |
Appendix 2—table 3
Reaction equation describing the model of the light-dark-transitions.
https://doi.org/10.7554/eLife.38194.034| reaction number | reaction |
|---|---|
| 1 | |
| 2 | |
| 3 | |
| 4 |
Appendix 2—table 4
Rate expressions for the four reactions considered for the model of light-dark-transition .
https://doi.org/10.7554/eLife.38194.035| reaction number | Reaction |
|---|---|
| 1 | |
| 2 | |
| 3 | |
| 4 |
Additional files
-
Supplementary file 1
Primers used for cloning.
for: forward primer, rev: reverse primer.
- https://doi.org/10.7554/eLife.38194.024
-
Transparent reporting form
- https://doi.org/10.7554/eLife.38194.025
Download links
A two-part list of links to download the article, or parts of the article, in various formats.
Downloads (link to download the article as PDF)
Open citations (links to open the citations from this article in various online reference manager services)
Cite this article (links to download the citations from this article in formats compatible with various reference manager tools)
The chloroplast 2-cysteine peroxiredoxin functions as thioredoxin oxidase in redox regulation of chloroplast metabolism
eLife 7:e38194.
https://doi.org/10.7554/eLife.38194


