Compensatory evolution drives multidrug-resistant tuberculosis in Central Asia
- Research Center Borstel, Germany
- German Center for Infection Research, Germany
- Evolution Moléculaire, Ecole Pratique des Hautes Etudes, PSL University, France
- Institut de Systématique, Evolution, Biodiversité, UMR-CNRS 7205, Muséum National d’Histoire Naturelle, Université Pierre et Marie Curie, Ecole Pratique des Hautes Etudes, Sorbonne Universités, France
- University of Cape Town, South Africa
- CIRI INSERM U1111, University of Lyon, France
- Schleswig-Holstein University Hospital, Germany
- Swiss Tropical and Public Health Institute, Switzerland
- University of Basel, Switzerland
- Imperial College London, United Kingdom
- Public Health England, United Kingdom
- National Tuberculosis Reference Laboratory, Research Center Borstel, Germany
- Leibniz-Institut DSMZ- Deutsche Sammlung von Mikroorganismen und Zellkulturen, Germany
- Université de Lille, CNRS UMR 8204, Inserm U1019, CHU de Lille, Institut Pasteur de Lille, Centre d'Infection et d'Immunité de Lille, France
- Centre National de la Recherche Scientifique, Unité Mixte de Recherche, Center for Infection and Immunity of Lille, France
- Université de Lille Nord de France, France
- Institut Pasteur de Lille, France
Figures
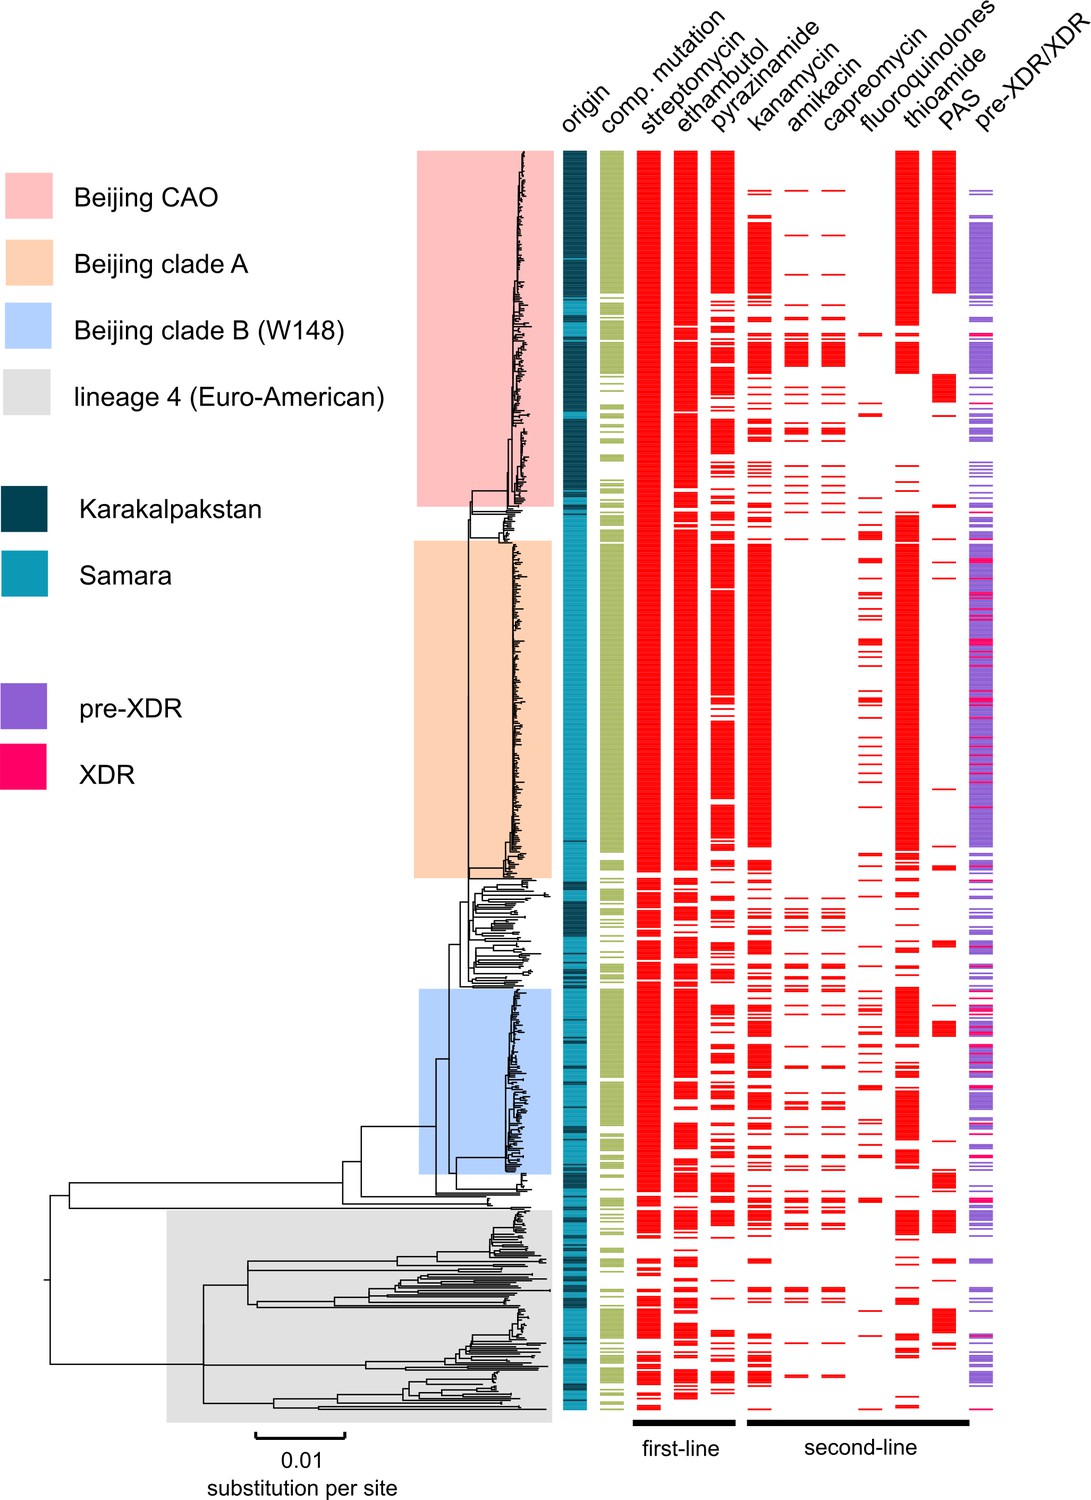
Figure 1

Drug resistance and transmission success among MDR-MTBC isolates from Karakalpakstan, Uzbekistan.
Maximum likelihood phylogeny (GTR substitution model, 1000 resamples) of 277 MDR-MTBC isolates from Karakalpakstan, Uzbekistan sampled from 2001 to 2006. Columns show drug resistance associated mutations to first- and second-line drugs (different mutations represented by different colors), genetic classification of pre-XDR (purple) and XDR (pink) isolates, and putative compensatory mutations in the RNA polymerase genes rpoA, rpoB and rpoC. Transmission index represents number of isolates within a maximum range of 10 SNPs at whole genome level. MTBC lineage two isolates (Beijing genotype) are differentiated into three clades (i.e. Central Asian Outbreak (CAO), group 2 and group 3). Isolates belonging to lineage 4 (Euro-American) are colored in grey: H = isoniazid, R = rifampicin, S = streptomycin, E = ethambutol, Z = pyrazinamide, FQ = fluoroquinolone, AG = aminoglycosides, Km = kanamycin Cm = capreomycin, TA = thioamide, PAS = para aminosalicylic acid.
Figure 2
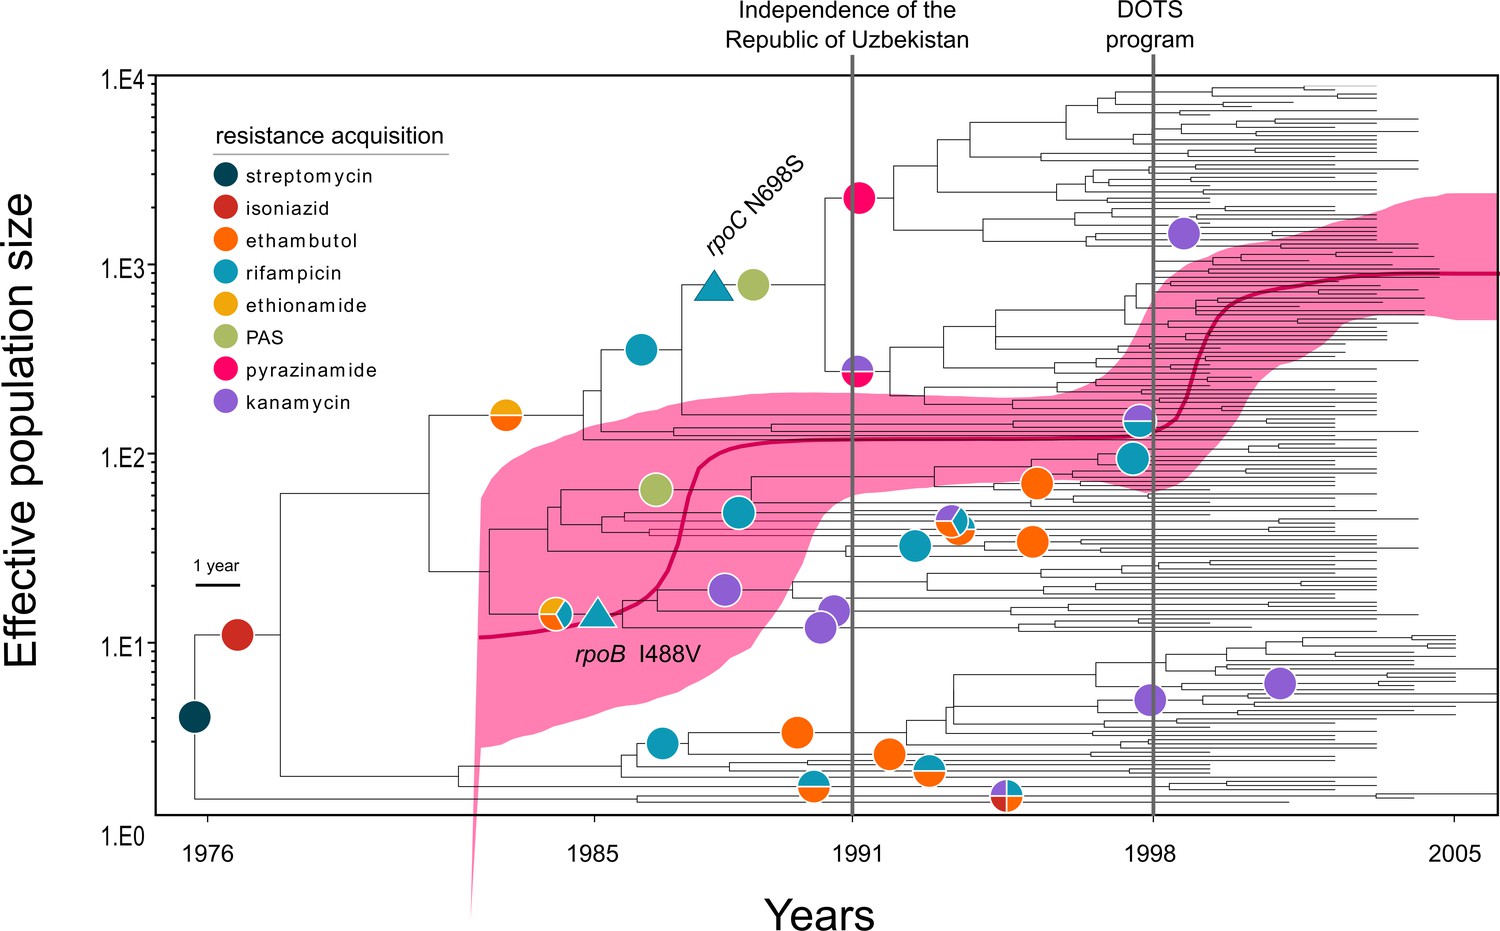
Evolutionary history of MTBC Central Asian outbreak (CAO) strains.
Genealogical tree of CAO strains in Karakalpakstan, Uzbekistan and effective population size over time based on a (piecewise-constant) Bayesian skyline approach using the GTR substitution model and a strict molecular clock prior of 0.94 × 10⁻⁷ substitutions per nucleotide per year. Pink shaded area represents changes in the effective population size giving the 95% highest posterior density (HPD) interval with the pink line representing the mean value. Vertical lines indicate time points of the implementation of the first standardized TB treatment program (DOTS) in Karakalpakstan and of the declaration of Uzbekistan as independent republic. Symbols on branches show steps of fixation of resistance conferring mutations.
Figure 3
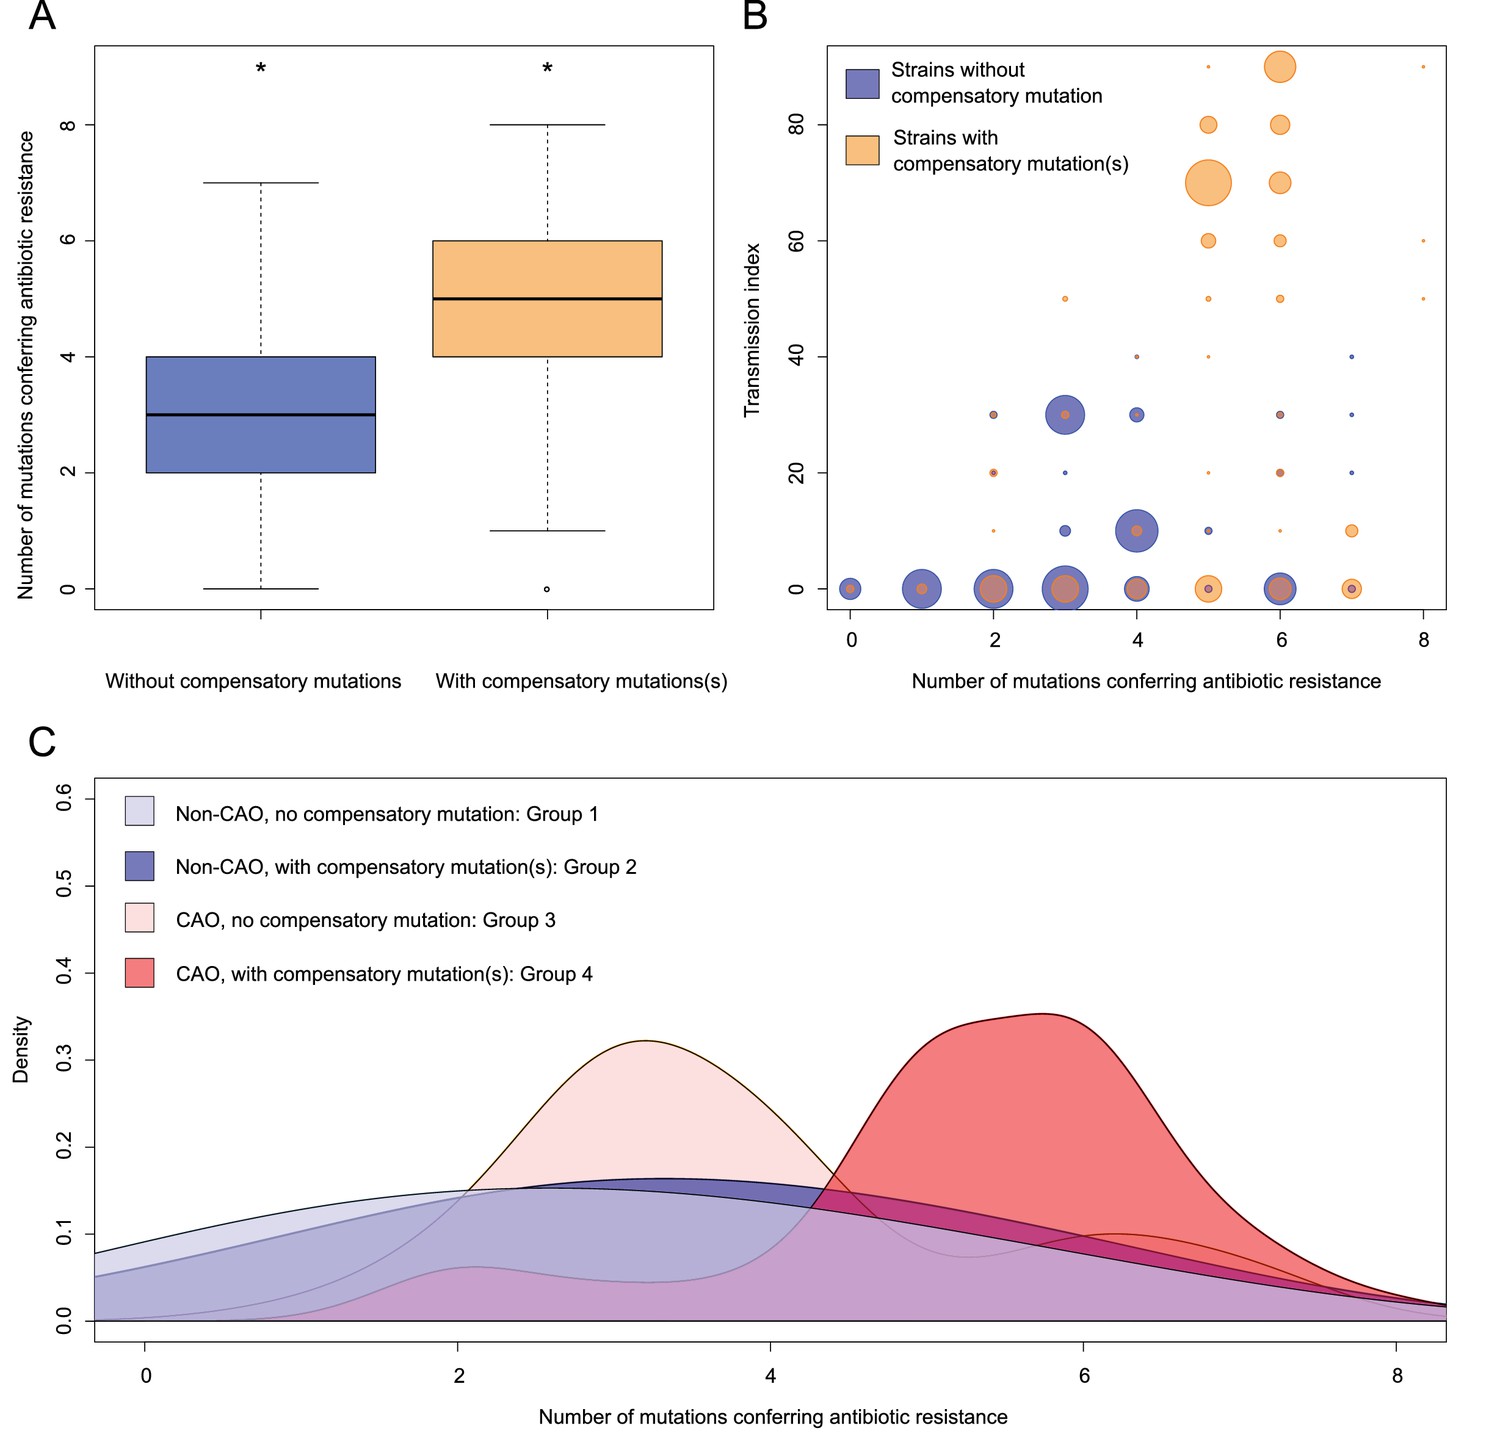
Compensatory mutations and drug resistance levels.
Comparisons between isolates carrying compensatory mutations (in orange) and isolates with no-compensatory mutations (in blue), from the Karakalpakstan dataset. (A) Boxplot showing number of resistance mutations for the two categories (without or with compensatory mutations). The two categories were significantly different (two-sample t-test p=1.2×10⁻¹⁰). (B) Bubble plots showing the transmission index (number of isolates differing by less than 10 SNPs) as a function of antibiotic resistance related mutations. Bubble sizes are proportional to the number of isolates. (C) Density plot of the number of resistance-conferring mutations for four groups of isolates sourced from the Karakalpakstan data. Proportions are adjusted by using Gaussian smoothing kernels. The four groups are composed of non-CAO isolates with no compensatory mutations; non-CAO isolates carrying compensatory mutations; CAO isolates with no compensatory mutations and CAO isolates carrying compensatory mutations. These groups are respectively colored in light blue, dark blue, light orange and light red.
Figure 4
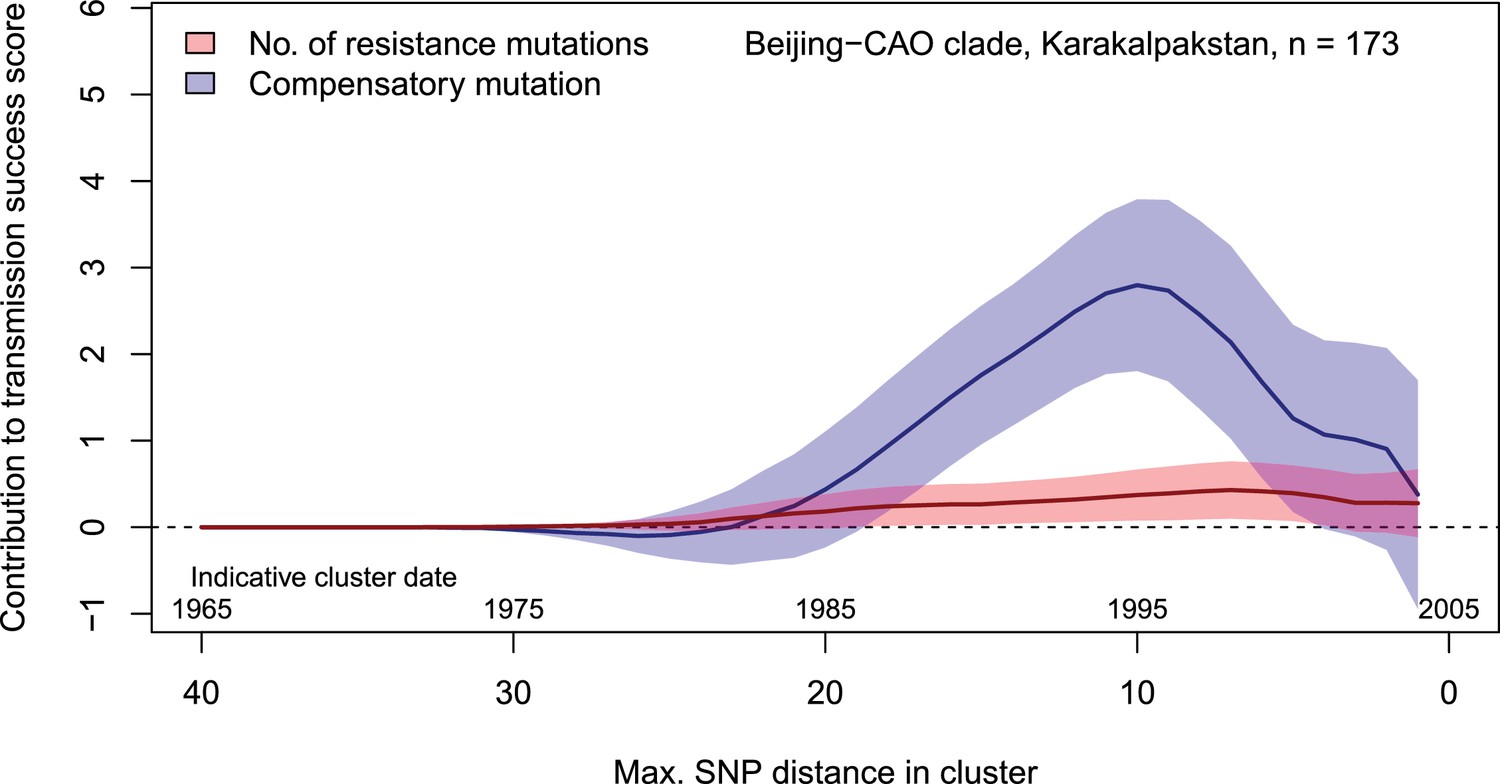
Contributions of resistance-conferring and compensatory mutations to the transmission success of the MTBC Beijing-CAO clade, Karakalpakstan, Uzbekistan.
Shown are the coefficients and 95% confidence bands of multiple linear regression of the transmission success score, defined as the size of clusters diverging by at most N SNPs and divided by N or, equivalently, the size of clusters that evolved over N years divided by N. The presence of compensatory mutations was independently associated with transmission success, with a maximum association strength found for SNP distances ranging from 10 to 20 SNPs, corresponding to transmission clusters beginning around 1995.
Figure 5
MDR-MTBC phylogeny and resistance mutations of isolates from Samara (Russia) and Karakalpakstan (Uzbekistan) Maximum likelihood tree (with 1,000 resamples, GTR nucleotide substitution model) based on 12,567 variable positions (SNPs) among 705 MDR-MTBC isolates from Karakalpakstan and Samara.
Any resistance associated mutations (see methods) for individual antibiotics are depicted with red bars for each isolate. The presence of any putative compensatory mutation in the RNA polymerase genes rpoA, rpoB, rpoC is depicted with green bars and country of origin and a genotypic pre-XDR and XDR isolate classification is color coded. PAS = para aminosalycylic acid.
Figure 6

Percentage of drug resistance among 705 MDR-MTBC isolates from Samara (Russia) and Karakalpakstan (Uzbekistan).
MDR-MTBC isolates stratified to three Beijing clades, other Beijing isolates and non-Beijing isolates. Proportions of isolates with identified molecular drug resistance mutations (see Supplementary file 1) which mediate resistance to multiple first- and second-line anti-TB drugs. Values are rounded. Drugs used in the WHO endorsed standardized short MDR-TB regimen marked with grey boxes. *The short MDR-TB regimen further includes high-dose isoniazid treatment, and clofazimine. In that regard, we identified 622/705 (85.4%) of the MDR-MTBC isolates with the well-known high-level isoniazid resistance mediating mutation katG S315T (Supplementary file 1), for clofazimine resistance mediating mutations are not well described.
Appendix 1—figure 1
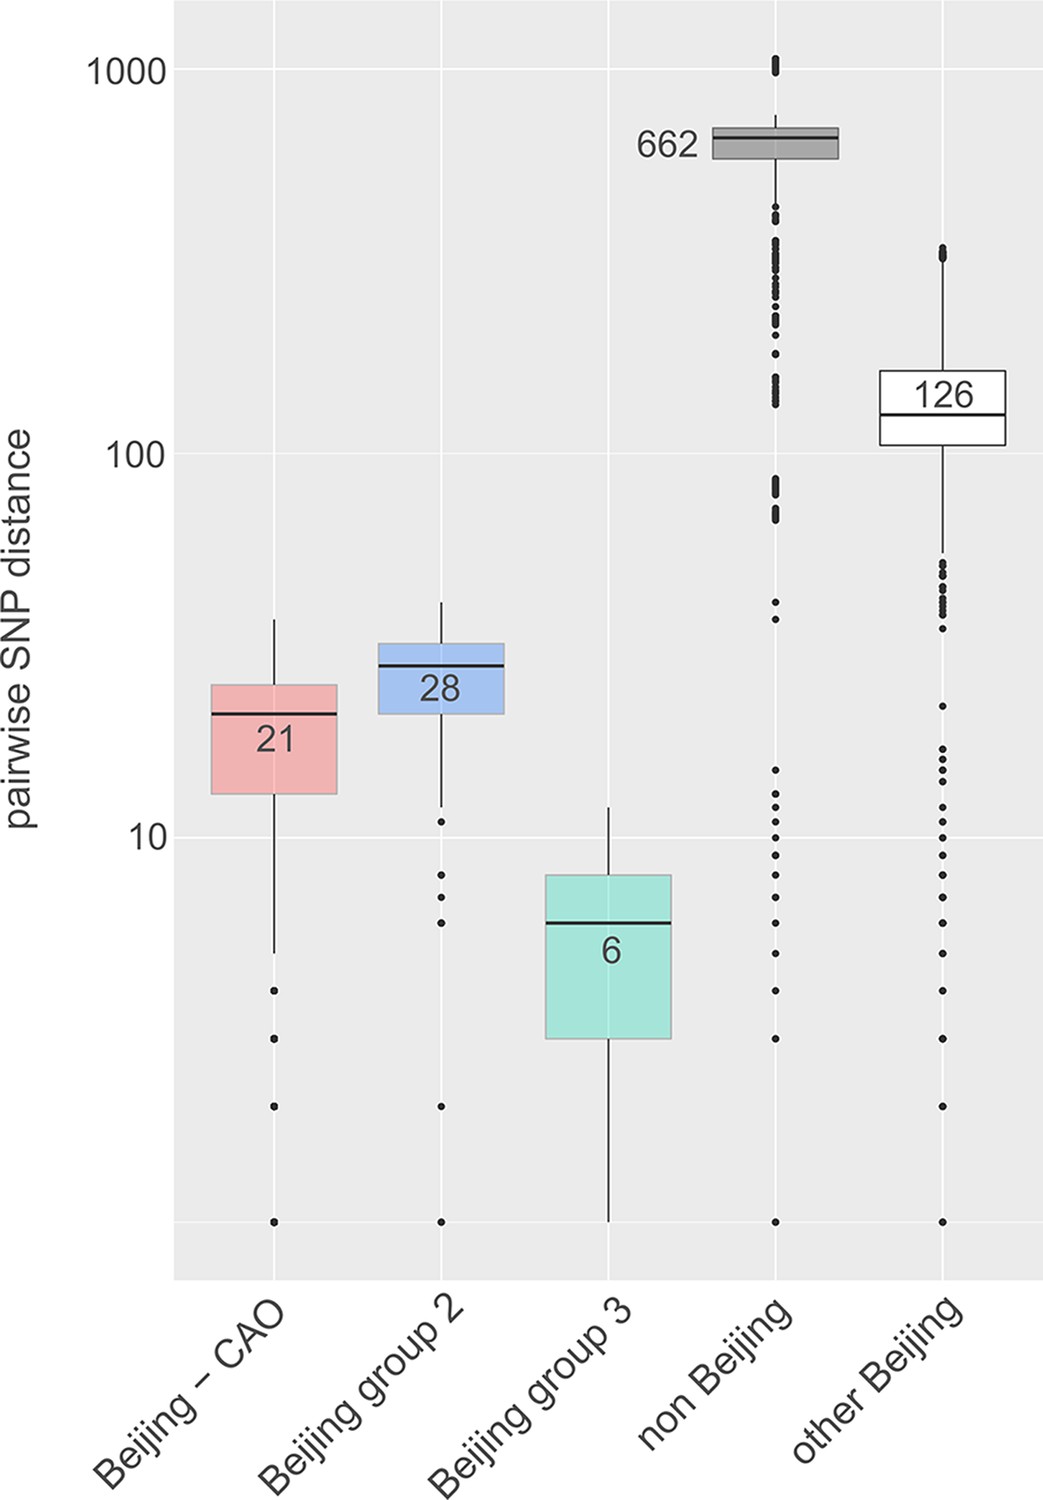
Box-Plot showing pairwise SNP distances among identified Beijing clades and other Beijing isolates in comparison to non-Beijing isolates from Karakalpakstan, Uzbekistan.
Box represents inter quartile range, whiskers represent 95% of the data, outliers shown as black dots; solid black line represents the median.
Appendix 1—figure 2
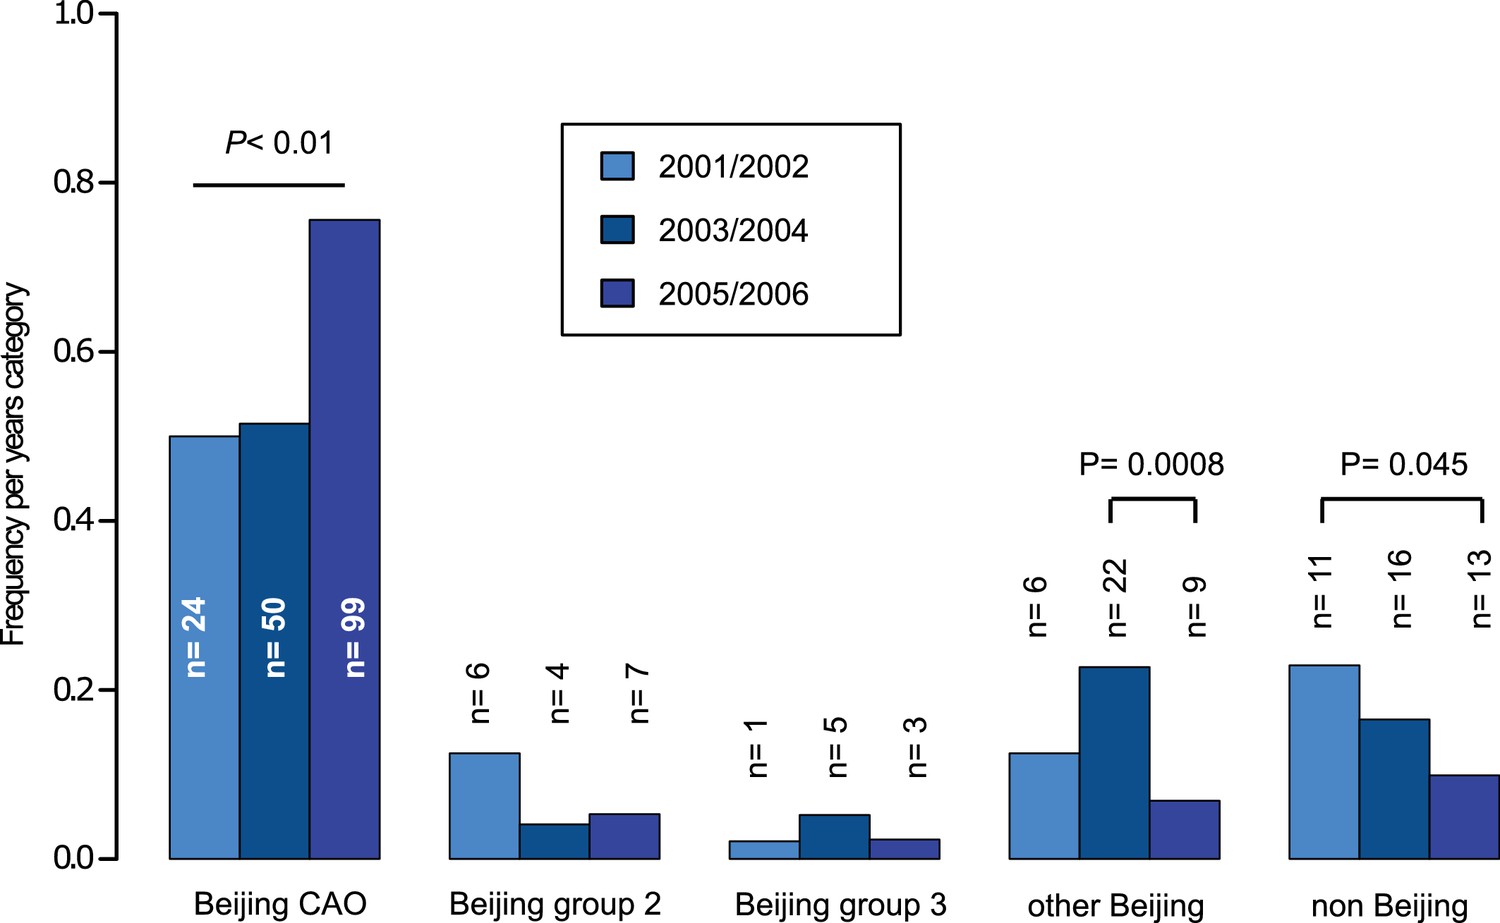
Proportions of different Beijing clades, other Beijing isolates and non-Beijing isolates in Karakalpakstan, Uzbekistan stratified to the years 2001/02, 2003/04, 2005/06.
P-values for pairwise comparisons within groups were calculated with Fisher exact test (two-sided). Beijing CAO 2001/2002 vs 2005/2006 p=0.0018, Beijing CAO 2003/2004 vs 2005/2006 p=0.0002.
Appendix 1—figure 3
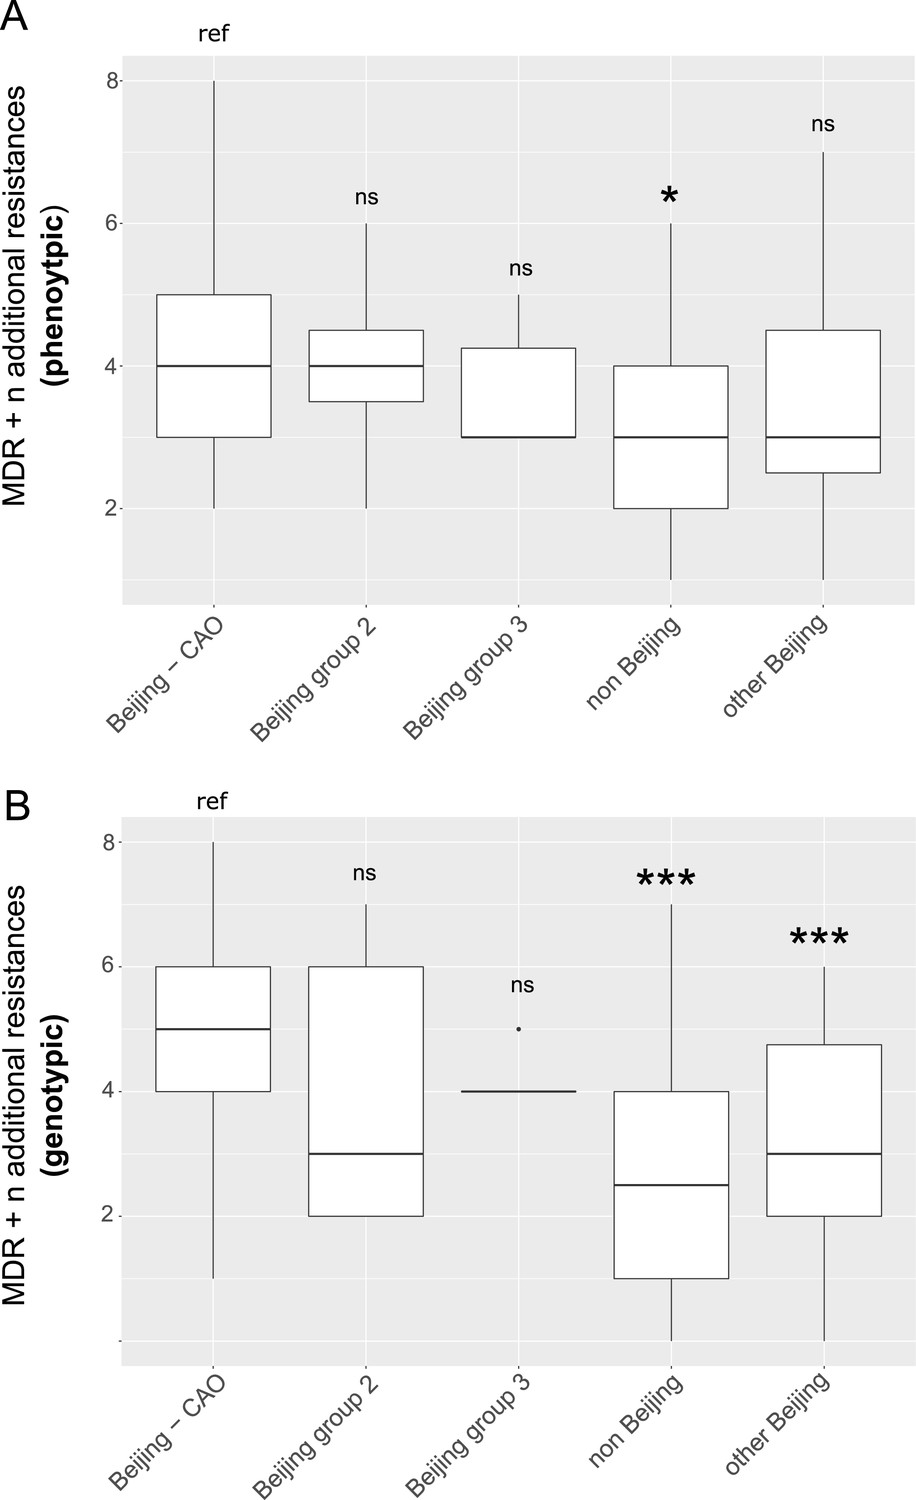
Box-Plot showing median number of (A) phenotypic and (B) genotypic drug resistances (in addition to the MDR classification,that is isoniazid and rifampicin resistance) of all isolates from Karakalpakstan.
Box represents inter quartile range, whiskers represent 95% of the data, outliers shown as black dots; solid black line represents the median. Beijing CAO isolates exhibit more phenotypic drug resistances compared to non-Beijing isolates (p=0.0079) and more genotypic drug resistances compared to other Beijing isolates (p<0.0001), and non-Beijing isolates (p<0.0001). P-values for pairwise comparison with reference group calculated with unpaired t-test (two-tailed, Welch’s correction).
Appendix 1—figure 4
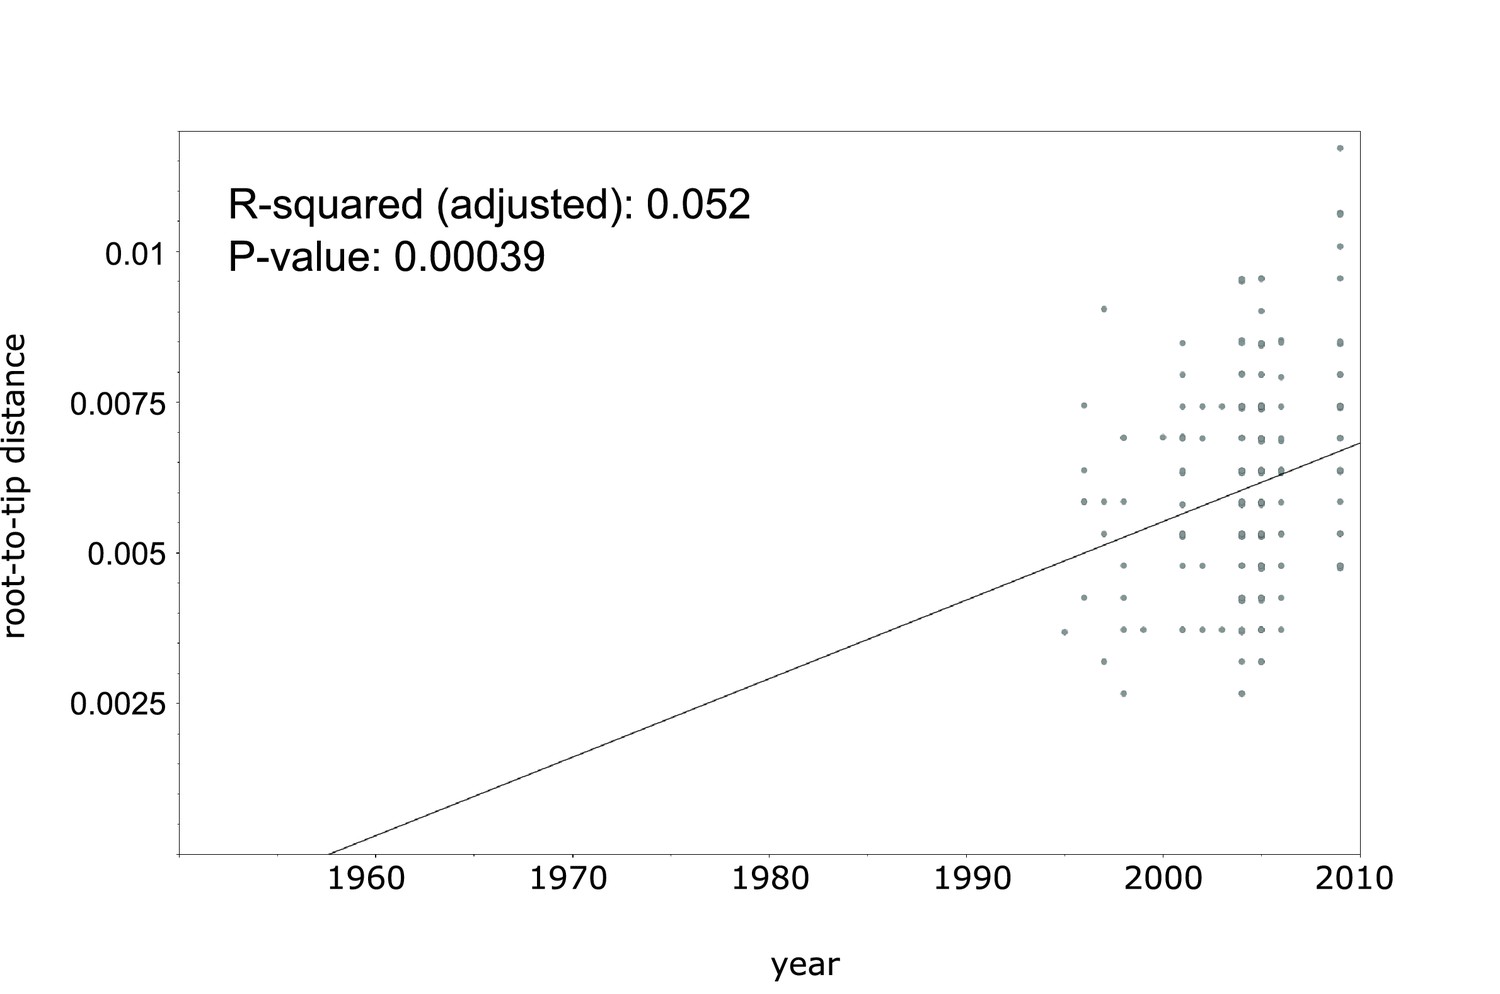
Linear regression analysis showing correlation between root-to-tip distance and sampling years of an extended collection of 220 Beijing CAO datasets covering the period 1995 to 2009.
https://doi.org/10.7554/eLife.38200.015
Appendix 1—figure 5
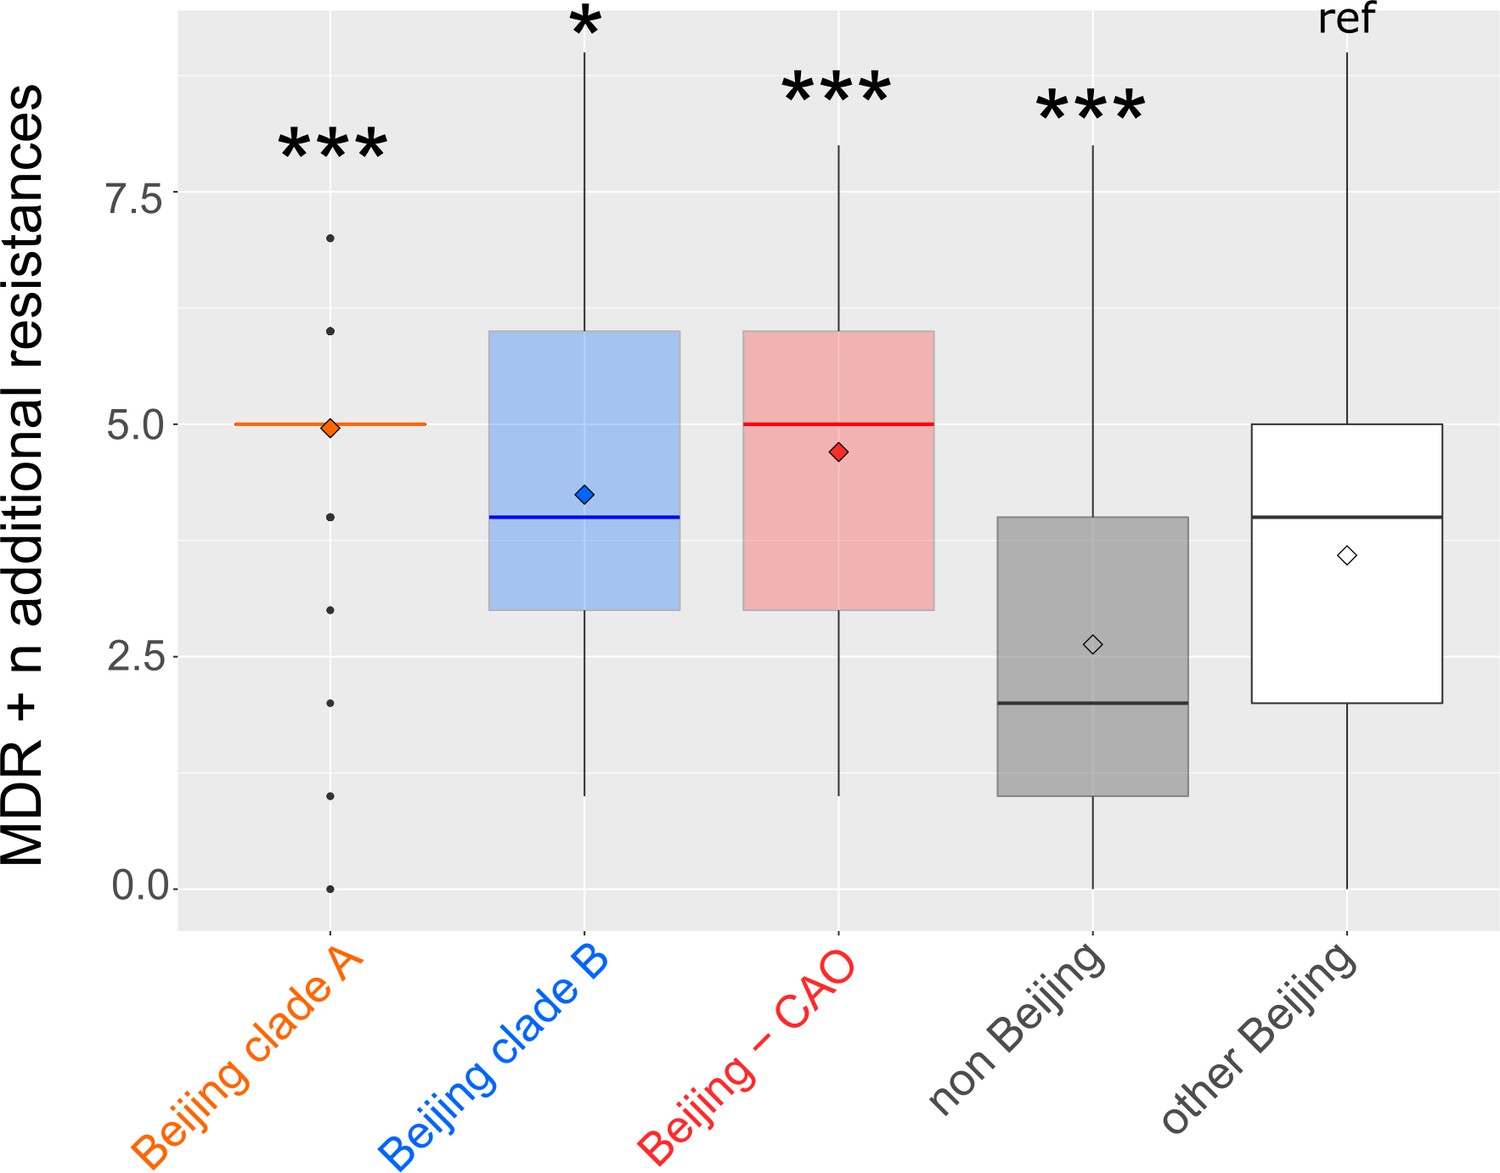
Number of drug resistance mutations among different MDR-MTBC groups from Samara (n = 428) and Karakapakstan (n = 277).
Box-Plot with mean (diamond) and median (horizontal line) number of genotypic drug resistances (see methods) to additional anti-TB drugs (beyond MDR defining rifampicin and isoniazid resistance). Box represents inter quartile range, whiskers represent 95% of the data, outliers shown as black dots. P-values for three major Beijing outbreak clades (A, B and CAO), and non-Beijing isolates (mainly lineage four isolates) were calculated with unpaired t-tests with Welch correction compared to the group ‘other Beijing’. Color codes according to Figure 5. P-values for pairwise comparison with reference group calculated with unpaired t-test (two-tailed, Welch’s correction). Clade A (p≤0.0001), Clade B (p=0.0143), CAO (p≤0.0001), and non-Beijing (p=0.0009).
Appendix 1—figure 6
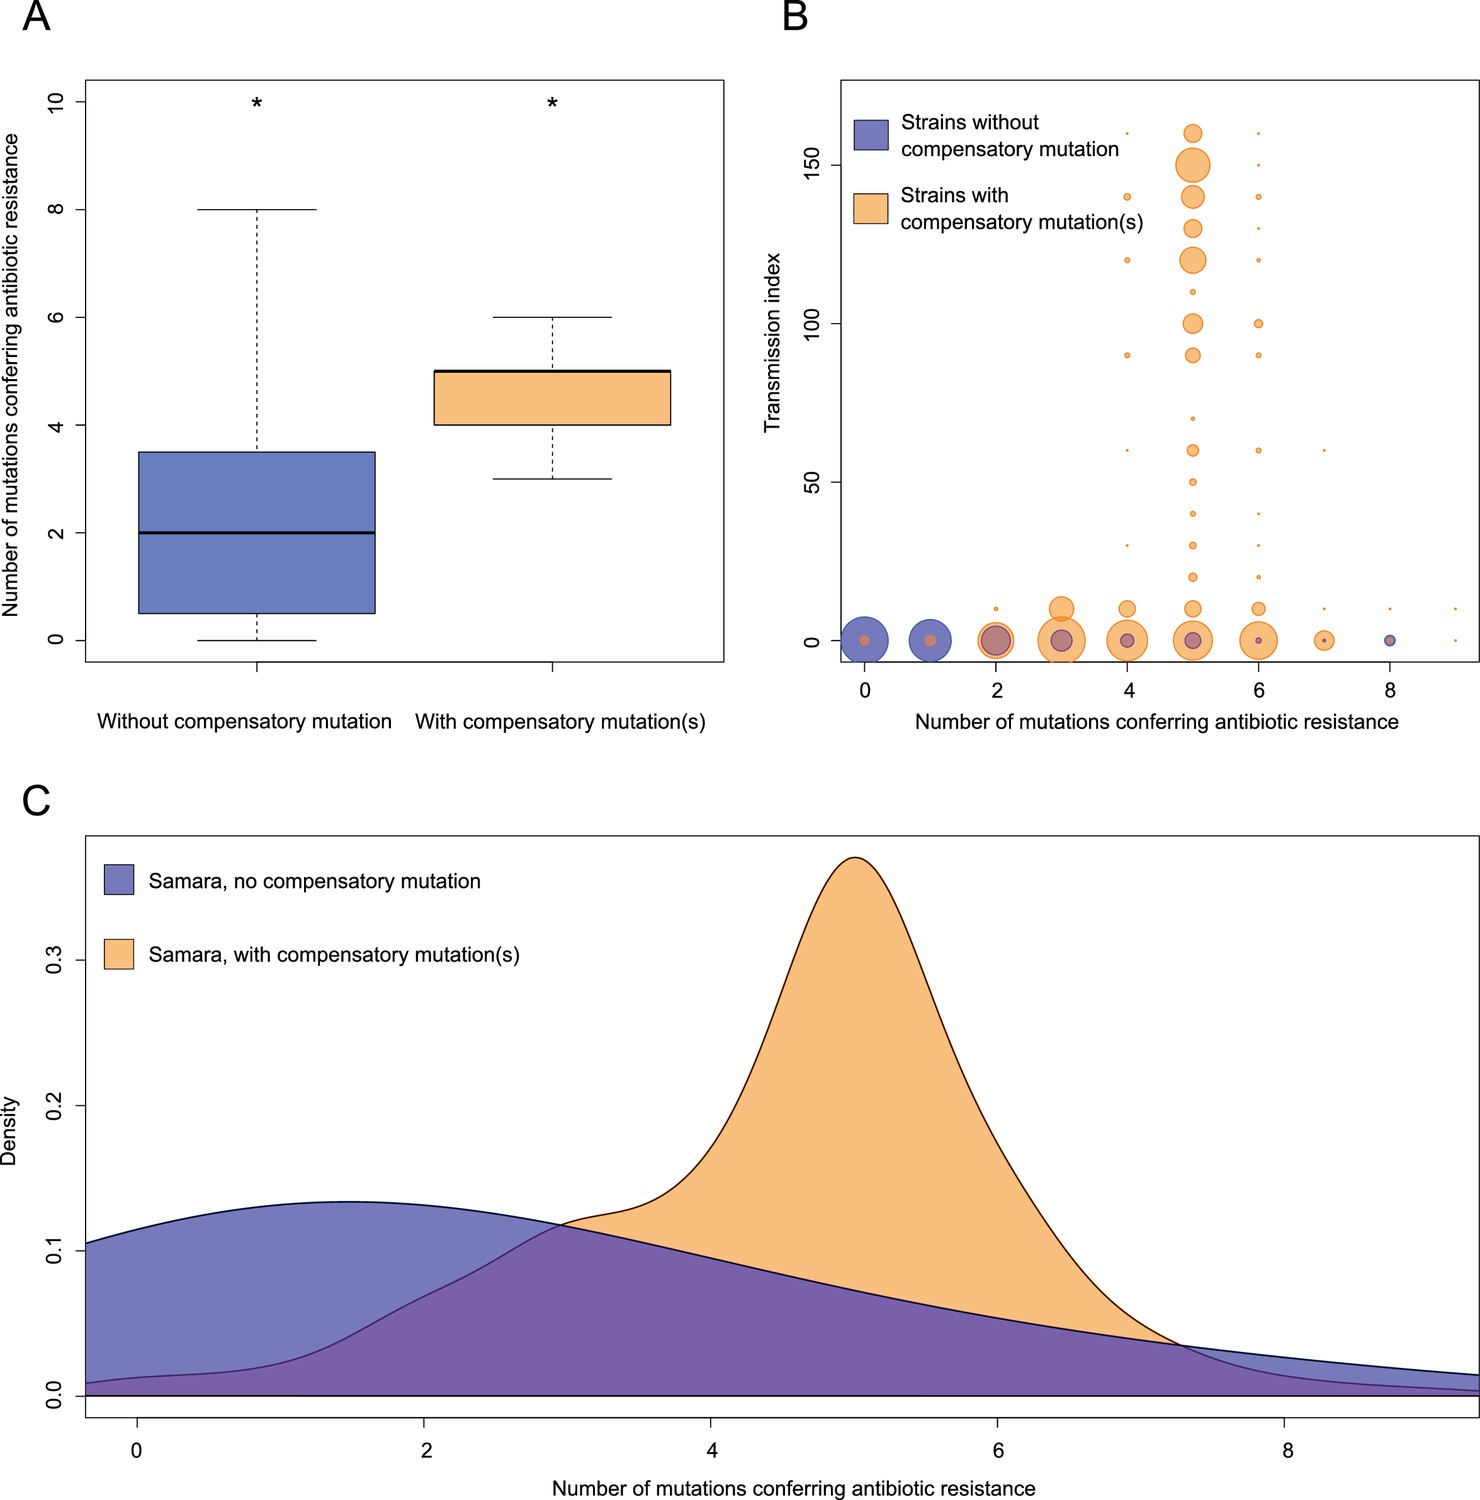
Comparisons between isolates carrying compensatory mutations (in orange) and isolates with no-compensatory mutations (in blue), from the Samara dataset.
(A) Boxplot showing number of resistance mutations for the two categories (without or with compensatory mutations). The two categories were significantly different (two-sample t-test p<2.2×10⁻¹⁶). (B) Bubble plots showing the transmission index (number of isolates differing by less than 10 SNPs) as a function of antibiotic resistance related mutations. Bubble sizes are function of the number of isolates. (C) Density plot of the number of resistance-conferring mutations for isolates carrying compensatory mutations (orange) and isolates that don’t carry compensatory mutation (blue) from Samara dataset. Proportions are adjusted by using Gaussian smoothing kernels.
Appendix 1—figure 7
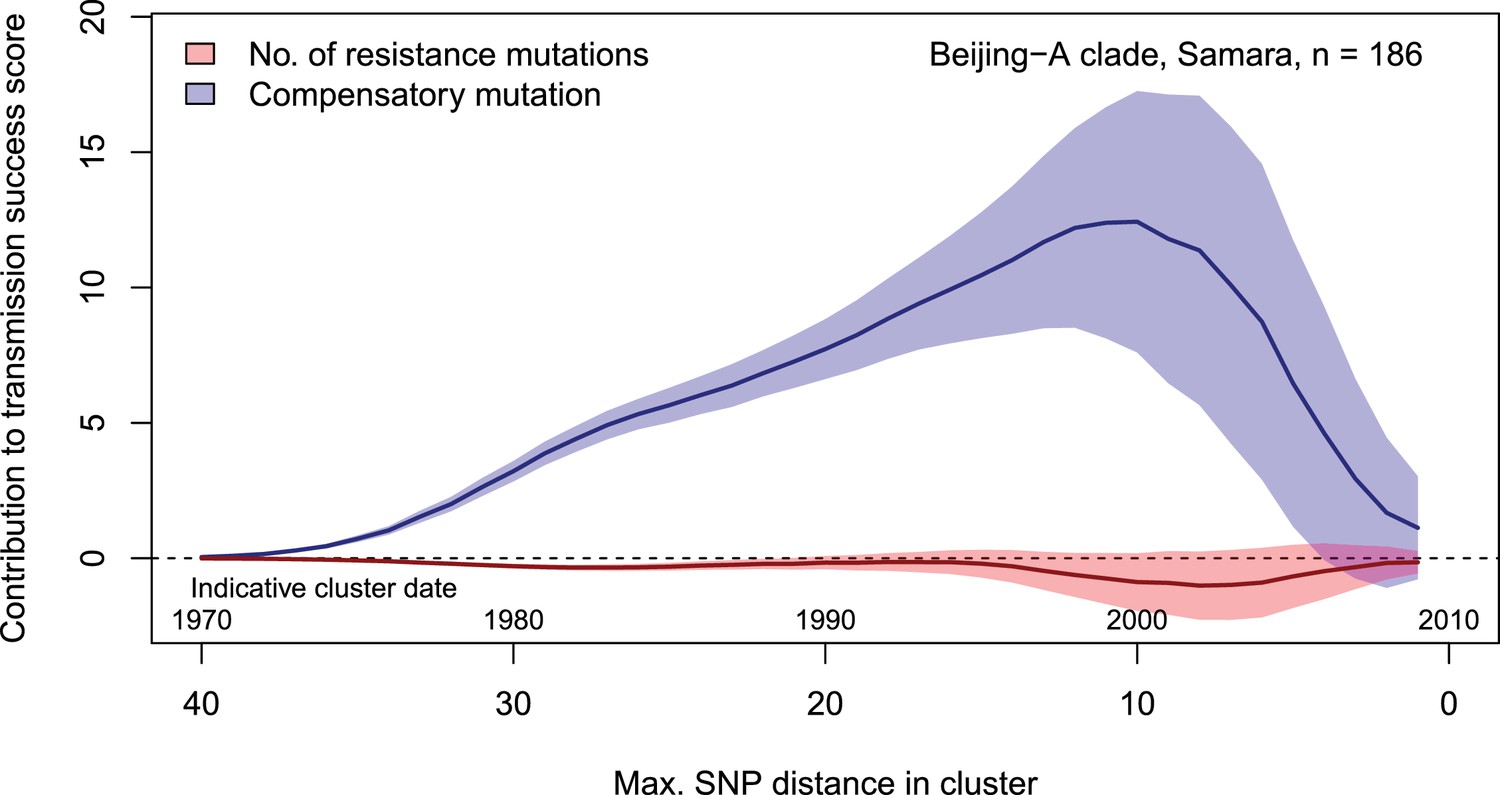
Contributions of resistance-conferring and compensatory mutations to the transmission success of M.tuberculosis of the Beijing-A clade from Samara, Russia.
Shown are the coefficients and 95% confidence bands of multiple linear regression of the transmission success score, defined as the size of clusters diverging by at most N SNPs and divided by N or, equivalently, the size of clusters that evolved over N years divided by N. Compensatory mutations were independently associated with transmission success, with a maximum association strength found for transmission clusters beginning around 1999.
Appendix 1—figure 8
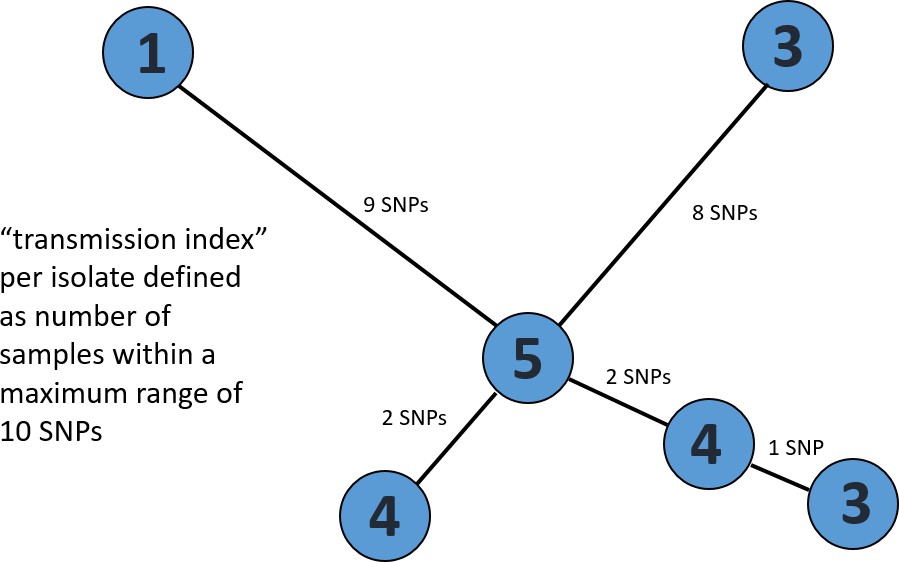
Exemplary minimum spanning tree to visualize the determination of a transmission index for each isolate.
Each node/isolate is labelled with its transmission index, i.e. number of other isolates with a maximum distance of 10 SNPs. Branches are indicated with number of unique SNPs.
Tables
Appendix 1—table 1
Main characteristics of patients from cohorts 1 and 2 in Karakalpakstan, Uzbekistan.
https://doi.org/10.7554/eLife.38200.020| Cohort 1 | Cohort 2 | P value | |
|---|---|---|---|
| Year of isolate collection (patient diagnosis with MDR-TB) | 2001–2002 | 2003–2006 | |
| No. MDR cases diagnosed within time period | 57 | 300 | |
| No. Included in this analysis Reasons for non-inclusion: Multiple strain infection No DNA available Patient already in cohort 1 Low DNA quantity | 49 (86%) 6 2 NA 0 | 228 (76%) 1 40 11 20 | 0.094 |
| Patient residence (within Karakalpakstan) Nukus Chimbay Other Unknown | 34 (69%) 6 9 0 | 146 (64%) 64 1 17 | 0.49 |
| Male | 27 (55%) | 119 (52%) | 0.72 |
| Age (median, IQR) Missing age | 32, 27–38 0 | 31, 24–41 49 (21%) | 0.40 |
| Previous TB treatment | 38 (78%) | 228 (100%) | <0.0001 |
| First-line resistance profile: HR HRE HRS HRES HRSZ HREZ HRESZ | 1 0 12 (24%) 28 (57%) 1 (2%) 1 7 (14%) | 2 1 41 (18%) 49 (21%) 27 (12%) 1 107 (47%) | <0.0001 |
| No. of first-line drugs resistant 2 3 4 5 | 1 12 (24%) 30 (61%) 7 (14%) | 2 42 (18%) 77 (34%) 107 (47%) | <0.0001 |
| Availability of second-line drug susceptibility testing (DST) | Ofx, Cap, Proth | Ofx, Cap, Ami, Eth, Cyc, PAS | |
| Ofx resistance | 5 (10%) | 6 (3%) | 0.033 |
| Cm resistance | 1 (2%) | 53 (23%) | 0.0001 |
-
Abbreviations: H = isoniziad, R = rifampicin, E = ethambutol, S = streptomycin, Z = pyrazinamide, Ofx = ofloxacin, Cm = capreomycin
Appendix 1—table 2
Path sampling results and model selection based on Δ marginal L estimates (relative to best model (ref)) considering 75 path sampling steps and chain lengths of 15 million.
Comparisons of Beast runs using a combined dataset of Central Asian outbreak (CAO) isolates originated from Germany (1995 – 2000), Karakalpakstan (2001–2006), and Samara (2008 – 2010) as well as comparisons of Beast runs from CAO-Karakalpakstan data employing the best clock model/substitution rate estimate and runs with the 95% HPD intervals for the substitution rate. Mean node age of CAO-MRCA and acquisition of putative compensatory mutation rpoC N698S of CAO-Karakalpakstan clade are given for each model.
| Clock model | Demographic model | Marginal L estimate | Mean ESS | Δ marginal L estimate | Subst rate x 10−7 (95%HPD) | MRCA and rpoC N698S mean node age (95%HPD) |
|---|---|---|---|---|---|---|
| Combined CAO dataset for clock model comparison | ||||||
| Strict (no tip dating) | Coalescent constant size | −10131.67 | 4302 | 32.21 | 1.0 (fixed) | 41.5 (30.6–49.1) NA |
| Strict (tip dating) | Coalescent constant size | −10099.46 | 4041 | ref | 1.0 (fixed) | 42.9 (34.3–50.3) NA |
| Relaxed, lognormal | Coalescent constant size | −10117.21 | 1303 | 17.75 | 0.96 (0.65–1.24) | 57.6 (34.4–84.5) NA |
| Combined CAO dataset for molecular clock estimate among CAO strains | ||||||
| Relaxed, lognormal | Coalescent constant size | −10117.21 | 1303 | 78.28 | 0.96 (0.65–1.24) | 57.6 (34.4–84.5) NA |
| Relaxed, lognormal | Exponential | −10044.41 | 1266 | 5.48 | 0.88 (0.58–1.21) | 40.5 (26.4–53.2) NA |
| Relaxed, lognormal | Bayesian skyline | −10038.93 | 924 | ref | 0.94 (0.72–1.15) | 37.1 (25.7–44.0) NA |
| CAO-Karakalpakstan dataset for demographic model comparison (under best clock estimate) | ||||||
| Strict (tip dating) | Bayesian skyline | −7617.09 | 2874 | 3.79 | 0.94 (fixed) | 32.2 (23.9–37.3) 16.1 (11.6–16.9) |
| Strict (tip dating) | Coalescent constant size | −7667.92 | 4231 | 54.62 | 0.94 (fixed) | 37.5 (30.2–45.1) 15.8 (12.3–18.6) |
| Strict (tip dating) | Exponential | −7613.30 | 4003 | ref | 0.94 (fixed) | 29.3 (23.5–33.7) 15.4 (12.4–20.1) |
| CAO-Karakalpakstan dataset, exponential growth model, upper and lower 95% HPD values (from best clock estimate) | ||||||
| Strict (tip dating) | Exponential | −7610.94 | 3926 | ref | 0.72 (fixed) | 36.4 (30.4–43.3) 18.4 (15.8–21.6) |
| Strict (tip dating) | Exponential | −7613.30 | 4003 | 2.36 | 0.94 (fixed) | 29.3 (23.5–33.7) 15.4 (12.4–20.1) |
| Strict (tip dating) | Exponential | −7621.22 | 4031 | 10.28 | 1.15 (fixed) | 24.4 (20.0–25.8) 12.9 (10.8–14.4) |
| CAO-Karakalpakstan dataset, skyline model, upper and lower 95% HPD values (from best clock estimate) | ||||||
| Strict (tip dating) | Bayesian skyline | −7611.12 | 2694 | ref | 0.72 (fixed) | 39.5 (30.7–47.8) 18.8 (14.6–21.5) |
| Strict (tip dating) | Bayesian skyline | −7617.09 | 2874 | 5.97 | 0.94 (fixed) | 32.2 (23.9–37.3) 16.1 (11.6–16.9) |
| Strict (tip dating) | Bayesian skyline | −7619.71 | 2763 | 8.59 | 1.15 (fixed) | 25.2 (20.2–30.7) 11.8 (10.1–13.9) |
-
Abbreviations: HPD = Highest posterior density interval
Appendix 1—table 3
Mutations in rpoB, rpoA and rpoC associated with a putative compensatory effect in rifampicin resistant MTBC strains.
Data from 277 MDR-MTBC isolates from Karakalpakstan, Uzbekistan, stratified to the particularly successful variant termed Central Asian outbreak (CAO) and other Beijing isolates. Pairwise differences between the two groups calculated with Fisher exact test; two-tailed P-values are reported.
| Beijing CAO (n = 173) | Other Beijing (n = 64) | P-value | All (n = 277) | |
|---|---|---|---|---|
| rpoB mutations outside RRDR, excluding codon 170,400,491 variants wild type | 25 (14.5%) 147 (85.0%) | 12 (18.8%) 52 (81.3%) | 0.43 | 43 (15.5%) 234 (84.5%) |
| rpoC variants wild type | 95 (54.9%) 78 (45.1%) | 18 (28.1%) 46 (71.2%) | 0.0002 | 126 (45.5%) 151 (54.5%) |
| rpoA variants wild type | 5 (2.9%) 168 (97.1%) | 2 (3.1%) 62 (96.9%) | 1.00 | 7 (2.5%) 270 (97.5%) |
-
Abbreviations: CAO = Central Asian outbreak, RRDR = rifampicin resistance determining region
Appendix 1—table 4
Proportions of genotypic drug resistance rates for different anti-TB drugs (beyond isoniazid and rifampicin resistance) and pre-XDR/XDR-TB classification among 705 MDR-MTBC isolates from Samara (n = 428) and Karakalpakstan (n = 277), stratified to three identified major phylogenetic clades within the Beijing genotype/lineage and to other Beijing isolates, and to non-Beijing isolates (mainly lineage 4, Euro-American).
https://doi.org/10.7554/eLife.38200.023| Group | S | E | Z | Km | Am | Cm | Fq | Thio | PAS | Pre-XDR XDR |
|---|---|---|---|---|---|---|---|---|---|---|
| Beijing CAO (n = 201) | 201/201 100.0% | 195/201 97.0% | 152/201 75.6% | 97/201 48.3% | 37/201 18.4% | 37/201 18.4% | 6/201 3.0% | 121/201 60.2% | 99/201 49.3% | 100/201 49.8% |
| Beijing clade B (W148) (n = 103) | 103/103 100.0% | 83/103 80.6% | 44/103 42.7% | 61/103 59.2% | 18/103 17.5% | 18/103 17.5% | 23/103 22.3% | 75/103 72.8% | 12/103 11.7% | 64/103 62.1% |
| Beijing clade A (n = 187) | 184/187 98.4% | 183/187 97.9% | 163/187 87.2% | 177/187 94.7% | 0/187 0.0% | 0/187 0.0% | 33/187 17.6% | 180/187 96.3% | 7/187 3.7% | 179/187 95.7% |
| Other Beijing (n = 100) | 91/100 91.0% | 73/100 73.0% | 52/100 52.0% | 39/100 39.0% | 20/100 20.0% | 23/100 23.0% | 14/100 14.0% | 32/100 32.0% | 15/100 15.0% | 45/187 24.1% |
| Non-Beijing (n = 114) | 69/114 60.5% | 63/114 55.3% | 30/114 26.3% | 39/114 34.2% | 14/114 12.3% | 14/114 12.3% | 3/114 2.6% | 34/114 29.8% | 34/114 29.8% | 40/114 35.1% |
-
Abbreviations: S = streptomycin, E = ethambutol, Z = pyrazinamide, Km = kanamycin, Am = amikacin, Cm = Capreomycin, Fq = fluoroquinolone, Thio = thioamide, PAS = para aminosalicylic acid
Appendix 1—table 5
Likelihood scores for different substitution models calculated with Jmodeltest 2.1 and statistical model selection based on Akaike and Bayesian Information Criteration (AIC and BIC).
Best model is assumed to have the lowest criteration value. Shown are the top 10 AIC models. Substitution model used for Bayesian inference marked in bold.
| Subst. model | -lnL | AIC | Δ AIC | BIC | Δ BIC |
|---|---|---|---|---|---|
| GTR | 8837.6437 | 18567.2875 | 0.0 | 21041.0025 | 7.0748 (2) |
| GTR + I | 8837.6747 | 18569.3494 | 2.0619 (2) | 21048.6109 | 14.6832 (5) |
| GTR + G | 8838.9842 | 18571.9684 | 4.6809 (3) | 21051.2299 | 17.3022 (6) |
| GTR + I + G | 8839.0077 | 18574.0153 | 6.7278 (4) | 21058.8233 | 24.8955 (8) |
| TPM1uf | 8845.426 | 18576.852 | 9.5645 (5) | 21033.9277 | 0.0 |
| TPM1uf + I | 8845.4446 | 18578.8891 | 11.6016 (6) | 21041.5113 | 7.5836 (3) |
| TPM1uf + G | 8846.7354 | 18581.4709 | 14.1834 (7) | 21044.093 | 10.1653 (4) |
| TPM1uf + I + G | 8846.7697 | 18583.5395 | 16.252 (8) | 21051.7081 | 17.7804 (7) |
| SYM | 8860.6478 | 18607.2955 | 40.008 (9) | 21064.3712 | 30.4435 (9) |
| SYM + I | 8860.6826 | 18609.3652 | 42.0777 (10) | 21071.9874 | 38.0596 (12) |
Additional files
-
Supplementary file 1
34 Central Asian outbreak (CAO) specific SNPs with annotations.
- https://doi.org/10.7554/eLife.38200.009
-
Transparent reporting form
- https://doi.org/10.7554/eLife.38200.010
Download links
A two-part list of links to download the article, or parts of the article, in various formats.
Downloads (link to download the article as PDF)
Open citations (links to open the citations from this article in various online reference manager services)
Cite this article (links to download the citations from this article in formats compatible with various reference manager tools)
Compensatory evolution drives multidrug-resistant tuberculosis in Central Asia
eLife 7:e38200.
https://doi.org/10.7554/eLife.38200


