A discriminator code–based DTD surveillance ensures faithful glycine delivery for protein biosynthesis in bacteria
- CSIR–Centre for Cellular and Molecular Biology, India
- CSIR–CCMB Campus, India
Figures
Figure 1 with 2 supplements
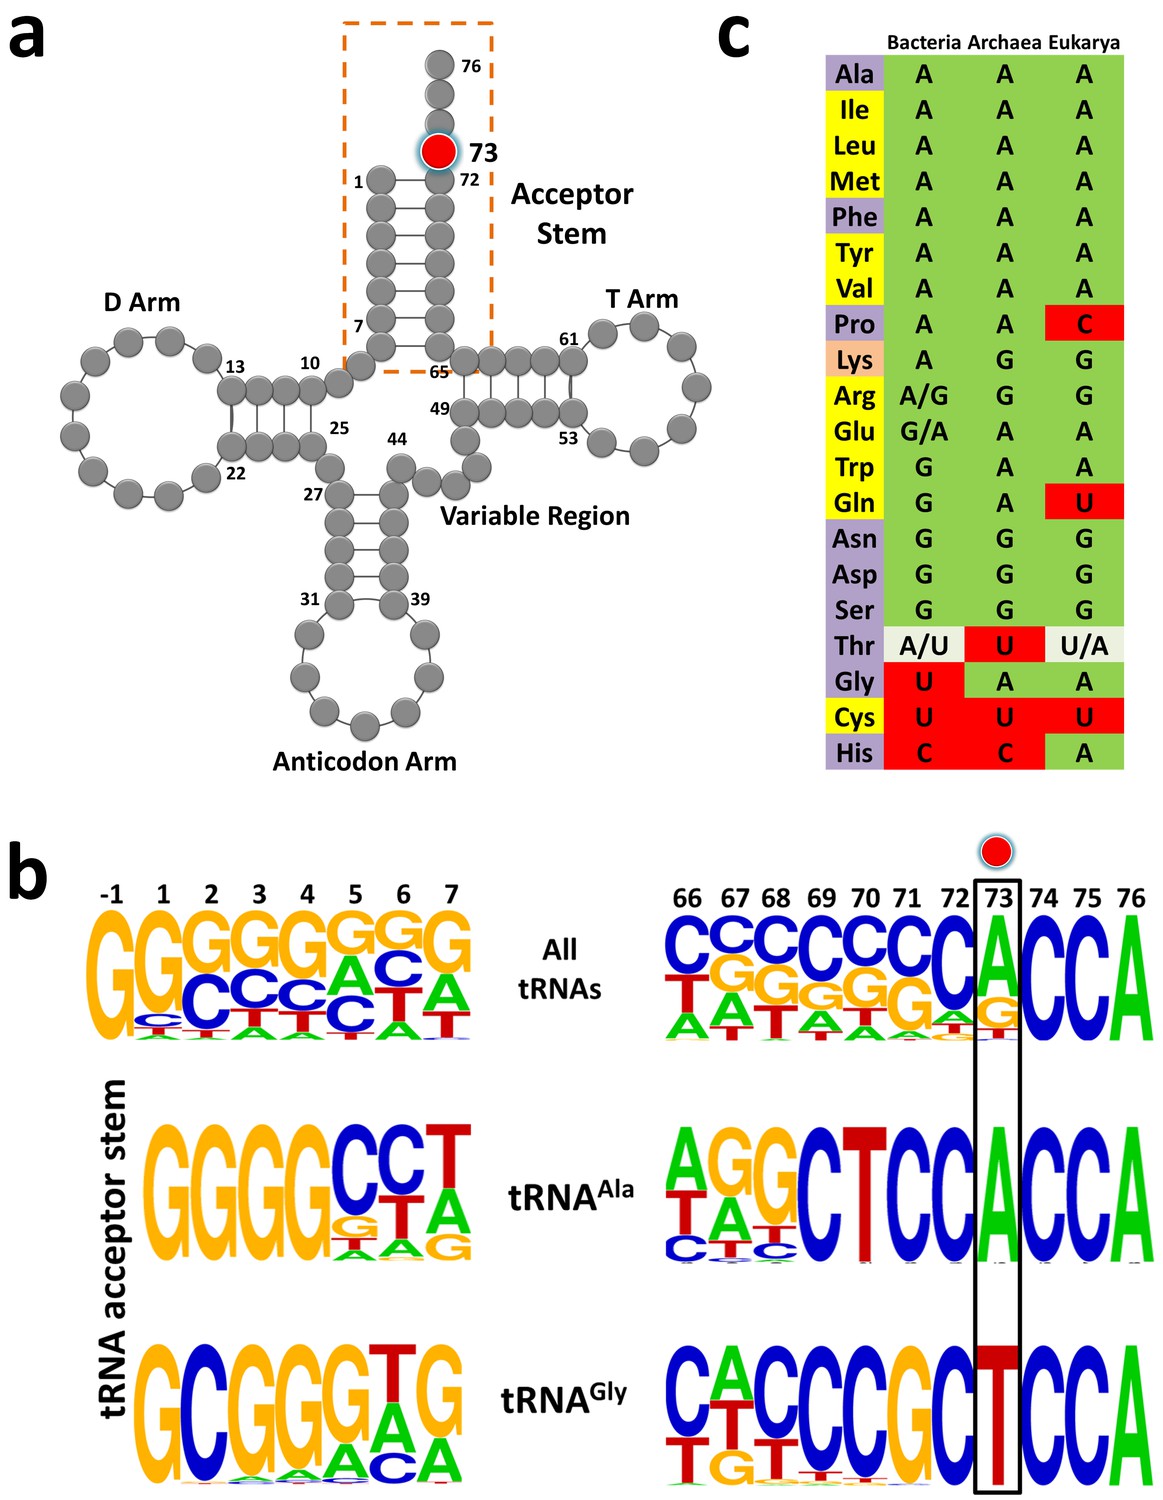
tRNAGly and tRNAAla show discriminator base dichotomy in Bacteria.
(a) Clover leaf model of tRNA with the discriminator base highlighted in red. (b) Frequency distribution of tRNA acceptor stem elements across bacterial tRNAs, comparing and contrasting between tRNAGly and tRNAAla. Red circle indicates the discriminator base. (c) Distribution of the discriminator base in all tRNAs across the three domains of life. The instances where the discriminator base shows >90% conservation has been represented by the most frequent base. In the case of tRNAThr, U73 and A73 together represent >90% frequency of occurrence; A/U in Bacteria implies A73 is more abundant than U73, whereas U/A in Eukarya denotes U73 is more abundant than A73. Amino acids are color-coded on the basis of the class to which the corresponding synthetases belong: yellow, class I; blue, class II; orange, both class I and II. Discriminator base color-coded as follows: green, purine (A or G); red, pyrimidine (U or C); grey, purine and pyrimidine (A/U or U/A).
Figure 1—figure supplement 1
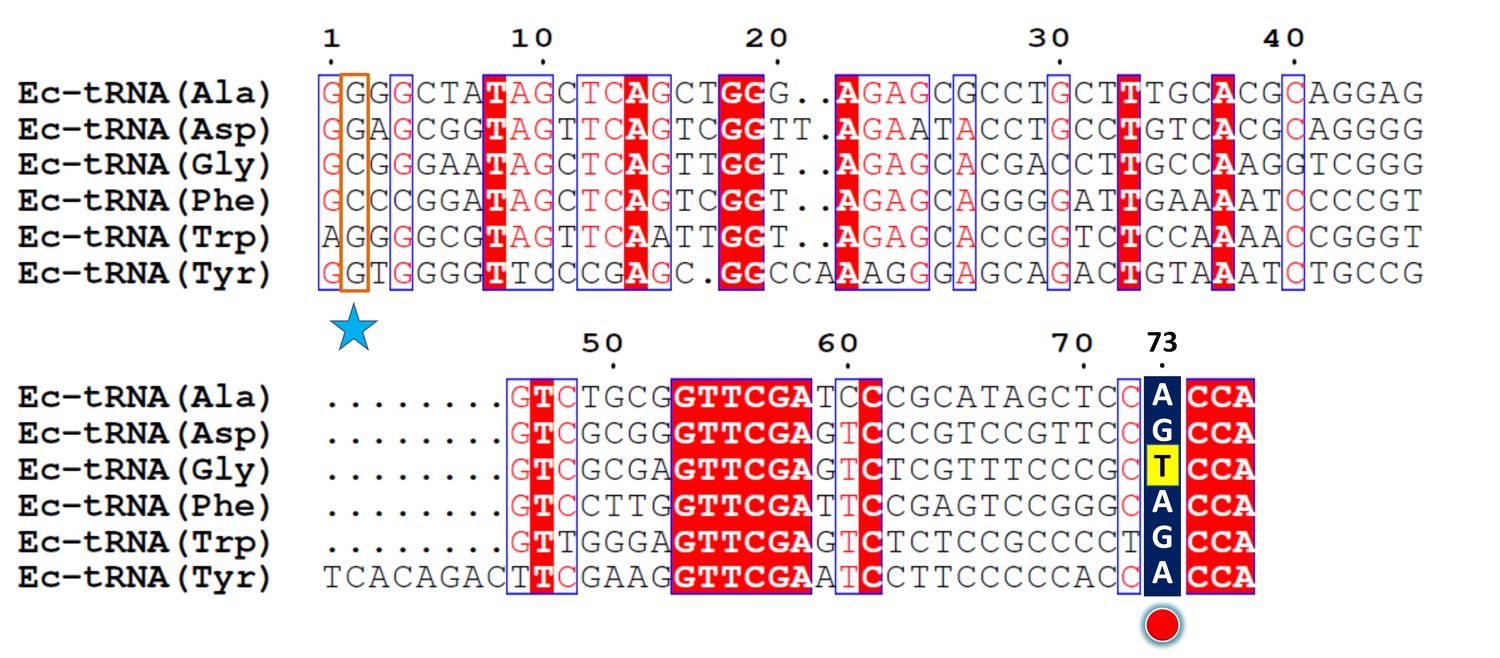
Multiple sequence alignment of a few E. coli tRNAs.
The second position is highlighted with a blue star while the discriminator base is marked with a red circle.
Figure 1—figure supplement 2
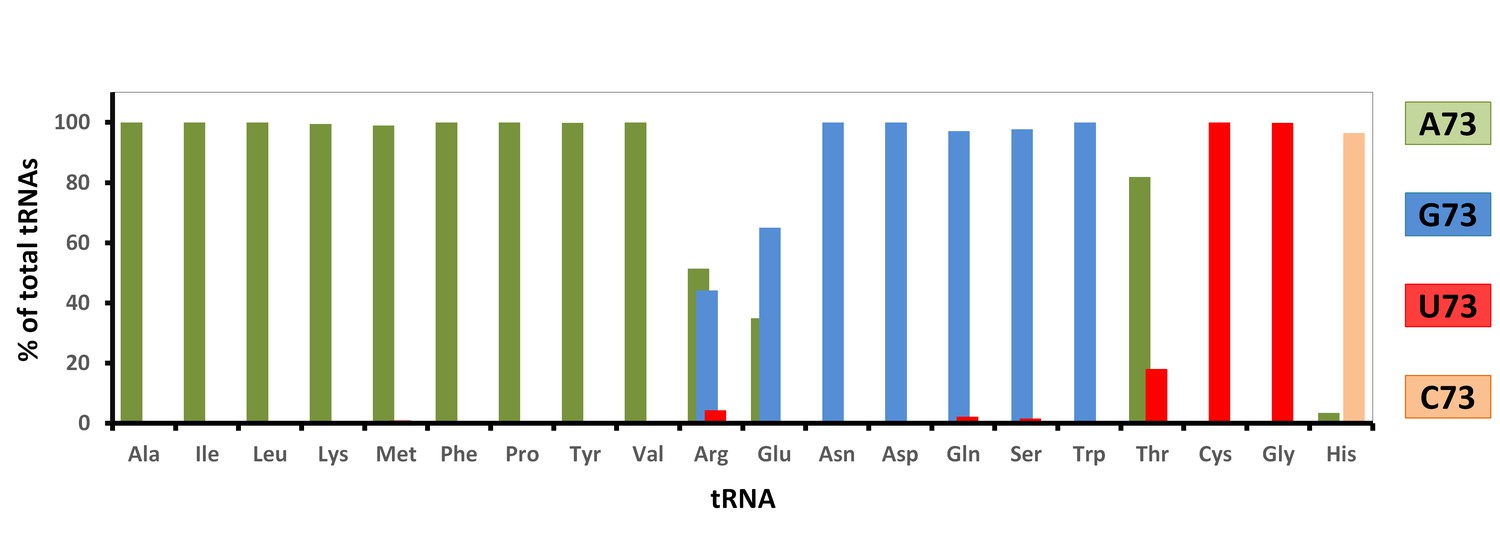
Graph showing percentage distribution of the discriminator base in all tRNAs across all bacteria.
https://doi.org/10.7554/eLife.38232.004
Figure 2
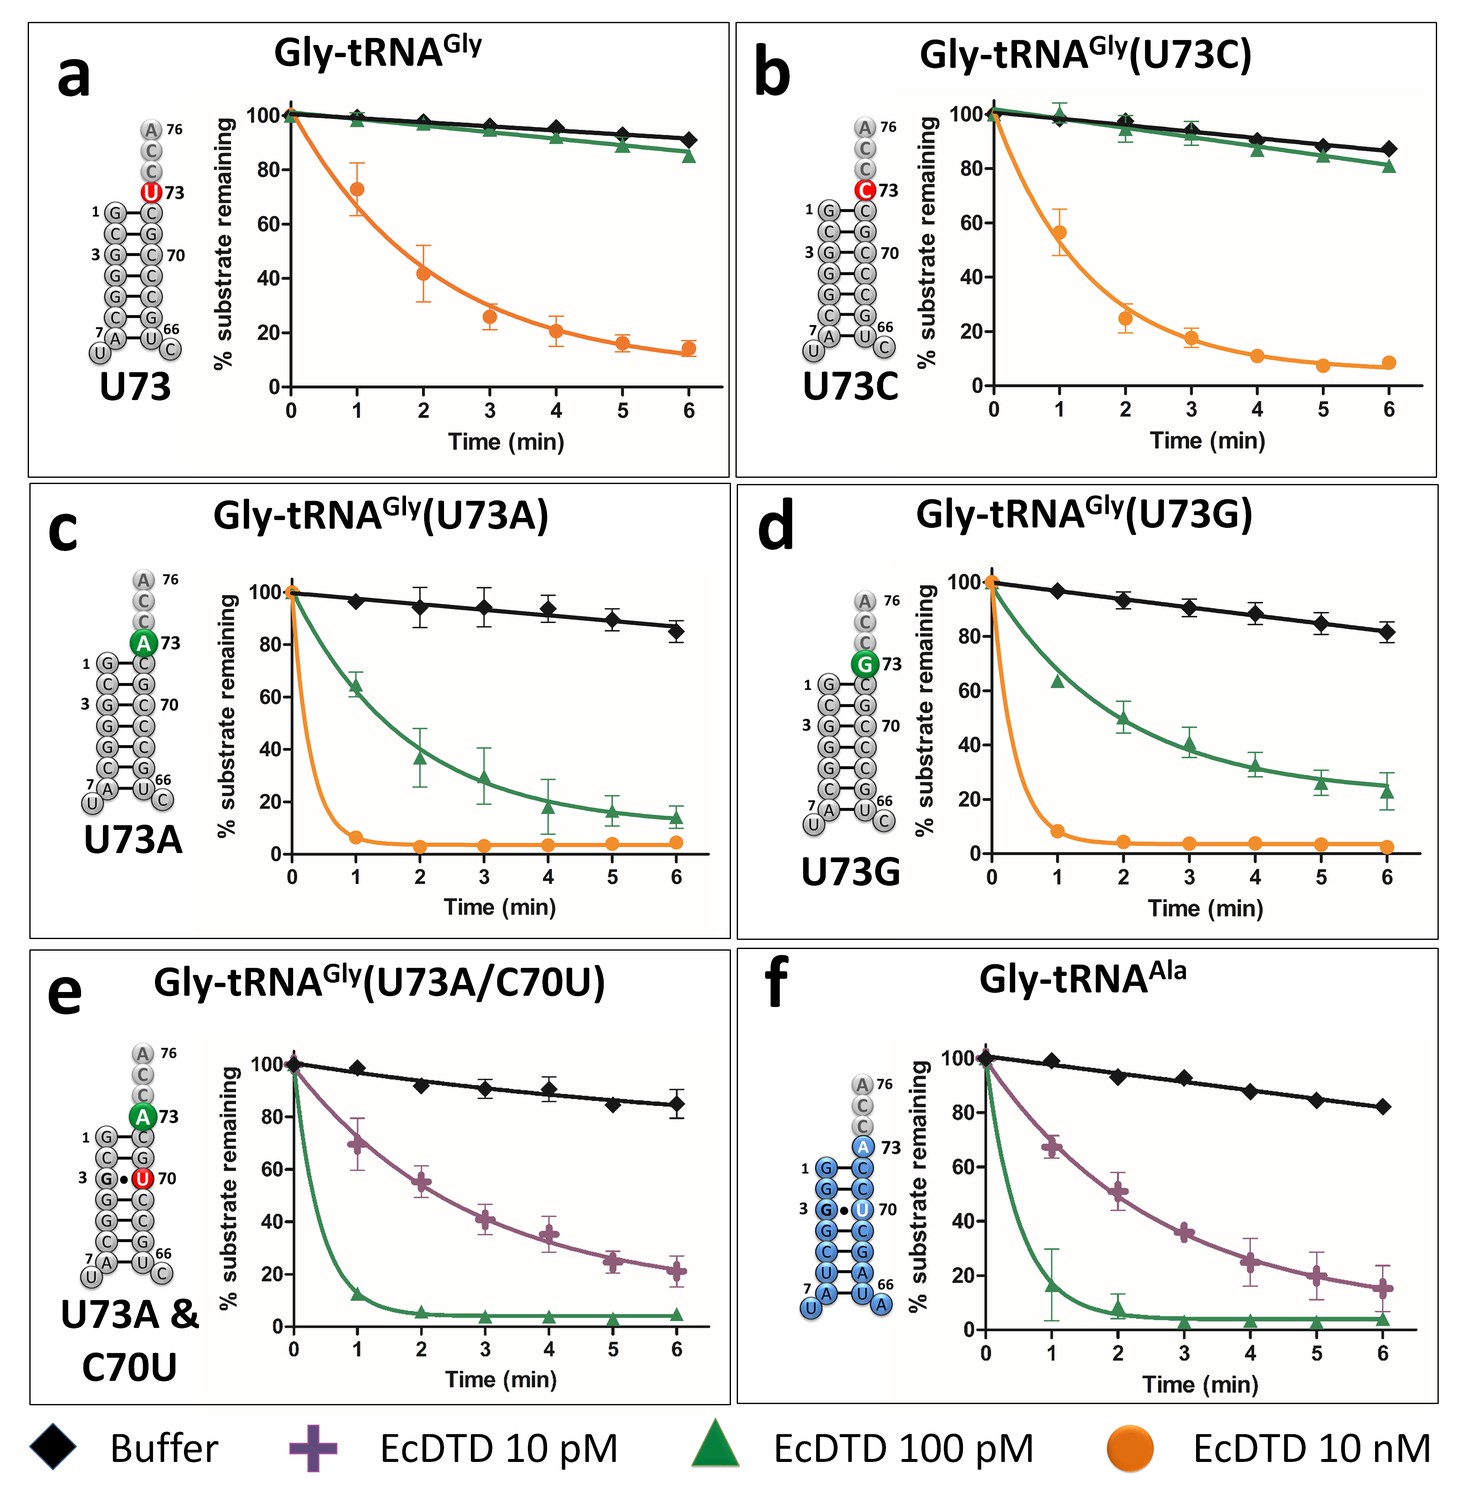
Discriminator base modulates DTD’s activity.
(a–e) Deacylation of Gly-tRNAGly and its mutants by various concentrations of EcDTD. (f) Deacylation of Gly-tRNAAla by various concentrations of EcDTD. Lines indicate exponential decay fits and error bars represent one standard deviation from the mean of at least three independent readings.
-
Figure 2—source data 1
Biochemical data for EcDTD deacylations with Gly-tRNAGly/Ala (wild type and mutants).
- https://doi.org/10.7554/eLife.38232.007
Figure 3 with 1 supplement
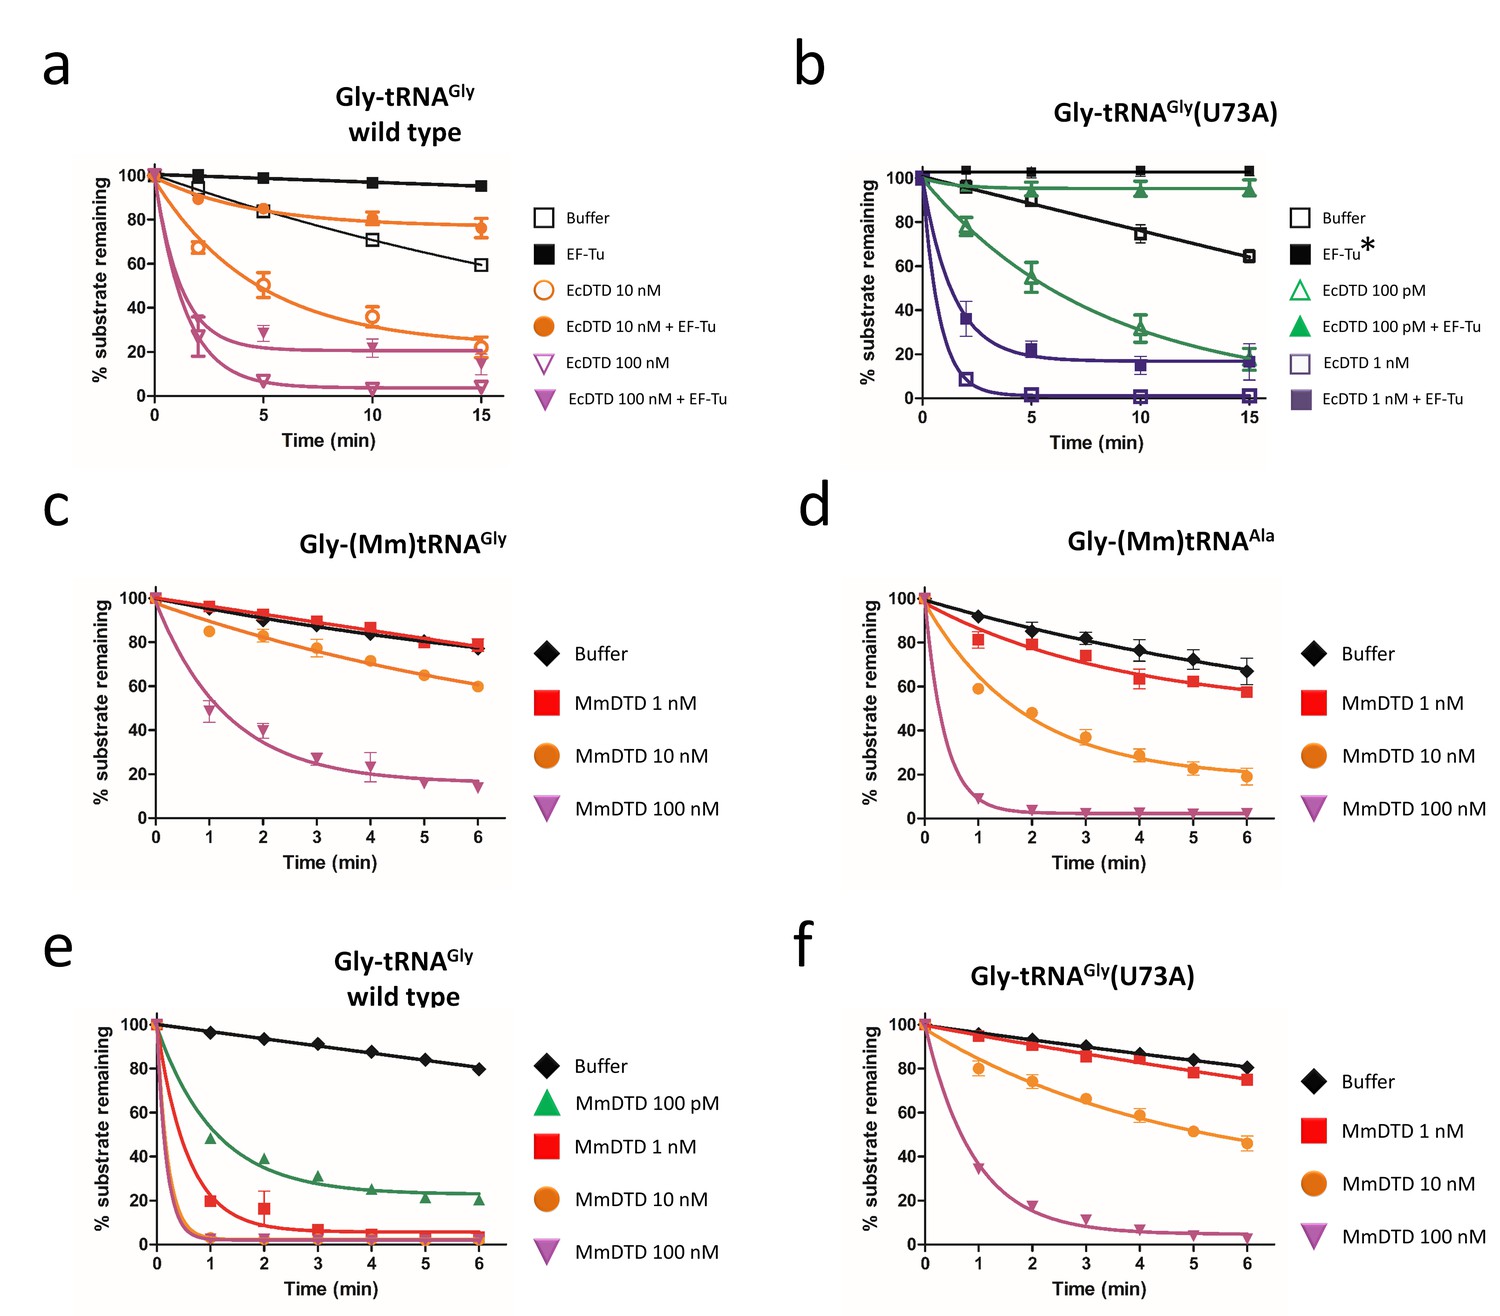
Discriminator base predominantly determines the fate of the substrate.
Deacylation of (a) Gly-tRNAGly and (b) Gly-tRNAGly(U73A) by EcDTD in the presence or absence of EF-Tu (* indicates the data points are connected through line). Deacylation of (c) Gly-(Mm)tRNAGly and (d) Gly-(Mm)tRNAAla by various concentrations of MmDTD. Deacylation of (e) Gly-tRNAGly and (f) Gly-tRNAGly(U73A) by various concentrations of MmDTD. Lines indicate exponential decay fit and error bars represent one standard deviation from the mean of at least three independent readings.
-
Figure 3—source data 1
Biochemical data for EF-Tu protection assays and MmDTD deacylations.
- https://doi.org/10.7554/eLife.38232.010
Figure 3—figure supplement 1
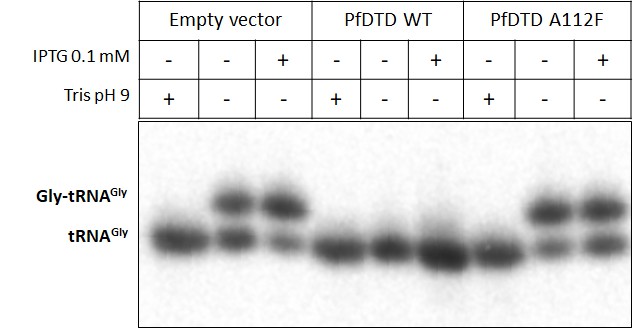
Northern blotting showing PfDTD overexpression using IPTG leads to depletion of Gly-tRNAGly while the inactive mutant of PfDTD (A112F) has no effect.
Tris pH nine is used as deacylation control.
Figure 4
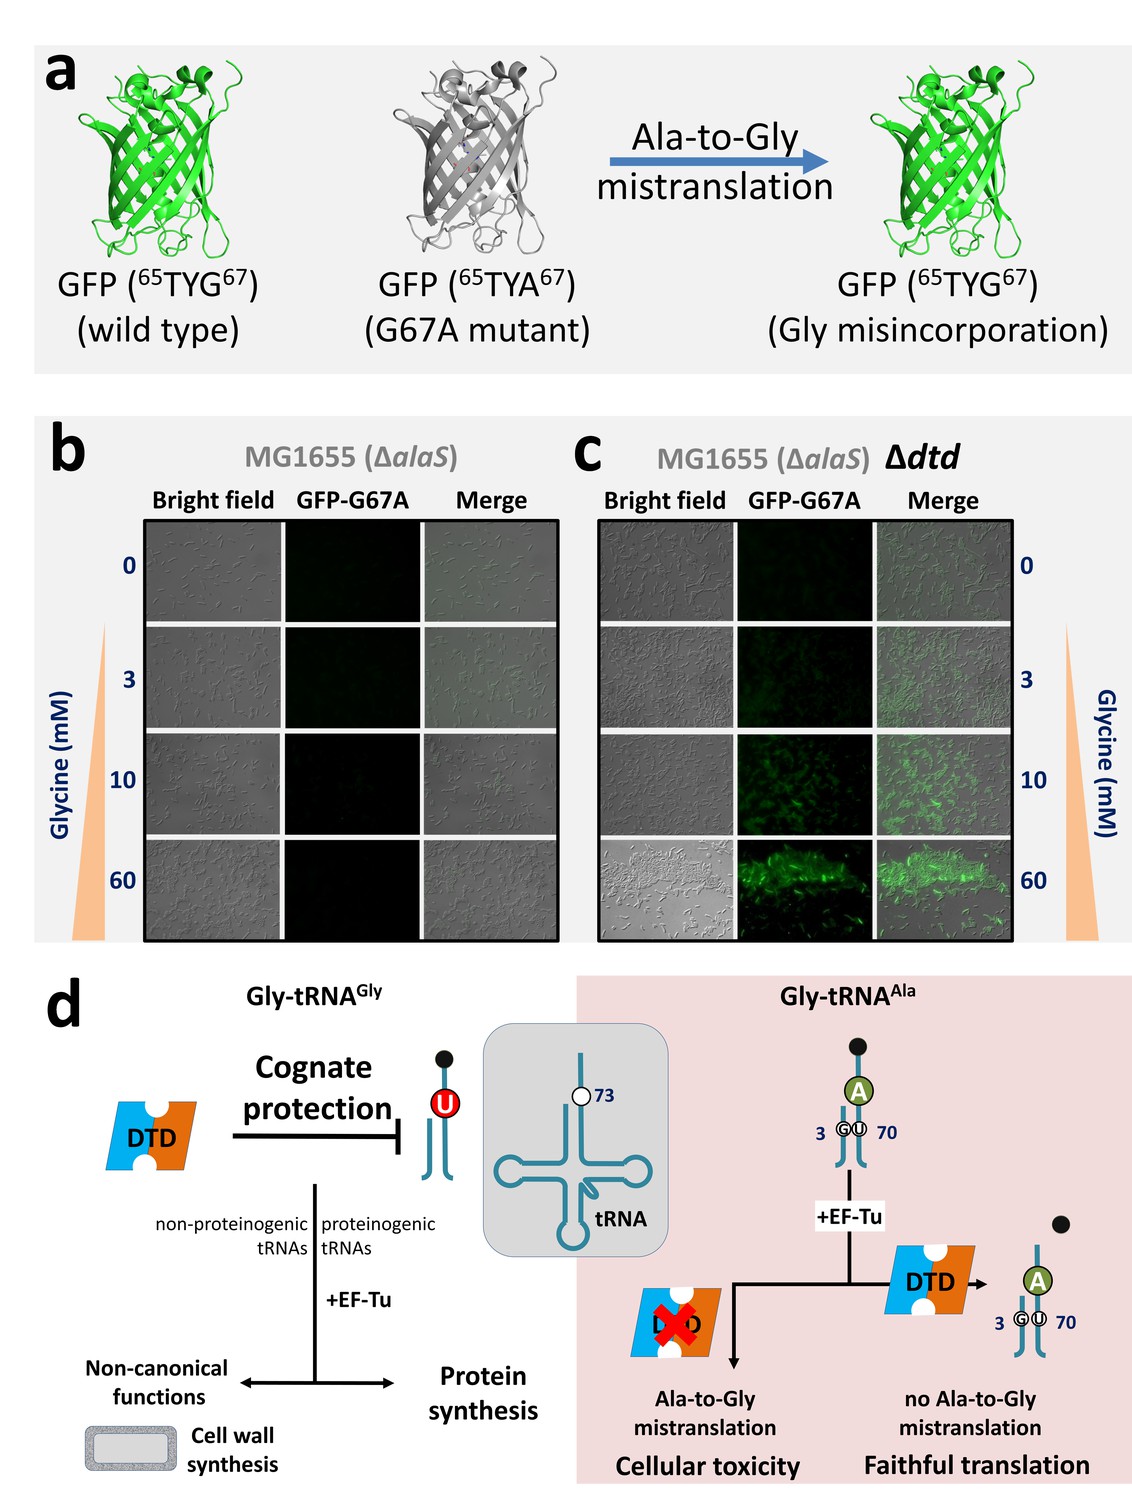
DTD avoids glycine misincorporation into proteins.
(a) GFP-based fluorescence reporter assay for visualizing alanine-to-glycine mistranslation, wherein the mutant GFP G67A (65TYA67) will fluoresce only when TYA is mistranslated to TYG. Microscopy images showing GFP fluorescence in E. coli at different concentrations of glycine supplementation (b) in the presence and (c) in the absence of DTD. The E. coli strain used is MG1655 with editing-defective AlaRS gene (i.e. ΔalaS) (Pawar et al., 2017). (d) Model showing N73 dichotomy in bacterial tRNAGly and tRNAAla, enabling protection of the cognate Gly-tRNAGly (both proteinogenic and non-proteinogenic) predominantly by U73, while effecting efficient removal of the non-cognate Gly-tRNAAla (having A73 and G3•U70) to prevent alanine-to-glycine mistranslation.
Tables
Table 1
Table showing the number of tRNAs having a particular discriminator base for all tRNAs across bacteria.
https://doi.org/10.7554/eLife.38232.005| tRNAX | A73 | G73 | C73 | U73 | Total |
|---|---|---|---|---|---|
| Ala | 136822 | 9 | 6 | 9 | 136846 |
| Ile | 61982 | 28 | 3 | 3 | 62016 |
| Leu | 259624 | 13 | 9 | 5 | 259651 |
| Lys | 123064 | 122 | 40 | 510 | 123736 |
| Met | 207181 | 12 | 253 | 1868 | 209314 |
| Phe | 68315 | 20 | 2 | 4 | 68341 |
| Pro | 110670 | 9 | 1 | 3 | 110683 |
| Tyr | 80595 | 5 | 6 | 50 | 80656 |
| Val | 187250 | 10 | 7 | 3 | 187270 |
| Arg | 119819 | 103052 | 32 | 10151 | 233054 |
| Glu | 29469 | 54764 | 8 | 46 | 84287 |
| Asn | 20 | 129816 | 6 | 41 | 129883 |
| Asp | 17 | 121556 | 1 | 3 | 121577 |
| Gln | 787 | 102405 | 6 | 2250 | 105448 |
| Ser | 1336 | 192697 | 6 | 3119 | 197158 |
| Trp | 5 | 54387 | 0 | 23 | 54415 |
| Thr | 131288 | 34 | 95 | 28854 | 160271 |
| Cys | 5 | 2 | 8 | 56956 | 56971 |
| Gly | 239 | 11 | 4 | 231855 | 232109 |
| His | 2004 | 4 | 56052 | 17 | 58077 |
| Total bacterial tRNAs: | 2,671,763 | ||||
Additional files
-
Transparent reporting form
- https://doi.org/10.7554/eLife.38232.012
Download links
A two-part list of links to download the article, or parts of the article, in various formats.
Downloads (link to download the article as PDF)
Open citations (links to open the citations from this article in various online reference manager services)
Cite this article (links to download the citations from this article in formats compatible with various reference manager tools)
A discriminator code–based DTD surveillance ensures faithful glycine delivery for protein biosynthesis in bacteria
eLife 7:e38232.
https://doi.org/10.7554/eLife.38232


