High N-glycan multiplicity is critical for neuronal adhesion and sensitizes the developing cerebellum to N-glycosylation defect
- Paris Descartes-Sorbonne Paris Cité University, France
- INSERM UMR 1163, France
- INSERM US24/CNRS UMS3633, France
- Key-Obs SAS, France
- University of Heidelberg, Germany
- CNRS, France
- Imagine Institute, France
- INSERM UMR1249, France
Figures
Figure 1 with 1 supplement

Deletion of Srd5a3 in the cerebellum impairs protein N-glycosylation and motor function.
(A) Far-WB with SNA lectin in P7 cerebellum and (B) quantification (n = 4 per genotype), p-value=0.29 (C) WB analysis of LAMP1 expression in mouse embryonic fibroblasts (MEFs). (D) WB analysis of LAMP1 level from P7 cerebellum and quantification (E). * indicates a PNGase sensitive LAMP1 isoform; **p-value=0.0032. (F) WB analysis as described in (D) but with increased electrophoretic migration and adjusted protein amounts to highlight LAMP1 hypoglycosylation in the mutant sample. (G) Box plot of the latency to fall during rotarod testing (n = 15 for each condition). One-way ANOVA was used for rotarod statistics. For all others, two-tailed student t-test was used. **p<0.01; ***p<0.001. Results are presented as mean ±s.d.
Figure 1—figure supplement 1
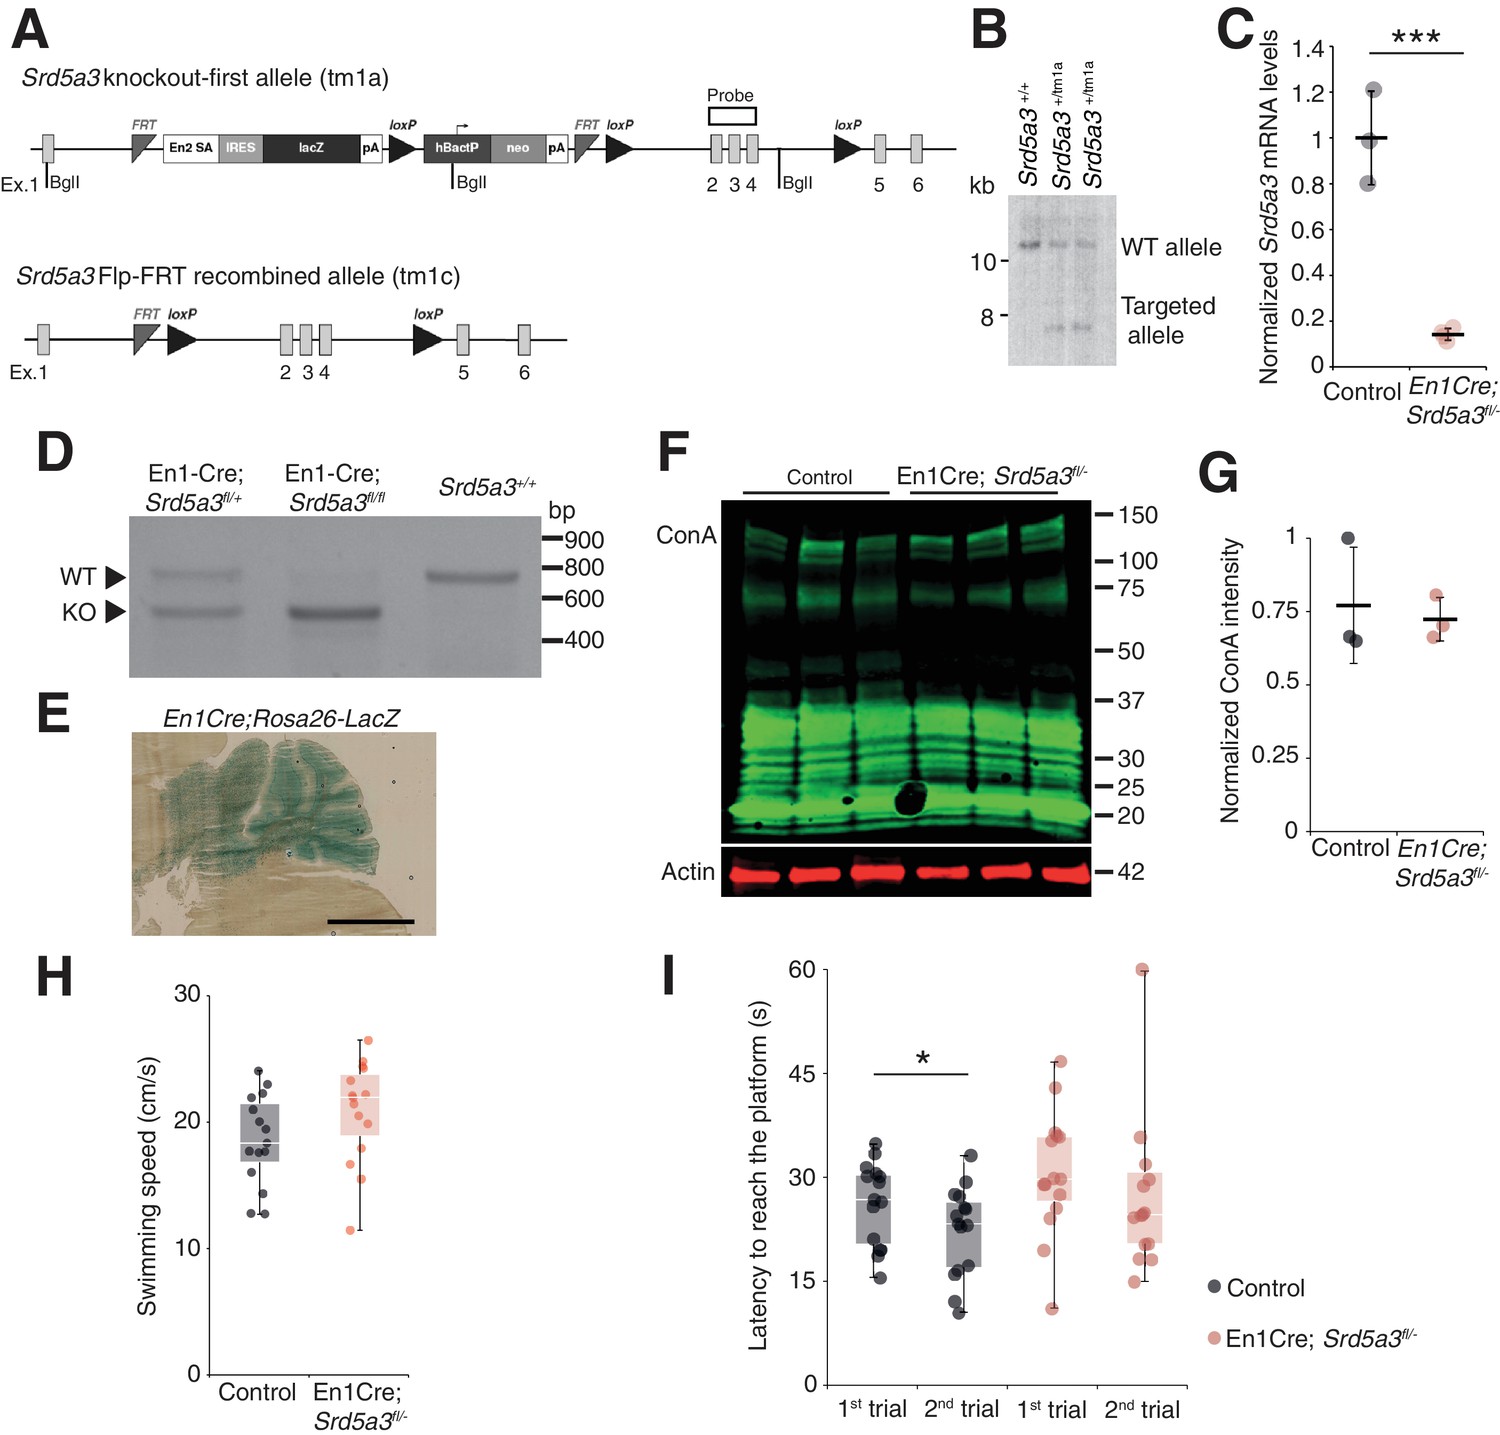
Generation of conditional Srd5a3 knockout mice and extended biochemical and behavioral analyses.
(A) Schematic of the Srd5a3 knockout-first allele (tm1a), the same allele after Flp-mediated recombination (tm1c) and (B) validation of the tm1a allele insertion by Southern blot. (C) RT-qPCR analysis of Srd5a3 expression levels in the P7 cerebellum (Control, n = 3; En1-Cre; Srd5a3fl/-, n = 4) (D) RT-PCR analysis of the recombined (KO) and wild-type (WT) Srd5a3 transcripts in the cerebellum. (E) LacZ staining image of the En1Cre; Rosa26 mouse showing Cre expression within the entire cerebellum. Scale bar 2 mm. (F) ConA far-WB and (G) quantification (t-test, p-value=0.7190; n = 3 for each genotype). (H) Average swimming speed during the Morris water maze test (MWM; n = 15 for each genotype). (I) MWM results. After two trials to find the same hidden platform (average of a total of eight sessions), only control mice significantly reduced the time to find the platform on the second trial (t-test, type I, p=0.0329). Unless indicated, two-tailed Student t-test was used for statistics. *p<0.05; ***p<0.001.
Figure 2 with 2 supplements
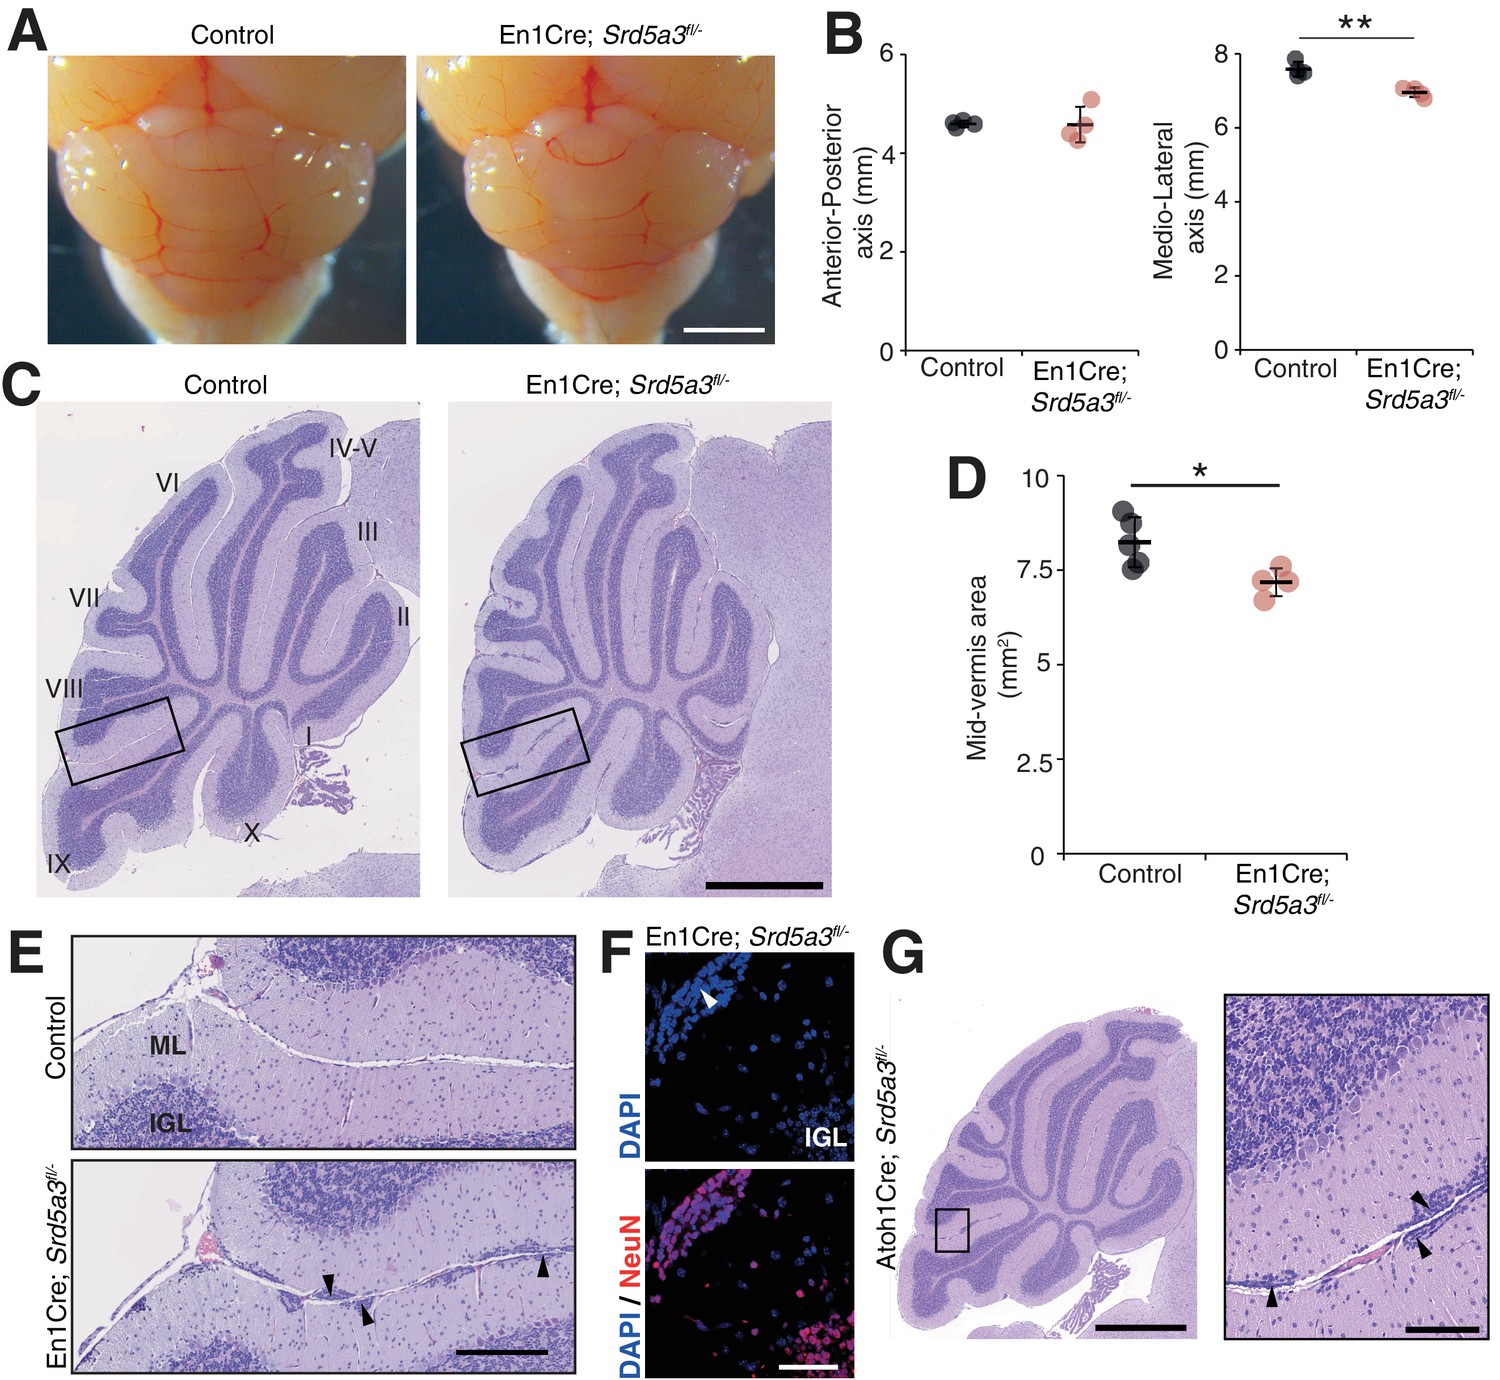
Reduced cerebellum size and ectopic granule neurons in the Srd5a3 mutant.
(A) Dorsal view of P21 posterior brains, scale bar 2 mm. (B) Quantification of the cerebellar anterior-posterior and medio-lateral axes (n = 4 for each genotype), **p-value=0.0018. (C) Representative images of hematoxylin-eosin (HE) stained P21 sagittal slices of control and mutant cerebella, scale bar 1 mm. Lobule numbers are indicated. (D) Quantification of the midline sagittal cerebellar area (Control, n = 5; En1-Cre; Srd5a3fl/-, n = 4); *p-value=0.0245. (E) Magnification of HE-stained cerebellar cortex, scale bar 200 μm. All examined mutants show ectopic cell clusters (arrow-head) in the outer part of the molecular layer (ML). (F) DAPI (blue) and NeuN (red) staining of P21 En1-Cre; Srd5a3fl/- cerebellum. Ectopic cells (arrow-head) are positive for the post-mitotic GCs marker NeuN, scale bar 50 μm. (G) Representative image of an HE-stained sagittal slice of Atoh1-Cre; Srd5a3fl/- cerebellum showing similar ectopic cells in the outer ML under GC-specific Srd5a3 deletion, scale bar 1 mm and 100 μm, respectively (n = 4). Two-tailed Student t-test was used for statistics. *p<0.05; **p<0.01. Results are presented as mean ± s.d.
Figure 2—figure supplement 1
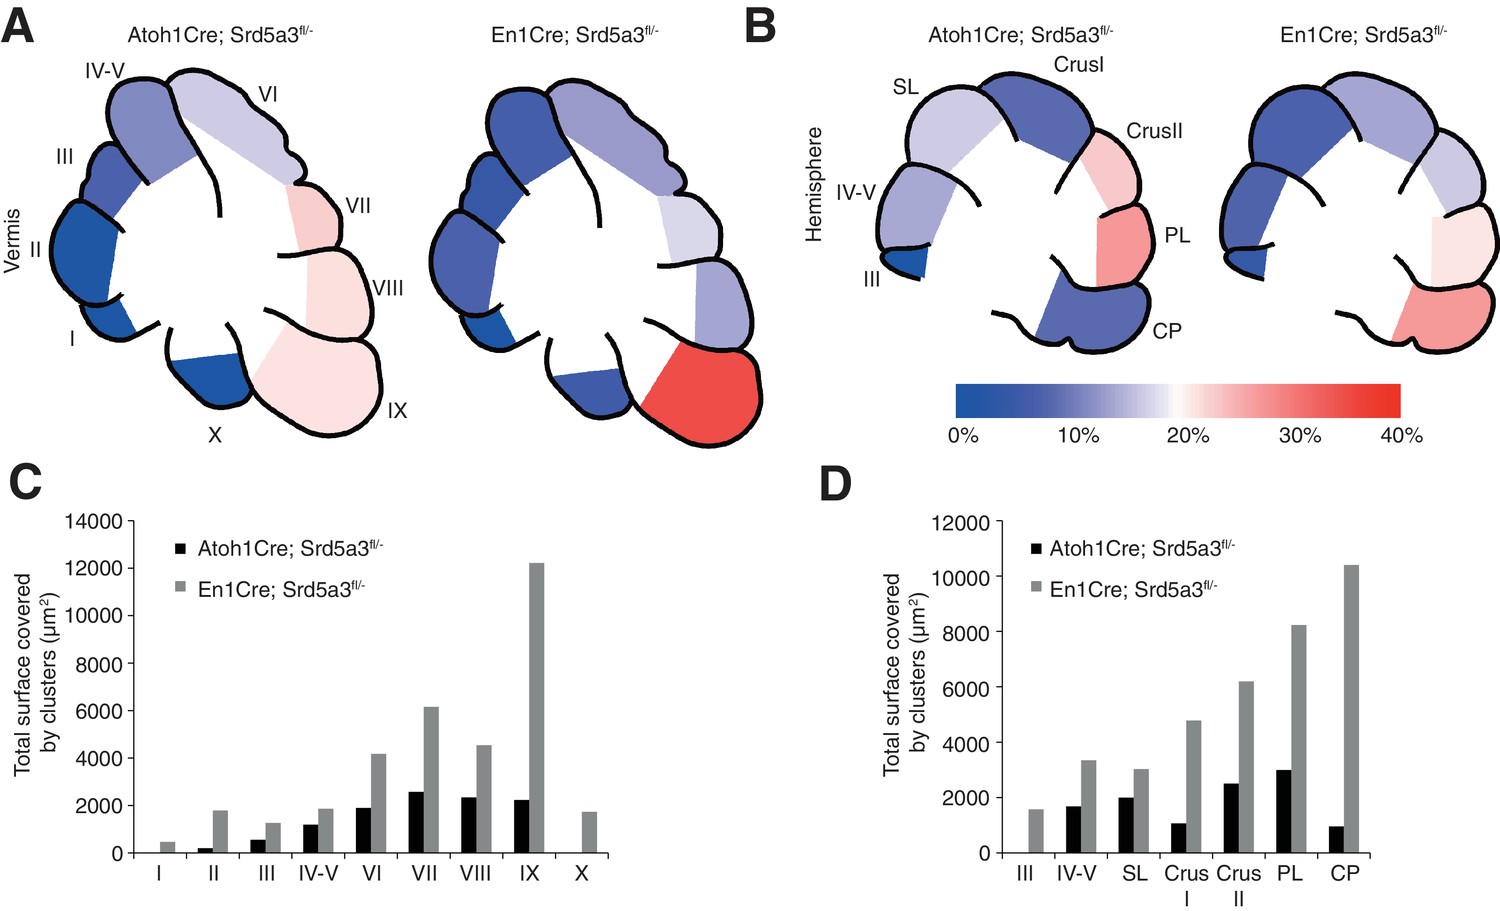
Cerebellar granule cell ectopias quantification.
(A) Graphical representation of the granule cells ectopias expressed as a percentage of ectopia surface per lobule at the level of the vermis and (B) the hemispheres for Atoh1-Cre and En1-Cre mice. (C) Quantification of the surface occupied by ectopic granule cell clusters per lobule at the vermis and (D) the hemispheres in both Atoh1-Cre and En1-Cre mice. Two mice were quantified per region and genotype. SL, Simple lobule; PL, Paramedian lobule; CP, Copula of the pyramidis.
Figure 2—figure supplement 2
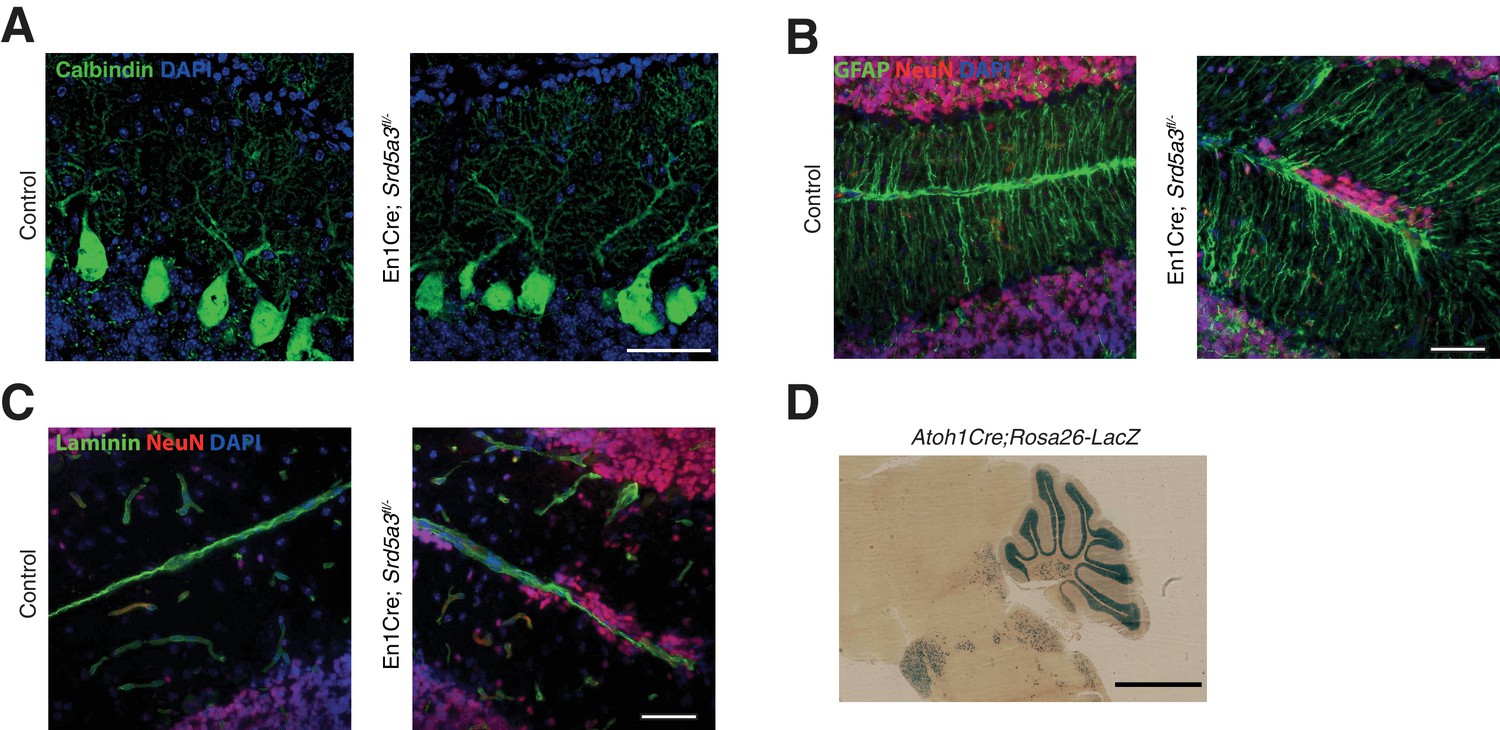
Histological analysis of Purkinje cells (PCs) and Bergmann glia (BG).
(A) Representative immunohistochemical staining of control and mutant PCs (Calbindin) at P14, (B) BG cells (GFAP) at P21 and (C) basal membrane (laminin) at P21. Scale bar 50 μm. (D) LacZ staining image of the Atoh1Cre; Rosa26-LacZ mouse. Scale bar 2 mm.
Figure 3 with 1 supplement
Disrupted neural pathways in the Srd5a3 mutant developing cerebellum.
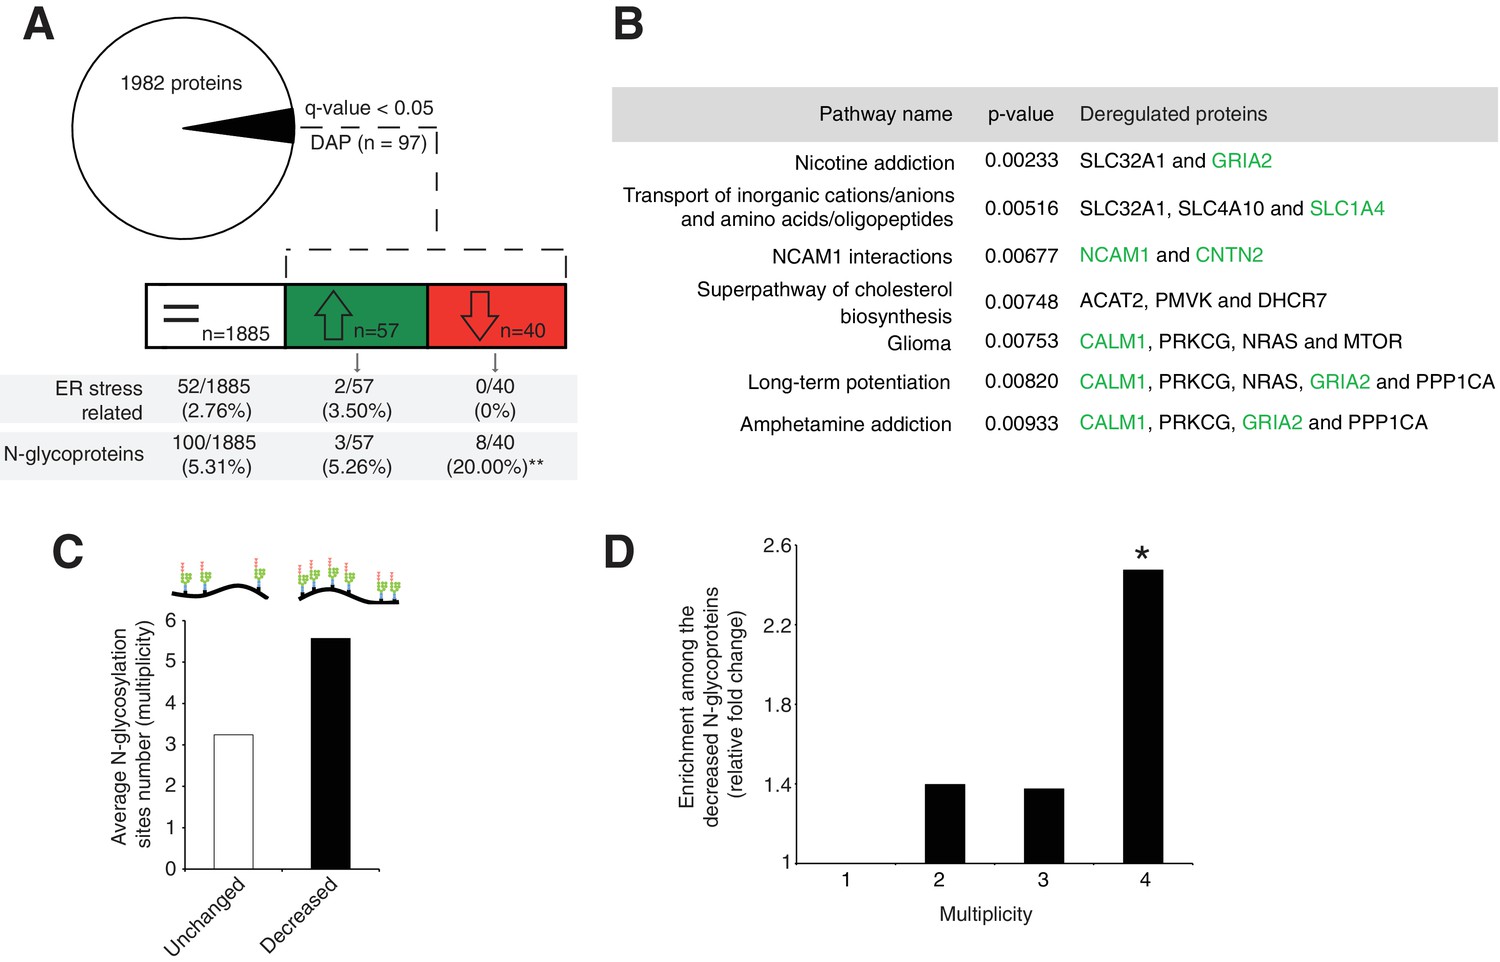
(A, upper panel) Pie chart representing the total proteomics analysis in P7 cerebellum (n = 4 for each genotype). 97 proteins were detected as differentially abundant proteins (DAP) in the mutant samples (q-value <0.05). (A, lower panel) Distribution of unchanged proteins (white box), increased DAP (green box) and decreased DAP (red box) into ER stress-related (GO:0034976) or N-glycoproteins (Reference glycoproteomic database, see Materials andmethod) categories. A significant enrichment was detected within the decreased DAP for N-glycoproteins (n = 8, Fisher exact test, p-value=0.0012). (B) Over-representation analysis on DAP performed with ConsensusPathDB using the 1982 detected proteins as background. All pathways with p-value<0.01 are represented. N-glycoproteins are indicated in green. (C) Average multiplicity in the unchanged and the decreased N-glycoproteins groups. (D) Enrichment for different glycoprotein categories among the decreased N-glycoproteins. Multiplicity represents groups of proteins with more than one (≥2), two (≥3) or three (≥4) N-glycosylation sites. Multiplicity of ≥1 represents all of the decreased N-glycoproteins and is set to one (no enrichment). There is a significant 2.4 fold-change enrichment for glycoproteins with four or more N-glycans among the decreased N-glycoproteins (Fischer exact test, p-value=0.0378).
Figure 3—figure supplement 1

Extended total proteomic analysis of the unfolded protein response (UPR).
(A) Principal component analysis (PCA) based on the abundance profiles of the 1982 detected proteins. (B) Transcriptomic analysis of UPR-related mRNAs in the control (n = 4) and mutant (n = 4) cerebellum. (C) Immunocytochemistry against BiP in MEFs treated with tunicamycin (Tm) for 24 hr to induce UPR activation and BiP over-expression (positive control) in mouse cells. Scale bar 25 μm. (D) Immunohistochemistry against BiP and NeuN in the P21 mouse cerebellum. The arrowhead points to ectopic GCs. Scale bar 50 μm. Student t-test was used for statistics. Results are presented as mean ± s.d.
Figure 4 with 1 supplement
Srd5a3 deletion impairs protein N-glycosylation in a sequon and multiplicity-dependent manner.
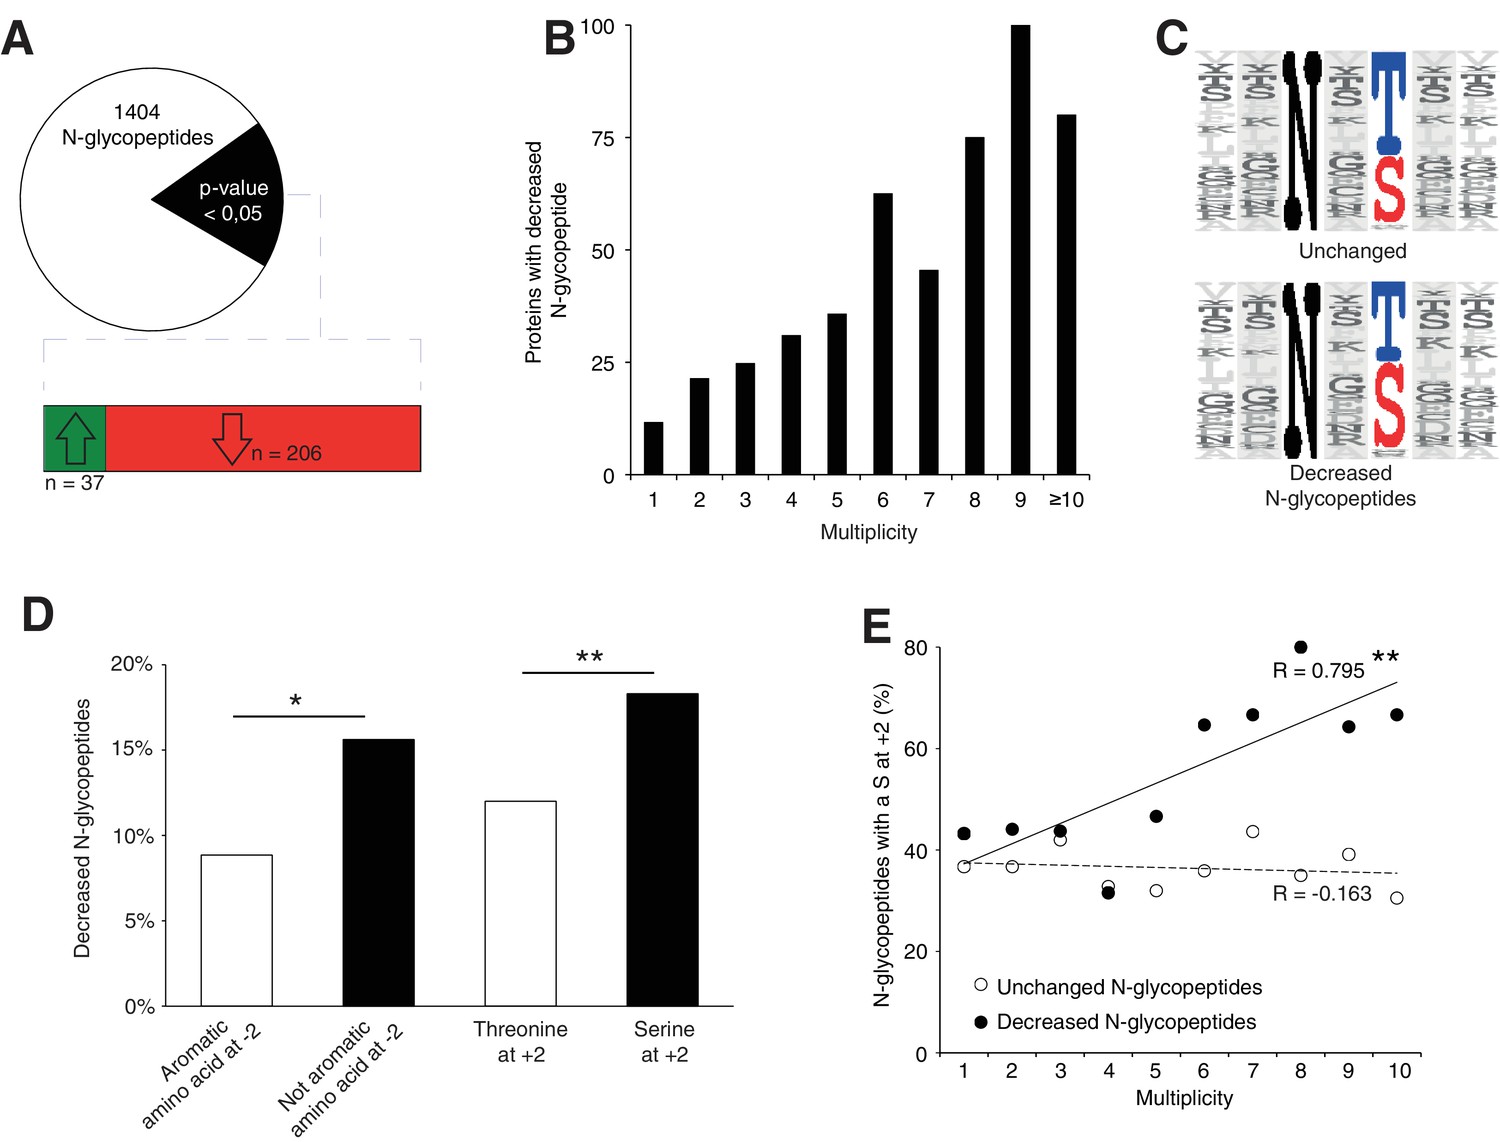
(A) Pie chart representation of the glycoproteomic analysis in P7 cerebellum (n = 4 for each genotype). The vast majority of the differentially abundant N-glycopeptides was decreased in the mutant samples (206/241, 85%). (B) Percentage of proteins with decreased N-glycopeptide according to their multiplicity (Mann-Whitney test, p-value<0.0001). Proteins with higher multiplicity are more likely to have decreased N-glycopeptide levels. (C) Motif analyses of the N-glycopeptides unchanged or decreased in the mutant. (D) Significant enrichment within the decreased N-glycopeptides for a non-aromatic amino acid (other than Phe, Tyr, His or Trp) in position −2 and a Ser in position +2 (NxS motif). (E) Correlation between protein multiplicity and their percentages of decreased (black) or unchanged (dashed line) glycopeptides with NxS sequon in the mutant samples. A significant positive correlation was found between the percentage of NxS-containing glycopeptides with decreased occupancy in the mutant and the N-glycoprotein multiplicity (Pearson’s coefficient, p-value=0.0062). NxS-containing N-glycopeptides are more likely to have decreased level when located in a highly glycosylated protein. Unless indicated, two-tailed Student t-test was used for statistics. *p<0.05; **p<0.01.
Figure 4—figure supplement 1
Extended glycoproteomic analysis results and validation.
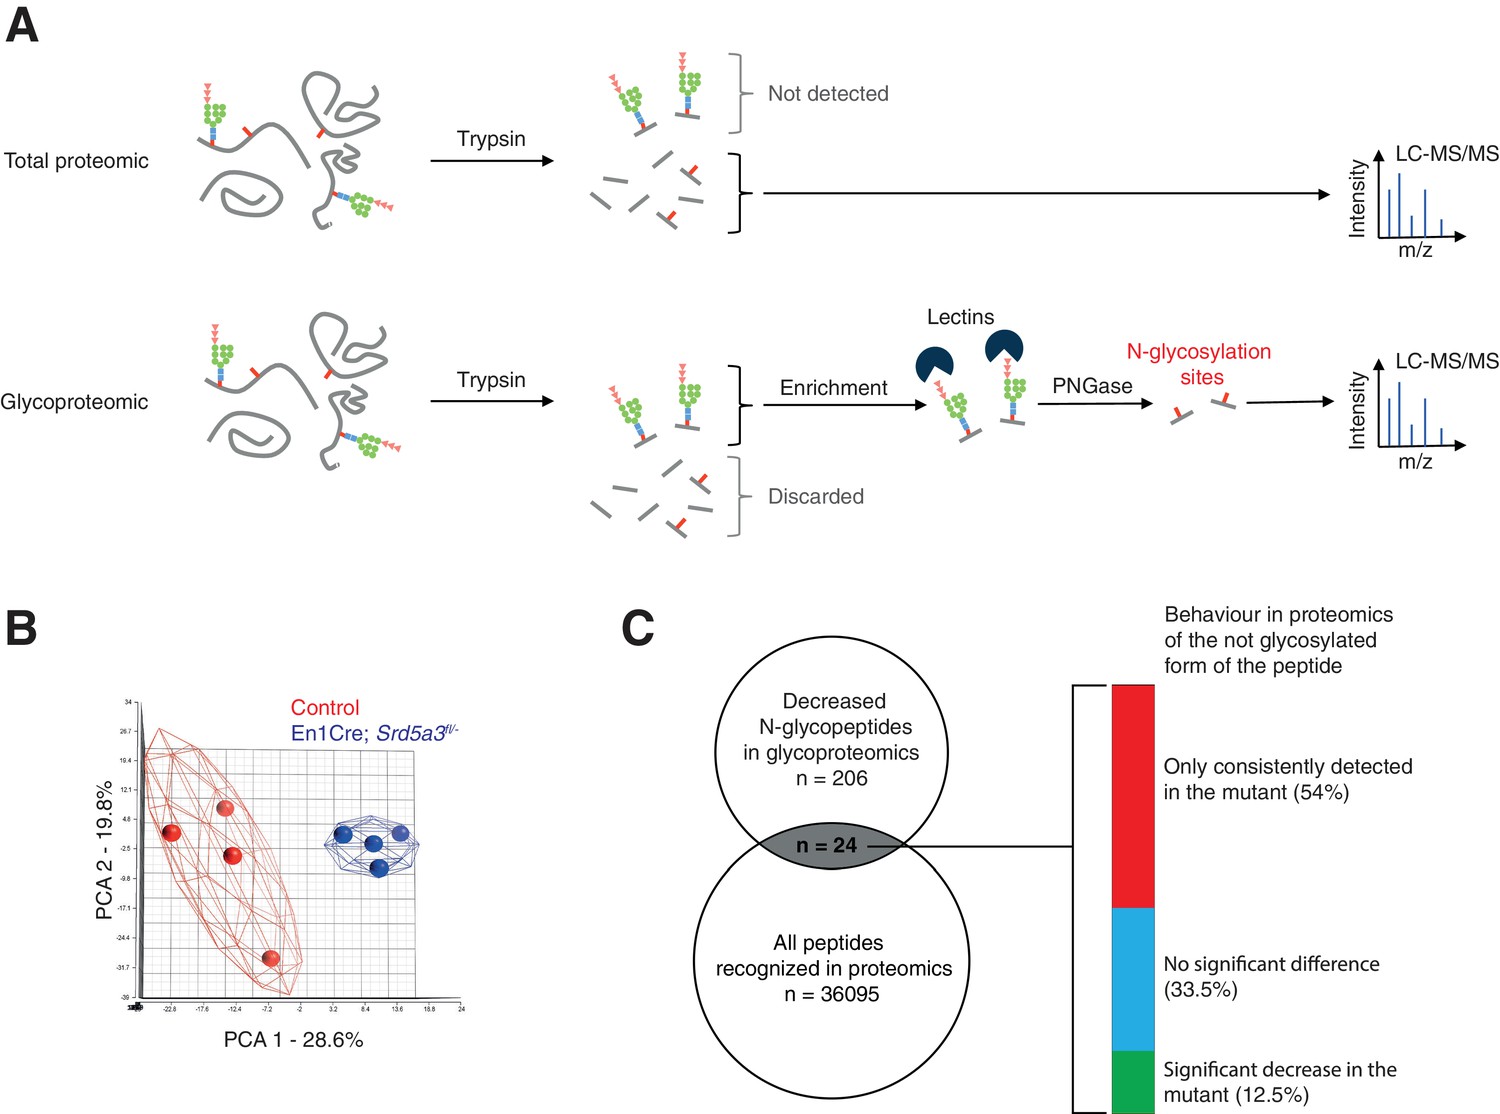
(A) Outline of the total proteomic and glycoproteomic techniques. In regular total proteomics, the proteins are digested into peptides by trypsin. Peptides containing an N-glycan chain cannot be recognized by LC-MS/MS due to consequent changes in ion charge and mass. Only the not glycosylated form of the peptide is recognized, if it exists. In glycoproteomics, only the N-glycosylated peptides will be retained (lectin enrichment). After PNGase treatment, the peptide is released are then analyzed by LC-MS/MS. (B) PCA based on the MS intensities of the 1404 N-glycopeptides consistently detected in control samples. (C) Qualitative behavior of N-glycopeptides with lower abundance in mutant samples (glycoproteomics analysis) and also detected in the total proteomics analysis. Total proteomics analysis detected most of the peptides (54%) in mutant samples only, a result consistent with constant glycosylation site occupancy in controls and hypoglycosylation in mutants.
Figure 5 with 2 supplements
IgSF-CAMs are especially sensitive to a mild N-glycosylation impairment.
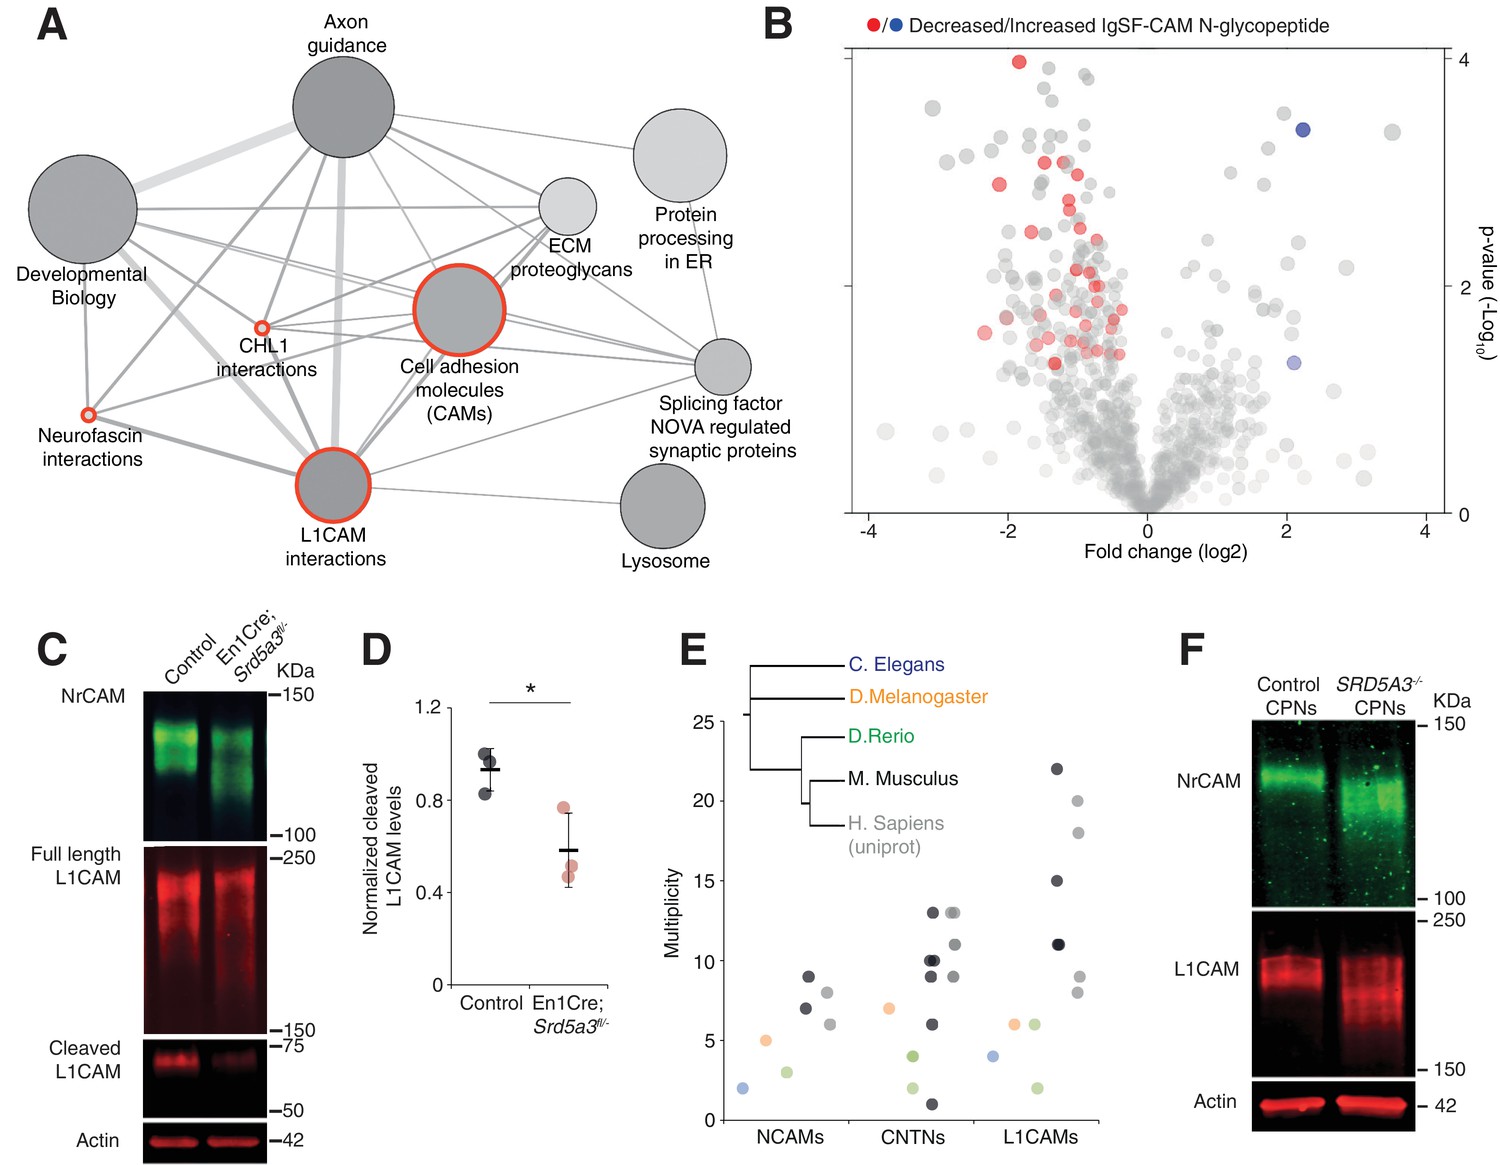
(A) Graphical representation of enriched pathways and their interactions within proteins with reduced N-glycopeptide in the mutant (ConsensusPathDB). The nodes size indicates the number of proteins within the pathway, and their shade notes the significance (the darkest, the more significantly enriched). Red circles enclose the L1CAM family-related pathways. (B) Volcano plot against all N-glycopeptides. The decreased (red) or increased (blue) N-glycopeptides belonging to an IgSF-CAM protein are highlighted. There is enrichment for IgSF-CAMs glycopeptides within the decreased ones (Fisher exact test, p-value=0.0058). (C) WB against L1CAM and NrCAM in the P7 mouse cerebellum and (D) quantification of the 70 kDa cleaved isoform of L1CAM (n = 3 for each genotype, p-value=0.0312). (E) Multiplicity per protein of three IgSF-CAMs subfamilies (L1CAMs, CNTNs and NCAMs) in different species. Multiplicity information was collected from experimental datasets (Zielinska et al., 2010) and (Zielinska et al., 2012) except for human information extracted from uniprot database. (F) WB analysis of L1CAM and NrCAM levels in CPNs (n = 2 per genotype, repeated twice). Unless indicated, two-tailed Student t-test was used for statistics. Results are presented as mean ±s.d. *p<0.05.
Figure 5—figure supplement 1

Schematic representation of the mouse L1CAM and NrCAM with their hypoglycosylated sites.
The changes in the glycosylation status are based on glycoproteomic (GP) or total proteomic (TP) results. N-glycosylation sites experimentally validated elsewhere (Zielinska et al., 2010) are also represented.
Figure 5—figure supplement 2
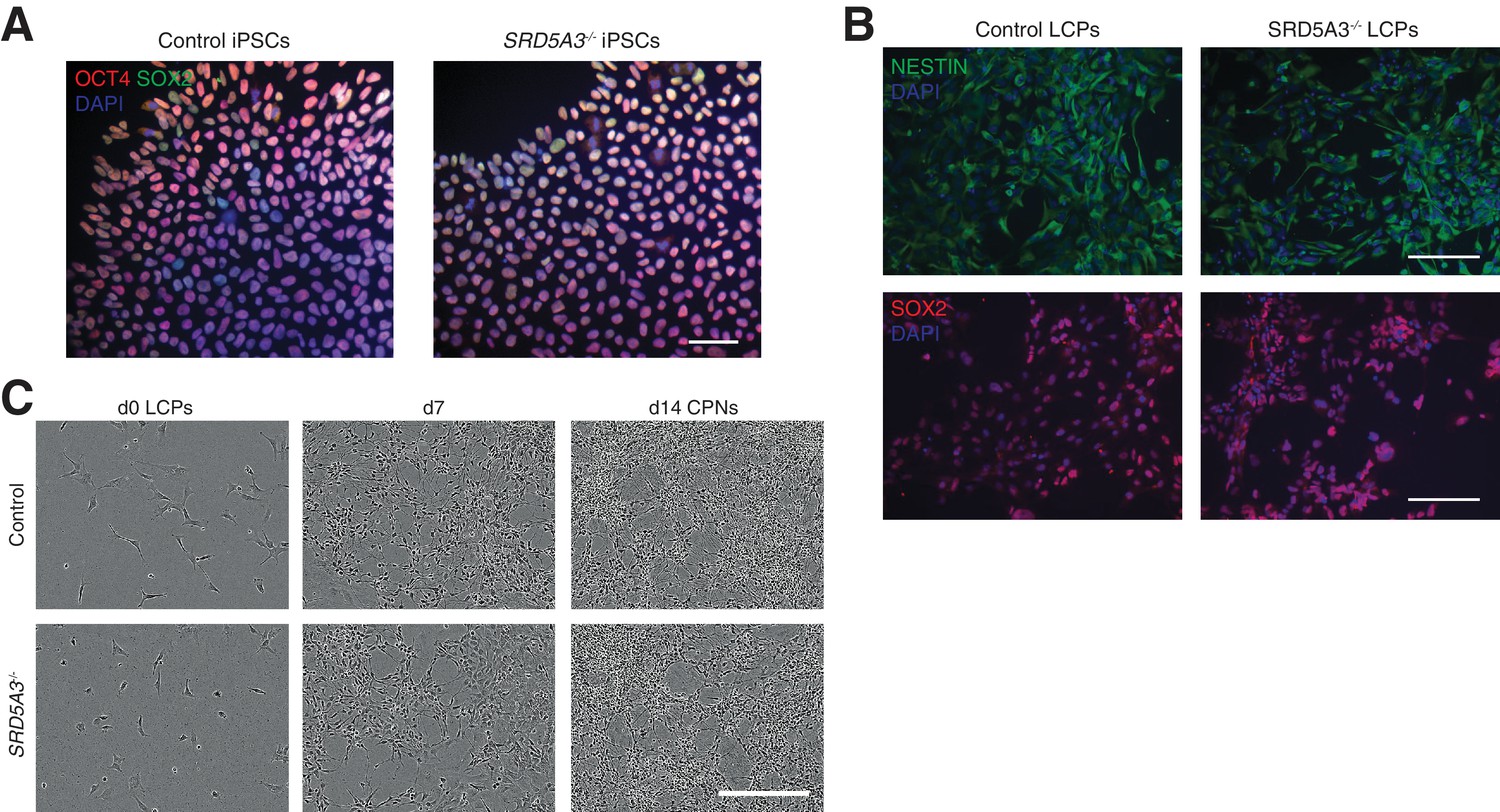
hiPSCs differentiation towards human cortical projection neurons (CPNs).
(A) hiPSCs stained for the pluripotency markers SOX2 and OCT4. (B) hiPSCs differentiated towards late cortical progenitors (LCPs, see Materials and methods) and stained against Nestin and SOX2. Scale bar 100 μm. (C) Representative images of control and SRD5A3-/- LCPs differentiation towards cortical projection neurons (CPNs, see Materials and methods). Scale bar 300 μm.
Figure 6
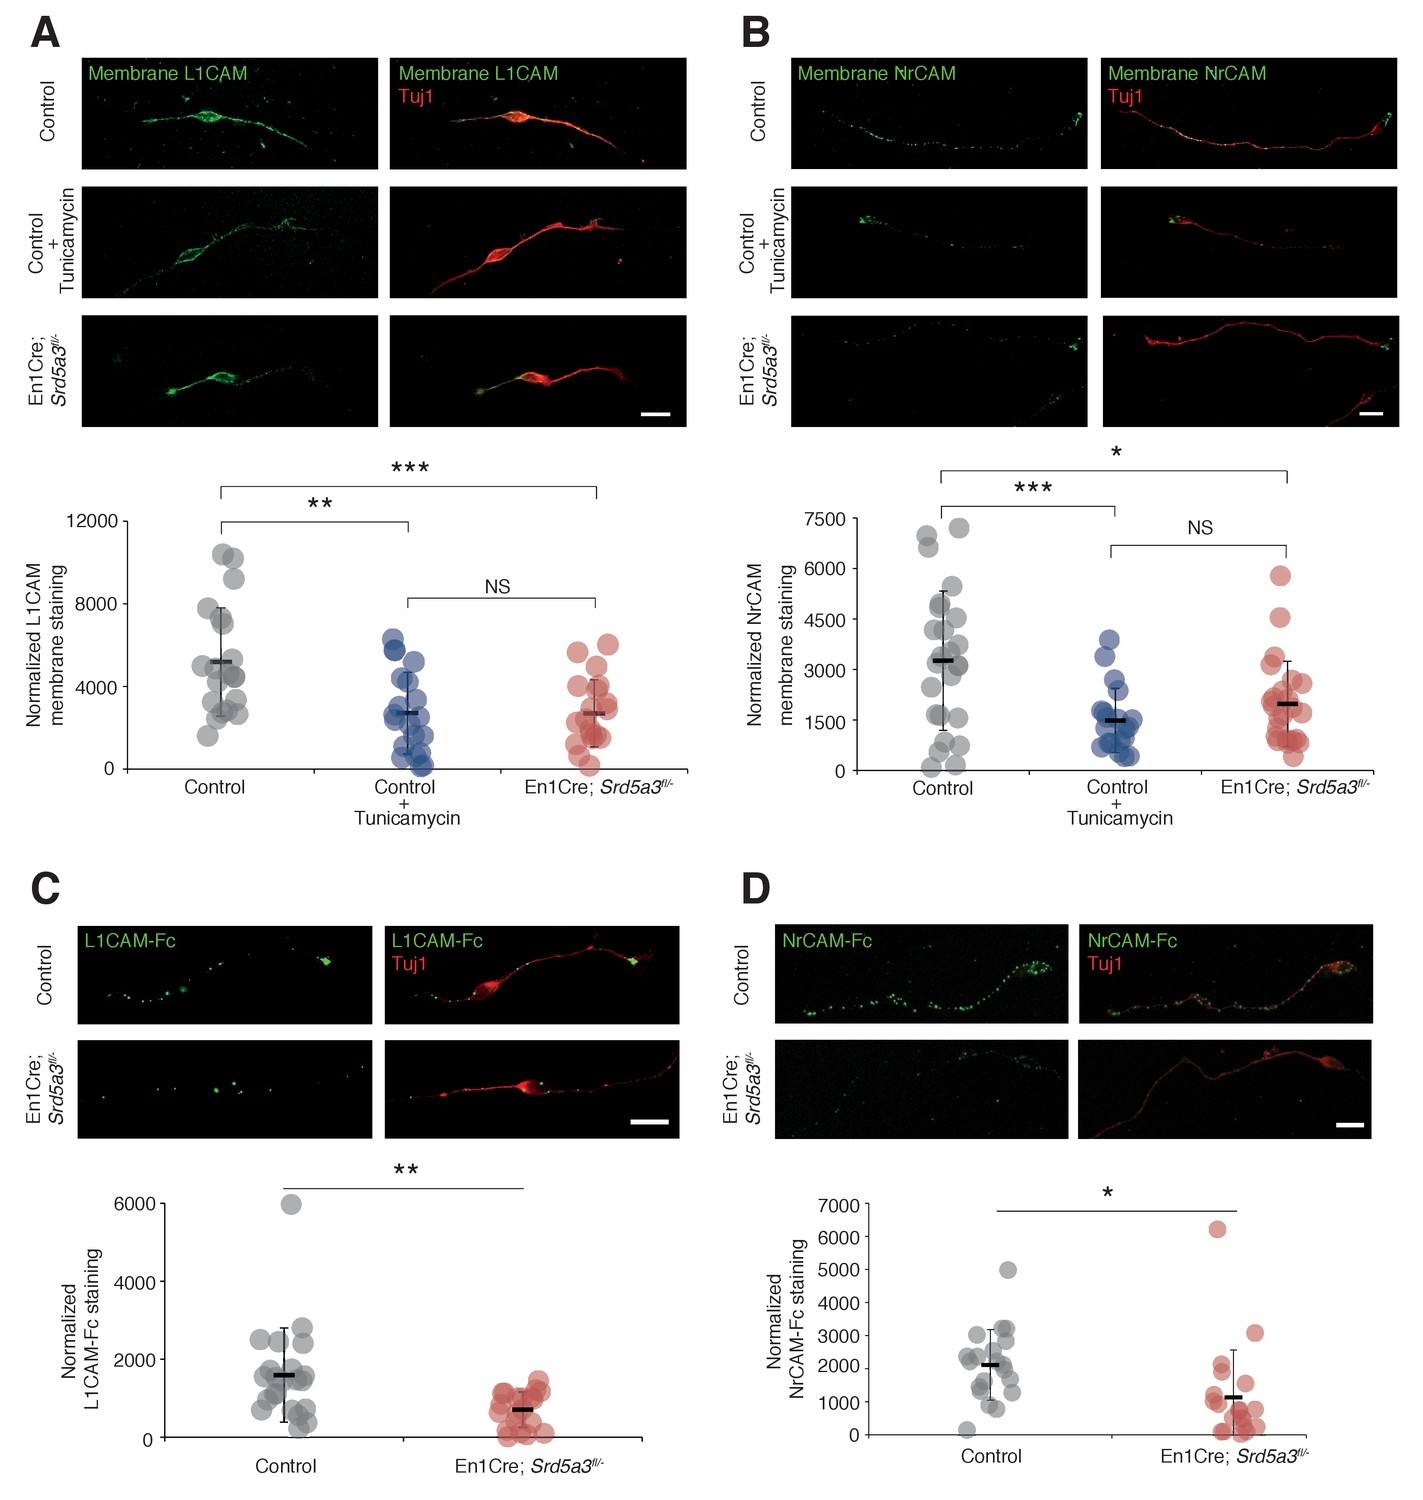
L1CAM and NrCAM hypoglycosylation affects their cell surface expression and binding activity.
(A) L1CAM and (B) NrCAM surface immunostaining of cultured GCs and quantification. (C) L1CAM-Fc and (D) NrCAM-Fc binding assay on cultured GCs. The cells were incubated with the recombinant proteins and bound L1CAM-Fc or NrCAM-Fc were visualized with anti-Fc antibody. All of the staining and quantifications were performed with at least three biological replicates from different litters. Each dot represents a single neuron. Scale bar 10 μm. Results are presented as mean (black line)±s.d.
Figure 7 with 1 supplement

IgSF-CAM-dependent neurite dynamic and axon orientation defects in Srd5a3 mutant cerebellum.
(A) Neurite number per GC body cluster across 21 hr in laminin and poly-D-lysine-coated wells as measured with Incucyte live cell imaging system (Control, n = 3; En1-Cre; Srd5a3fl/-, n = 3). (B) Representative image of control and En1-Cre; Srd5a3fl/- GCs after 21 hr in laminin and poly-D-lysine-coated wells. Scale bar 100 μm. (C) Neurite number normalized to GC body clusters after 21 hr with laminin/poly-D-lysine coatings, fibronectin or IgSF-CAMs-coated wells (NrCAM and L1CAM). Each dot per coating represents results from a single mutant mouse. All GC cultures were performed in technical triplicates (Control, n = 3; En1-Cre; Srd5a3fl/-, n = 3). (D) Neurite number and number of migrating neurons in GC re-aggregates plated for 24 hr on laminin and poly-D-lysine and (E) L1CAM coated surfaces. Five aggregates were quantified per mouse and coating condition (Control n = 5, En1Cre; Srd5a3fl/-, n = 7). (F) Representative electron microscopy images of cerebellar ML sagittal view at P21 taken from control (n = 3) and Srd5a3 mutant (En1-Cre; Srd5a3fl/- n = 1; Atoh1-Cre; Srd5a3fl/- n = 2) mice. Scale bar 2 μm. Parallel fibers show a single orientation in control ML, whereas some exhibit an abnormal perpendicular orientation in the most outer ML in the mutant mice (G, red arrowhead). Two-tailed Student t-test was used for statistics. *p<0.05; **p<0.01. Results are presented as mean ± s.d.
Figure 7—figure supplement 1
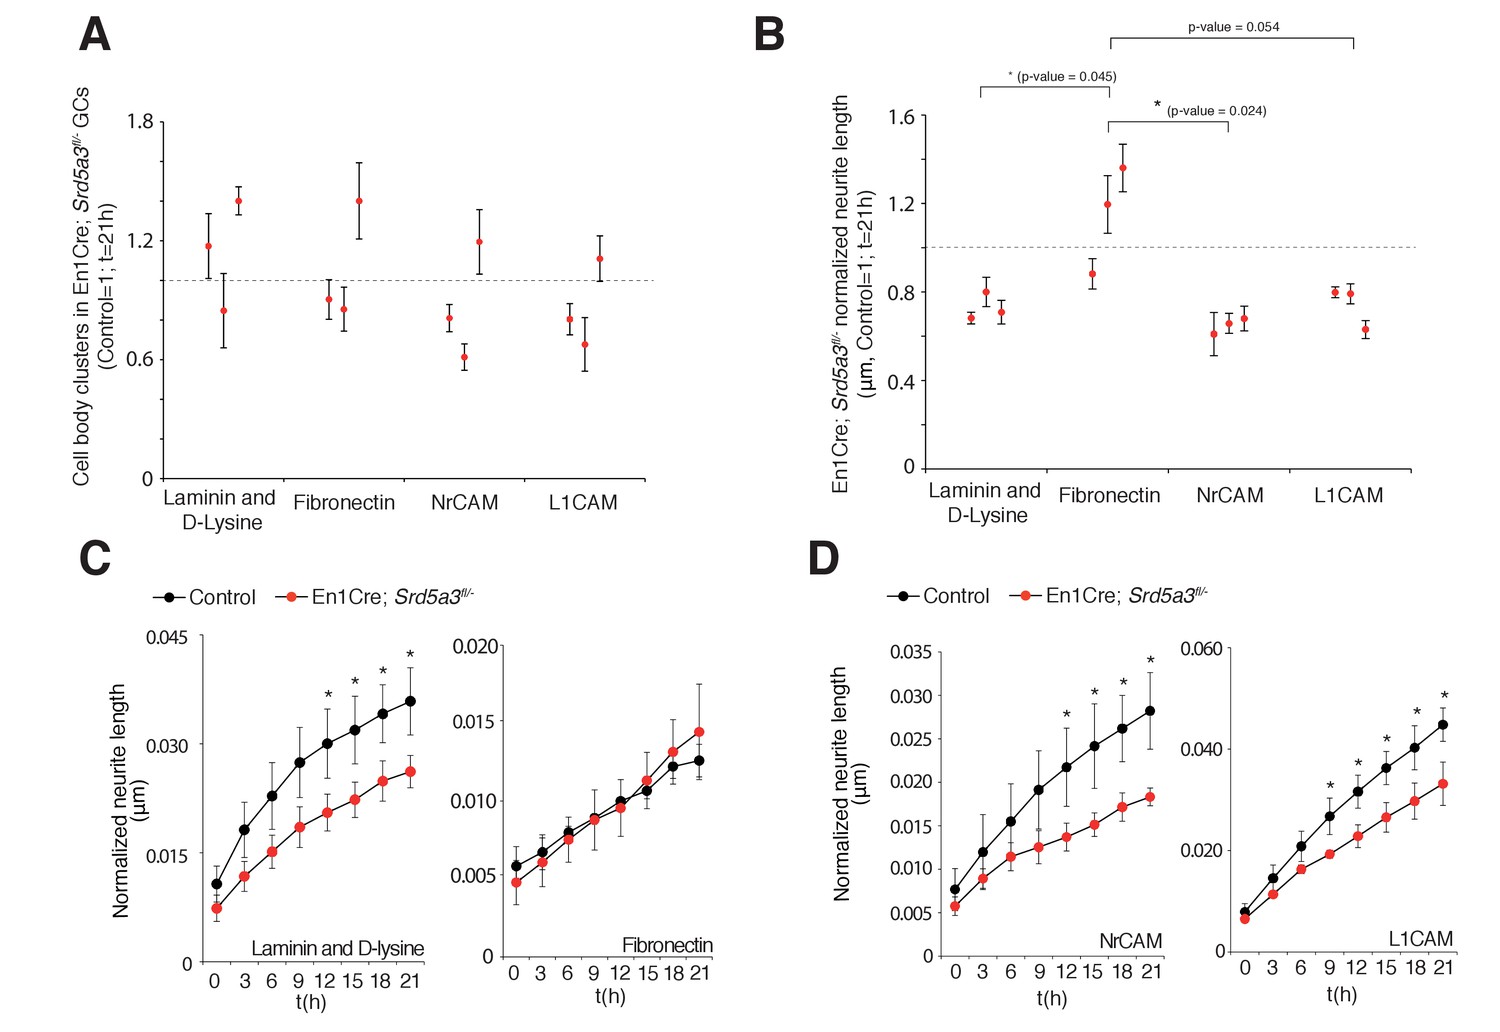
Changes in granule cell (GC) number and neurite length under different coating conditions.
(A) GC body cluster number after 21 hr using different coatings and normalized to control littermates. (B) Neurite length in mutant GCs normalized to GC body cluster number after 21 hr. Each dot per coating represents results from a single mutant mouse. All GC cultures were performed in technical triplicates (n = 3 for each genotype). Student t-test was used for statistics. (C) Normalized neurite length of GCs under different coating conditions, laminin and polyD-lysine or fibronectin, and (D) L1CAM and NrCAM coating. *p<0.05. Results are presented as mean ± s.d.
Tables
Key resources table
| Reagent type (species) or resource | Designation | Source or reference | Identifiers | Additional information |
|---|---|---|---|---|
| Genetic reagent (M. musculus) | ACTB:FLPe B6J | JAX stock #005703 | ACTB:FLPe B6J | |
| Genetic reagent (M. musculus) | Atoh1-Cre | JAX stock #011104 | Tg(Atoh1-cre)1Bfri | |
| Genetic reagent (M. musculus) | CAG-Cre | JAX stock #004682 | B6.Cg-Tg(CAG-cre/Esr1*)5Amc/J | |
| Genetic reagent (M. musculus) | CMV-Cre | PMID: 7624356 | En1tm2(cre)Wrst | |
| Genetic reagent (M. musculus) | En1-Cre | JAX stock #007916 | En1tm2(cre)Wrst | |
| Genetic reagent (M. musculus) | R26RLacZ | PMID: 25594525 | ||
| Genetic reagent (M. musculus) | Srd5a3Floxed | IMPC - ES cell clone EPD0575_2_F01 carrying the Srd5a3tm1a(EUCOMM)Wtsi allele | Srd5a3tm1a(EUCOMM)Wtsi | |
| Antibody | BiP | Enzo | ADI-SPA-826 | 1:50 |
| Antibody | Calbindin | Swant | CB-38A | 1:10.000 |
| Antibody | GFAP | Millipore | AB5804; RRID:AB_2109645 | 1:1.000 |
| Antibody | L1CAM | Abcam | AB24345; RRID:AB_448025 | 1:2.000 |
| Antibody | L1CAM | Appel et al. (1995) | 557.B6 | Membrane staining |
| Antibody | Laminin | Sigma | L9393; RRID:AB_477163 | 1:33 |
| Antibody | LAMP1 | Abcam | AB24170; RRID:AB_775978 | 1:2.000 |
| Antibody | NeuN | Millipore | MAB377; RRID:AB_2298772 | 1:200 |
| Antibody | NrCAM | Abcam | AB24344; RRID:AB_448024 | 1:2.000/Also used for membrane staining |
| Antibody | Tuj1 | Sigma | T2200 | 1:2.000 |
| Antibody | β-actin | Thermo Fisher | AM4302; RRID:AB_2536382 | 1:20.000 |
| Chemical compound, drug | D-Lysine | Sigma | P6407 | |
| Chemical compound, drug | Fibronectin | Sigma | F2006 | |
| Chemical compound, drug | Laminin | Sigma | 11243217001 | Coating reagent |
| Chemical compound, drug | Lectin ConA | Sigma | C2272 | 1:2.000 |
| Chemical compound, drug | Lectin ConA | Sigma | C2010 | Glycoproteomics reagent |
| Chemical compound, drug | Lectin RCA120 | CliniSciences | L-1080 | Glycoproteomics reagent |
| Chemical compound, drug | Lectin SNA | Vector laboratories | B-1305 | 1:2.000 |
| Chemical compound, drug | Lectin WGA | Sigma | L9640 | Glycoproteomics reagent |
| Chemical compound, drug | PNGase | New England BioLabs | P0704L | |
| Chemical compound, drug | Tamoxifen | Sigma | H6278 | 1 μM |
| Chemical compound, drug | Tunicamycin | BioTechne | 3516/10 | 0.01 μg/mL |
| Chemical compound, drug | WATER-18O, 97 ATOM % 18O | Sigma | 329878 | Glycoproteomics reagent |
| Commercial assay or kit | GeneChip Mouse Transcriptome Array 1.0 | Affimetrix | MTA1.0 | |
| Peptide, recombinant protein | L1CAM-Fc | R and D | 777-NC | |
| Peptide, recombinant protein | NrCAM-Fc | R and D | 2034-NR | |
| Software, algorithm | ParTek Genomics Suite | ParTek | ||
| Other | IncuCyte | Essen Bioscience | IncuCyte S2 with NeuroTrack module |
Additional files
-
Supplementary file 1
Total proteomics.
Normalized and log2 transformed intensities of the 1982 proteins detected by total proteomics and their relative abundance levels in the En1-Cre; Srd5a3fl/- mutant cerebellum.
- https://doi.org/10.7554/eLife.38309.017
-
Supplementary file 2
Glycoproteomics.
All of the N-glycosylation sites detected in at least 2 out of 4 control samples are included and classified based on their presence in PMID: 20510933 or if they are predicted by uniprot (reference glycoproteomic dataset, spread sheet 1). Sequon analyses on the 1665 N-glycopeptides within the glycoproteomic dataset (spread sheet 2). Gene ontology analyses on the N-glycosylation sites within the reference glycoproteomic dataset predicted by uniprot and/or found in PMID: 20510933 and on the N-glycosylation sites not present in none of them (novel sites, spread sheet 3). 1404 N-glycopeptides detected in at least 3 out of 4 control samples and their corresponding abundance levels in the mutant samples; the intensity for each N-glycopeptide are log2 transformed (comparative glycoproteomics, spread sheet 4). Sequon analyses on the comparative glycoproteomics dataset (spread sheet 5).
- https://doi.org/10.7554/eLife.38309.018
-
Supplementary file 3
Total proteomics and glycoproteomics.
List, normalized intensities and relative abundance of the 24 peptides detected in total proteomics and with decreased abundance in glycoproteomics in the mutant.
- https://doi.org/10.7554/eLife.38309.019
-
Transparent reporting form
- https://doi.org/10.7554/eLife.38309.020
Download links
A two-part list of links to download the article, or parts of the article, in various formats.
Downloads (link to download the article as PDF)
Open citations (links to open the citations from this article in various online reference manager services)
Cite this article (links to download the citations from this article in formats compatible with various reference manager tools)
High N-glycan multiplicity is critical for neuronal adhesion and sensitizes the developing cerebellum to N-glycosylation defect
eLife 7:e38309.
https://doi.org/10.7554/eLife.38309


