The DWORF micropeptide enhances contractility and prevents heart failure in a mouse model of dilated cardiomyopathy
- University of Texas Southwestern Medical Center, United States
- Loyola University Chicago, United States
Figures
Figure 1 with 1 supplement
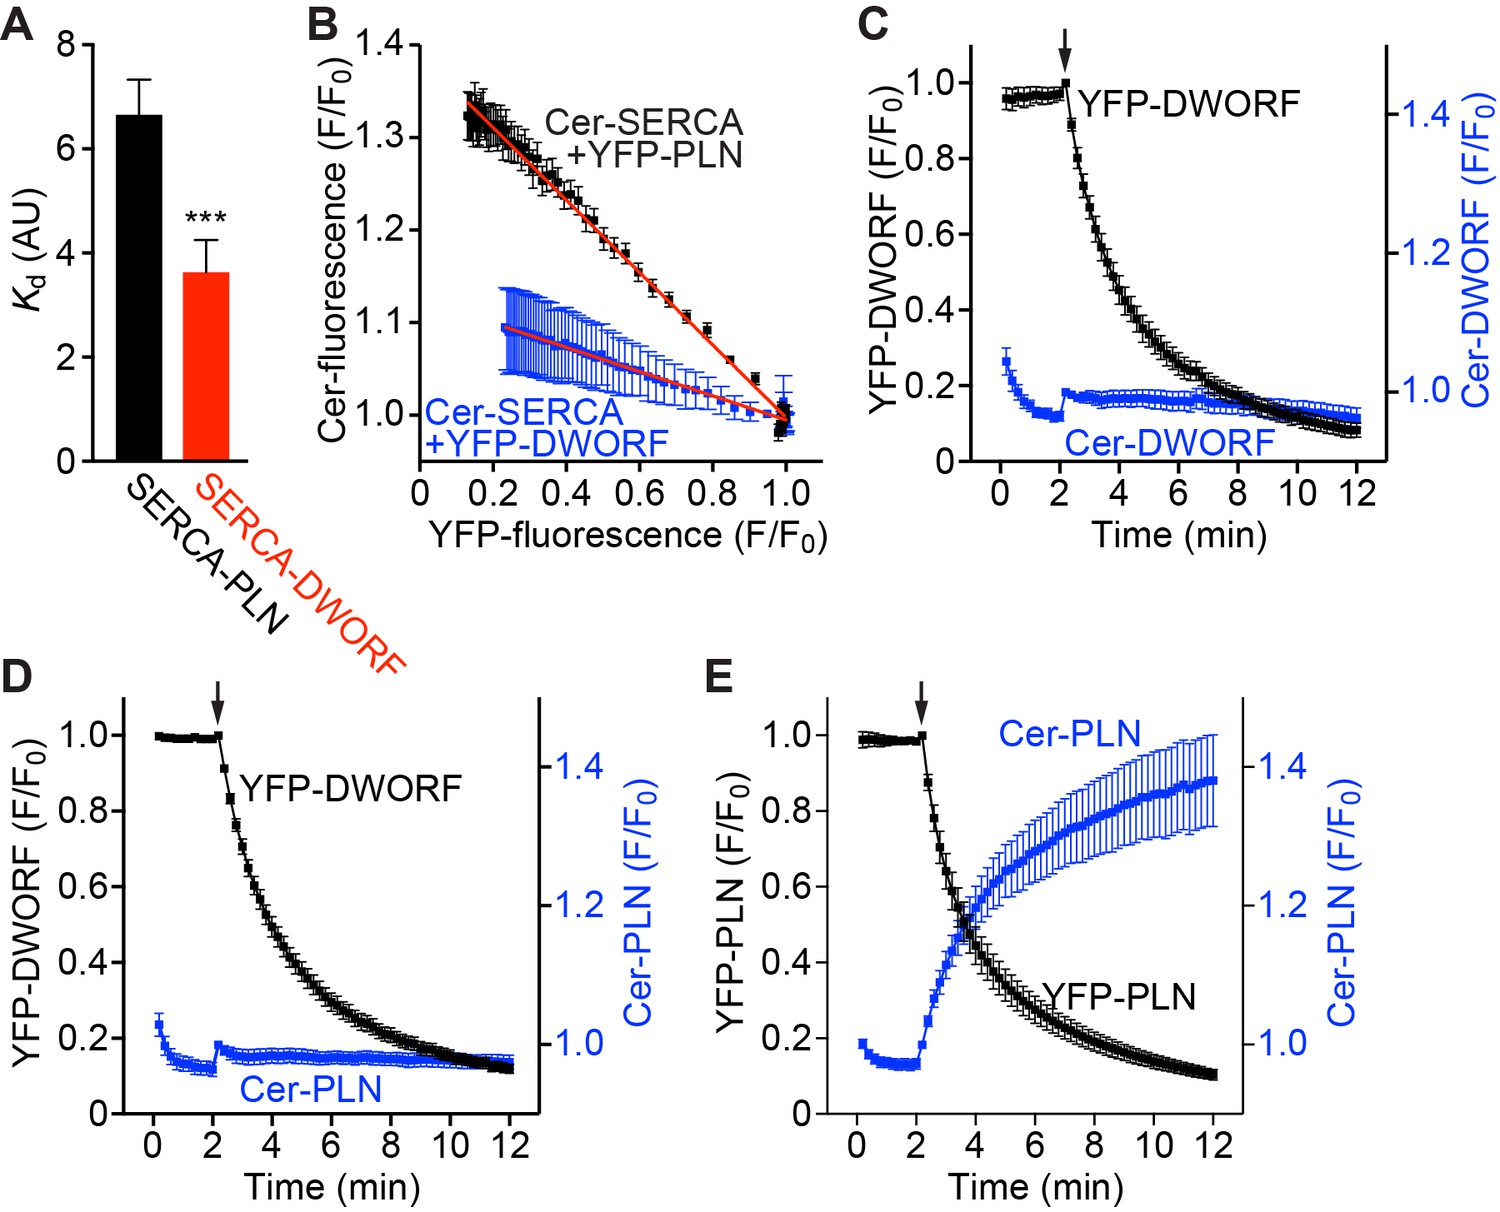
FRET analysis indicates that SERCA has a higher apparent affinity for DWORF than PLN and binds both peptides in a 1:1 stoichiometry.
(A) The apparent affinity of SERCA for PLN and DWORF was assessed by FRET from Cer-SERCA2a to YFP-PLN or YFP-DWORF (Cer excitation, YFP emission). Data are expressed as mean Kd values ± SD for n = 4 independent experiments with ~1000 cells analyzed per experiment. A lower Kd value indicates a higher apparent affinity for SERCA. Statistical comparisons between groups were evaluated by Student’s t-test. p-value ***p<0.005. AU, arbitrary units. (B) Progressive acceptor sensitive photobleaching of YFP-PLN (black) and YFP-DWORF (blue) results in a linear donor vs. acceptor relationship with Cer-SERCA indicating that the stoichiometry of the regulatory complex is 1:1 for both peptides. (C–E) Homo-oligomerization of DWORF with itself (C) or hetero-oligomerization with PLN (D) was not detected by acceptor photobleaching experiments, while PLN-PLN FRET (E) showed the expected high-order oligomerization that has been previously described. These data indicate that DWORF exists as a monomer. Progressive acceptor photobleaching experiments (B–E) are plotted as mean ± SE. F/F0, fluorescence intensity ratio.
Figure 1—figure supplement 1
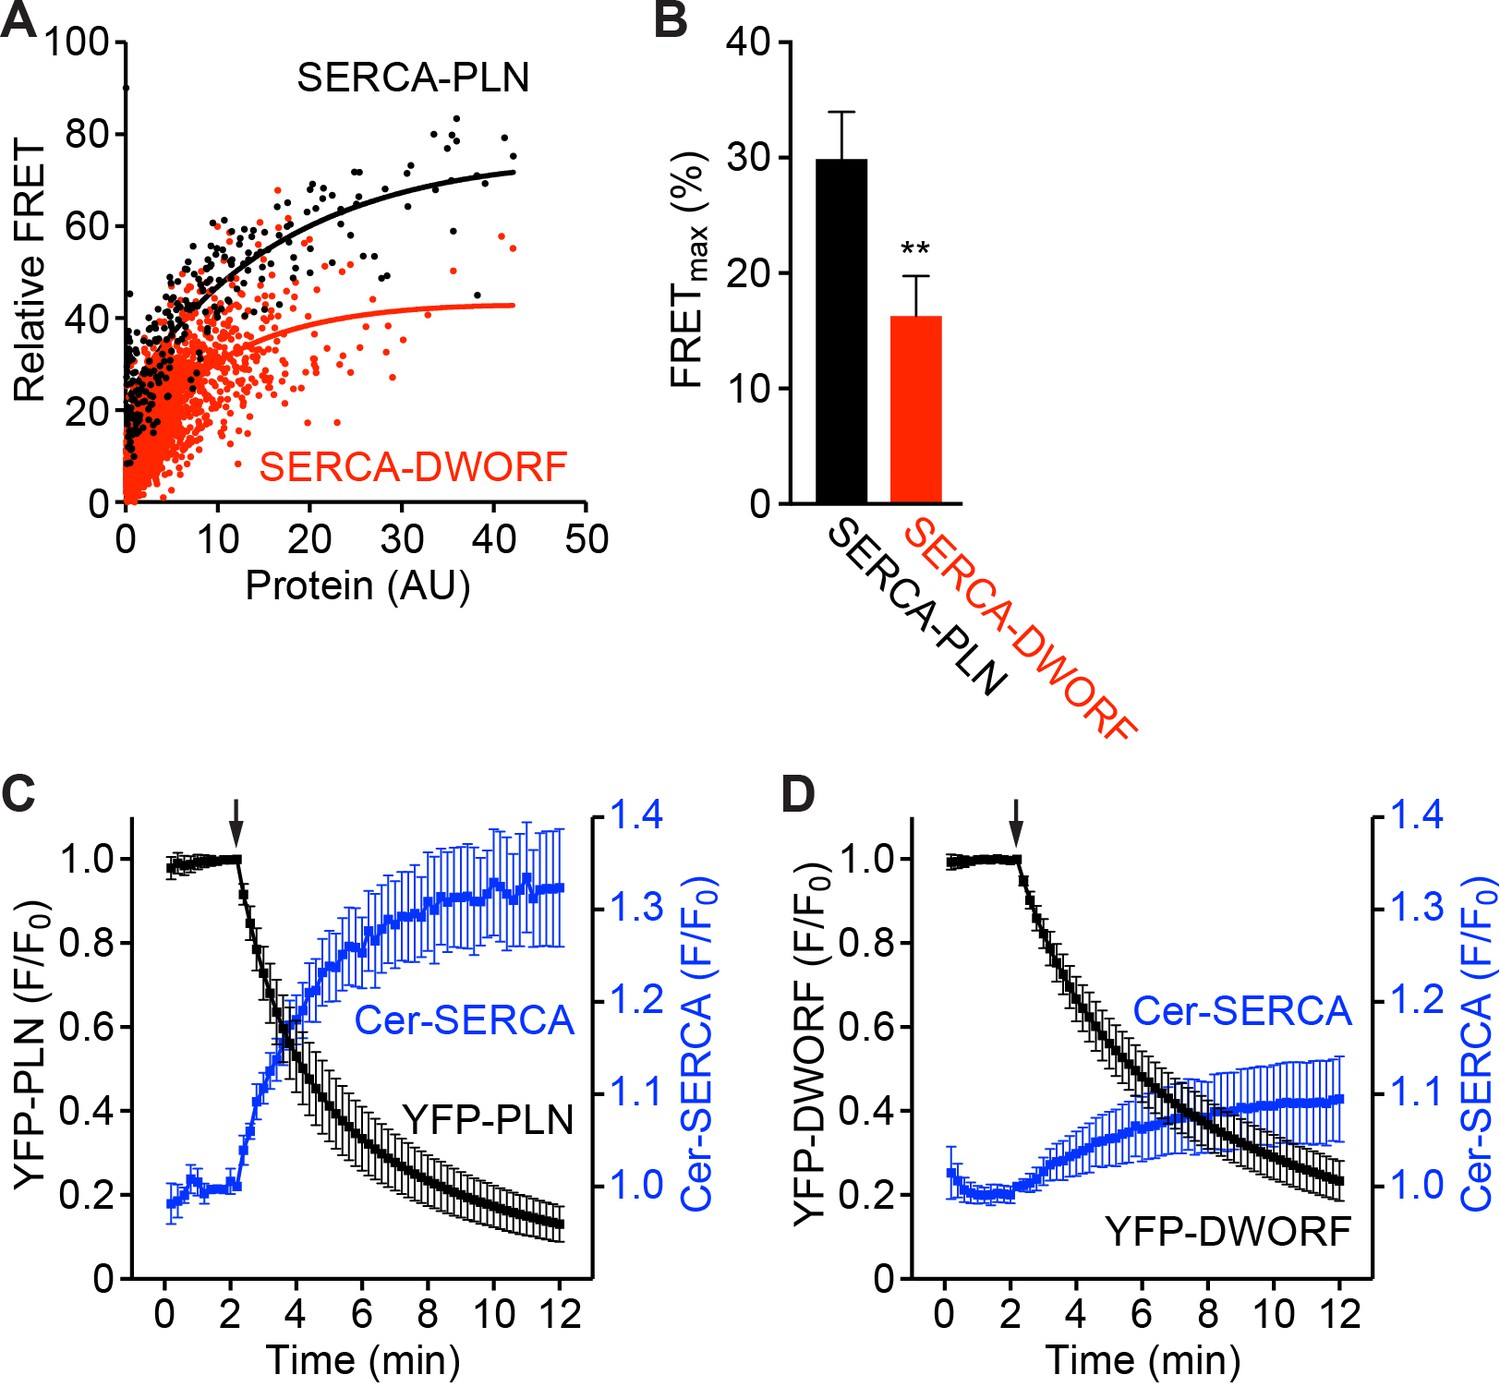
FRET-based analysis of the interaction of SERCA with PLN and DWORF.
(A) Representative FRET data showing that FRET from Cer-SERCA2a to YFP-PLN (black) and YFP-DWORF (red) increases with protein concentration toward a maximum (Cer excitation, YFP emission). (B) Summary of FRETmax values for SERCA-PLN and SERCA-DWORF obtained by fitting hyperbolic curves to pooled data. Data are expressed as mean ±SD for n = 4 independent experiments with ~1000 cells analyzed per experiment. Statistical comparisons between groups were evaluated by Student’s t-test. p-value **p<0.01. (C, D) Progressive acceptor sensitive photobleaching of YFP-PLN (C) and YFP-DWORF (D) results in an increase in Cer-SERCA fluorescence indicating FRET. Photobleaching is initiated at the arrow. Data are plotted as mean ±SE.
Figure 2 with 3 supplements
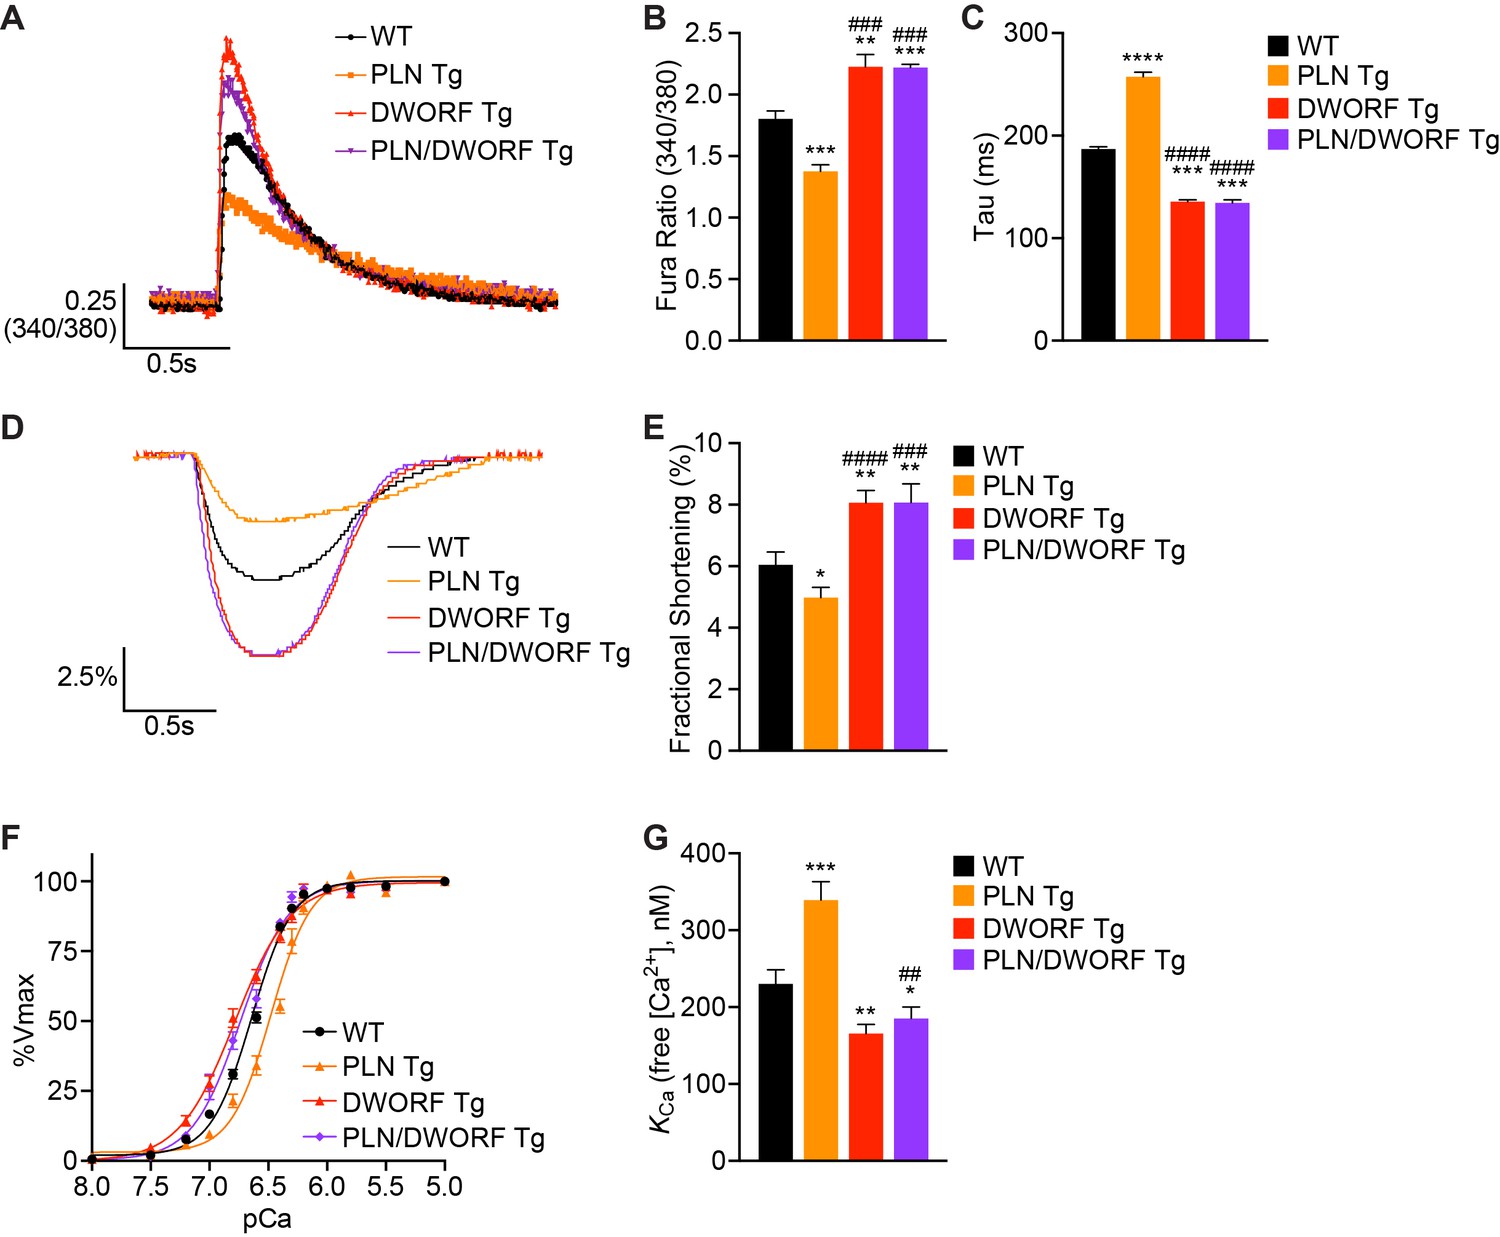
DWORF overexpression counteracts the inhibitory effects of excess PLN on SERCA in vivo.
(A) Representative Ca2+ transients recorded in Fura-2 loaded cardiomyocytes from WT, PLN Tg, DWORF Tg, and PLN/DWORF Tg mice. (B) Mean peak amplitude of pacing-induced Ca2+ transients and transient decay rates (tau) (C) in Fura-2 loaded cardiomyocytes from WT, PLN Tg, DWORF Tg, and PLN/DWORF Tg mice. Transient decay rates were measured by fitting a single exponential to the decay phase of the Ca2+ transient. (D) Representative fractional shortening tracings as measured by sarcomere length during cardiomyocyte contraction. (E) Mean fractional shortening data from mice with the indicated genotypes. Data are represented as mean ±SD for n = 3 animals with 10–12 recordings per animal. Statistical comparisons between groups were evaluated by Student’s t-test. p-value *p<0.05, **p<0.01, ***p<0.005 or ****p<0.001 vs. WT and ###p<0.005 or ####p<0.001 vs. PLN Tg. (F, G) Ca2+-dependent Ca2+-uptake assays were performed using total homogenates from hearts of WT, PLN Tg, DWORF Tg, and PLN/DWORF Tg mice to directly measure SERCA affinity for Ca2+ (KCa) and SERCA activity. Representative tracings (F) and average KCa values (G) from n = 4 hearts of each genotype are represented as bar graphs (±SD). P-value *p<0.05, **p<0.01 or ***p<0.005 vs. WT and ##p<0.01 vs. PLN Tg.
Figure 2—figure supplement 1
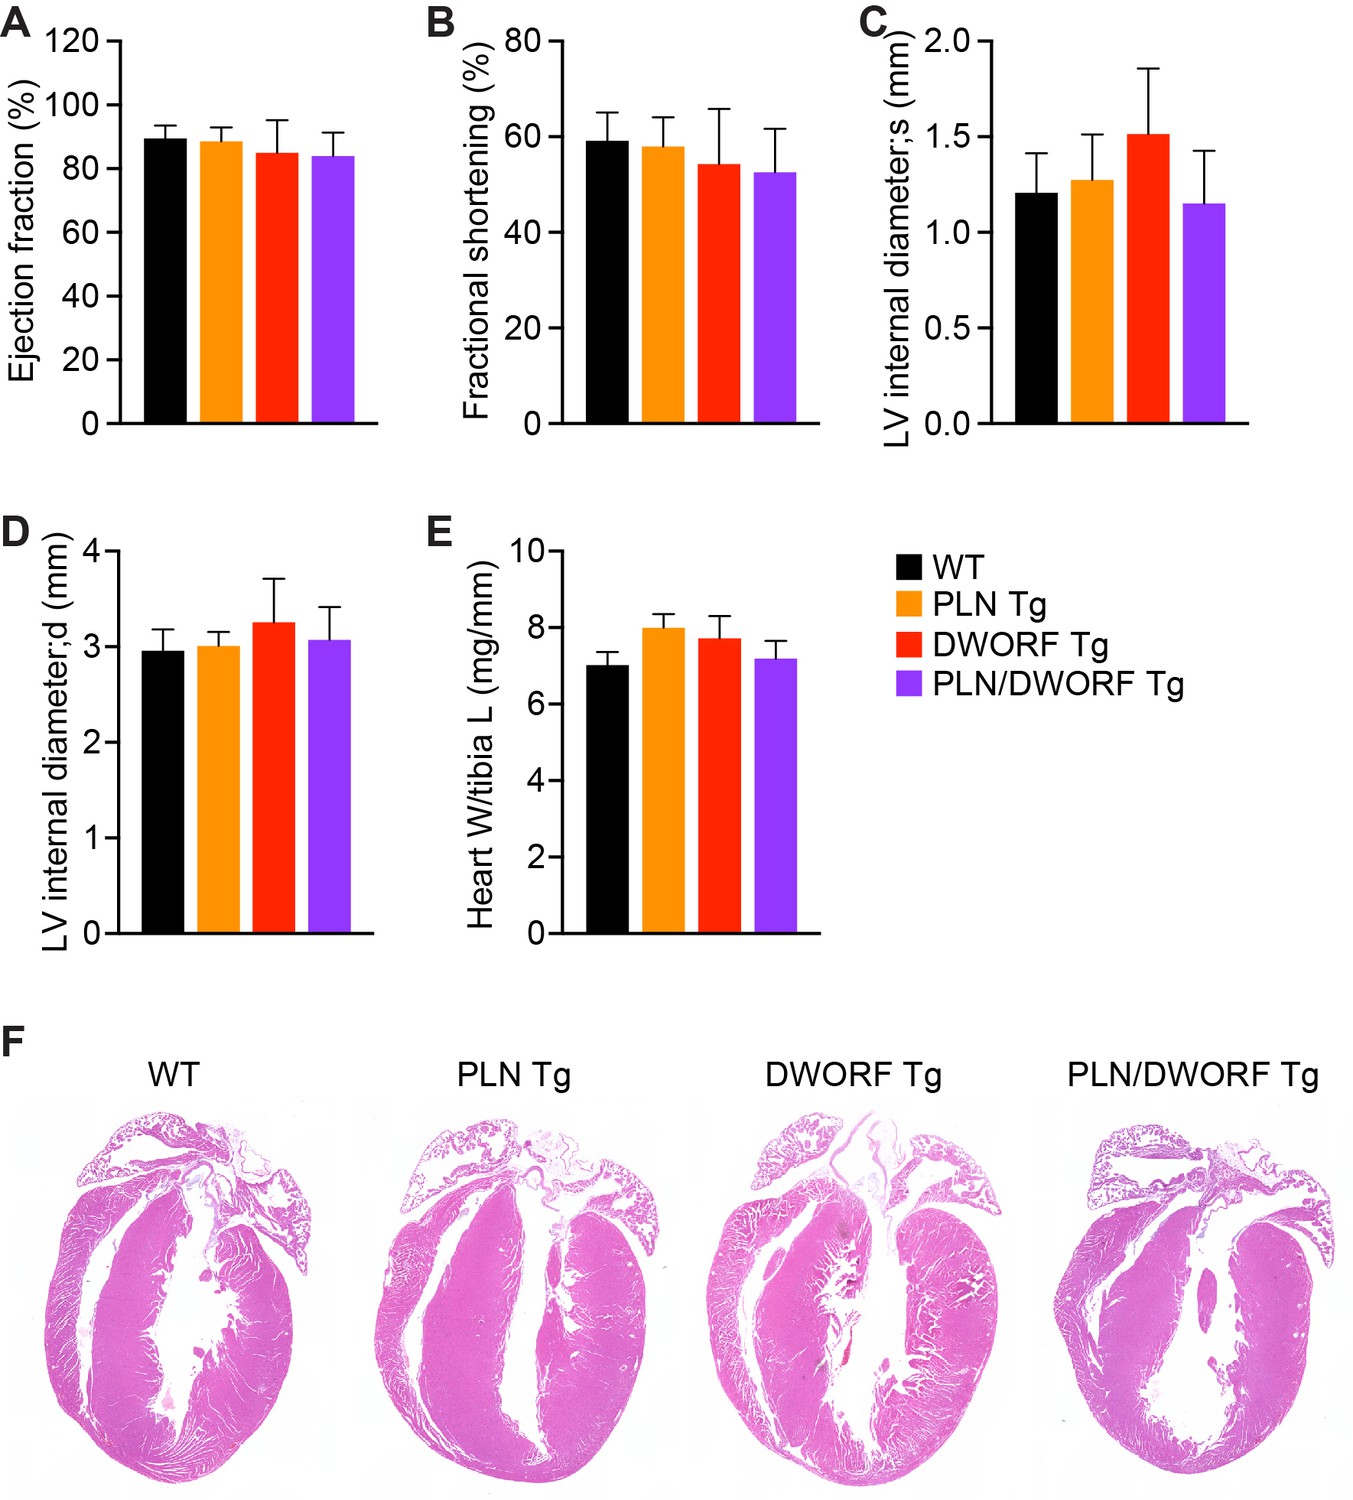
Cardiac function and histological analysis of PLN/DWORF Tg mice.
Cardiac function was calculated from M-mode echocardiographic tracings of 12- to 16-week-old mice with the indicated genotypes and is represented as mean ejection fraction (A) and fractional shortening (B). M-mode images were also used to calculate cardiac dimensions and are represented as left ventricular (LV) internal diameter during maximal contraction (systole, s) (C) and relaxation (diastole, d) (D). Data are expressed as mean ±SD for n = 4–8 mice per genotype. (E) Heart weight (W) to tibia length (L) measurements from n = 4 mice per genotype. Data are represented as mean ±SD. (F) Representative hematoxylin and eosin (H and E) staining of four-chamber histological sections of 16-week-old mice with the indicated genotypes.
Figure 2—figure supplement 2
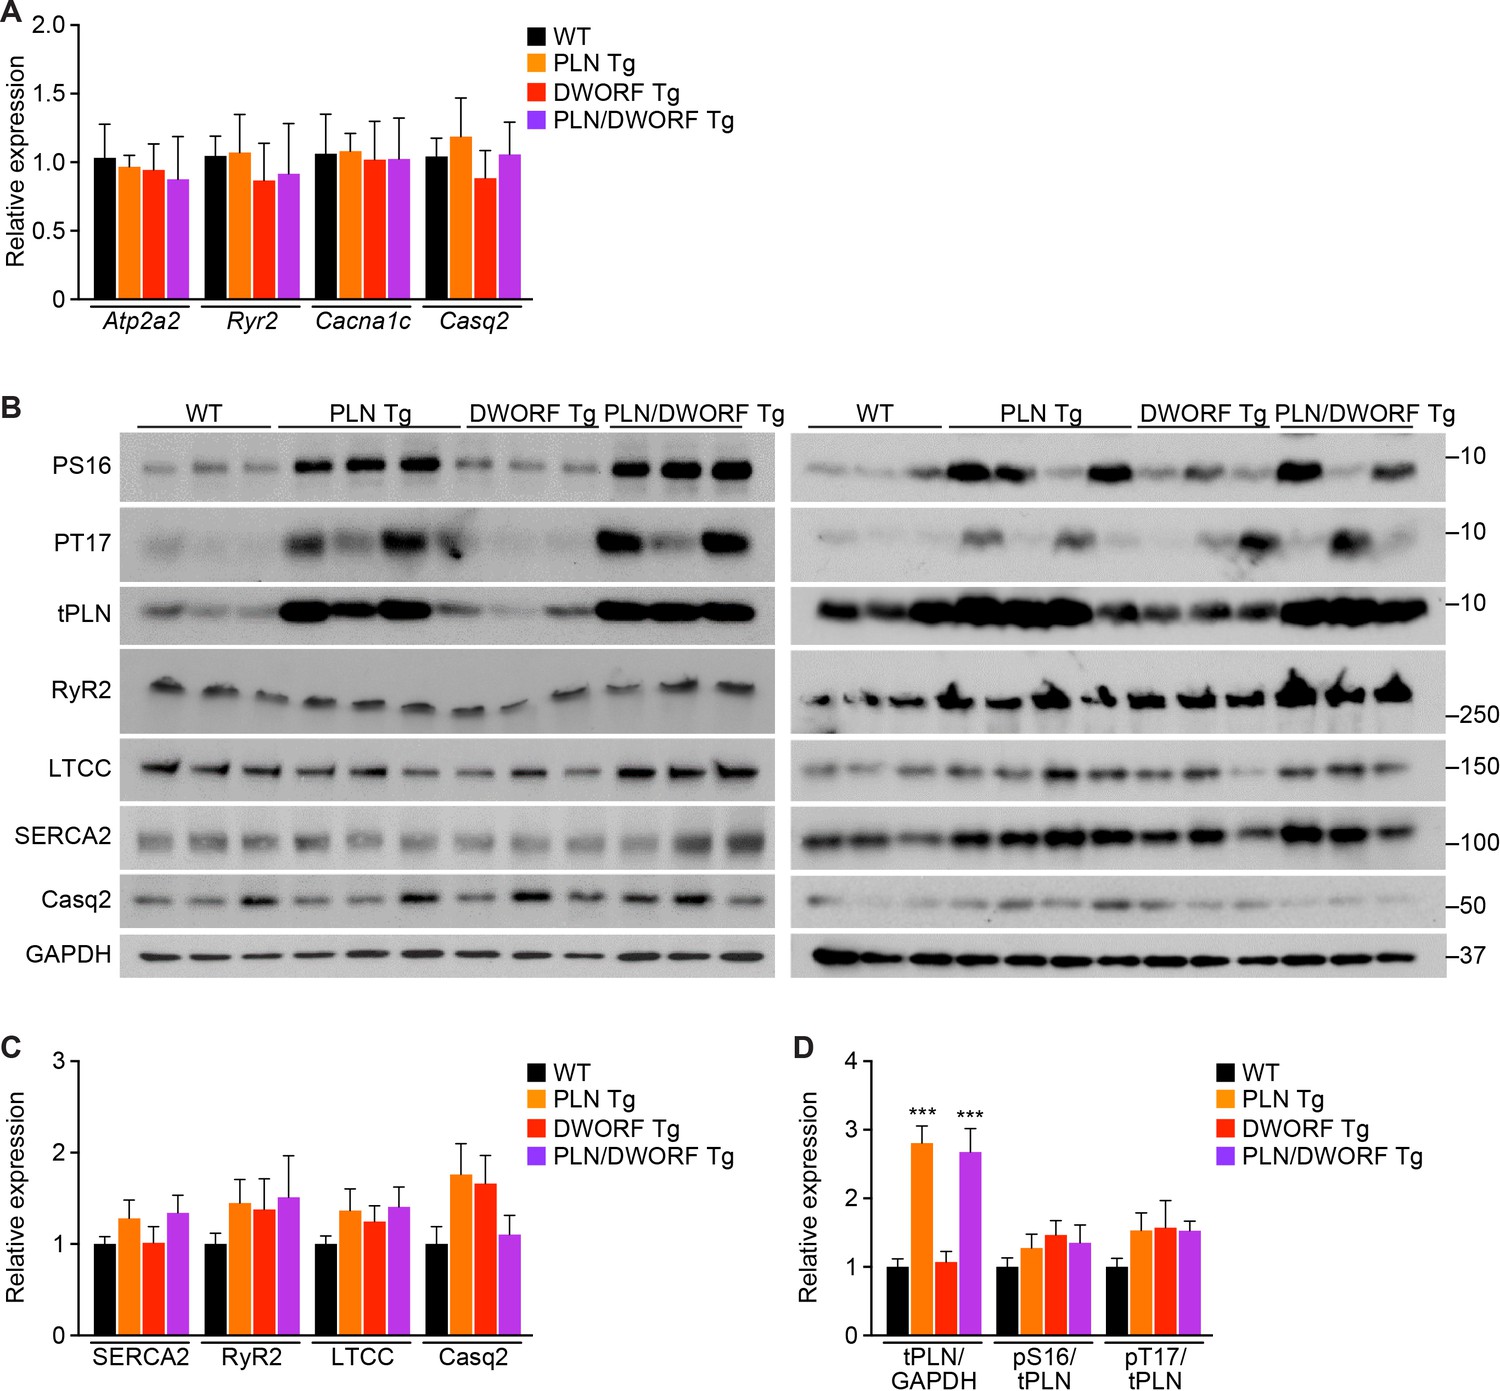
Analysis of RNA and protein expression levels of the major cardiac Ca2+-handling proteins in PLN/DWORF Tg mice.
(A) RNA levels of the indicated genes as quantified by qRT-PCR in 16-week-old heart tissue. Atp2a2, SERCA2a; Ryr2, ryanodine receptor 2; Cacna1c, α1C-subunit of the L-type Ca2+ channel; Casq2, calsequestrin 2. Data are normalized to 18S and presented as expression level relative to WT, mean ±SD for n = 10 mice per genotype. (B) Representative immunoblots of cardiac homogenates from mice with the indicated genotypes. PS16, phospho-serine 16 on PLN; PT17, phospho-threonine 17 on PLN; tPLN, total phospholamban; RyR2, ryanodine receptor 2; LTCC, L-type Ca2+ channel (α1C-subunit); Casq2, calsequestrin 2; GAPDH, glyceraldehyde 3-phosphate dehydrogenase. (C) Western blots for n = 9–10 mice of each genotype were quantified using ImageJ and data are normalized to GAPDH and expressed as mean ±SD relative to WT. (D) Quantification of total phospholamban and its phosphorylation status as assessed by western blot (B) and expressed as relative to WT. Western blots were quantified with ImageJ software. Phosphorylation blots (PS16 and PT17) were normalized to total PLN (tPLN). Total PLN was normalized to GAPDH. Data are expressed as mean ±SD for n = 9–10 mice per genotype. Statistical comparisons between groups were evaluated by Student’s t-test. p-value *p<0.05 or ***p<0.005 or vs. WT.
Figure 2—figure supplement 3
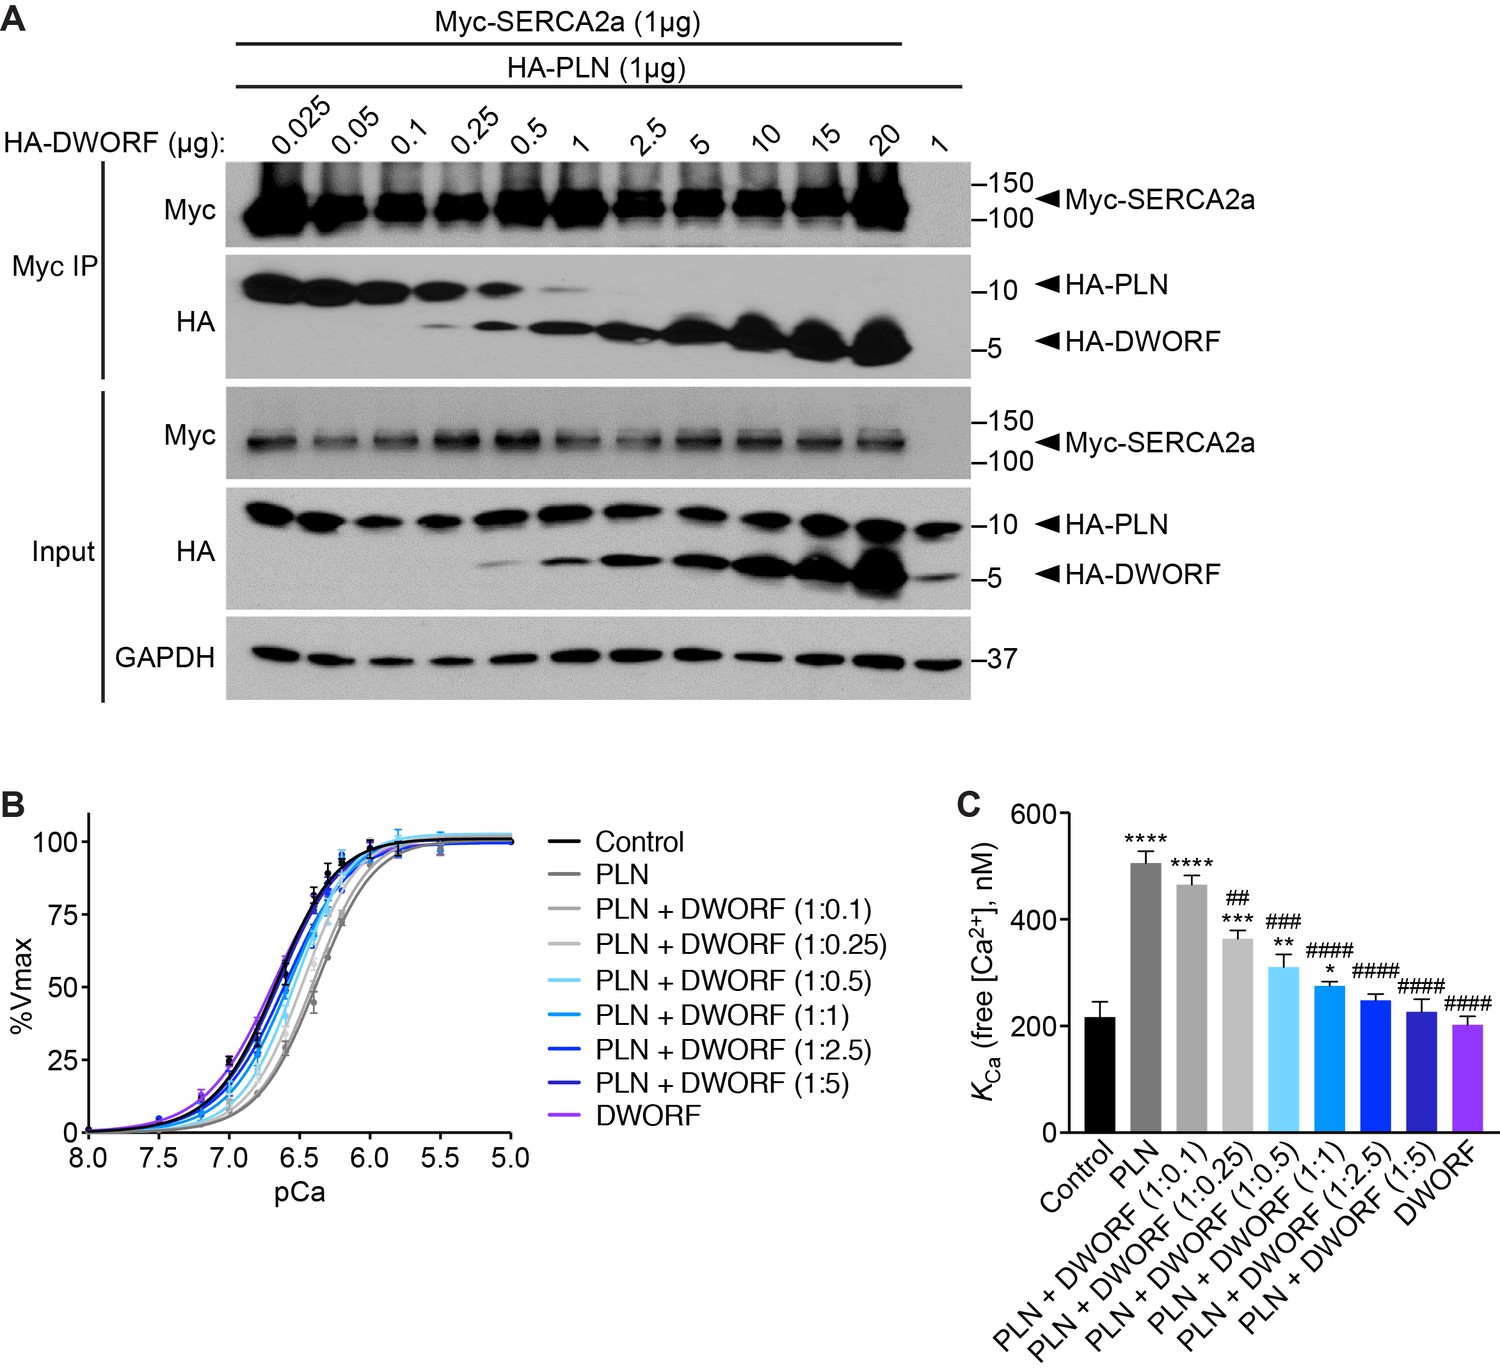
DWORF binding to SERCA2a displaces PLN in a dose-dependent manner and enhances SERCA activity.
(A) Immunoprecipitations of Myc-SERCA2a were performed on lysates of HEK293 cells co-transfected with equal amounts of HA-PLN and Myc-SERCA2a (1 µg) and increasing amounts of HA-DWORF. Western blots on input samples (bottom) and bound immunoprecipitated fractions (top) reveal that DWORF binding to SERCA2a competitively displaces PLN. (B, C) Ca2+-dependent Ca2+-uptake assays were performed using homogenates from HEK293 cells co-transfected with equal amounts of SERCA2a and PLN (1 µg) and increasing amounts of DWORF. Co-transfection of cells with PLN (dark grey line) results in a rightward shift of the Ca2+-affinity curve as compared to control cells (SERCA2a alone, black) (B). Co-transfection with increasing levels of DWORF relieves the inhibitory effect of PLN on SERCA2a in a dose-dependent manner as evidenced by a leftward shift of the affinity curve back toward control values. Cells expressing SERCA2a and DWORF in the absence of PLN do not exhibit enhanced SERCA activity (purple), indicating that DWORF exerts its’ stimulatory effect on SERCA through the displacement of PLN. (C) Mean KCa values from n = 4 separate experiments are represented as bar graphs (±SD). p-value *p<0.05, **p<0.01, ***p<0.005, or ****p<0.001 vs. Control and ##p<0.01, ###p<0.005, ####p<0.001 vs. PLN. Statistical comparisons between groups were evaluated by Student’s t test.
Figure 3
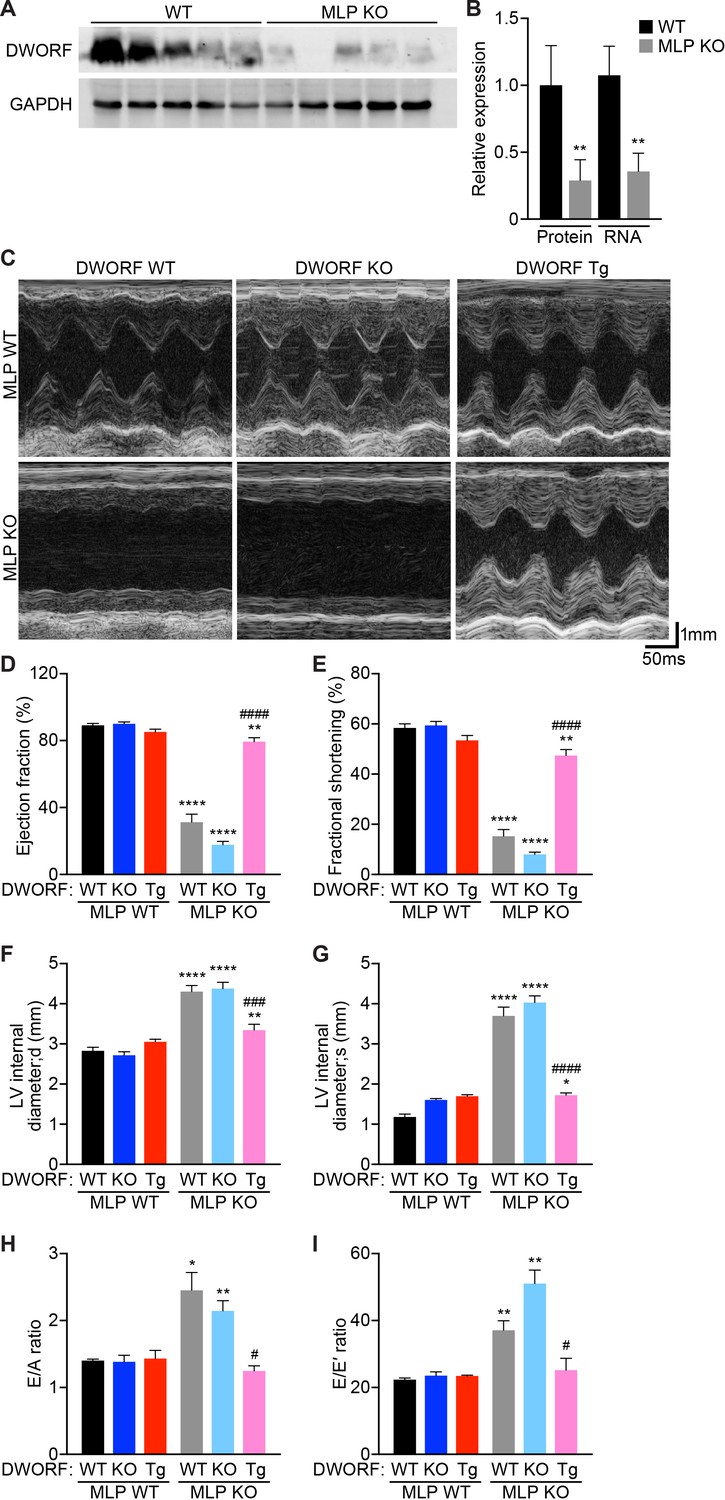
Overexpression of DWORF ameliorates cardiac dysfunction in MLP KO mice.
(A) Western blot analysis of heart homogenates from 8-week-old WT and MLP KO mice immunoblotted with anti-DWORF antibody. (B) Quantification of expression of DWORF protein (left) and RNA (right) in 8-week-old WT and MLP KO hearts. Data are expressed as mean ±SD for n = 5 animals. p-value **p<0.01 vs. WT. (C) Representative M-mode echocardiographic tracings from 8-week-old mice with the indicated genotypes. Cardiac function was evaluated from M-mode images and is represented by mean percent ejection fraction (D) and percent fractional shortening (E). Cardiac dimensions were also measured and are represented as left ventricular (LV) internal diameter during maximal relaxation (diastole, d) (F) and contraction (systole, s) (G). Data are expressed as mean ±SD for n = 5–15 mice per genotype. p-value *p<0.05, **p<0.01, or ****p<0.001 vs. WT and ###p<0.005 or ####p<0.001 vs. MLP KO. (H, I) Indices of diastolic function were assessed by Doppler echocardiography and are quantified and represented as E/A ratio (H) and E/E’ ratio (I). Data were collected from n = 3–5 mice per genotype and are expressed as mean ±SD. p-value *p<0.05 or **p<0.01 vs. WT and #p<0.05 vs. MLP KO. Statistical comparisons between groups were evaluated by Student’s t-test.
Figure 4 with 1 supplement
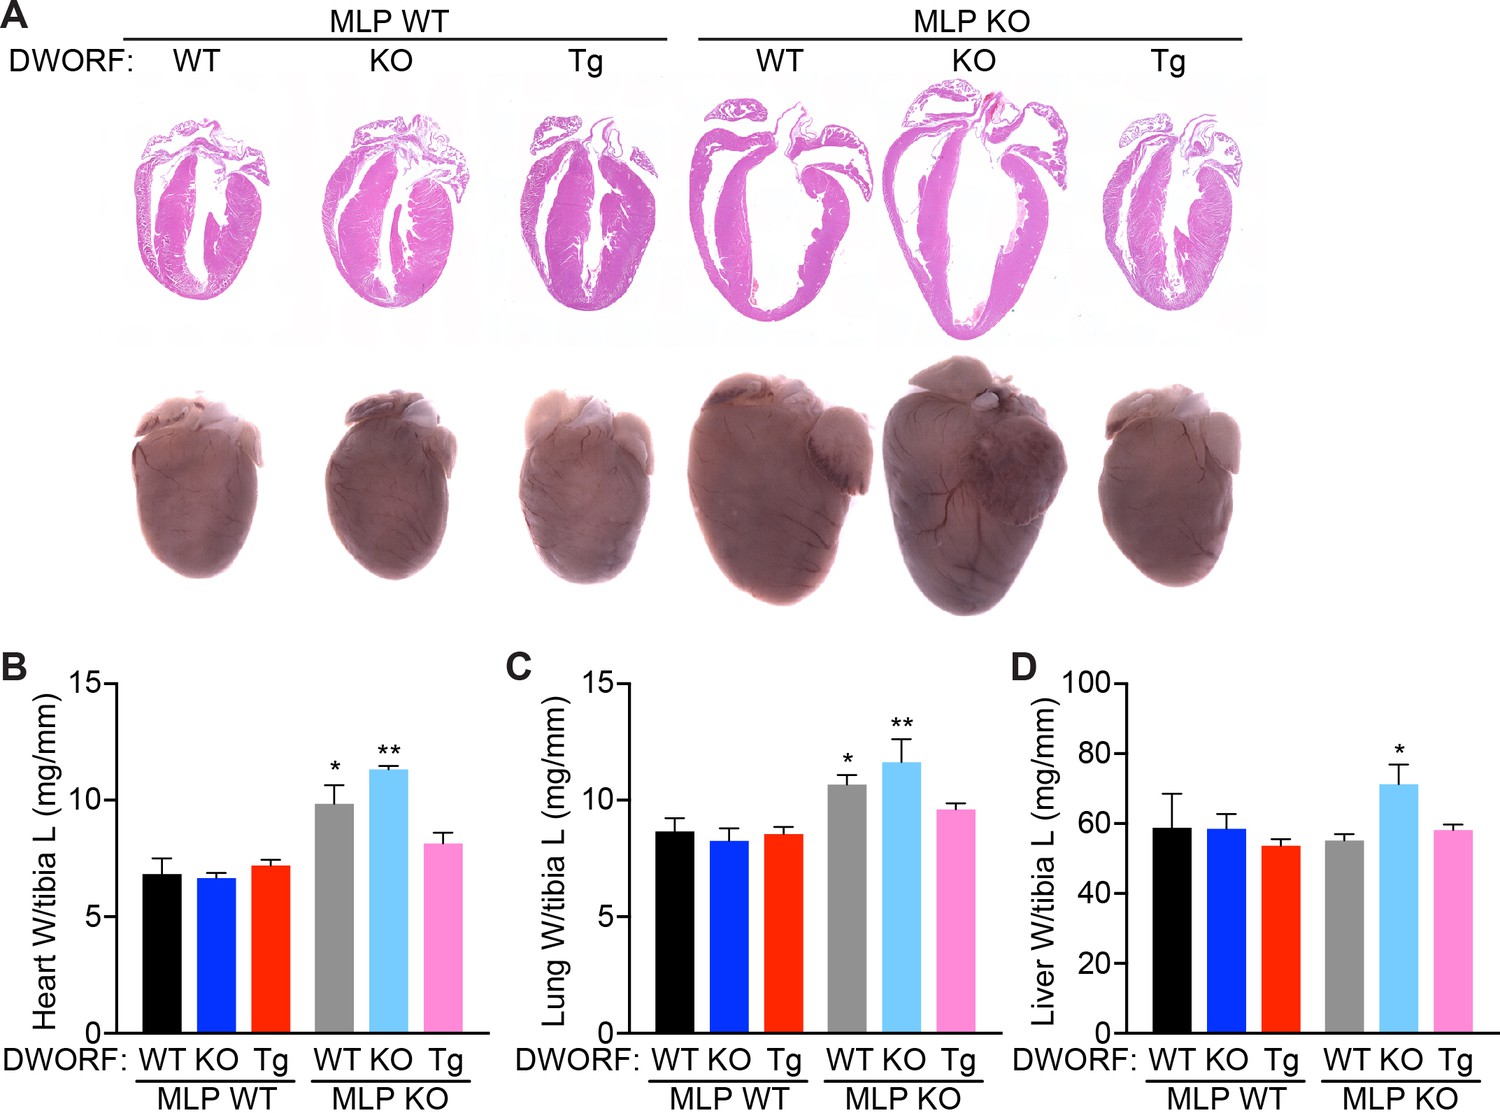
DWORF overexpression abrogates the DCM phenotype of MLP KO mice.
(A) Representative hematoxylin and eosin (H and E) staining of four-chamber histological sections (top) or whole mount hearts (bottom) from 8-week-old mice with the indicated genotypes. (B) Heart weight (W) to tibia length (L), lung weight to tibia length (C), and liver weight to tibia length (D) measurements from n = 3–7 mice per genotype. Data are represented as mean ±SD. Statistical comparisons between groups were evaluated by Student’s t-test. p-value *p<0.05, **p<0.01 vs. WT.
Figure 4—figure supplement 1
Overexpression of DWORF in MLP KO mice prevents cardiomyocyte hypertrophy.
(A) Representative confocal images of heart sections from 8-week-old mice with the indicated genotypes. Immunostaining was performed for wheat germ agglutinin (WGA, green), cardiac troponin T (red) and nuclei were stained with DAPI (blue). All images were taken of the LV-free wall at mid-level. Scale bar is 20 µm. (B) Quantitative analysis of cardiomyocyte cross-sectional area from n = 5 mice of each genotype. Mean data are represented as bar graphs (±SD). p-value **p<0.01 or ***p<0.005 vs. WT and ##p<0.01 vs. MLP KO. (C) Bright field images of freshly isolated adult mouse ventricular cardiomyocytes from 8-week-old mice with the indicated genotypes. Scale bar is 20 µm. (D, E) Cardiomyocyte length (D) and width (E) were quantified using ImageJ software and mean values are shown for n = 4 mice of each genotype (±SD). p-value **p<0.01 or ***p<0.005 vs. WT and ##p<0.01 vs. MLP KO. Statistical comparisons between groups were evaluated by Student’s t-test.
Figure 5

Overexpression of DWORF in MLP KO mice prevents fibrosis and ultrastructural defects and mitigates the hypertrophic gene response.
(A) Representative Picrosirius red staining of heart sections from animals with the specified genotypes. The red color indicates fibrosis. Scale bar: 50 μm. (B) Quantification of Picrosirius red staining in n = 5–9 mice. Data are expressed as the mean fibrotic area relative to the total myocardium (±SD). Statistical comparisons between groups were evaluated by Student’s t-test. p-value **p<0.01 or ****p<0.001 vs. WT and #p<0.05 vs. MLP KO. (C) qRT-PCR of 8-week-old hearts from MLP KO mice and MLP KO/DWORF KO mice show a robust activation of the fetal gene program that is typical of the pathological hypertrophic response, which is diminished with DWORF overexpression. Nppa, atrial natriuretic peptide; Nppb, brain natriuretic peptide; Myh6,α-myosin heavy chain; Myh7, β-myosin heavy chain. Data are normalized to 18S values and are presented as expression level relative to WT, mean ±SD for n = 4–5 mice per genotype. p-value *p<0.05 or **p<0.01 vs. WT and #p<0.05 or ##p<0.01 vs. MLP KO. (D) Consistent with the characteristics of DCM, electron micrographs of heart sections from MLP KO mice exhibit pronounced myofibrillar disarray which is prevented with DWORF overexpression. Images shown are representative of n = 3 mice per genotype. Scale bar: 0.5 μm.
Figure 6 with 1 supplement

DWORF overexpression enhances Ca2+ cycling, contractility and SERCA activity in MLP KO mice.
(A) Average pacing-induced peak Ca2+ transient amplitude in isolated adult cardiomyocytes loaded with Fura-2 from 8-week-old animals with the indicated genotypes. (B) Mean Ca2+ transient decay rates (tau) were calculated by fitting a single exponential to the decay phase of the Ca2+ transient. (C) Average peak cardiomyocyte fractional shortening analysis as measured by sarcomere length during contraction from mice with the indicated genotypes. (D, E) Sarcomere relaxation (D) and contraction (E) kinetics were analyzed from sarcomere length measurements during pacing-induced contractions (SL, sarcomere length). Data are represented as mean ±SD for n = 4 animals with 6–12 recordings per animal. Statistical comparisons between groups were evaluated by Student’s t-test. p-value *p<0.05 or **p<0.01 vs. WT and ##p<0.01 or ###p<0.005 vs. MLP KO. (F, G) Oxalate supported Ca2+-dependent Ca2+-uptake assays were performed using total homogenates from hearts of mice with the indicated genotypes to directly measure SERCA affinity for Ca2+ (KCa) and SERCA activity. Representative tracings (F) and average KCa values (G) from n = 4 hearts of each genotype are presented as mean ±SD. p-value *p<0.05, **p<0.01 or ***p<0.005 vs. WT and ##p<0.01 vs. MLP KO.
Figure 6—figure supplement 1
Expression and post-translational modifications of Ca2+-handling proteins.
(A) Immunoblots of cardiac homogenates from mice with the indicated genotypes. (B) Immunoblots were quantified using ImageJ and normalized to GAPDH. LTCC, L-type Ca2+ channel (α1C-subunit); Casq2, calsequestrin 2; RyR2, ryanodine receptor 2; GAPDH, glyceraldehyde 3-phosphate dehydrogenase. (C) Quantification of the phosphorylation status and oligomerization of phospholamban as assessed by western blot (panel A) and expressed as relative to WT. Western blots were quantified with ImageJ software. Phosphorylation blots (PS16 and PT17) were normalized to total PLN (tPLN). Total PLN was normalized to GAPDH. tPLN, total phospholamban; PS16, phospho-serine 16 on PLN; PT17, phospho-threonine 17 on PLN. Data are expressed as mean ±SD for n = 4–6 mice per genotype. (D) RNA levels of the indicated genes as quantified by qRT-PCR in 8-week-old heart tissue. Atp2a2, SERCA2a; Cacna1c, α1C-subunit of the L-type Ca2+ channel; Casq2, calsequestrin 2; Pln, phosholamban; Ryr2, ryanodine receptor 2. Data are normalized to 18S values and presented as expression level relative to WT, mean ±SD for n = 4–5 mice per genotype.
Tables
Table 1
Echo-Doppler assessment of left ventricular diastolic function in the different experimental groups of mice.
Data are represented as mean ±SD for n = 3–5 mice per genotype. p-value *p<0.05, **p<0.01 or ***p<0.005 vs. WT and #p<0.05 vs. MLP KO. Statistical comparisons between groups were evaluated by Student’s t-test. Abbreviation used: E, peak Doppler blood inflow velocity across mitral valve during early diastole; A, peak Doppler blood inflow velocity across mitral valve during late diastole; E’, peak tissue Doppler of myocardial relaxation velocity at mitral valve annulus during early diastole; A’, peak tissue Doppler of myocardial relaxation velocity at mitral valve annulus during late diastole; HR, heart rate; bpm, beats per minute.
| Genotype | E mm/s | A mm/s | E' mm/s | A' mm/s | E/A | E/E' | HR bpm |
|---|---|---|---|---|---|---|---|
| WT | 569.7 ± 39.0 | 408.0 ± 39.2 | 25.6 ± 2.4 | 10.7 ± 1.8 | 1.4 ± 0.1 | 22.3 ± 0.8 | 465.7 ± 22.0 |
| DWORF KO | 591.5 ± 22.1 | 432.1 ± 61.8 | 25.2 ± 2.0 | 19.3 ± 1.4* | 1.4 ± 0.2 | 23.5 ± 2.0 | 447.3 ± 8.3 |
| DWORF Tg | 624.2 ± 43.2 | 443.6 ± 81.8 | 26.6 ± 1.7 | 11.8 ± 1.3 | 1.4 ± 0.2 | 23.4 ± 0.4 | 445.7 ± 5.0 |
| MLP KO | 546.0 ± 38.7 | 236.9 ± 78.1* | 15.1 ± 2.8** | 14.7 ± 2.3* | 2.4 ± 0.6* | 37.1 ± 6.3** | 438.6 ± 19.3 |
| MLP/DWORF dKO | 536.9 ± 60.2 | 251.2 ± 24.6** | 10.6 ± 1.0***, # | 13.6 ± 1.0 | 2.1 ± 0.3** | 51.0 ± 7.0** | 444.3 ± 21.7 |
| MLP KO/DWORF Tg | 606.4 ± 199.6 | 492 ± 182.7# | 24.0 ± 4.1# | 18.7 ± 3.1 | 1.2 ± 0.1# | 25.2 ± 6.1* | 467 ± 14.1 |
Key resources table
| Reagent type | Designation | Source | Identifiers | Additional information |
|---|---|---|---|---|
| Antibody | Mouse Anti-HA Tag Monoclonal Antibody (5B1D10) | Invitrogen | Cat. #32–6700 | WB (1:2,000) |
| Antibody | Mouse Anti-Myc Tag Monoclonal Antibody | Invitrogen | Cat. #R950-25 | WB (1:2,000), IP (1 ug) |
| Antibody | Mouse Anti-Phospholamban Monoclonal Antibody (2D12) | Invitrogen | Cat. #MA3-922 | WB (1:2,000) |
| Antibody | Rabbit Anti-Phospholamban (PLN, PLB) (pSer16) pAb | Badrilla | Cat. #A010-12AP | WB (1:1,000) |
| Antibody | Rabbit Anti-Phospholamban (PLN, PLB) (pThr17) pAb | Badrilla | Cat. #A010-13AP | WB (1:1,000) |
| Antibody | Mouse Anti-Ryanodine Receptor Monoclonal Antibody (C3-33) | Invitrogen | Cat. #MA3-916 | WB (1:1,000) |
| Antibody | Mouse Anti-SERCA2 ATPase Monoclonal Antibody (2A7-A1) | Invitrogen | Cat. #MA3-919 | WB (1:1,000) |
| Antibody | Rabbit Anti-Calsequestrin Polyclonal Antibody | Invitrogen | Cat. #PA1-913 | WB (1:1,000) |
| Antibody | Rabbit Anti-DWORF | New England Peptide | Custom made | WB (1:1,000) |
| Antibody | Mouse Anti-GAPDH Loading Control Monoclonal Antibody (GA1R) | Invitrogen | Cat. #MA5-15738 | WB (1:10,000) |
| Antibody | Rabbit Anti-Calcium Channel Antibody, Voltage Gated α1C, pAb | Millipore | Cat. #AB5156 | WB (1:250) |
| Antibody | Goat Anti-Mouse IgG (H + L) -HRP Conjugate | Bio-Rad | Cat. #1706516 | WB (1:20,000) |
| Antibody | Goat Anti-Rabbit IgG (H + L) -HRP Conjugate | Bio-Rad | Cat. #1706515 | WB (1:20,000) |
| Antibody | DyLight 800 Sheep Anti-Rabbit IgG | Bio-Rad | Cat. #STAR36D800GA | WB (1:10,000) |
| Antibody | StarBright Blue 700 Goat Anti-Mouse IgG | Bio-Rad | Cat. #12004159 | WB (1:10,000) |
| Antibody | hFAB Rhodamine Anti-GAPDH Primary Antibody | Bio-Rad | Cat. #12004168 | WB (1:10,000) |
| Antibody | Mouse Anti-Cardiac Troponin T Monoclonal Antibody [1C11] | Abcam | Cat. #ab8295 | IHC (1:500) |
| Antibody | Goat anti-Mouse IgG (H + L) Cross-Adsorbed Secondary Antibody, Alexa Fluor 555 | Invitrogen | Cat. #A-21422 | IHC (1:500) |
| Other | Wheat Germ Agglutinin, Alexa Fluor 488 Conjugate | Invitrogen | Cat. #W11261 | IHC (1:500) |
| Other | VECTASHIELD Antifade Mounting Medium with DAPI | Vector Laboratories | Cat. #H-1200 | IHC |
| Other | Dynabeads Protein G for Immunoprecipitation | Invitrogen | Cat. #10004D | IP |
Additional files
-
Transparent reporting form
- https://doi.org/10.7554/eLife.38319.016
Download links
A two-part list of links to download the article, or parts of the article, in various formats.
Downloads (link to download the article as PDF)
Open citations (links to open the citations from this article in various online reference manager services)
Cite this article (links to download the citations from this article in formats compatible with various reference manager tools)
The DWORF micropeptide enhances contractility and prevents heart failure in a mouse model of dilated cardiomyopathy
eLife 7:e38319.
https://doi.org/10.7554/eLife.38319


