Analogue closed-loop optogenetic modulation of hippocampal pyramidal cells dissociates gamma frequency and amplitude
- University College London, United Kingdom
- Champalimaud Center for the Unknown, Portugal
Figures
Figure 1
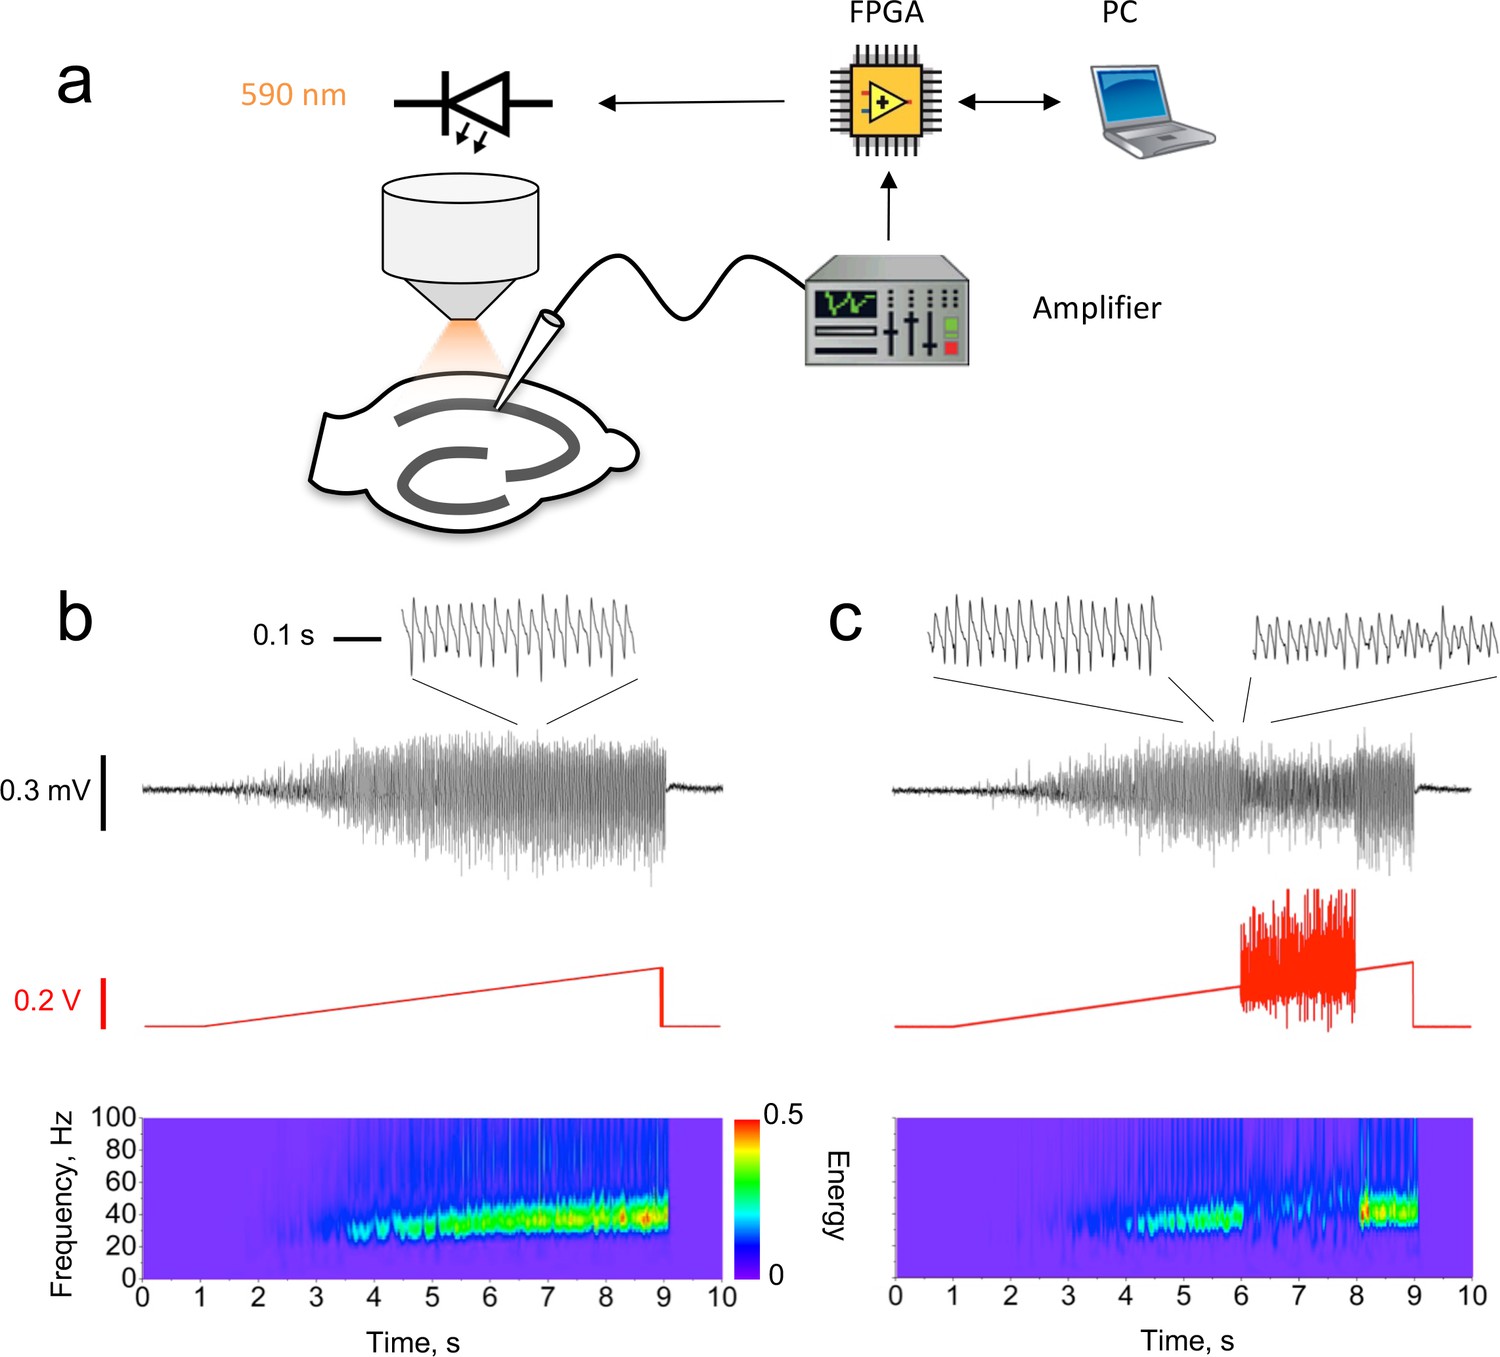
Closed-loop modulation of gamma oscillation.
(a) Experimental design. The LFP in CA1 was used to modulate a ramp command generated by the PC via a field-programmable gate array (FPGA). The modulated ramp voltage command was then passed to the light-emitting diode (LED) driver, which implemented a threshold-linear voltage-to-current conversion. (b) Unmodulated oscillation recorded in CA1 induced by a linear ramp LED driver command. Black trace: LFP with an expanded section showing the characteristic shape of the gamma oscillation (inset). Red trace: LED ramp command. Bottom: LFP Morlet wavelet spectrogram. (c) Closed-loop oscillation clamp applied between 6 and 8 s, obtained by multiplying the ramp command by (1 + k1LFP + k2dLFP/dt), with dLFP/dt averaged over 2 ms intervals. For this example, k1 = 0 mV−1, k2 = 25 ms mV−1. The oscillation amplitude was reduced by approximately 60% (insets), with no net change in frequency.
-
Figure 1—source data 1
Figure 1 source data
- https://doi.org/10.7554/eLife.38346.003
Figure 2
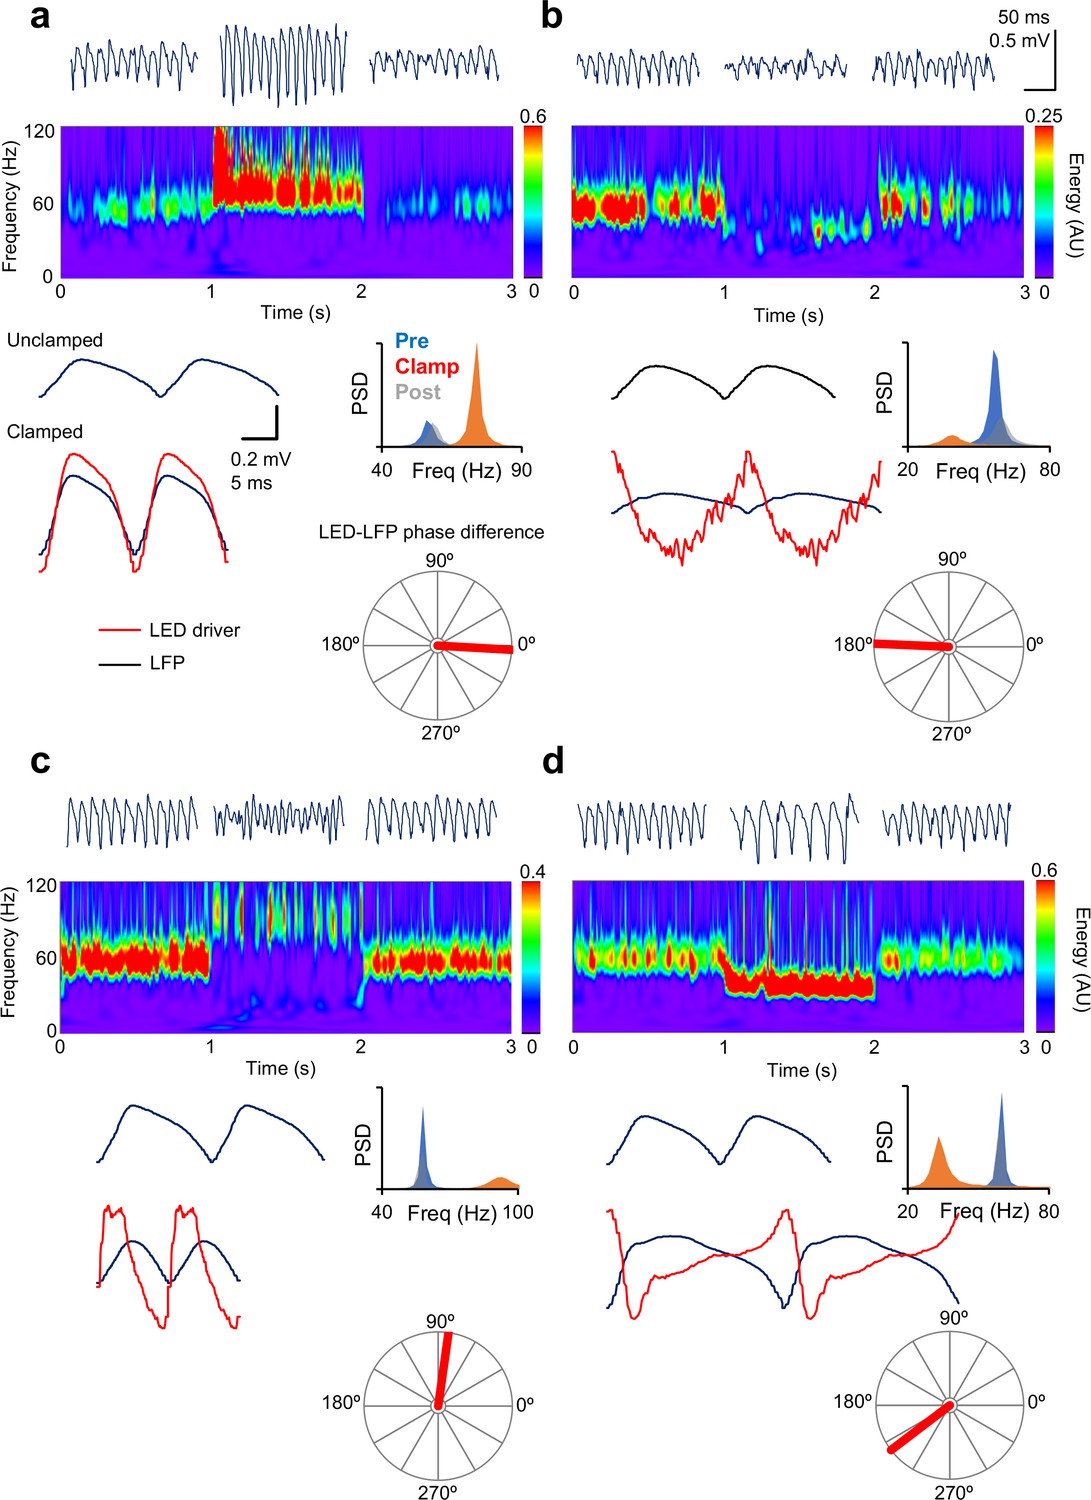
Gamma clamp allows bidirectional modulation of frequency and power.
(a) In-phase modulation led to an increase in gamma power and frequency. Top: 200 ms-long segments of the LFP before, during and after closed-loop modulation of the LED driver. Middle: spectrogram. Bottom, left: two cycles of the average oscillation before and during the oscillation clamp. The average LED command (red trace, arbitrary scale) is shown superimposed on the clamped oscillation. Right: power spectral density before (blue), during (red) and after (grey) clamp. The polar plot shows the phase relationship between the LED command and the LFP. (b) Anti-phase modulation led to decreases in both frequency and power. (c) An increase in oscillation frequency, together with a decrease in power, was obtained with ~90° phase-advance of the LED driver command over the LFP. (d) A decrease in frequency, together with an increase in power, was obtained when the LED modulation was delayed relative to the LFP by ~145°. Scale bars apply to all panels.
-
Figure 2—source data 1
Figure 2 source data
- https://doi.org/10.7554/eLife.38346.005
Figure 3

Dissociable modulation of oscillation frequency and power.
(a) Dependence of frequency change on the phase relationship between the LED modulation and the LFP (positive values indicate LED phase advance relative to LFP). Changes in frequency are plotted as Fclamped/Funclamped, where the unclamped frequency was averaged from the gamma oscillation for 1 s before and 1 s after the gamma clamp was applied. Data are shown as mean ±SEM (n = 19 experiments). A positive phase difference indicates that the modulation was phase-advanced relative to the LFP. (b) Dependence of power change on the phase difference plotted as in (a). (c) Change in frequency plotted against change in power for different LED – LFP phase differences (colour code at right). (d) Average LFP and phase response (PRC) curve from Akam et al. (2012) (left). The circular cross-correlogram at right yields a prediction of the effect of a continuous modulation on the oscillation phase, and therefore on its frequency, in rough agreement with the observed relationship in (a).
-
Figure 3—source data 1
Figure 3 source data
- https://doi.org/10.7554/eLife.38346.007
Figure 4
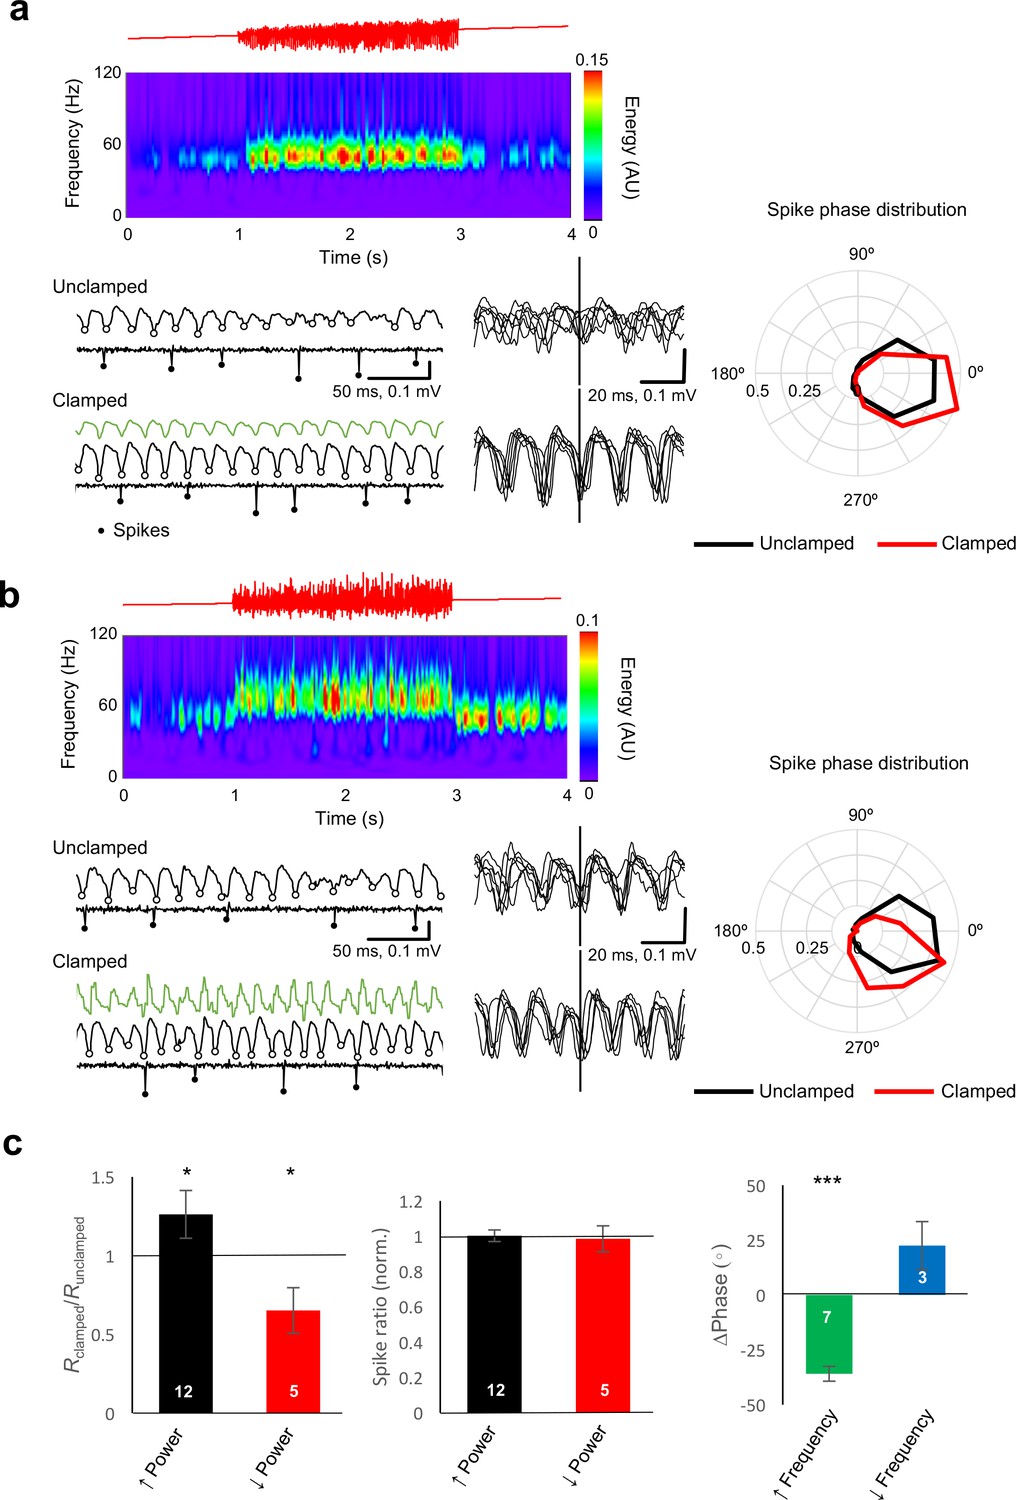
Gamma clamp alters the synchrony and phase, rather than rate, of principal cell firing .
(a) Example closed loop modulation increasing gamma power. Top: red trace showing ramp command. Middle: spectrogram. Bottom: sample traces before (Unclamped) and during (Clamped) closed-loop modulation, showing the LFP and the cell-attached recording with identified spikes highlighted. LFP troughs are indicated by open circles. Six representative LFP traces, aligned by spike time, are shown at right. The polar plot indicates the distribution of spike phase for unclamped (black) and clamped (red) periods (averaged from 32 trials). The circular histograms sample spikes in 30° bins, and show a decrease in dispersion of spike phase during gamma clamp (LFP trough = 0°). (b) Example closed loop modulation increasing gamma frequency, plotted as for (a). The polar plot indicates phase advance of spiking. (c) Left: Bidirectional changes in power were associated with corresponding changes in the vector length (R) obtained by averaging all spike phases. This is consistent with a decrease in phase dispersion observed with an increase in power, and conversely, an increase in phase scatter with a decrease in power. Changes in power, however, did not affect the average rate of spiking, when compared with trials when gamma clamp was not applied (middle). Right: increased gamma frequency was associated with a significant phase advance of spiking. *p<0.05; ***p<0.001. Numbers of experiments are indicated in the bars.
-
Figure 4—source data 1
Figure 4 source data
- https://doi.org/10.7554/eLife.38346.009
Figure 5
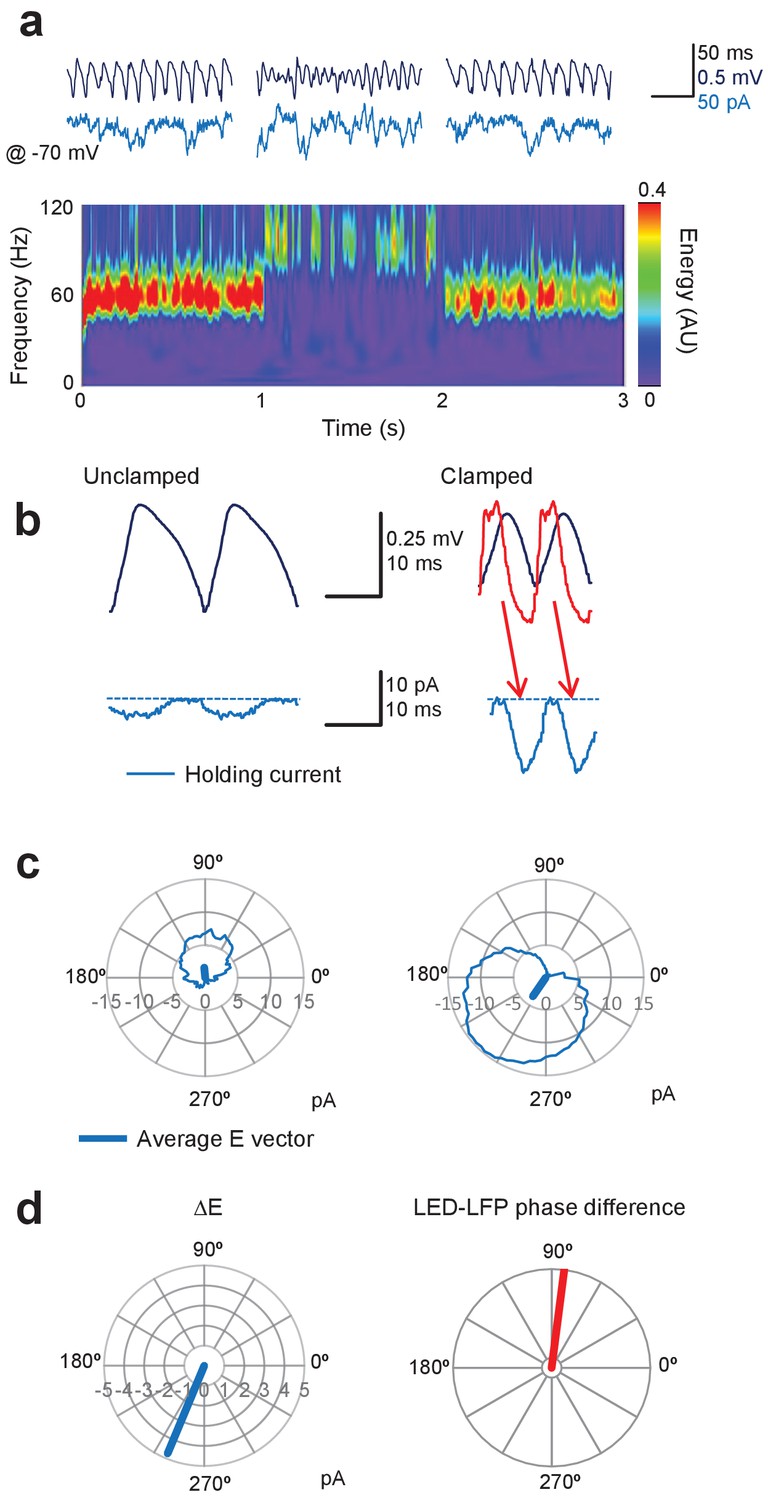
Gamma clamp imposes a phasic excitatory current to pyramidal neurons.
(a) Top: sample LFP (navy) and simultaneously recorded holding current in one pyramidal neuron held at –70 mV (blue) before, during and after feedback modulation increasing oscillatory frequency. Bottom: spectrogram. (b) Two cycles of the average LFP waveform and membrane current without (Unclamped) and with gamma clamp (Clamped). The average phase-advanced LED command during feedback modulation is shown superimposed (red). The minimum (least negative) inward current was subtracted (dashed lines) to estimate the phasic excitation. The red arrows indicate the temporal relationship between the peak LED driver command and the maximal excitatory current. Bottom: polar plots indicating the cycle-average of the excitatory current during unclamped (left) and clamped (right) periods of the trial shown in (a). The vectors indicate the average phases of the currents. (c) Left: difference vector obtained from the vectors in (b), representing the net phasic excitatory current imposed by gamma clamp. Right: phase difference between LED and LFP for the same experiment.
-
Figure 5—source data 1
Figure 5 source data
- https://doi.org/10.7554/eLife.38346.011
Figure 6

Excitatory current phase determines changes in frequency and power.
(a) Change in gamma frequency and power, plotted against the phase of the net excitatory current (ΔE) calculated as in Figure 5. Confidence intervals are SEM (n = 13). (b) Fclamped/Funclamped plotted against Pclamped/Punclamped for different excitatory current phases, indicated by the colour code below, aligned with the average LFP waveform. Pyramidal neurons spike around the trough of the LFP (0°).
-
Figure 6—source data 1
Figure 6 source data
- https://doi.org/10.7554/eLife.38346.013
Figure 7

Gamma clamp afffects phasic inhibitory currents in pyramidal neurons.
(a) Top: sample LFP (navy) and simultaneously recorded holding current in one pyramidal neuron held at 0 mV (blue) before, during and after feedback modulation increasing oscillatory frequency. Bottom: spectrogram. Same cell as in Figure 5. (b) Two cycles of the average LFP waveform and membrane current without (Unclamped) and with gamma clamp (Clamped). The average phase-advanced LED command during feedback modulation is shown superimposed (red). The minimum (least positive) outward current was subtracted (dashed lines) to estimate the phasic inhibition. (c) Polar plots indicating the cycle-average of the inhibitory current during unclamped (left) and clamped (right) periods of the trial shown in (a). The vectors indicate the average phases of the currents. (d) Left: phasic inhibition (vertical scale) plotted against phasic excitation (horizontal scale) estimated by aligning cycle-average membrane conductances by the LFP without (black) and with (red) oscillation clamp with +83° LED-LFP phase advance. Same cell and clamp regime as shown in (a–c). Right: representative example of excitatory and inhibitory conductances obtained with 133° LED-LFP phase delay. Same cell but different clamp regime. The cycles are arbitrarily anchored to the trough of the LFP (*). The arrows indicate the direction of the excursion.
-
Figure 7—source data 1
Figure 7 source data
- https://doi.org/10.7554/eLife.38346.015
Tables
Key resources table
| Reagent type (species) or resource | Designation | Source or reference | Identifiers | Additional information |
|---|---|---|---|---|
| Strain, strain background (Mus musculus) | Wild type, C57bl6 mice | UCL Biological Services | ||
| Genetic reagent | Viral vector (C1V1): AAV5-CaMKIIa-C1V1(E122T/E162T)-TS-eYFP | UNC Vector Core | Serotype: 5 C1V1: AAV-CaMKIIa- C1V1(E122T/E162T)- TS-EYFP | |
| Other | Equipment (viral injections): Sterotaxic frame | Kopf Instruments | Model 900 | |
| Chemical compound, drug | Salts, drugs | Sigma | ||
| Other | Equipment (LED light source) | Cairn Instruments | OptoLED, 590 nm | |
| Other | Equipment (LED light source) Custom assembled LED | Thorlabs | High-power mounted LED: M590L2; Tube lens: SM1V10; Planoconvex lens: LA1951-A-N-BK7; Coupler: SM1T2; Adapter for microscope: SM1A14 | |
| Other | Equipment (LED driver) | Thorlabs | DC2100 | |
| Other | Equipment (Upright microscope) | Olympus | BX51WI, UMPLFLN 20X W IR | |
| Other | Equipment (Upright microscope) | Scientifica | SliceScope, UMPLFLN 20X W IR | |
| Other | Equipment (Amplifier) | Molecular Devices | Multiclamp 700B | |
| Other | Equipment (Data acquisition card) | National Instruments | PCI-6221 | |
| Other | Equipment (computing) Real-time controller | National Instruments | cRIO-9022 | |
| Other | Equipment (computing). FPGA | Xilinx | Virtek-5 | |
| Software, algorithm | LabVIEW | National Instruments | LabVIEW, LabVIEW Real-Time 2013, 2014, 2015, 2016, 2017 | Custom virtual instruments |
| Software, algorithm | R | www.R-project.org | Ver. 3.3.0 for Mac |
Additional files
-
Transparent reporting form
- https://doi.org/10.7554/eLife.38346.016
Download links
A two-part list of links to download the article, or parts of the article, in various formats.
Downloads (link to download the article as PDF)
Open citations (links to open the citations from this article in various online reference manager services)
Cite this article (links to download the citations from this article in formats compatible with various reference manager tools)
Analogue closed-loop optogenetic modulation of hippocampal pyramidal cells dissociates gamma frequency and amplitude
eLife 7:e38346.
https://doi.org/10.7554/eLife.38346


