Human T cell receptor occurrence patterns encode immune history, genetic background, and receptor specificity
- Fred Hutchinson Cancer Research Center, United States
- University of Washington, United States
Figures
Figure 1
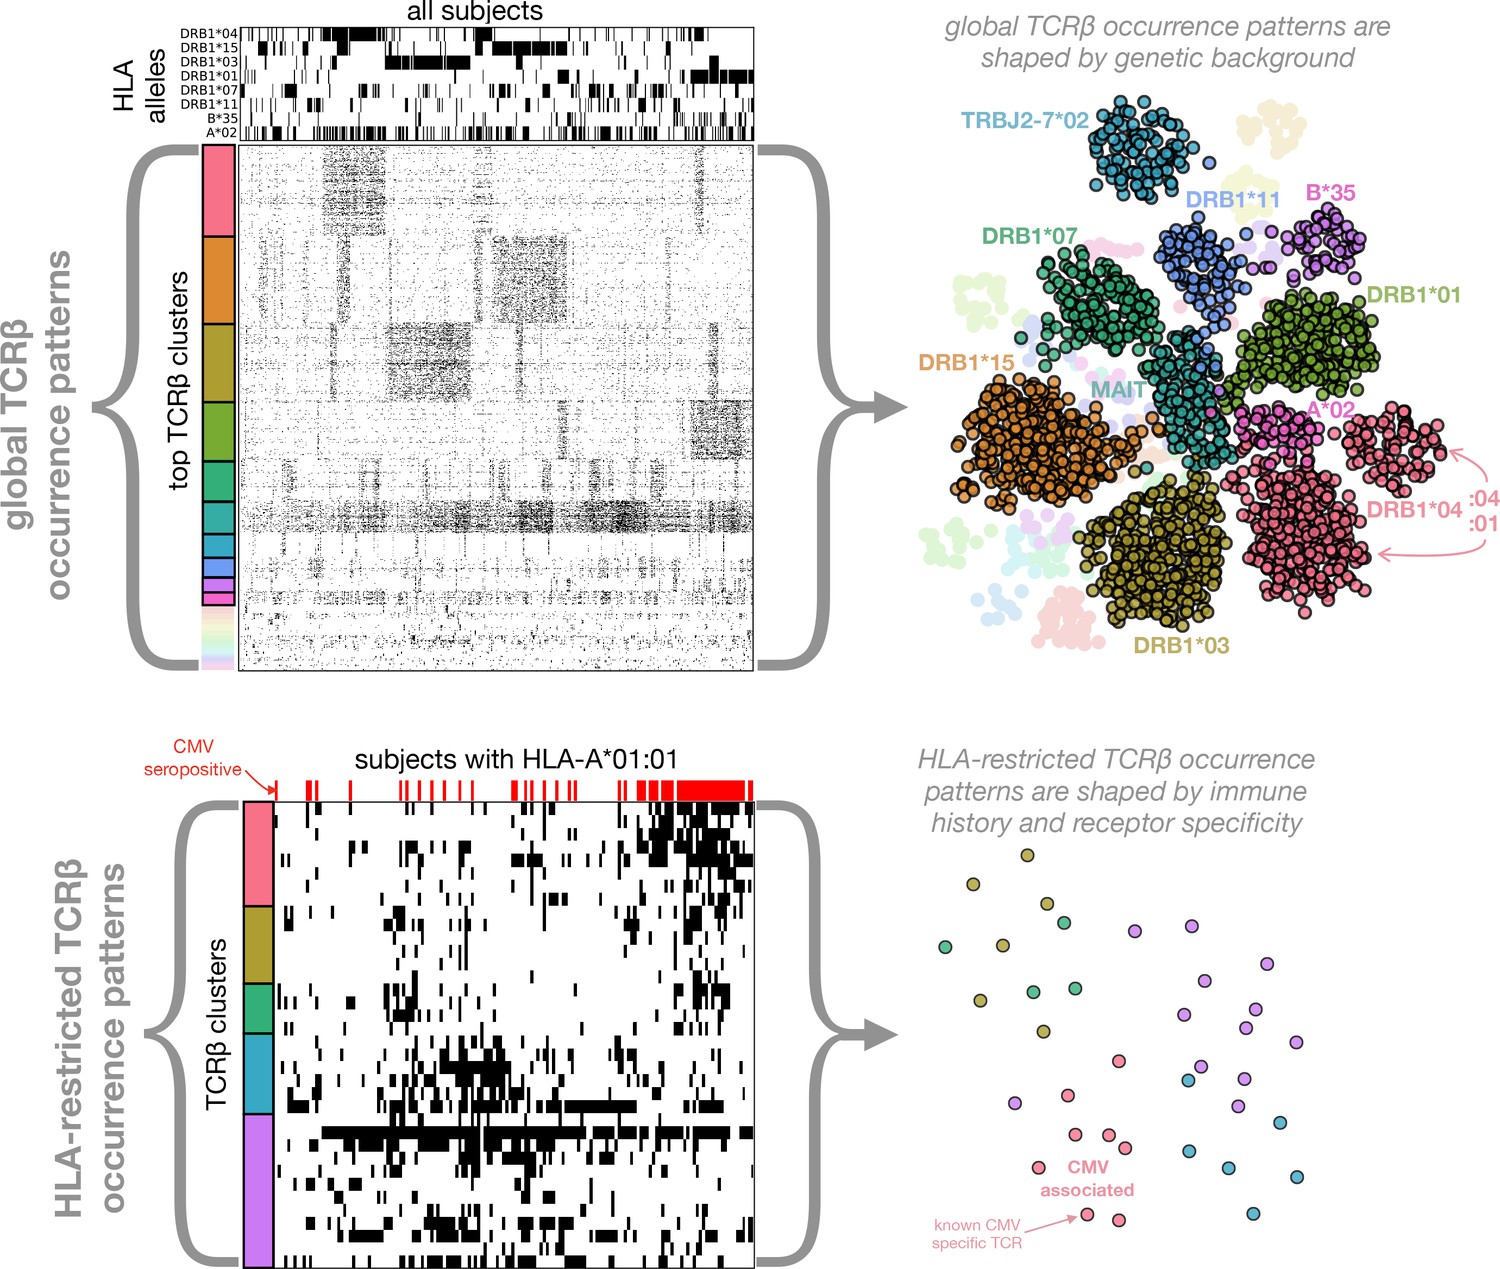
Clustering of TCR occurrence patterns across the full cohort (top) and within a cohort subset defined by a shared HLA allele (bottom).
As described in detail in the following sections, we used covariation analysis to identify clusters of co-occurring TCR chains. Here we provide a graphical introduction to these results by depicting occurrence patterns of clustered TCRs over the full cohort and over a cohort subset defined by a single HLA allele (HLA-A*01:01). TCR clusters over the full cohort are largely driven by the occurrence patterns of specific HLA alleles (compare the occurrence patterns of the top five global clusters to those of the top 5 HLA alleles, respectively), whereas HLA-restricted clusters may reflect shared immune exposures, as illustrated here by a CMV-associated TCR cluster (the pink cluster in the bottom panels). In the top left panels, occurrence patterns of HLA alleles and TCR chains (rows) are indicated for each of the cohort subjects (columns) by filled (black) matrix elements. The TCR chains chosen for depiction in the occurrence matrix are the members of the global co-occurrence clusters identified in section 'Globally co-occurring TCR pairs form clusters defined by shared associations'. The TCRs (rows) are ordered by cluster membership as indicated by colored bands to the left of the matrix. The selected HLA alleles correspond to the strongest associations for the top clusters (two of which are not HLA-associated). The cohort subjects are ordered by column similarity so as to emphasize block structure present in the matrix. The bottom left panels similarly show occurrence patterns for HLA-A*01:01-associated TCR chain clusters over the subset of subjects carrying this allele, alongside an indicator of cytomegalovirus seropositivity for each subject (red). In-depth analysis of these (and other) HLA-associated TCR clusters is presented in section 'HLA-restricted TCR clusters'. For visualization purposes, two-dimensional embeddings of the TCR chains based on their occurrence patterns (binary strings representing presence/absence in the subjects) are depicted in the right panels, with the TCR chains colored by cluster assignment and annotated by known associations.
Figure 2
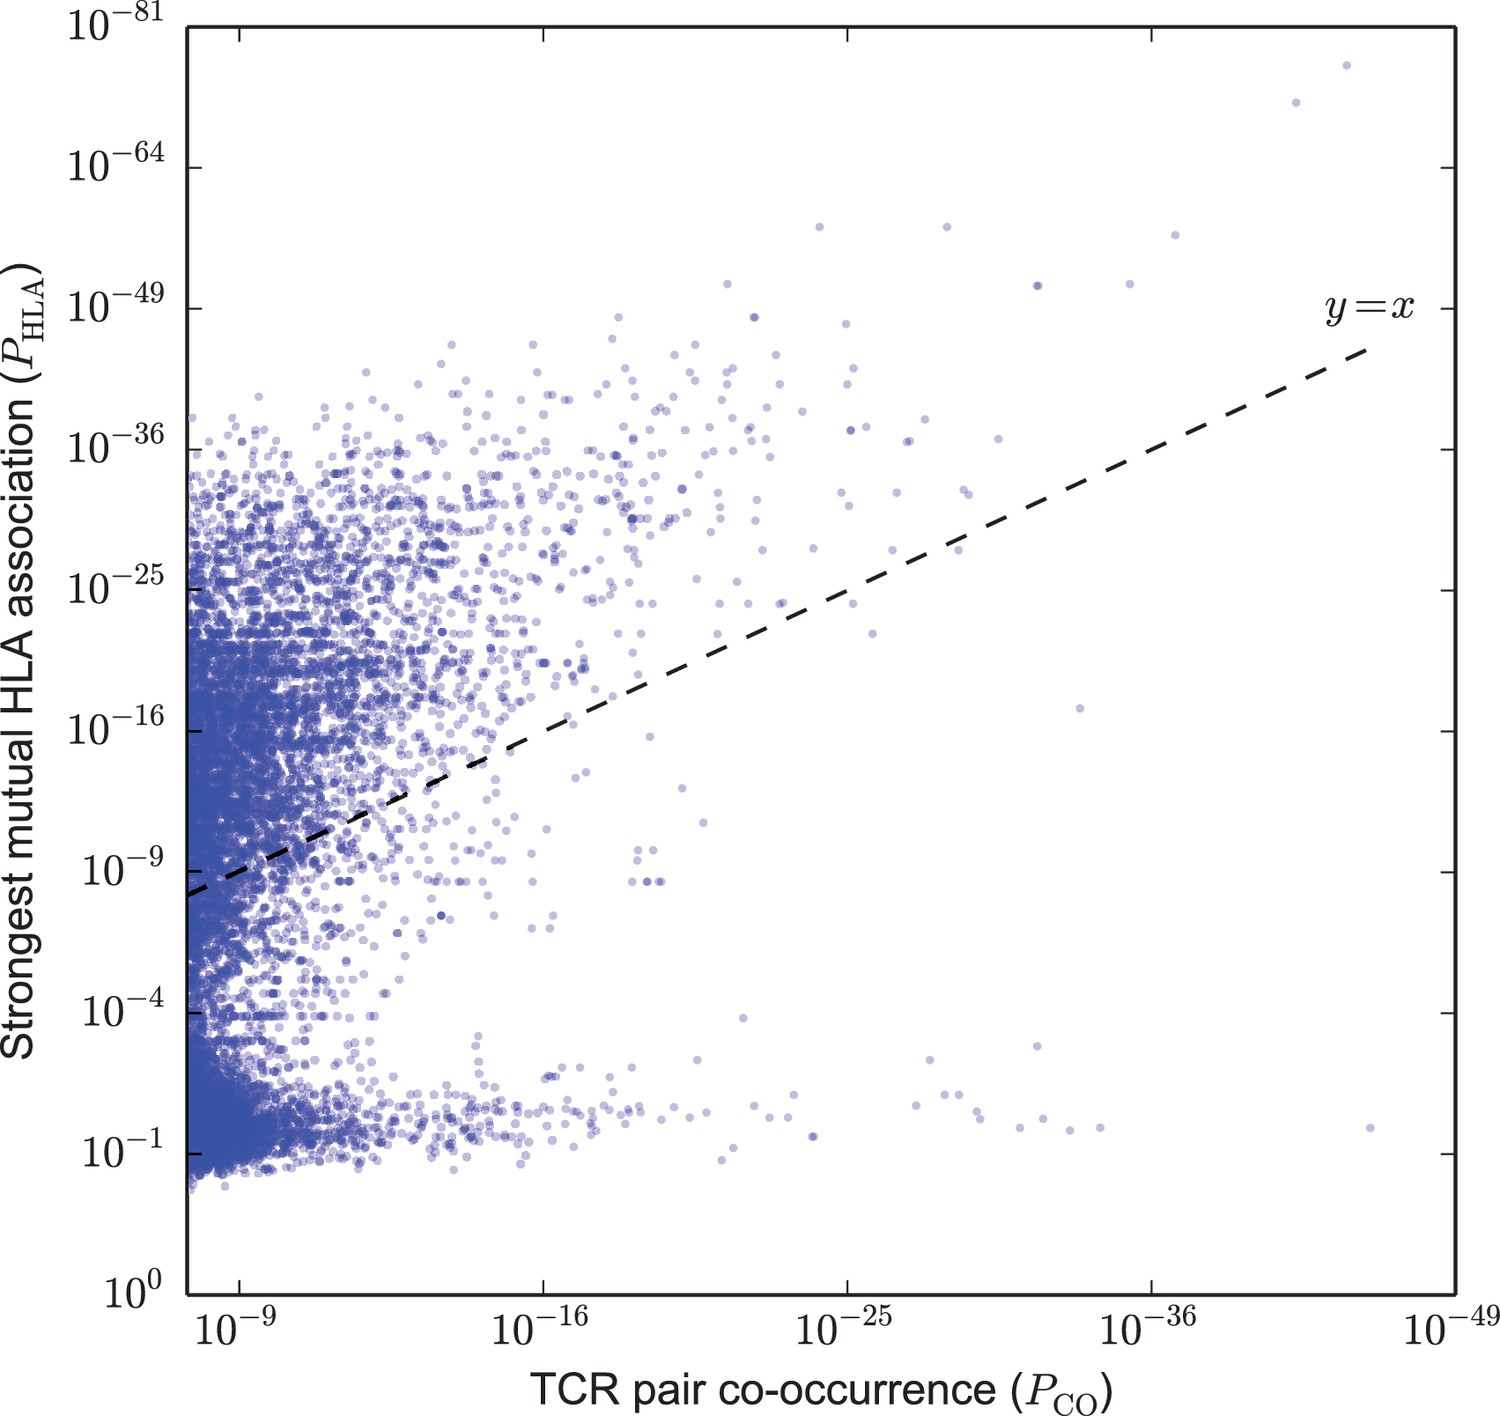
Strongly co-occurring TCR pairs form two broad classes distinguished by HLA-association strength.
The co-occurrence p-value for each pair of public TCRs is plotted (-axis) against the HLA-association p-value for the HLA allele with the strongest mutual association with that TCR pair (-axis). There are TCR-pairs above the diagonal () and pairs below the diagonal.
-
Figure 2—source data 1
TCR pairs and corresponding and values.
- https://doi.org/10.7554/eLife.38358.005
Figure 3 with 3 supplements
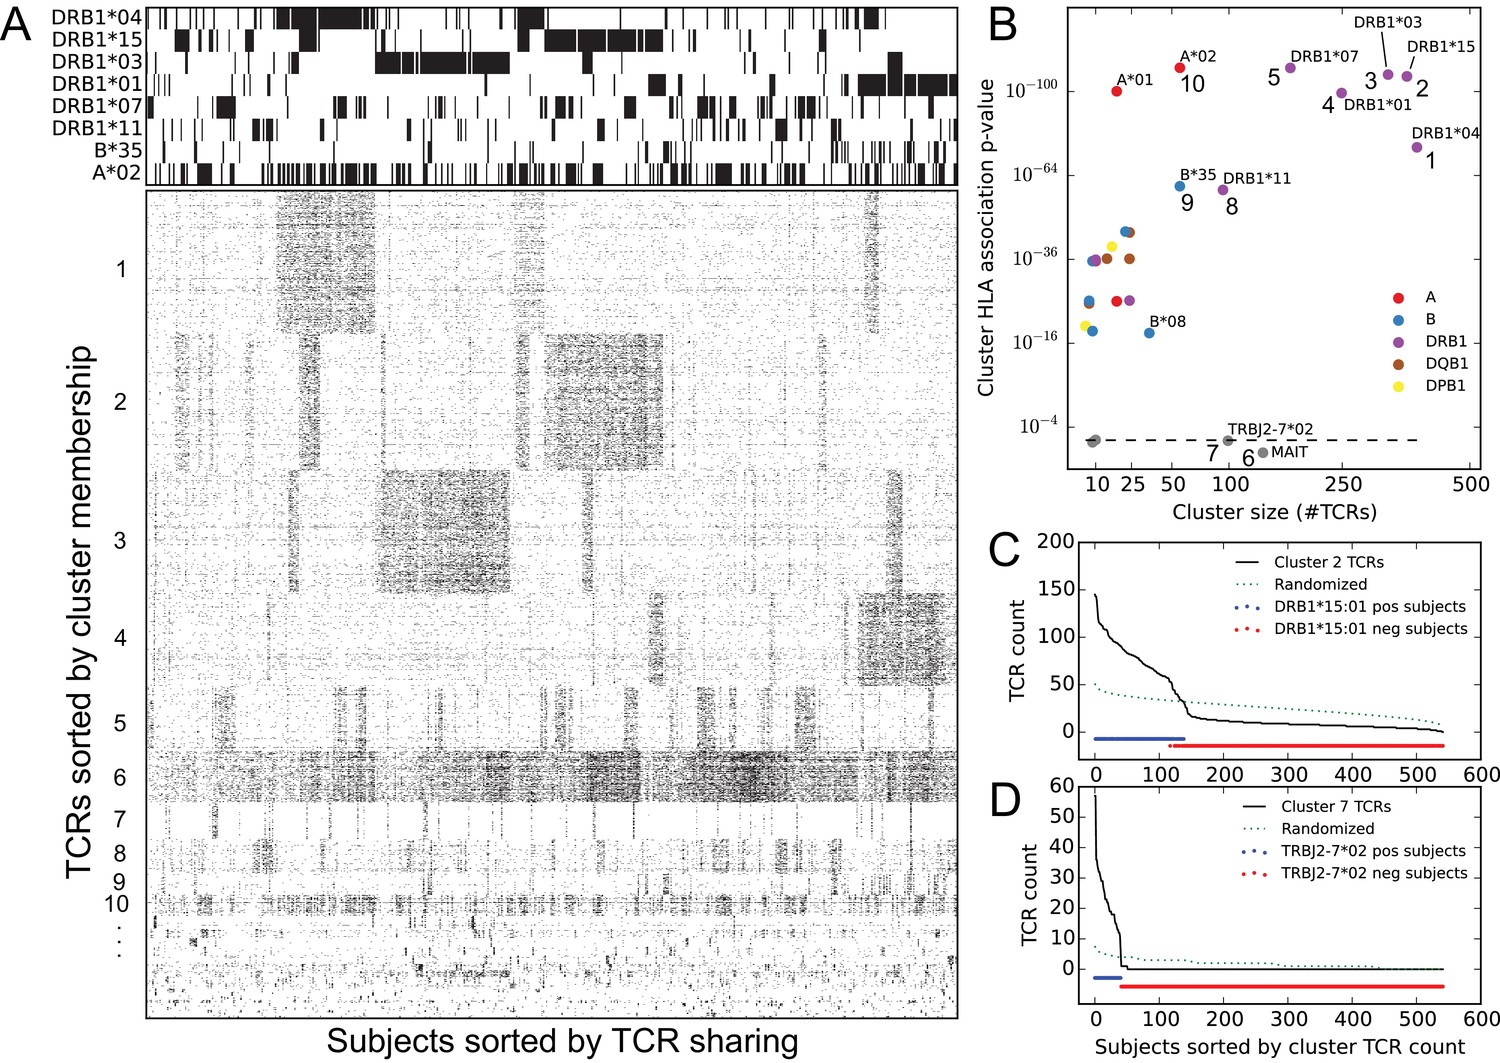
Clustering public TCR chains by co-occurrence over the full cohort identifies associations with HLA and TRBJ alleles as well as an invariant T cell subset.
(A) Graphical representations of the TCR chain occurrence matrix (lower left) and the HLA-allele occurrence matrix (upper left), restricted to members of the global co-occurrence TCR clusters and the associated HLA alleles for the top clusters, respectively. TCR chains (rows) are ordered by cluster membership and subjects (columns) are ordered by column similarity (Jaccard distance of TCR sets) to emphasize block structure present in the matrix. (B) Cluster size (-axis) versus the p-value of the most significant HLA allele association (-axis), with markers colored according to the locus of the associated allele. Dashed line indicates random expectation based on the total number of alleles, assuming independence. (C) Count of cluster member TCRs found in each subject for the cluster labeled ‘2’ in panel (B) (top right). The dotted line represents an averaged curve based on randomly and independently selecting subject sets for each member TCR. Red and blue dots indicate the occurrence of the DRB1*15:01 allele in the cohort. (D) Count of cluster member TCRs found in each subject for the cluster labeled ‘7’ in panel (B) (center bottom). The dotted line again represents a control pattern, and the red and blue dots indicate the occurrence of the TRBJ2-7*02 allele.
-
Figure 3—source data 1
Cluster sizes and HLA-allele association p-values.
- https://doi.org/10.7554/eLife.38358.010
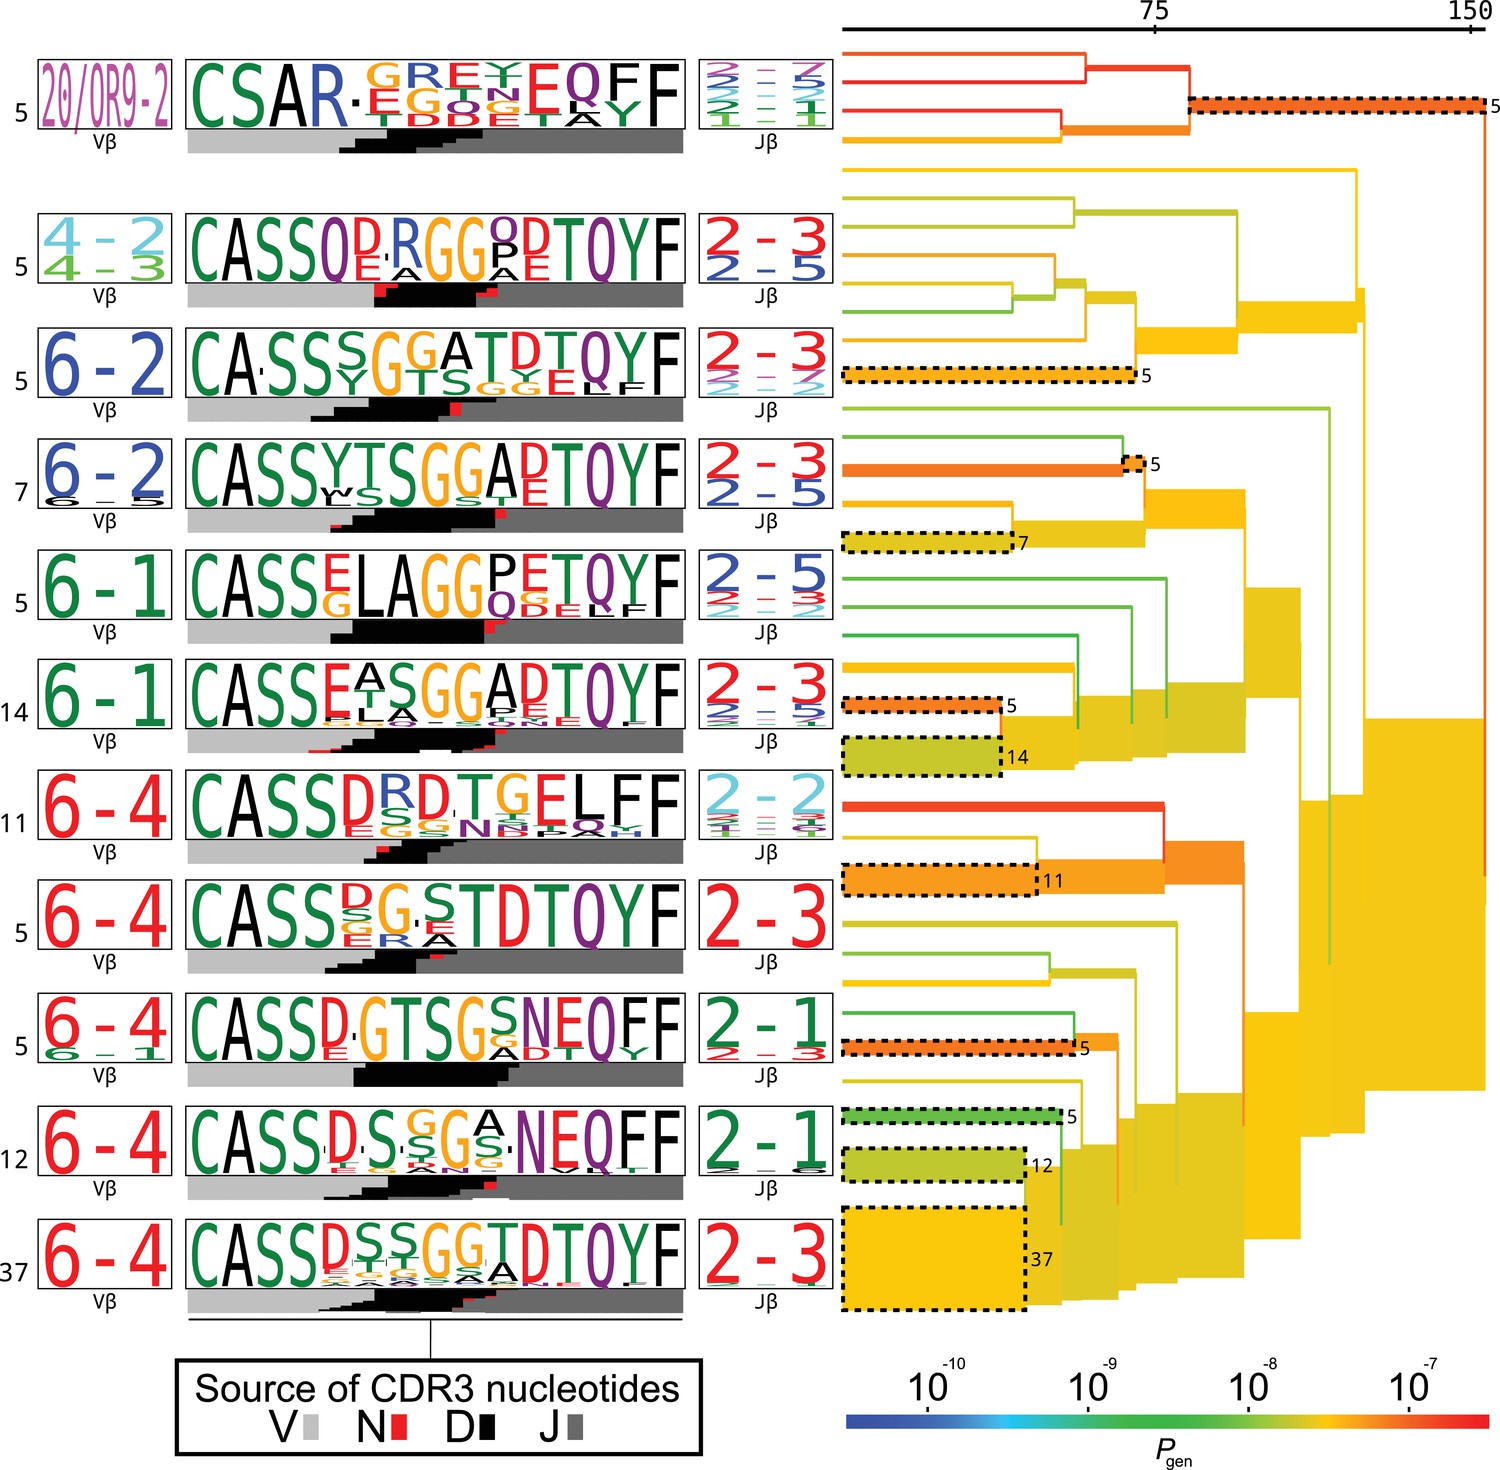
Figure 3—figure supplement 1
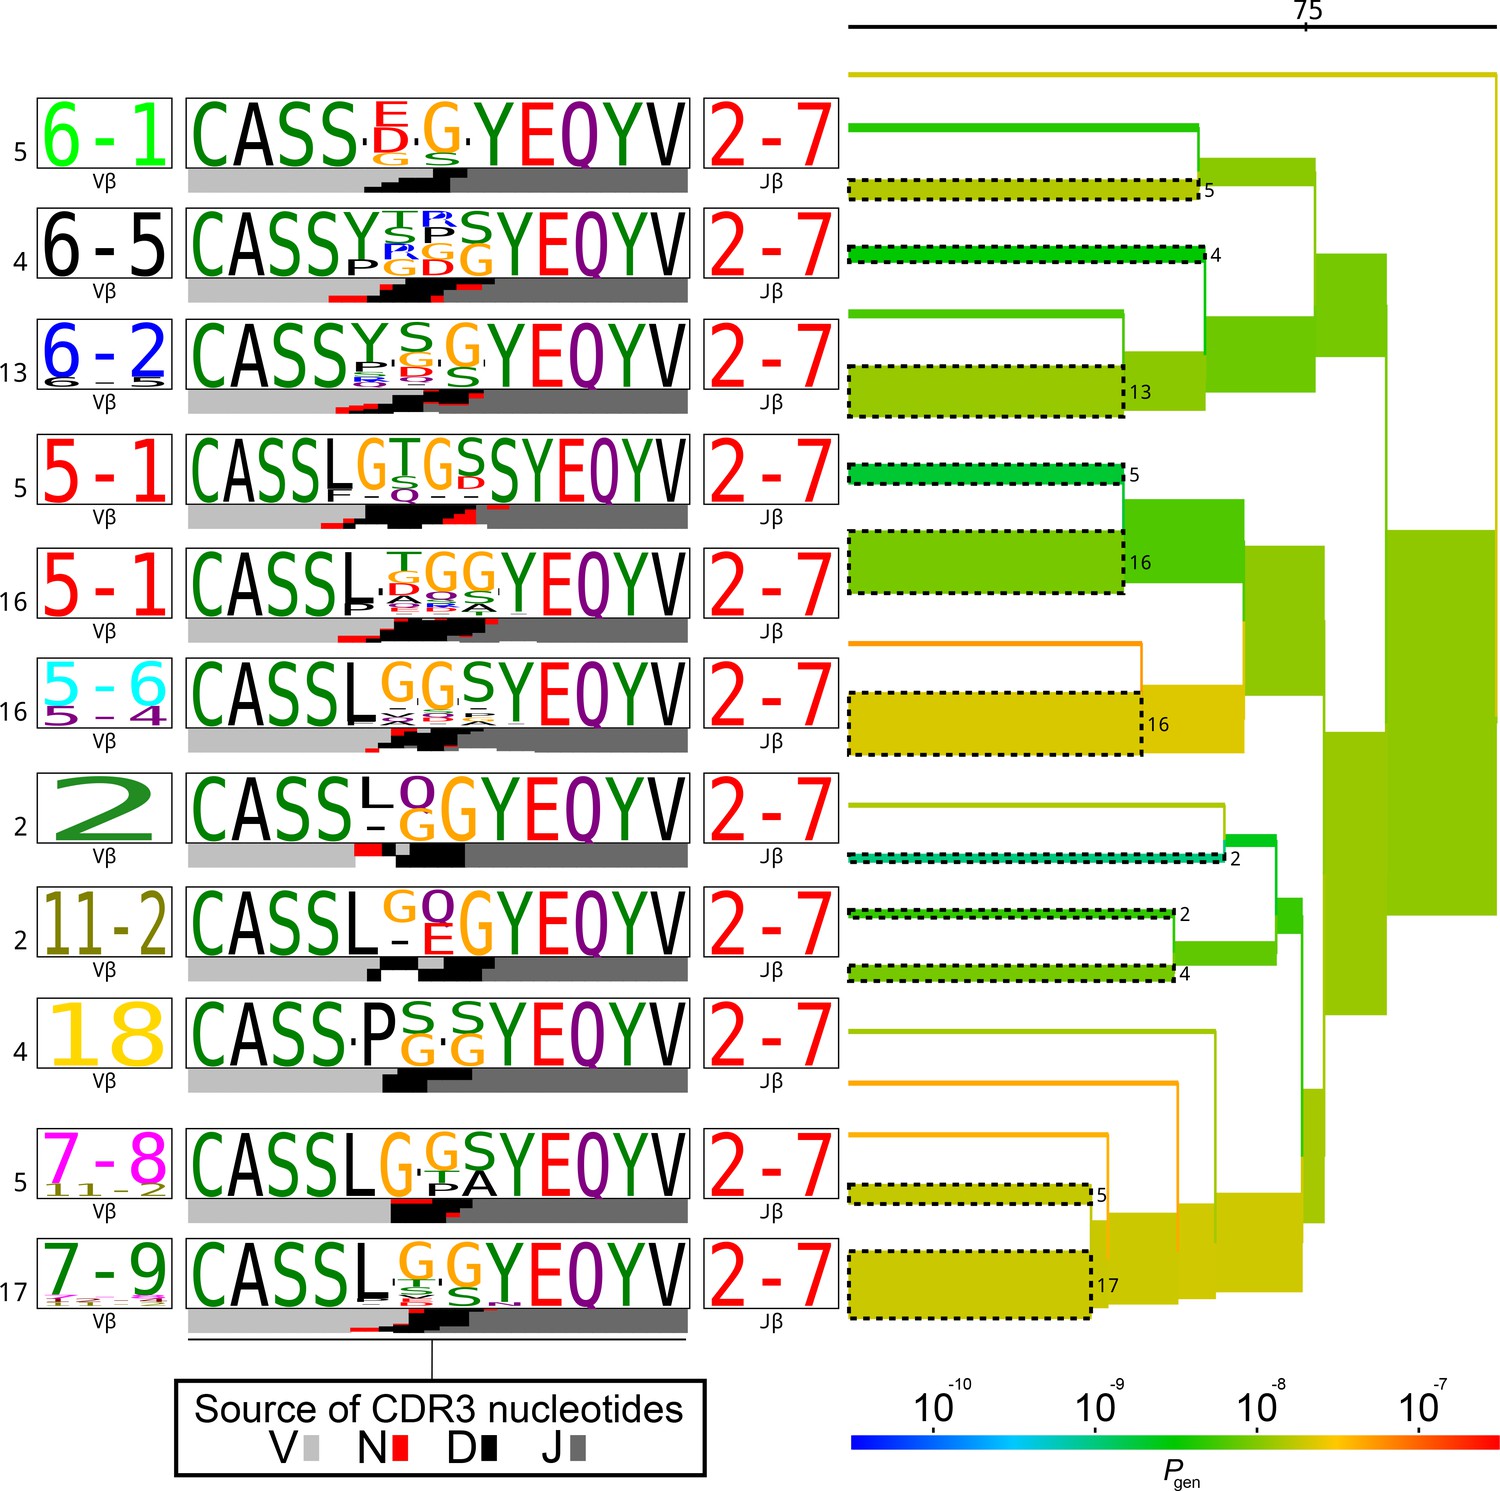
TCRdist tree of the members of the TRBJ2-7*02-associated cluster.
TCRdist tree of the members of the TRBJ2-7*02-associated cluster. Average-linkage dendrogram of TCRdist receptor clusters colored by generation probability (), with TCR logos for selected receptor subsets (the branches of the tree enclosed in dashed boxes labelled with size of the TCR clusters). Each logo depicts the V- (left side) and J- (right side) gene frequencies, CDR3 amino acid sequences (middle), and inferred rearrangement structure (bottom bars coloured by source region, light grey for the V-region, dark grey for J, black for D, and red for N-insertions) of the grouped receptors.
Figure 3—figure supplement 2
TCRdist tree of the members of the putative MAIT cell cluster.
TCRdist tree of the members of the putative MAIT cell cluster. Average-linkage dendrogram of TCRdist receptor clusters colored by generation probability (), with TCR logos for selected receptor subsets (the branches of the tree enclosed in dashed boxes labelled with size of the TCR clusters). Each logo depicts the V- (left side) and J- (right side) gene frequencies, CDR3 amino acid sequences (middle), and inferred rearrangement structure (bottom bars coloured by source region, light grey for the V-region, dark grey for J, black for D, and red for N-insertions) of the grouped receptors.
Figure 3—figure supplement 3
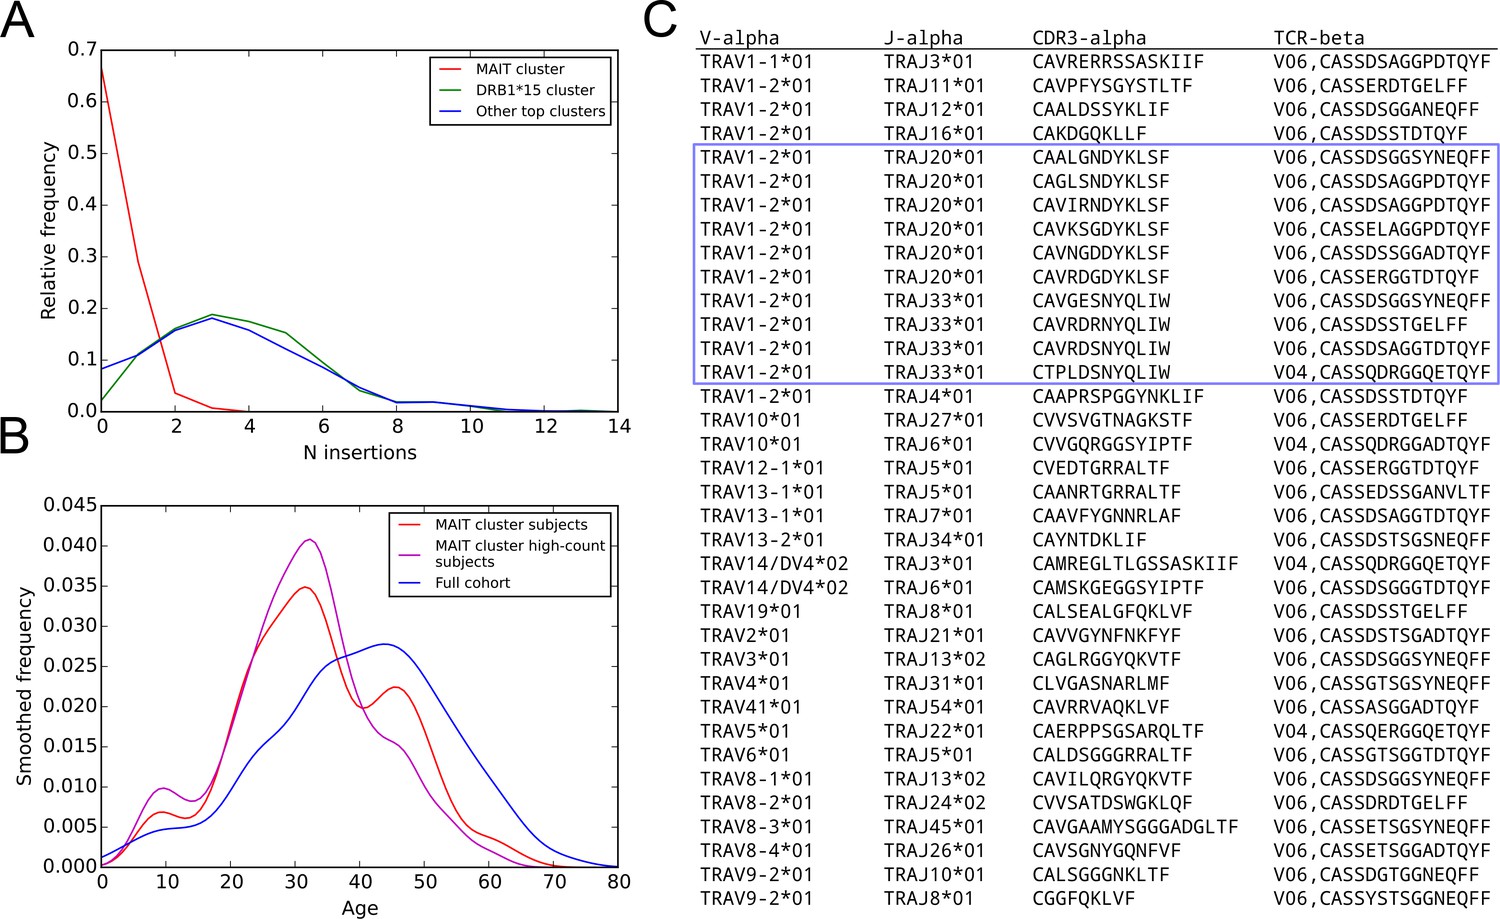
More details on the MAIT cell cluster: subject age and N-nucleotide insertion distributions; TCR chains paired with cluster member TCR chains in the pairSEQ dataset of (Howie et al., 2015).
Further details on the putative MAIT cell TCR cluster. (A) Distribution of N-nucleotide insertions for TCR chains in the MAIT cluster (red), in the DRB1*15-associated cluster (green), and in the union of the members of the top 10 clusters (excluding the members of the MAIT cluster, blue). MAIT cell cluster members have very few N-insertions relative to the members of the other clusters. (B) Subjects enriched for MAIT cluster TCRs (red curve) are younger than the cohort as a whole (blue curve), a trend that is further strengthened in the top half of the enriched subjects by member-TCR count (the ‘high-count subjects’, magenta curve). (C) TCR chains paired with MAIT cluster TCR chains in the pairSEQ dataset of (Howie et al., 2015). Ten of the 36 paired TCR chains match the MAIT sequence consensus (TRAV1-2, TRAJ20 or TRAJ33, and a 12 residue CDR3, enclosed in the blue box).
Figure 4 with 2 supplements
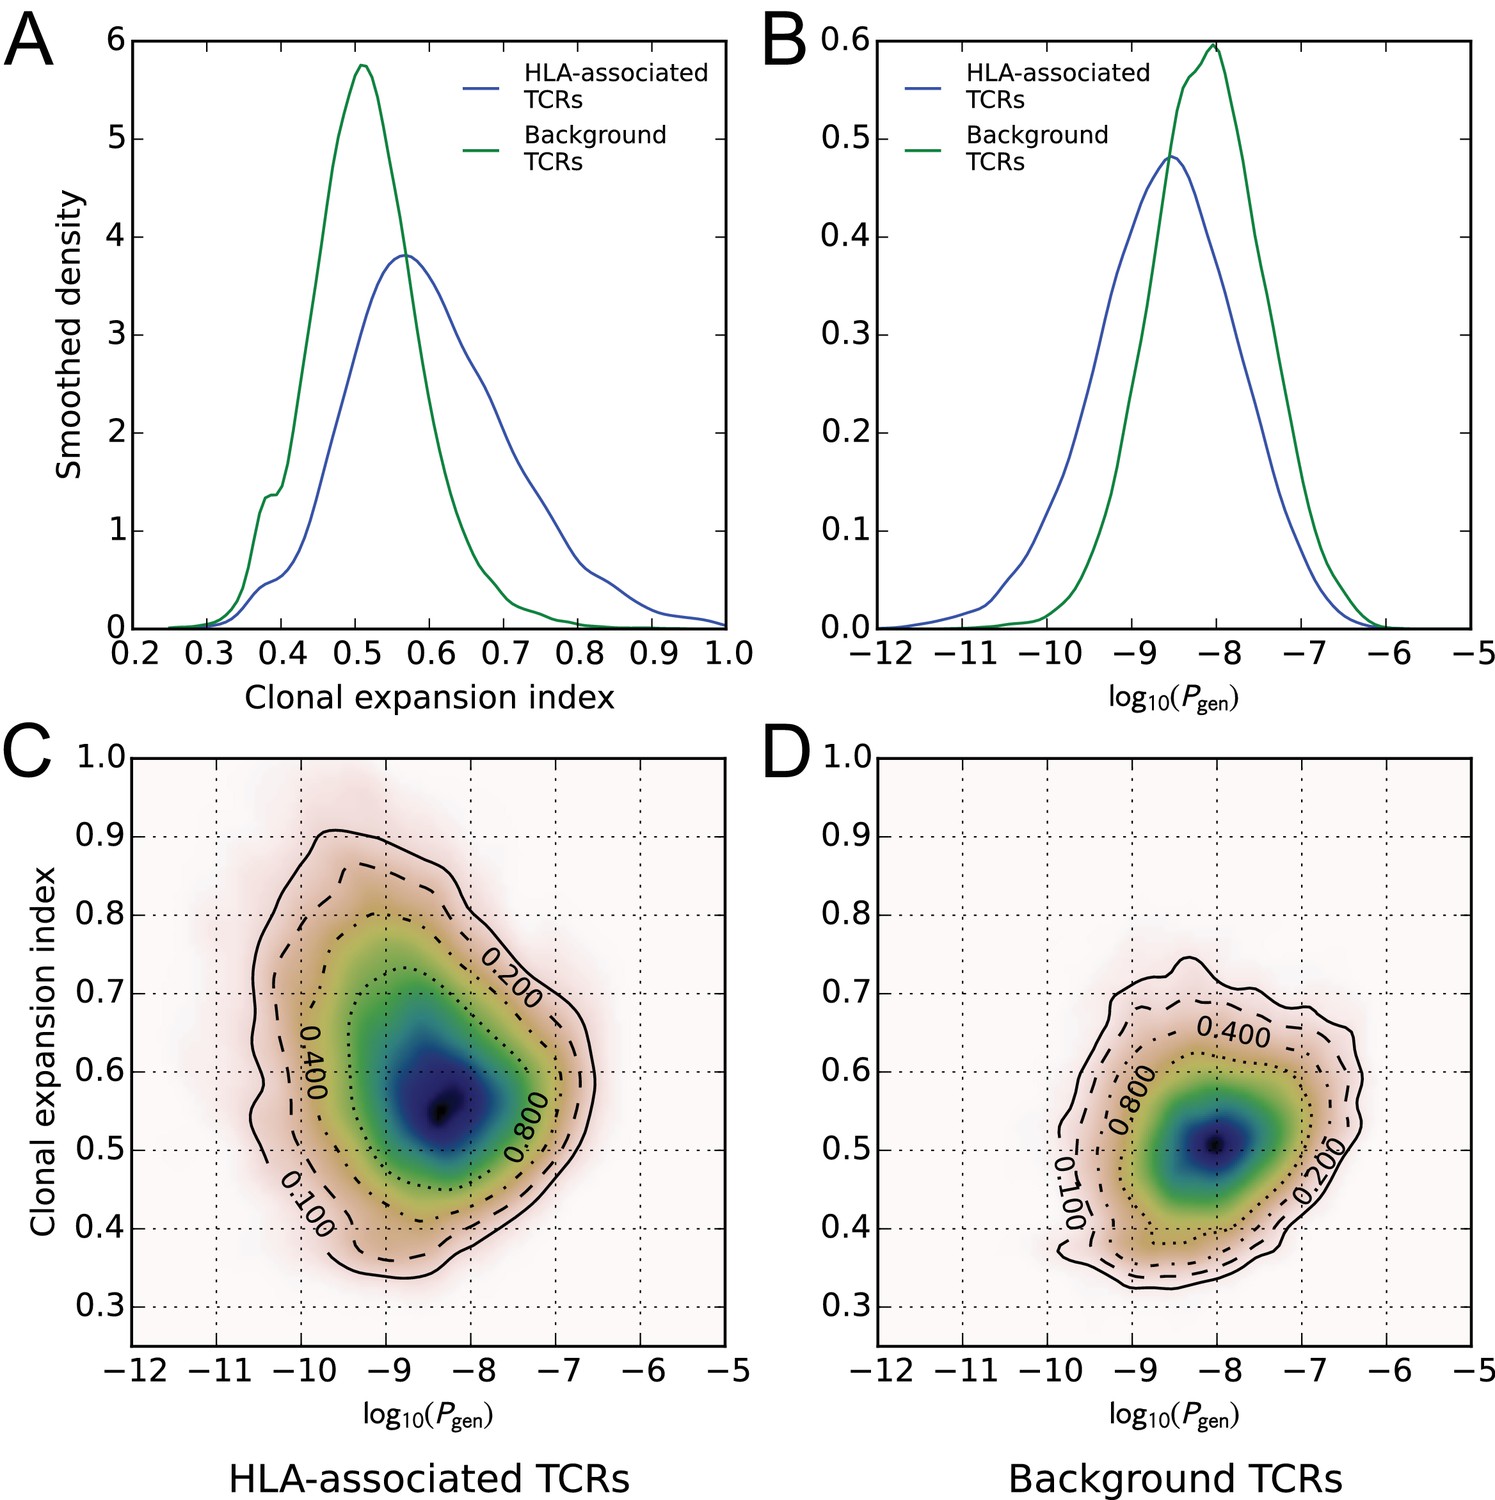
HLA-associated TCRs are more clonally expanded and have lower generation probabilities than equally common, non-HLA associated TCRs.
(A) Comparison of clonal expansion index distributions for the set of HLA-associated TCRs (blue) and a cohort-frequency matched set of non HLA-associated TCRs (green). (B) Comparison of VDJ-rearrangement TCR generation probability () distributions for the set of HLA-associated TCRs (blue) and a cohort-frequency matched set of non HLA-associated TCRs (green). (C) Two-dimensional probability density function (PDF) for the distribution of versus clonal expansion index for HLA-associated TCRs. Contours indicate level sets of the PDF. (D) Two-dimensional probability density function (PDF) for the distribution of versus clonal expansion index for background (non HLA-associated) TCRs whose cohort frequencies match the TCRs in (C).
-
Figure 4—source data 1
Generation probabilities, clonal expansion indices, and allele associations for the TCRs analyzed here.
- https://doi.org/10.7554/eLife.38358.015
Figure 4—figure supplement 1
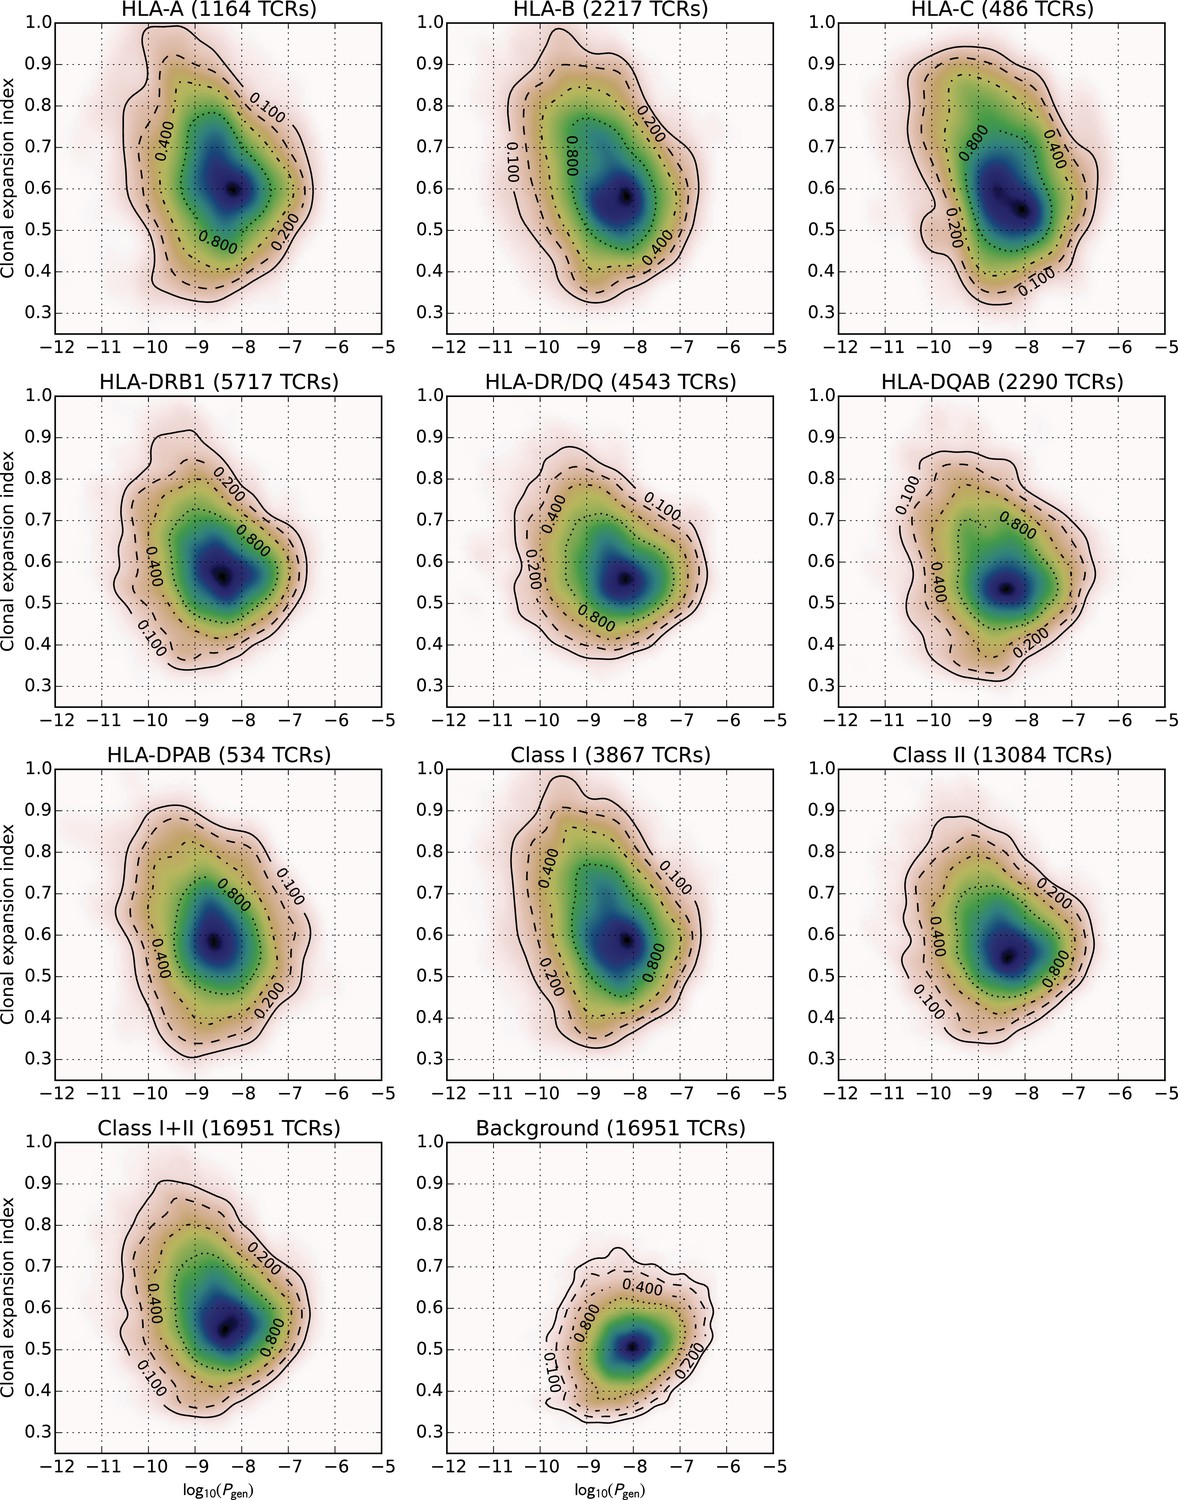
Two-dimensional feature distributions for HLA-associated TCR subsets defined by HLA locus.
Two-dimensional distributions of TCR generation probability (-axis, ) and clonal expansion index (-axis) for TCRs with the indicated HLA associations (panel headers), and for a background set of non-HLA associated, cohort-frequency matched TCRs.
Figure 4—figure supplement 2
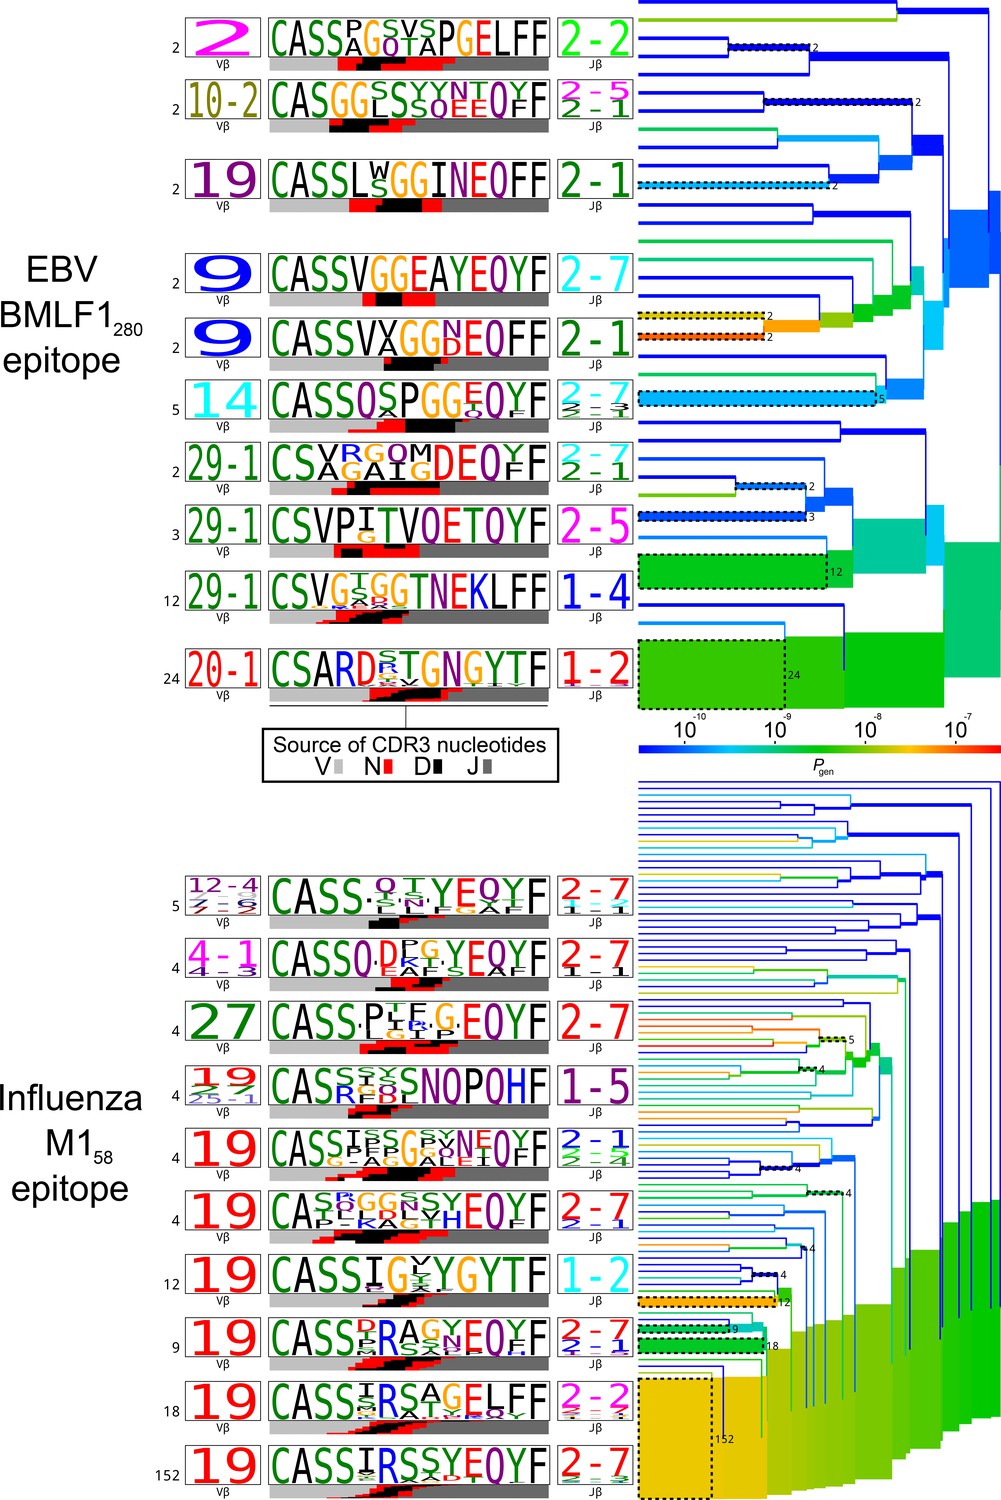
TCRdist trees of experimentally determined pathogen-responsive TCR chains for two immunodominant epitopes, EBV BMLF1 and influenza M1, for comparison with TCR chains listed in Table 1.
TCRdist trees of experimentally determined pathogen-responsive TCR chains for two immunodominant epitopes, EBV BMLF1 and influenza M1. TCR beta chain sequences were taken from the dataset of (Dash et al., 2017). On the right-hand side are average-linkage dendrograms of TCRdist receptor clusters colored by generation probability (). TCR logos for selected receptor subsets (the branches of the tree enclosed in dashed boxes labelled with size of the TCR clusters) are shown on the left. Each logo depicts the V- (left side) and J- (right side) gene frequencies, CDR3 amino acid sequences (middle), and inferred rearrangement structure (bottom bars coloured by source region, light grey for the V-region, dark grey for J, black for D, and red for N-insertions) of the grouped receptors.
Figure 5 with 1 supplement
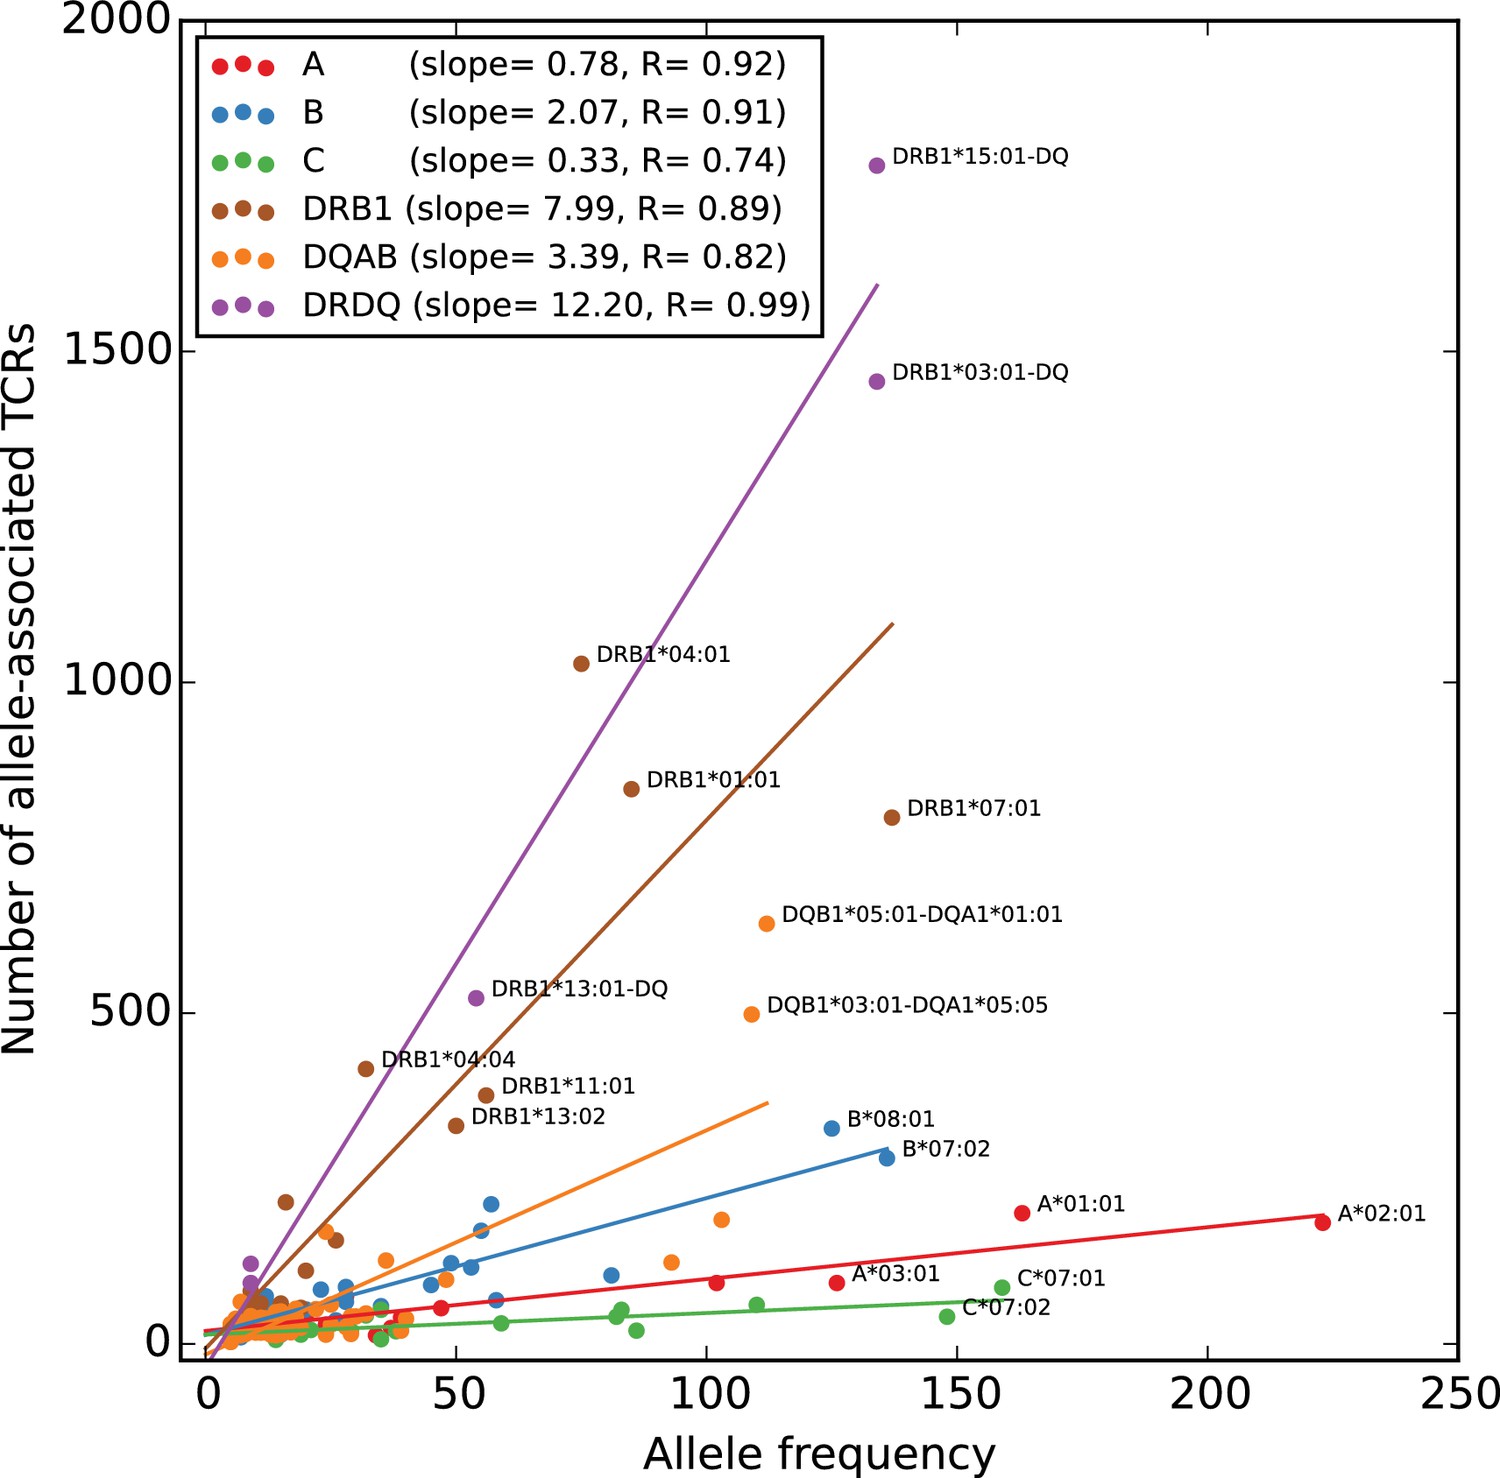
Rates of TCR association vary substantially across HLA loci.
The number of HLA-associated TCRs (-axis) is plotted as a function of allele frequency in the cohort (-axis). Best fit lines are shown for each locus and also for the set of five DR/DQ haplotypes (‘DRDQ’) which could not be separated into component alleles in this cohort. The following DR-DQ haplotype abbreviations are used: DRB1*03:01-DQ (DRB1*03:01-DQA1*05:01-DQB1*02:01), DRB1*15:01-DQ (DRB1*15:01-DQA1*01:02-DQB1*06:02), and DRB1*13:01-DQ (DRB1*13:01-DQA1*01:03-DQB1*06:03).
-
Figure 5—source data 1
Allele frequencies and numbers of associated TCRs.
- https://doi.org/10.7554/eLife.38358.018
Figure 5—figure supplement 1
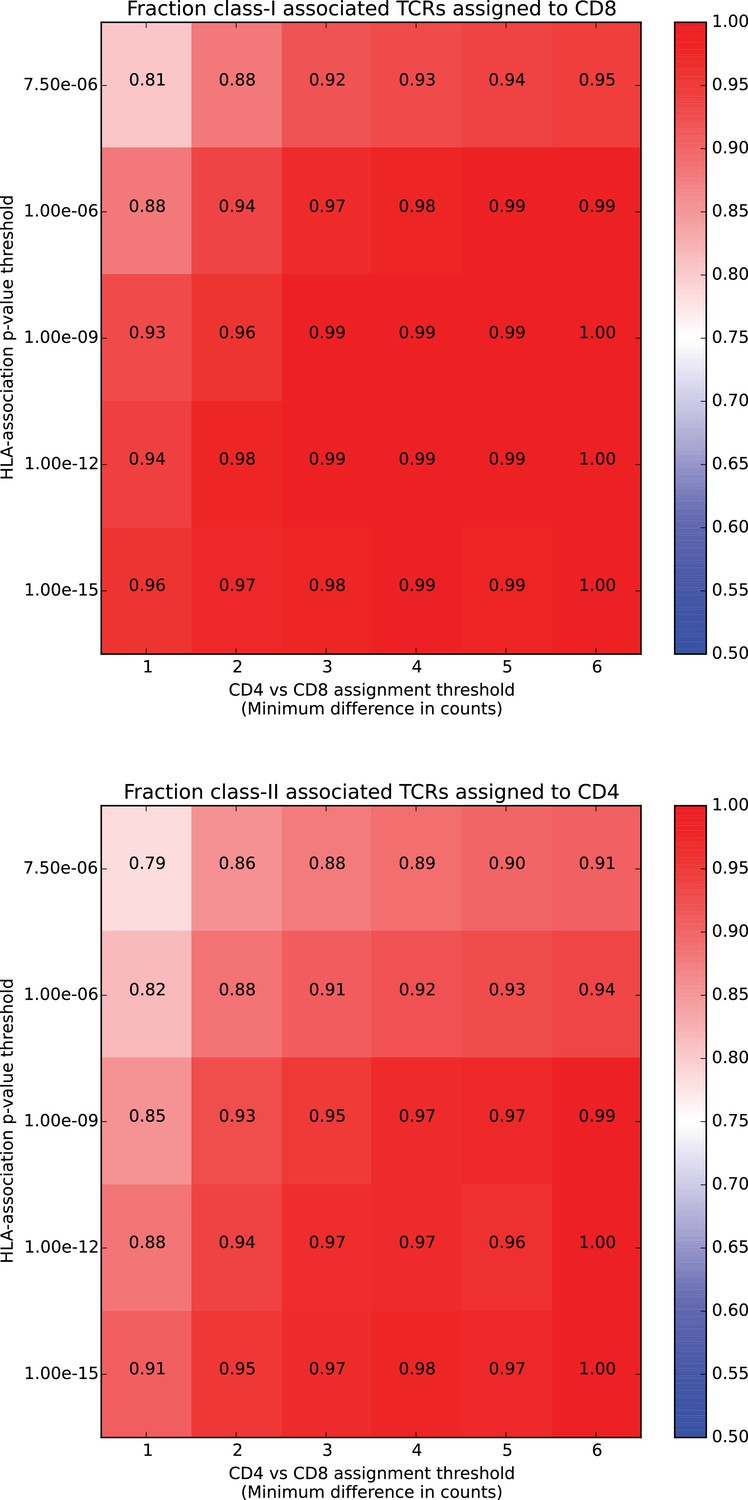
HLA class associations are concordant with CD4/CD8 assignments based on independent repertoire data.
HLA class associations are concordant with CD4/CD8 assignments based on independent repertoire data. For each HLA-associated TCR chain, we counted the number of times it was seen in CD4+ versus CD8+ T cell repertoires from independent datasets (see Materials and methods). Given a threshold on the difference between these two counts, we assign as CD4+ (CD8+) all TCRs whose CD4+ (CD8+) count exceeds its CD8+ (CD4+) count by at least that threshold and then calculate the fraction of TCRs assigned to the ‘correct’ class (CD8+ for class I-associated TCRs and CD4+ for class II-associated TCRs). We can further stratify these accuracies by conditioning on the p-value of the HLA-association and plot them according to this p-value threshold (vertical axis; corresponds to the approximate FDR threshold of used to define HLA-associated TCRs) and the threshold on the CD4 vs CD8 counts difference (horizontal axis). In total, HLA-associated TCR chains occurred in at least one of the independent repertoire datasets.
Figure 6 with 1 supplement
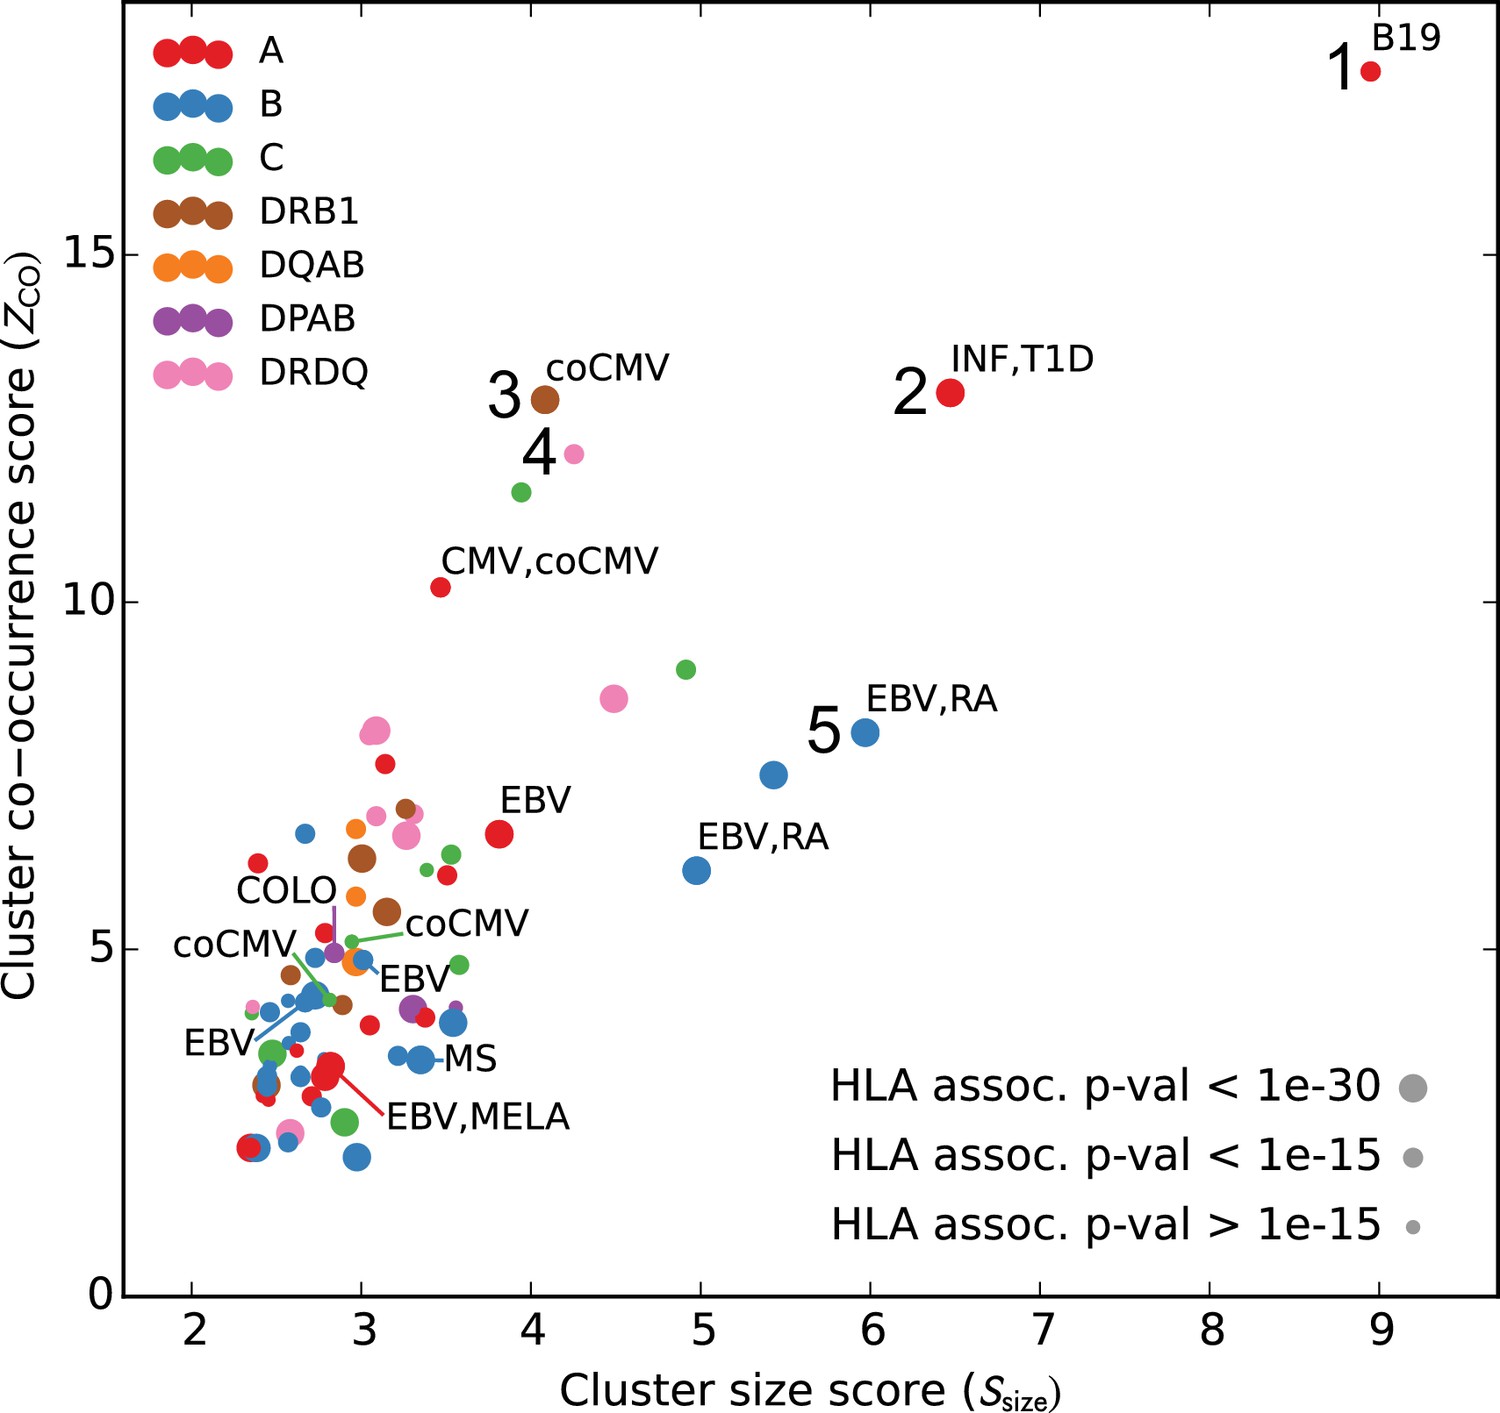
Many HLA-restricted TCR clusters contain TCR chains annotated as pathogen-responsive.
Each point represents one of the significant HLA-restricted TCR clusters, plotted based on a normalized cluster size score (, -axis) and an aggregate TCR co-occurrence score for the member TCRs (, -axis). Markers are colored by the locus of the restricting HLA allele and sized based on the strength of the association between cluster member TCRs and the HLA allele. The database annotations associated to TCRs in each cluster are summarized with text labels using the following abbreviations: B19 = parvovirus B19, INF = influenza, EBV = Epstein Barr Virus, RA = rheumatoid arthritis, MS = multiple sclerosis, MELA = melanoma, T1D = type one diabetes, CMV = cytomegalovirus. Clusters labeled ‘coCMV’ are significantly associated () with CMV seropositivity (see main text discussion of cluster #3). Clusters labeled 1–5 are discussed in the text and examined in greater detail in Figure 7 and Figure 8.
-
Figure 6—source data 1
Paired TCR chain sequences from the pairSEQ dataset of (Howie et al., 2015) for all clusters with at least matched TCR chains, along with a score for each cluster that assesses the degree of sequence similarity among the partner chains.
- https://doi.org/10.7554/eLife.38358.021
Figure 6—figure supplement 1
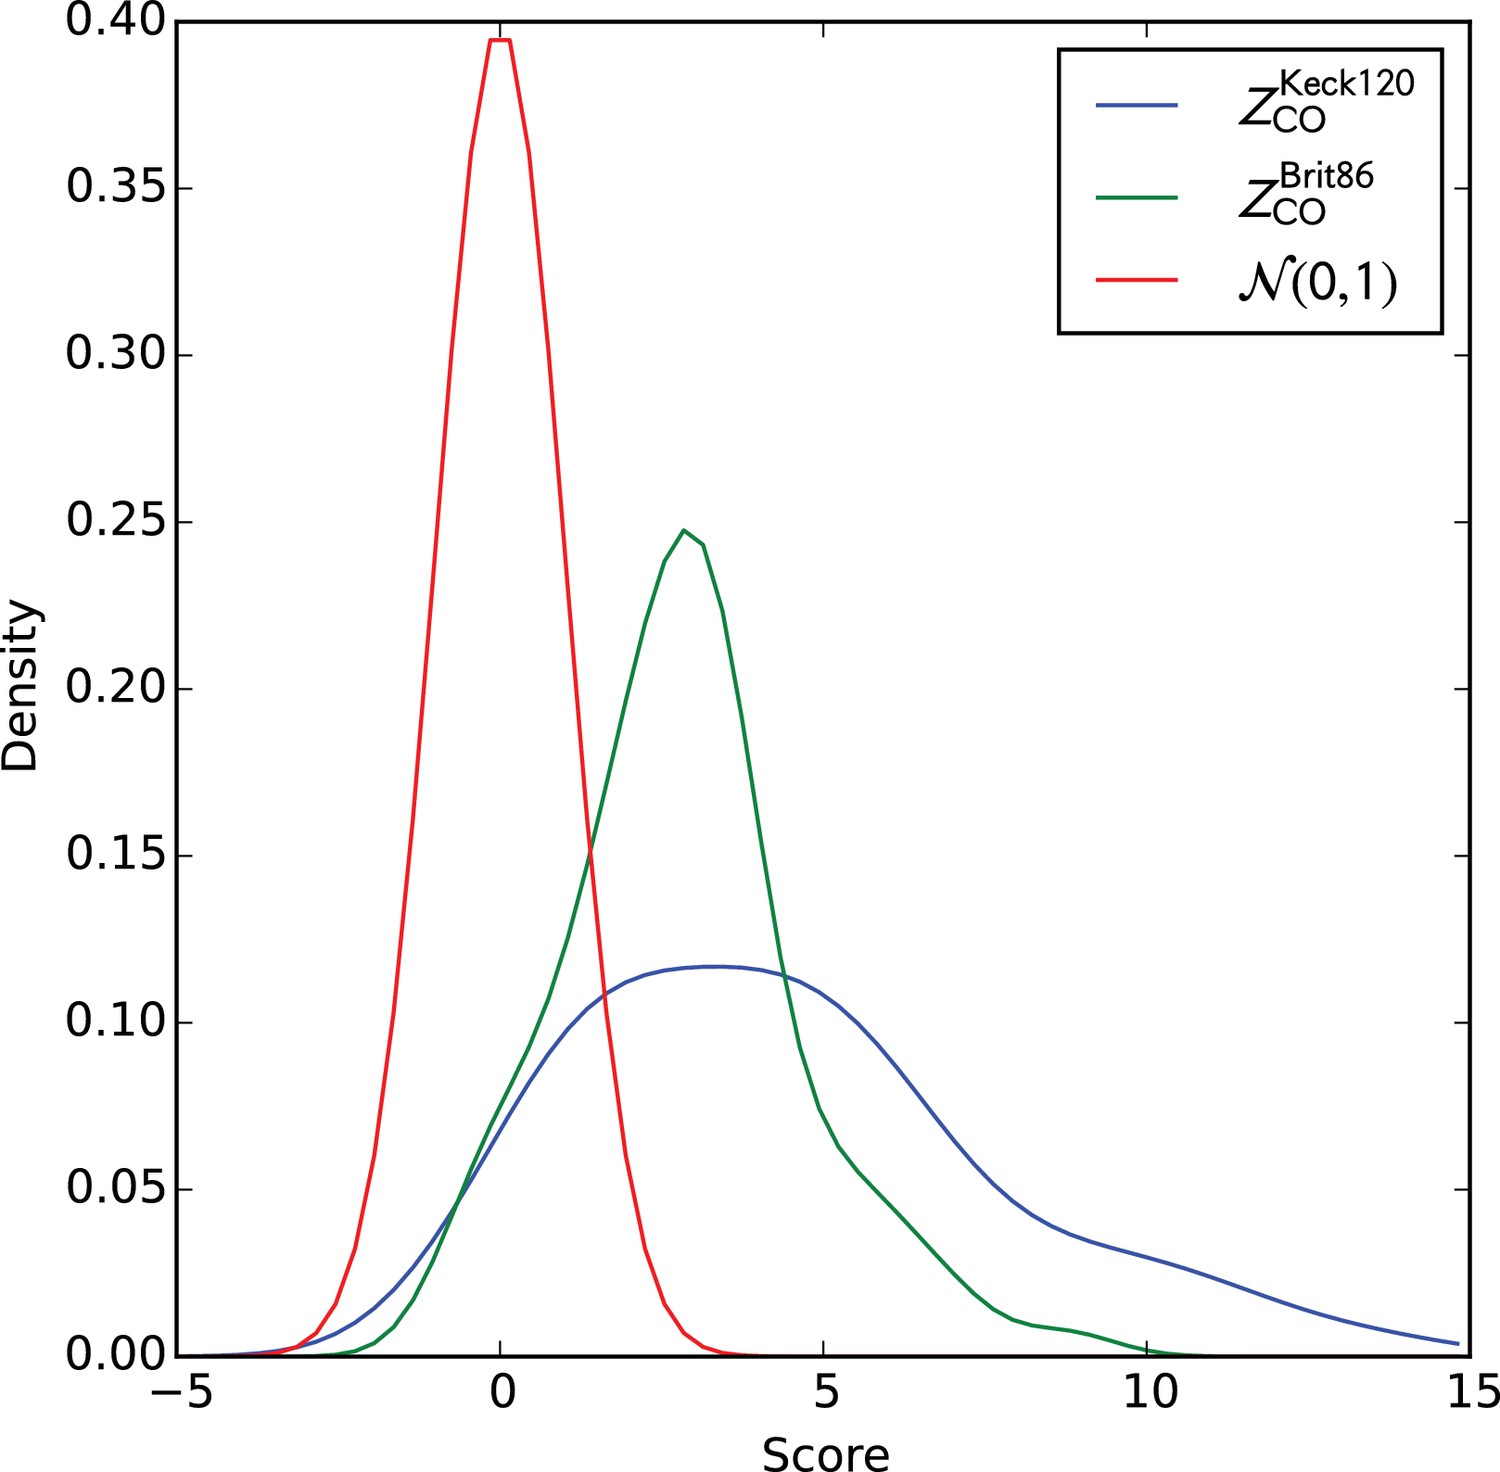
Distributions of cluster co-occurrence scores on the two validation cohorts.
Smoothed distributions of cluster co-occurrence scores on the two validation cohorts. Gaussian kernel density estimation (KDE)-smoothed distributions of the cluster member TCR co-occurrence scores () for the two validation cohorts. A standard normal distribution is shown as an approximate null expectation for these Z-scores.
Figure 7
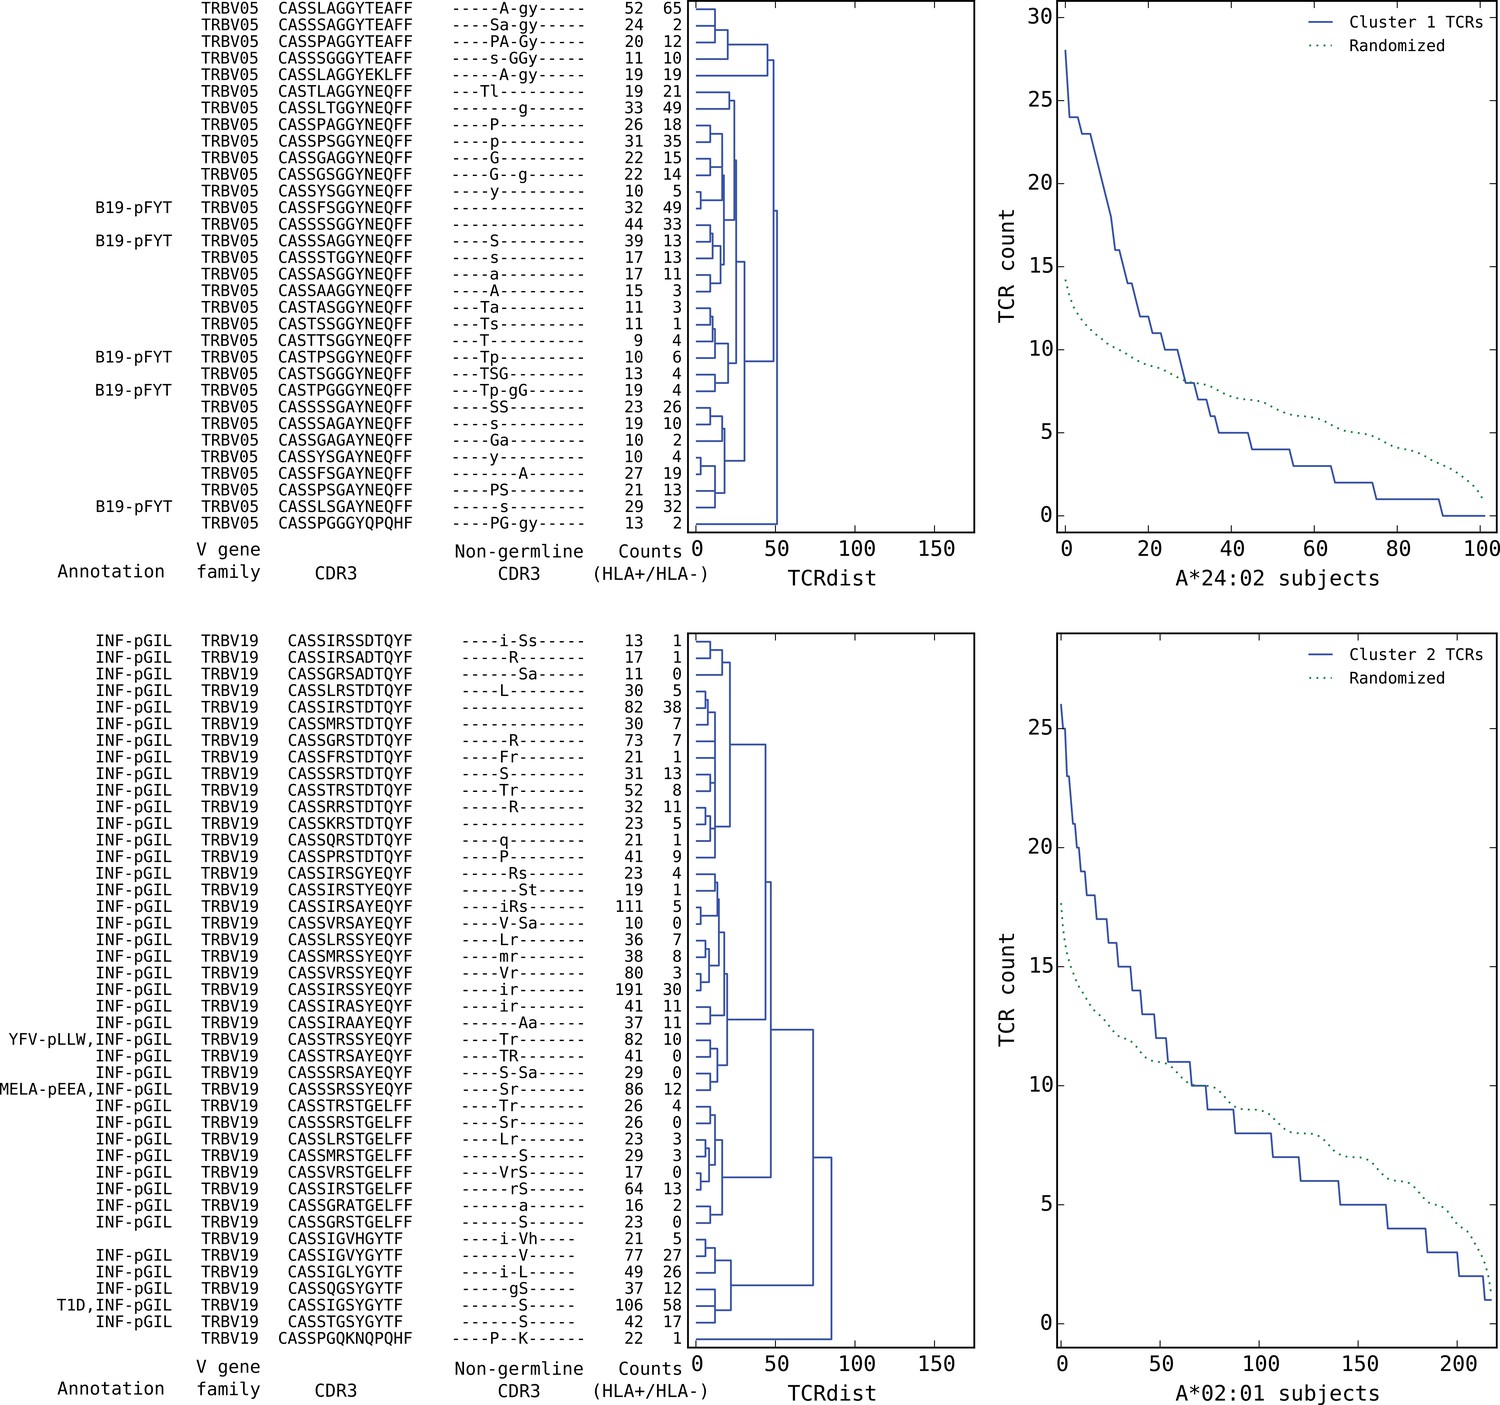
Top five HLA-restricted clusters (continued on following page).
Details on the TCR sequences, occurrence patterns, and annotations for the five most significant clusters (labeled 1–5 in Figure 6) based on size and TCR co-occurrence scores. Each panel consists of a TCRdist dendrogram (left side, labeled with annotation, CDR3 sequence, and occurrence counts for the member TCRs) and a per-subject TCR count profile (right side) showing the aggregate occurrence pattern of the member TCRs (blue curve) and a control pattern (green curve) produced by averaging occurrence counts from multiple independent randomizations of the subject set for each TCR. The numbers in the two ‘Counts’ columns represent the number of HLA+ (left) and HLA- (right) subjects whose repertoire contained the corresponding TCR, where HLA± means positive/negative for the restricting allele (for example, A*24:02 in the case of cluster 1). Annotations use the following abbreviations: B19 (parvovirus B19), INF (influenza virus), YFV (yellow fever virus), MELA (melanoma), T1D (type 1 diabetes), EBV (Epstein-Barr virus), RA (rheumatoid arthritis). In cases where the peptide epitope for the annotation match is known, the first three peptide amino acids are given after ‘-p’. Non-germline CDR3 amino acids with 2 or 3 non-templated nucleotides in their codon are shown in uppercase, while amino acids with only a single non-templated coding nucleotide are shown in lowercase.
Figure 8
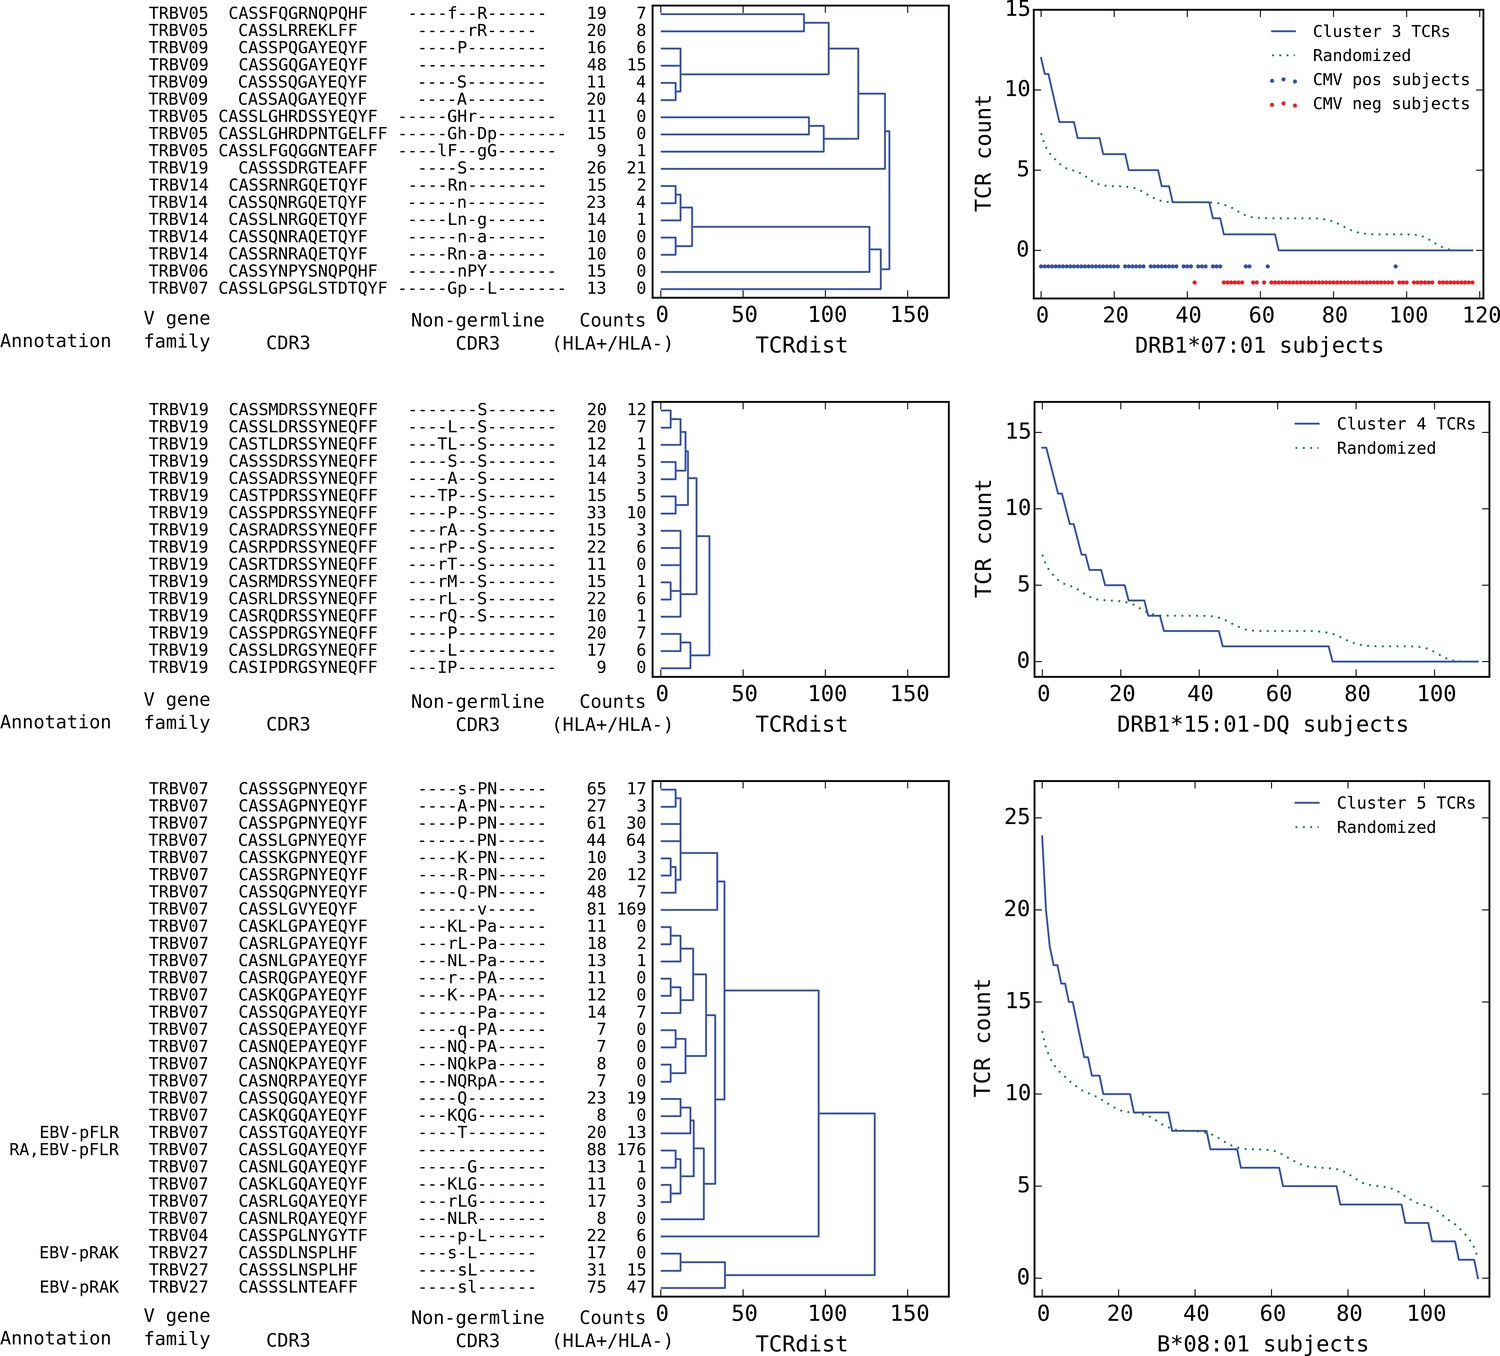
Top five HLA-restricted clusters (continued from previous page).
Clusters 3–5; see preceding legend for details.
Figure 9
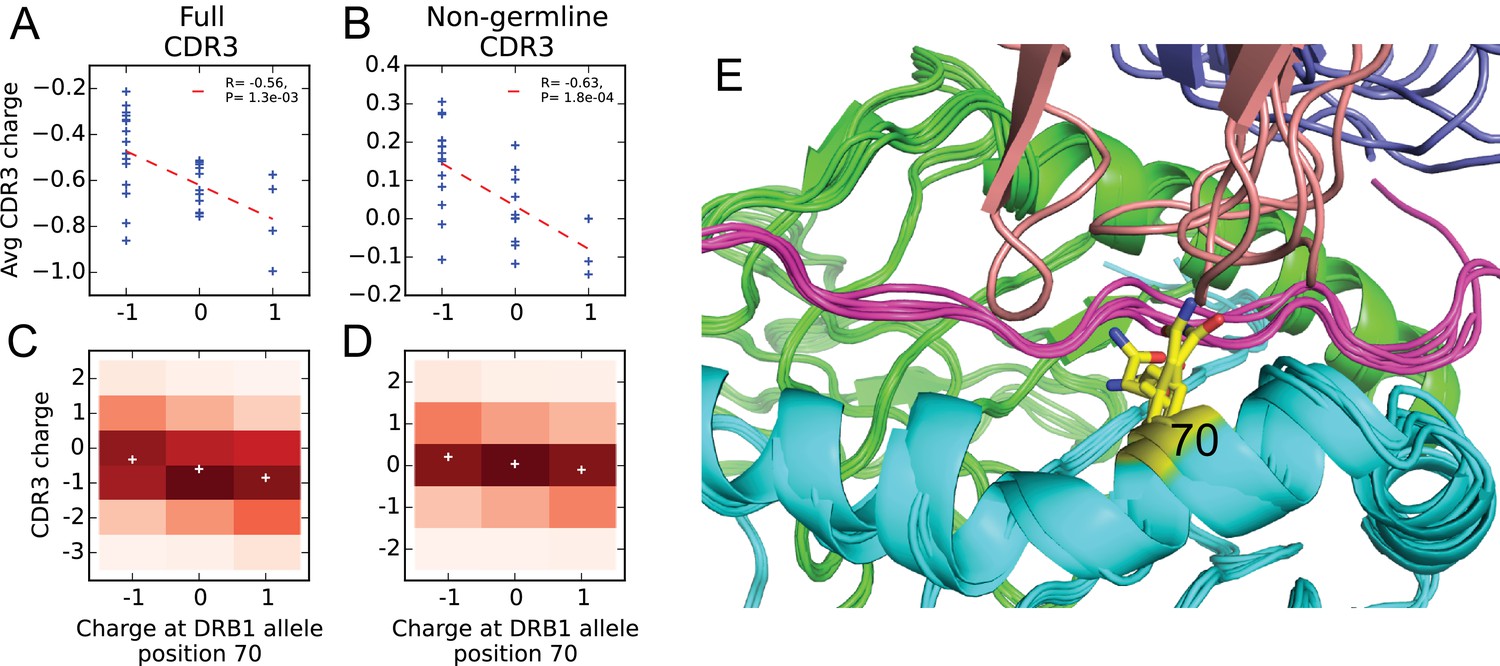
Negative correlation between HLA allele charge at DRB1 position 70 and CDR3 charge of HLA-associated TCRs.
(A–B) Allele charge (-axis) versus average CDR3 charge of allele-associated TCR chains (-axis) for 30 HLA-DRB1 alleles. Charge of the CDR3 loop was calculated over the full CDR3 sequence (A) or over the subset of CDR3 amino acids with at least one non-germline coding nucleotide (B). Correlation p-values correspond to a 2-sided test of the null hypothesis that the slope is zero, as implemented in the function scipy.stats.linregress ( alleles). (C–D) CDR3 charge distributions for TCRs associated with alleles having defined charge at position 70 (-axis) using the full (C) or non-germline (D) CDR3 sequence (mean values shown as white pluses). (E) Superposition of five TCR:peptide:HLA-DR crystal structures (PDB IDs 1j8h, 2iam, 2wbj, 3o6f, and 4e41; [Hennecke and Wiley, 2002; Deng et al., 2007; Harkiolaki et al., 2009; Yin et al., 2011; Deng et al., 2012]) showing the DR chain in green, the DR chain in cyan, the peptide in magenta, the TCR chain in blue with the CDR3 loop colored reddish brown. The TCR chain is omitted for clarity, and position 70 is highlighted in yellow.
-
Figure 9—source data 1
Charge at position 70 and average CDR3 charge of allele-associated TCRs for HLA-DRB1 alleles.
- https://doi.org/10.7554/eLife.38358.026
Figure 10

CMV-associated TCR chains are largely HLA-restricted.
(A) Comparison of CMV-association (-axis) and HLA-association (-axis) p-values for 68 CMV-associated TCR chains shows that the majority are also HLA associated. (B) Smoothed densities comparing HLA-association p-value distributions for the CMV-associated chains (blue) and a cohort-frequency matched set of randomly selected public TCR chains. CMV-associated TCRs are much more strongly HLA-associated than would be expected based solely on their cohort frequency. (C) CMV-association p-values computed over subsets of the cohort positive (-axis) or negative (-axis) for the HLA allele most strongly associated with each TCR. For most of the TCR chains, CMV association is restricted to the subset of the cohort positive for their associated HLA allele. (D) HLA-association p-values computed over CMV-positive (-axis) or CMV-negative (-axis) subsets of the cohort suggest that for these CMV-associated TCR chains, HLA-association is driven solely by response to CMV (rather than generic affinity for their associated allele, for example, or additional self or viral epitopes). In panels (A), (C), and (D), points are colored by CMV-association p-value; in all panels we use a modified logarithmic scale based on the square root of the exponent when plotting p-values in order to avoid compression due to a few highly significant associations.
-
Figure 10—source data 1
Full and subsetted CMV- and HLA- association p-values for CMV-associated TCRs.
- https://doi.org/10.7554/eLife.38358.028
Figure 11

Analysis of TCR sharing at the nucleotide level and VDJ recombination probabilities helps to identify potential contamination.
Each point represents a TCR nucleotide sequence that occurs in more than one repertoire, plotted according to its generation probability (, -axis) and the number of repertoires in which it was seen (, -axis). Very low probability nucleotide sequences that are shared across many repertoires represent potential cross-contamination, as confirmed for one large cluster of artifactual sequences (see the main text). We excluded all TCR nucleotide sequences lying above the boundary indicated by the black line ().
-
Figure 11—source data 1
TCR nucleotide sequences excluded from our analysis.
- https://doi.org/10.7554/eLife.38358.030
Figure 12
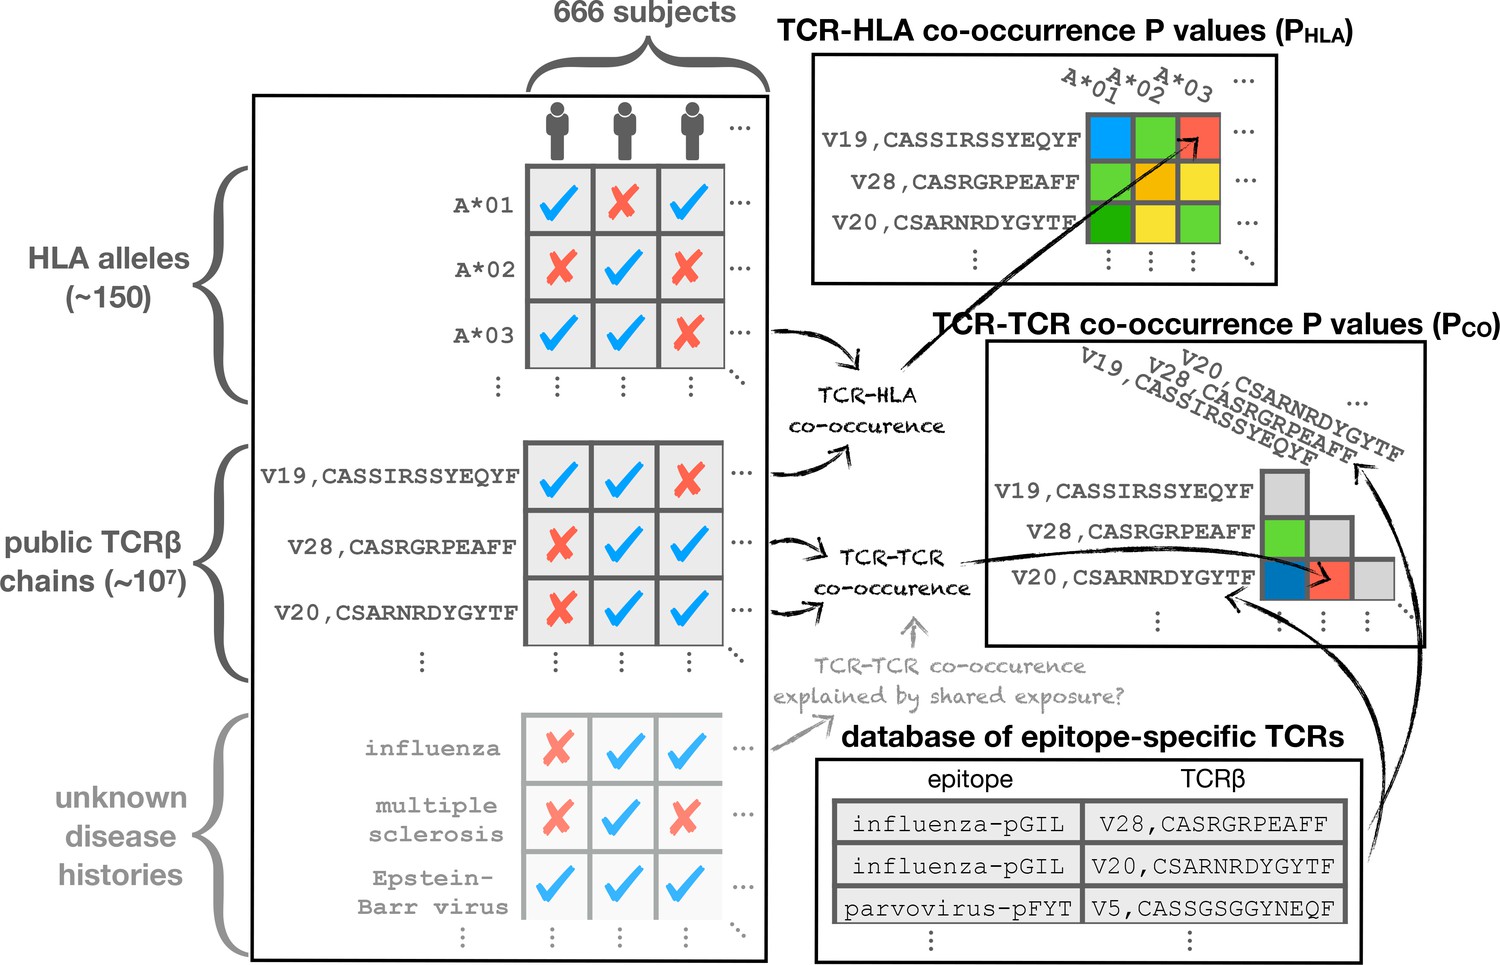
Schematic diagram illustrating the co-occurrence analysis.
Co-occurrence p-values are calculated to assess TCR-TCR () and TCR-HLA () covariation across the cohort. Shared response to unknown immune exposures may explain strongly co-occurring TCR pairs, while significant HLA association can highlight functional TCRs. TCR chains are compared to a set of previously characterized TCRs for annotation purposes.
Tables
Table 1
The top 50 most significant HLA-associated public TCR chains and the top 10 for A*02:01 (indicated in bold).
https://doi.org/10.7554/eLife.38358.011| Association p-value | Overlap* | TCR Subjects † | HLA subjects‡ | Total subjects§ | V-family | CDR3 | HLA allele# | Epitope annotation |
|---|---|---|---|---|---|---|---|---|
| 3.7e-90 | 231 | 267 | 268 | 629 | TRBV19 | CASSIRSSYEQYF | A*02:01 | Influenza virus |
| 2.4e-72 | 179 | 191 | 268 | 629 | TRBV29 | CSVGTGGTNEKLFF | A*02:01 | Epstein-Barr virus |
| 3.8e-66 | 107 | 124 | 134 | 522 | TRBV20 | CSARNRDYGYTF | DRB1*03:01-DQ | |
| 1.9e-65 | 92 | 95 | 151 | 630 | TRBV05 | CASSLVVSPYEQYF | DRB1*07:01 | |
| 6.7e-64 | 91 | 94 | 134 | 522 | TRBV30 | CAWSRDSGSGNTIYF | DRB1*15:01-DQ | |
| 7.5e-59 | 51 | 53 | 66 | 630 | TRBV15 | CATSREEGDGYTF | B*35:01 | |
| 3.6e-57 | 89 | 96 | 134 | 522 | TRBV11 | CASSPGQGPGNTIYF | DRB1*15:01-DQ | |
| 7.4e-56 | 57 | 57 | 95 | 630 | TRBV02 | CASSENQGSQPQHF | DRB1*04:01 | |
| 1.5e-52 | 86 | 87 | 184 | 629 | TRBV06 | CASSYDSGTGELFF | C*07:01 | |
| 3.3e-52 | 136 | 143 | 268 | 629 | TRBV19 | CASSIRSAYEQYF | A*02:01 | Influenza virus |
| 1.2e-51 | 71 | 96 | 94 | 630 | TRBV27 | CASSLGGQNYGYTF | B*44:02 | |
| 1.8e-50 | 52 | 52 | 94 | 630 | TRBV28 | CASSSSPLNYGYTF | DRB1*01:01 | |
| 3.8e-49 | 69 | 71 | 142 | 630 | TRBV04 | CASSPGQGEGYEQYF | B*08:01 | Epstein-Barr virus |
| 6.3e-49 | 92 | 98 | 189 | 629 | TRBV11 | CASSFGQMNTEAFF | A*01:01 | |
| 1.3e-48 | 73 | 75 | 156 | 630 | TRBV18 | CASSPPTESYGYTF | B*07:02 | |
| 3.2e-48 | 79 | 87 | 151 | 630 | TRBV14 | CASSQAGMNTEAFF | DRB1*07:01 | |
| 8.7e-47 | 49 | 49 | 95 | 630 | TRBV11 | CASSLDQGGSSSYNEQFF | DRB1*04:01 | |
| 3.2e-46 | 50 | 51 | 95 | 630 | TRBV20 | CSAQREYNEQFF | DRB1*04:01 | |
| 3.3e-46 | 68 | 69 | 134 | 522 | TRBV05 | CASSFWGRDTQYF | DRB1*03:01-DQ | |
| 3.3e-46 | 54 | 59 | 94 | 630 | TRBV05 | CASSWTGGGGANVLTF | DRB1*01:01 | |
| 3.1e-45 | 54 | 60 | 94 | 630 | TRBV02 | CASSEARGAGQPQHF | DRB1*01:01 | |
| 1.4e-44 | 41 | 42 | 69 | 630 | TRBV14 | CASSPLGPGNTIYF | DRB1*11:01 | |
| 2.4e-43 | 92 | 121 | 134 | 522 | TRBV07 | CASSPTGLQETQYF | DRB1*03:01-DQ | |
| 4.1e-43 | 43 | 52 | 61 | 630 | TRBV19 | CASSPTGGIYEQYF | B*44:03 | Multiple sclerosis |
| 4.5e-43 | 39 | 40 | 66 | 629 | TRBV10 | CASSESPGNSNQPQHF | C*12:03 | |
| 6.7e-43 | 76 | 86 | 134 | 522 | TRBV28 | CASRGRPEAFF | DRB1*15:01-DQ | |
| 7.5e-43 | 50 | 54 | 94 | 630 | TRBV19 | CASSPTQNTEAFF | DRB1*01:01 | |
| 1.7e-42 | 84 | 110 | 142 | 630 | TRBV07 | CASSSGPNYEQYF | B*08:01 | |
| 1.7e-42 | 61 | 81 | 95 | 630 | TRBV05 | CASSFPGEDTQYF | DRB1*04:01 | |
| 1.3e-41 | 47 | 49 | 95 | 630 | TRBV18 | CASSPPAGAAYEQYF | DRB1*04:01 | |
| 1.5e-41 | 75 | 87 | 151 | 630 | TRBV28 | CASSLTSGGQETQYF | DRB1*07:01 | |
| 2.3e-41 | 64 | 67 | 151 | 630 | TRBV07 | CASSLGQGFYNSPLHF | DRB1*07:01 | |
| 8.2e-40 | 77 | 92 | 134 | 522 | TRBV19 | CASSISVYGYTF | DRB1*15:01-DQ | |
| 2.4e-39 | 43 | 54 | 66 | 630 | TRBV10 | CAISTGDSNQPQHF | B*35:01 | Epstein-Barr virus |
| 3.4e-39 | 115 | 193 | 156 | 630 | TRBV09 | CASSGNEQFF | B*07:02 | |
| 9.5e-39 | 151 | 260 | 189 | 629 | TRBV19 | CASSIRDSNQPQHF | A*01:01 | |
| 1.2e-38 | 100 | 103 | 268 | 629 | TRBV20 | CSARDGTGNGYTF | A*02:01 | Epstein-Barr virus |
| 1.3e-38 | 56 | 60 | 130 | 629 | TRBV25 | CASSEYSLTDTQYF | C*04:01 | |
| 2.1e-38 | 109 | 116 | 268 | 629 | TRBV20 | CSARDRTGNGYTF | A*02:01 | Epstein-Barr virus |
| 2.3e-38 | 102 | 106 | 268 | 629 | TRBV19 | CASSVRSSYEQYF | A*02:01 | Influenza virus |
| 6.4e-38 | 54 | 54 | 151 | 630 | TRBV10 | CAISESQDLNTEAFF | DRB1*07:01 | |
| 1.1e-37 | 43 | 45 | 94 | 630 | TRBV07 | CASSLAGPPNSPLHF | DRB1*01:01 | |
| 1.2e-37 | 44 | 60 | 66 | 630 | TRBV09 | CASSARTGELFF | B*35:01 | Epstein-Barr virus |
| 3.3e-37 | 79 | 88 | 189 | 629 | TRBV19 | CASSIDGEETQYF | A*01:01 | |
| 5.4e-37 | 64 | 70 | 134 | 522 | TRBV05 | CASSLESPNYGYTF | DRB1*03:01-DQ | |
| 2.0e-36 | 38 | 43 | 69 | 630 | TRBV06 | CASGAGHTDTQYF | DRB1*11:01 | |
| 2.9e-36 | 54 | 55 | 151 | 630 | TRBV05 | CASSLVVQPYEQYF | DRB1*07:01 | |
| 3.3e-36 | 57 | 81 | 95 | 630 | TRBV11 | CASSPGQDYGYTF | DRB1*04:01 | |
| 2.4e-35 | 50 | 53 | 109 | 522 | TRBV27 | CASNRQGPNTEAFF | DQB1*03:01-DQA1*05:05 | |
| 5.7e-35 | 75 | 95 | 134 | 522 | TRBV18 | CASSGQANTEAFF | DRB1*03:01-DQ | |
| 2.2e-33 | 86 | 88 | 268 | 629 | TRBV14 | CASSQSPGGTQYF | A*02:01 | Epstein-Barr virus |
| 1.8e-32 | 84 | 86 | 268 | 629 | TRBV10 | CASSEDGMNTEAFF | A*02:01 | |
| 4.3e-32 | 86 | 89 | 268 | 629 | TRBV05 | CASSLEGQASSYEQYF | A*02:01 | Melanoma |
| 4.3e-32 | 86 | 89 | 268 | 629 | TRBV29 | CSVGSGGTNEKLFF | A*02:01 | Epstein-Barr virus |
-
*Number of subjects positive for both the TCR chain and the indicated HLA allele.
†Number of subjects positive for the TCR chain with available HLA typing at the corresponding locus.
-
‡Number of subjects positive for the indicated HLA allele.
§Total number of subjects with available HLA typing at the corresponding locus.
-
#The following DR-DQ haplotype abbreviations are used: DRB1*03:01-DQ (DRB1*03:01-DQA1*05:01-DQB1*02:01) and DRB1*15:01-DQ (DRB1*15:01-DQA1*01:02-DQB1*06:02).
Table 2
Covariation between HLA allele charge and average CDR3 charge of HLA-associated TCRs for HLA positions frequently contacted by CDR3 amino acids in solved TCR:pMHC crystal structures.
https://doi.org/10.7554/eLife.38358.024| MHC Class | Position* | Contact frequency† | Full CDR3 | Non-germline CDR3‡ | AAs§ | ||
|---|---|---|---|---|---|---|---|
| R-value | p-value | R-value | p-value | ||||
| II- | 70 | 1.48 | −0.47 | 3.3e-04 | −0.52 | 6.1e-05 | DEGQR |
| II- | 64 | 1.09 | −0.15 | 0.33 | −0.07 | 0.64 | ART |
| I | 152 | 0.47 | 0.00 | 0.99 | −0.04 | 0.72 | AERTVW |
| I | 151 | 0.46 | 0.08 | 0.50 | 0.06 | 0.59 | HR |
| I | 69 | 0.26 | −0.13 | 0.28 | −0.14 | 0.24 | ART |
| I | 76 | 0.21 | −0.08 | 0.49 | −0.14 | 0.25 | AEV |
| I | 70 | 0.12 | 0.02 | 0.86 | 0.08 | 0.50 | HKNQS |
-
*Only positions whose charge varies across alleles are included.
†Total number of CDR3 residues contacted (using a sidechain heavyatom distance threshold of 4.5 Å) divided by number of structures analyzed.
-
‡CDR3 charge is calculated over amino acids with at least one non-germline coding nucleotide.
§Amino acids present at this HLA position.
Table 3
HLA-restricted TCR clusters with size () and co-occurrence () scores, annotations (abbreviated as in Figure 6), and validation scores.
https://doi.org/10.7554/eLife.38358.032| Rank | HLA allele | Allele frequency | TCRs | Subjects | Cluster center | Annotations | ||||
|---|---|---|---|---|---|---|---|---|---|---|
| 1 | A*24:02 | 102 | 32 | 29 | TRBV05,CASSGSGGYNEQFF | 8.95 | 17.64 | B19 | 10.38 | 6.74 |
| 2 | A*02:01 | 218 | 43 | 66 | TRBV19,CASSGRSTDTQYF | 6.47 | 13.01 | INF, T1D | 12.28 | 4.28 |
| 3 | DRB1*07:01 | 119 | 17 | 36 | TRBV09,CASSGQGAYEQYF | 4.08 | 12.91 | coCMV | 9.46 | 6.40 |
| 4 | DRB1*15:01-DQ | 112 | 16 | 27 | TRBV19,CASSPDRSSYNEQFF | 4.25 | 12.13 | 1.65 | 1.72 | |
| 5 | B*08:01 | 115 | 30 | 34 | TRBV07,CASSQGPAYEQYF | 5.97 | 8.12 | EBV, RA | 3.83 | 1.83 |
| 6 | C*04:01 | 104 | 7 | 24 | TRBV19,CASSPGGDYNEQFF | 3.94 | 11.58 | 4.48 | 2.01 | |
| 7 | C*04:01 | 104 | 11 | 20 | TRBV04,CASSHSGTGETYEQYF | 4.91 | 9.03 | 7.52 | 1.66 | |
| 8 | B*15:01 | 55 | 23 | 27 | TRBV19,CASSTTSGSYNEQFF | 5.43 | 7.51 | 10.31 | 4.01 | |
| 9 | DRB1*03:01-DQ | 108 | 26 | 39 | TRBV29,CSVAPGWGMNTEAFF | 4.49 | 8.61 | 10.96 | 7.09 | |
| 10 | A*01:01 | 154 | 8 | 44 | TRBV24,CATSDGDTQYF | 3.47 | 10.21 | CMV, coCMV | 3.80 | 2.42 |
| 11 | B*35:01 | 56 | 18 | 24 | TRBV10,CATGTGDSNQPQHF | 4.98 | 6.13 | EBV, RA | 4.50 | 5.42 |
| 12 | DRB1*03:01-DQ | 108 | 11 | 35 | TRBV07,CASSLSLAGSYNEQFF | 3.09 | 8.15 | 5.35 | 1.40 | |
| 13 | A*02:01 | 218 | 10 | 84 | TRBV20,CSARDRTGNGYTF | 3.81 | 6.66 | EBV | 7.14 | 3.50 |
| 14 | DRB1*15:01-DQ | 112 | 15 | 38 | TRBV05,CASSLRGVRTDTQYF | 3.05 | 8.08 | 8.73 | 3.31 | |
| 15 | A*01:01 | 154 | 6 | 30 | TRBV10,CAISESRASGDYNEQFF | 3.14 | 7.67 | 11.31 | 2.99 | |
| 16 | DRB1*13:01-DQ | 43 | 7 | 7 | TRBV20,CSASAGESNQPQHF | 3.14 | 7.64 | −0.55 | −0.35 | |
| 17 | DRB1*03:01-DQ | 108 | 16 | 32 | TRBV20,CSARGGGRSYEQYF | 3.31 | 6.95 | 2.57 | 3.09 | |
| 18 | DRB1*11:01 | 58 | 14 | 20 | TRBV06,CASSYSVRGRYSNQPQHF | 3.26 | 7.02 | 8.72 | 3.44 | |
| 19 | C*08:02 | 37 | 6 | 15 | TRBV28,CASSLGIHYEQYF | 3.53 | 6.37 | 1.82 | 4.37 | |
| 20 | DRB1*15:01-DQ | 112 | 13 | 51 | TRBV12,CASSLAGTEKLFF | 3.27 | 6.64 | 4.61 | 3.01 | |
| 21 | DRB1*03:01-DQ | 108 | 11 | 23 | TRBV05,CASSSTGLRSYEQYF | 3.09 | 6.92 | 4.73 | 5.81 | |
| 22 | A*02:01 | 218 | 7 | 64 | TRBV04,CASSQGTGRYEQYF | 3.51 | 6.07 | 2.79 | 3.23 | |
| 23 | C*03:04 | 72 | 5 | 13 | TRBV09,CASSVAYRGNEQFF | 3.39 | 6.14 | 6.26 | 3.23 | |
| 24 | DQB1*03:01-DQA1*05:05 | 84 | 10 | 39 | TRBV09,CASSVGTVQETQYF | 2.97 | 6.73 | 3.02 | 3.54 | |
| 25 | DRB1*04:01 | 78 | 25 | 35 | TRBV05,CASSRQGAGETQYF | 3.00 | 6.31 | 5.82 | 1.55 | |
| 26 | B*08:01 | 115 | 7 | 30 | TRBV12,CASSFEGLHGYTF | 2.67 | 6.67 | 3.77 | 2.95 | |
| 27 | C*04:01 | 104 | 6 | 25 | TRBV06,CASRTGLAGTDTQYF | 3.58 | 4.78 | 3.53 | 3.76 | |
| 28 | DRB1*07:01 | 119 | 9 | 42 | TRBV14,CASSLAGMNTEAFF | 3.15 | 5.54 | 6.99 | 5.58 | |
| 29 | DQB1*03:01-DQA1*05:05 | 84 | 7 | 36 | TRBV02,CASSELENTEAFF | 2.97 | 5.76 | 5.25 | 3.24 | |
| 30 | DPB1*03:01-DPA1*01:03 | 42 | 7 | 16 | TRBV30,CAWSADSNQPQHF | 3.56 | 4.16 | 2.42 | 1.73 | |
| 31 | B*15:01 | 55 | 18 | 27 | TRBV29,CSVETRDYEQYF | 3.54 | 3.94 | 13.81 | 4.29 | |
| 32 | A*01:01 | 154 | 4 | 26 | TRBV09,CASSVGVDSTDTQYF | 2.39 | 6.24 | −0.31 | 2.17 | |
| 33 | C*07:02 | 142 | 4 | 14 | TRBV25,CASSPGDEQYF | 2.94 | 5.11 | coCMV | 6.37 | 3.69 |
| 34 | B*08:01 | 115 | 6 | 38 | TRBV29,CSVGSGDYEQYF | 3.01 | 4.85 | EBV | 2.73 | 0.75 |
| 35 | A*01:01 | 154 | 6 | 37 | TRBV20,CSAPGQGAVEQYF | 2.79 | 5.24 | 2.42 | 3.00 | |
| 36 | A*23:01 | 22 | 5 | 7 | TRBV06,CASSDGNSGNTIYF | 3.38 | 4.02 | 1.91 | 4.11 | |
| 37 | DQB1*03:01-DQA1*05:05 | 84 | 7 | 29 | TRBV15,CATSRDPGGNQPQHF | 2.97 | 4.82 | 5.00 | 2.67 | |
| 38 | DPB1*04:01-DPA1*01:03 | 274 | 5 | 65 | TRBV19,CASSIKGDTEAFF | 3.31 | 4.14 | 4.89 | 3.42 | |
| 39 | DPB1*04:01-DPA1*01:03 | 274 | 4 | 55 | TRBV19,CASRLSGDTQYF | 2.84 | 4.95 | COLO | 3.80 | 1.25 |
| 40 | B*07:02 | 125 | 7 | 37 | TRBV02,CASRGETQYF | 2.73 | 4.88 | 3.20 | 2.11 | |
| 41 | B*44:03 | 41 | 9 | 20 | TRBV19,CASSATGGIYEQYF | 3.35 | 3.41 | MS | 6.61 | 8.76 |
| 42 | A*24:02 | 102 | 6 | 31 | TRBV30,CAWSPGTGDYEQYF | 3.05 | 3.91 | 3.56 | 2.99 | |
| 43 | DRB1*07:01 | 119 | 13 | 31 | TRBV18,CASSPSVRNTEAFF | 2.89 | 4.20 | 5.32 | 0.96 | |
| 44 | B*57:01 | 27 | 5 | 14 | TRBV12,CASSPPEGETQYF | 3.22 | 3.47 | 6.31 | 1.94 | |
| 45 | C*06:02 | 74 | 4 | 14 | TRBV02,CASSAGTASTDTQYF | 2.81 | 4.27 | coCMV | 4.76 | 3.06 |
| 46 | A*11:01 | 47 | 5 | 7 | TRBV09,CASSPKGVGYEQYF | 2.75 | 4.31 | 2.43 | 3.32 | |
| 47 | DRB1*01:01 | 82 | 9 | 21 | TRBV19,CASSIPGLAYEQYF | 2.58 | 4.63 | 0.96 | −0.49 | |
| 48 | B*07:02 | 125 | 7 | 21 | TRBV09,CASSDRRGYTF | 2.73 | 4.34 | 4.57 | 0.45 | |
| 49 | B*08:01 | 115 | 6 | 22 | TRBV07,CASSSTGAGNQPQHF | 2.67 | 4.24 | EBV | 1.00 | 2.85 |
| 50 | B*18:01 | 46 | 5 | 6 | TRBV27,CASSPTSEDTQYF | 2.57 | 4.26 | 5.79 | −0.23 | |
| 51 | B*27:05 | 36 | 7 | 13 | TRBV06,CASSLRLAGLYEQYF | 2.64 | 3.81 | 9.25 | 1.08 | |
| 52 | B*35:01 | 56 | 4 | 7 | TRBV07,CASSQGPGRTYEQYF | 2.46 | 4.10 | - | - | |
| 53 | B*35:03 | 16 | 4 | 7 | TRBV10,CAISVGNEQFF | 2.78 | 3.42 | 1.50 | 0.73 | |
| 54 | A*02:01 | 218 | 5 | 126 | TRBV29,CSVGTGGTNEKLFF | 2.82 | 3.32 | EBV, MELA | 5.65 | 2.37 |
| 55 | DRB1*03:01-DQ | 108 | 6 | 18 | TRBV02,CASSAGAGTEAFF | 2.36 | 4.17 | 0.98 | 2.79 | |
| 56 | B*44:02 | 79 | 4 | 18 | TRBV02,CASSADSSYNEQFF | 2.57 | 3.65 | 2.09 | 2.12 | |
| 57 | C*03:04 | 72 | 3 | 8 | TRBV27,CASSPRPYNEQFF | 2.35 | 4.08 | 1.36 | 3.22 | |
| 58 | A*24:02 | 102 | 4 | 12 | TRBV20,CSAREDGHEQYF | 2.62 | 3.54 | 0.83 | 2.94 | |
| 59 | A*01:01 | 154 | 12 | 65 | TRBV19,CASSIRDHNQPQHF | 2.79 | 3.17 | 8.44 | 2.33 | |
| 60 | B*27:05 | 36 | 4 | 12 | TRBV07,CASSPPGGSAYNEQFF | 2.64 | 3.23 | 1.13 | 2.12 | |
| 61 | C*14:02 | 23 | 4 | 9 | TRBV02,CASSGDTSTNEKLFF | 2.48 | 3.50 | 6.23 | - | |
| 62 | B*27:05 | 36 | 9 | 12 | TRBV27,CASSSGTSGNNEQFF | 2.64 | 3.16 | 4.32 | 3.24 | |
| 63 | C*12:03 | 53 | 6 | 25 | TRBV15,CATSRENEKLFF | 2.90 | 2.51 | 1.88 | 3.08 | |
| 64 | A*68:01 | 29 | 4 | 16 | TRBV05,CASSLIATNEKLFF | 2.71 | 2.88 | 3.67 | 1.23 | |
| 65 | B*51:01 | 53 | 6 | 20 | TRBV04,CASSQDYPGGSYEQYF | 2.76 | 2.73 | 6.43 | 5.18 | |
| 66 | B*35:01 | 56 | 4 | 8 | TRBV27,CASSLGAATGELFF | 2.46 | 3.32 | 4.52 | 3.01 | |
| 67 | B*15:01 | 55 | 4 | 20 | TRBV06,CASSAGTGRYEQYF | 2.44 | 3.18 | 2.40 | 2.23 | |
| 68 | B*44:03 | 41 | 7 | 14 | TRBV07,CASSSGESGANVLTF | 2.97 | 2.01 | 3.92 | 4.81 | |
| 69 | DRB1*04:02 | 14 | 4 | 6 | TRBV03,CASSQASGGANEQFF | 2.44 | 3.04 | 2.04 | 2.22 | |
| 70 | B*15:01 | 55 | 4 | 10 | TRBV19,CASSHRGGNEQFF | 2.44 | 3.03 | 0.92 | 3.58 | |
| 71 | B*15:01 | 55 | 5 | 7 | TRBV05,CASSLGVSAGELFF | 2.44 | 2.98 | −0.32 | −0.12 | |
| 72 | A*32:01 | 34 | 3 | 5 | TRBV12,CASSYGPGNQPQHF | 2.45 | 2.84 | 5.76 | 3.18 | |
| 73 | A*02:01 | 218 | 4 | 23 | TRBV19,CASSTGTATNEKLFF | 2.42 | 2.89 | 0.84 | - | |
| 74 | DRB1*15:01-DQ | 112 | 7 | 51 | TRBV28,CASSLLGGQPQHF | 2.58 | 2.35 | 0.66 | 1.89 | |
| 75 | B*18:01 | 46 | 5 | 15 | TRBV27,CASSFPGKEQYF | 2.57 | 2.22 | −0.35 | 5.62 | |
| 76 | B*49:01 | 16 | 3 | 8 | TRBV29,CSVERGYNEQFF | 2.38 | 2.14 | 1.03 | 0.43 | |
| 77 | A*23:01 | 22 | 3 | 6 | TRBV20,CSARDREGAGYGYTF | 2.35 | 2.14 | −0.16 | −0.12 | |
| 78 | B*55:01 | 13 | 3 | 10 | TRBV19,CASRGGNQPQHF | 2.36 | 2.09 | 0.95 | −0.28 |
Table 4
PDB structures analyzed.
https://doi.org/10.7554/eLife.38358.033| PDB ID* | HLA allele | V | J | CDR3 | V | J | CDR3 | Peptide |
|---|---|---|---|---|---|---|---|---|
| 5bs0 | A*01 | TRAV21*01 | TRAJ28*01 | CAVRPGGAGPFFVVF | TRBV5-1*01 | TRBJ2-7*01 | CASSFNMATGQYF | ESDPIVAQY |
| 3qdj | A*02 | TRAV12-2*01 | TRAJ23*01 | CAVNFGGGKLIF | TRBV6-4*01 | TRBJ1-1*01 | CASSLSFGTEAFF | AAGIGILTV |
| 4l3e | A*02 | TRAV12-2*01 | TRAJ23*01 | CAVNFGGGKLIF | TRBV6-4*01 | TRBJ1-1*01 | CASSWSFGTEAFF | ELAGIGILTV |
| 5e9d | A*02 | TRAV12-2*01 | TRAJ24*02 | CAVTKYSWGKLQF | TRBV6-5*01 | TRBJ2-7*01 | CASRPGWMAGGVELYF | ELAGIGILTV |
| 3qfj | A*02 | TRAV12-2*01 | TRAJ24*02 | CAVTTDSWGKLQF | TRBV6-5*01 | TRBJ2-7*01 | CASRPGLAGGRPEQYF | LLFGFPVYV |
| 4ftv | A*02 | TRAV12-2*01 | TRAJ24*02 | CAVTTDSWGKLQF | TRBV6-5*01 | TRBJ2-7*01 | CASRPGLMSAQPEQYF | LLFGYPVYV |
| 3hg1 | A*02 | TRAV12-2*01 | TRAJ27*01 | CAVNVAGKSTF | TRBV30*01 | TRBJ2-2*01 | CAWSETGLGTGELFF | ELAGIGILTV |
| 4eup | A*02 | TRAV12-2*01 | TRAJ45*01 | CAVSGGGADGLTF | TRBV28*01 | TRBJ2-1*01 | CASSFLGTGVEQYF | ALGIGILTV |
| 5c0c | A*02 | TRAV12-3*01 | TRAJ12*01 | CAMRGDSSYKLIF | TRBV12-4*01 | TRBJ2-4*01 | CASSLWEKLAKNIQYF | RQFGPDWIVA |
| 5eu6 | A*02 | TRAV21*01 | TRAJ53*01 | CAVLSSGGSNYKLTF | TRBV7-3*01 | TRBJ2-3*01 | CASSFIGGTDTQYF | YLEPGPVTV |
| 2p5e | A*02 | TRAV21*01 | TRAJ6*01 | CAVRPLLDGTYIPTF | TRBV6-5*01 | TRBJ2-2*01 | CASSYLGNTGELFF | SLLMWITQC |
| 2bnq | A*02 | TRAV21*01 | TRAJ6*01 | CAVRPTSGGSYIPTF | TRBV6-5*01 | TRBJ2-2*01 | CASSYVGNTGELFF | SLLMWITQV |
| 4mnq | A*02 | TRAV22*01 | TRAJ40*01 | CAVDSATALPYGYIF | TRBV6-5*01 | TRBJ1-1*01 | CASSYQGTEAFF | ILAKFLHWL |
| 5men | A*02 | TRAV22*01 | TRAJ40*01 | CAVDSATSGTYKYIF | TRBV6-5*01 | TRBJ1-1*01 | CASSYQGTEAFF | ILAKFLHWL |
| 5isz | A*02 | TRAV24*01 | TRAJ27*01 | CAFDTNAGKSTF | TRBV19*01 | TRBJ2-7*01 | CASSIFGQREQYF | GILGFVFTL |
| 5d2l | A*02 | TRAV24*01 | TRAJ49*01 | CAFITGNQFYF | TRBV7-2*02 | TRBJ2-5*01 | CASSQTQLWETQYF | NLVPMVATV |
| 3gsn | A*02 | TRAV24*01 | TRAJ49*01 | CARNTGNQFYF | TRBV6-5*01 | TRBJ1-2*01 | CASSPVTGGIYGYTF | NLVPMVATV |
| 5d2n | A*02 | TRAV26-2*01 | TRAJ43*01 | CILDNNNDMRF | TRBV7-6*01 | TRBJ1-4*01 | CASSLAPGTTNEKLFF | NLVPMVATV |
| 5euo | A*02 | TRAV27*01 | TRAJ37*02 | CAGAIGPSNTGKLIF | TRBV19*01 | TRBJ2-7*01 | CASSIRSSYEQYF | GILGFVFTL |
| 5hho | A*02 | TRAV27*01 | TRAJ42*01 | CAGAGSQGNLIF | TRBV19*01 | TRBJ2-7*01 | CASSIRSSYEQYF | GILEFVFTL |
| 2vlr | A*02 | TRAV27*01 | TRAJ42*01 | CAGAGSQGNLIF | TRBV19*01 | TRBJ2-7*01 | CASSSRASYEQYF | GILGFVFTL |
| 1oga | A*02 | TRAV27*01 | TRAJ42*01 | CAGAGSQGNLIF | TRBV19*01 | TRBJ2-7*01 | CASSSRSSYEQYF | GILGFVFTL |
| 1bd2 | A*02 | TRAV29/DV5*01 | TRAJ54*01 | CAAMEGAQKLVF | TRBV6-5*01 | TRBJ2-7*01 | CASSYPGGGFYEQYF | LLFGYPVYV |
| 5e6i | A*02 | TRAV35*01 | TRAJ37*02 | CAGPGGSSNTGKLIF | TRBV27*01 | TRBJ2-2*01 | CASSLIYPGELFF | GILGFVFTL |
| 3qeq | A*02 | TRAV35*01 | TRAJ49*01 | CAGGTGNQFYF | TRBV10-3*01 | TRBJ1-5*01 | CAISEVGVGQPQHF | AAGIGILTV |
| 4zez | A*02 | TRAV38-2/DV8*01 | TRAJ30*01 | CAYGEDDKIIF | TRBV25-1*01 | TRBJ2-7*01 | CASRRGPYEQYF | KLVALVINAV |
| 5jhd | A*02 | TRAV38-2/DV8*01 | TRAJ52*01 | CAWGVNAGGTSYGKLTF | TRBV19*01 | TRBJ1-2*01 | CASSIGVYGYTF | GILGFVFTL |
| 3o4l | A*02 | TRAV5*01 | TRAJ31*01 | CAEDNNARLMF | TRBV20-1*01 | TRBJ1-2*01 | CSARDGTGNGYTF | GLCTLVAML |
| 3vxs | A*24 | TRAV21*01 | TRAJ12*01 | CAVRMDSSYKLIF | TRBV7-9*01 | TRBJ2-2*01 | CASSSWDTGELFF | RYPLTLGWCF |
| 3vxm | A*24 | TRAV8-3*01 | TRAJ28*01 | CAVGAPSGAGSYQLTF | TRBV4-1*01 | TRBJ2-7*01 | CASSPTSGIYEQYF | RFPLTFGWCF |
| 3sjv | B*08 | TRAV12-1*01 | TRAJ23*01 | CVVRAGKLIF | TRBV6-2*01 | TRBJ2-4*01 | CASGQGNFDIQYF | FLRGRAYGL |
| 3ffc | B*08 | TRAV14/DV4*01 | TRAJ49*01 | CAMREDTGNQFYF | TRBV11-2*01 | TRBJ2-3*01 | CASSFTWTSGGATDTQYF | FLRGRAYGL |
| 1mi5 | B*08 | TRAV26-2*01 | TRAJ52*01 | CILPLAGGTSYGKLTF | TRBV7-8*01 | TRBJ2-7*01 | CASSLGQAYEQYF | FLRGRAYGL |
| 4qrp | B*08 | TRAV9-2*01 | TRAJ43*01 | CALSDPVNDMRF | TRBV11-2*01 | TRBJ1-5*01 | CASSLRGRGDQPQHF | HSKKKCDEL |
| 4g9f | B*27 | TRAV14/DV4*02 | TRAJ21*01 | CAMRDLRDNFNKFYF | TRBV6-5*01 | TRBJ1-1*01 | CASREGLGGTEAFF | KRWIIMGLNK |
| 4jrx | B*35 | TRAV19*01 | TRAJ34*01 | CALSGFYNTDKLIF | TRBV6-1*01 | TRBJ1-1*01 | CASPGETEAFF | LPEPLPQGQLTAY |
| 2ak4 | B*35 | TRAV19*01 | TRAJ34*01 | CALSGFYNTDKLIF | TRBV6-1*01 | TRBJ2-7*01 | CASPGLAGEYEQYF | LPEPLPQGQLTAY |
| 3mv7 | B*35 | TRAV20*01 | TRAJ58*01 | CAVQDLGTSGSRLTF | TRBV9*01 | TRBJ2-2*01 | CASSARSGELFF | HPVGEADYFEY |
| 4jry | B*35 | TRAV39*01 | TRAJ33*01 | CAVGGGSNYQLIW | TRBV5-6*01 | TRBJ2-7*01 | CASSRTGSTYEQYF | LPEPLPQGQLTAY |
| 3dxa | B*44 | TRAV26-1*01 | TRAJ13*02 | CIVWGGYQKVTF | TRBV7-9*01 | TRBJ2-1*01 | CASRYRDDSYNEQFF | EENLLDFVRF |
| 3kpr | B*44 | TRAV26-2*01 | TRAJ52*01 | CILPLAGGTSYGKLTF | TRBV7-8*01 | TRBJ2-7*01 | CASSLGQAYEQYF | EEYLKAWTF |
| 4mji | B*51 | TRAV17*01 | TRAJ22*01 | CATDDDSARQLTF | TRBV7-3*01 | TRBJ2-2*01 | CASSLTGGGELFF | TAFTIPSI |
| 2ypl | B*57 | TRAV5*01 | TRAJ13*01 | CAVSGGYQKVTF | TRBV19*01 | TRBJ1-2*01 | CASTGSYGYTF | KAFSPEVIPMF |
| 4p4k | DPA1*01/DPB1*352 | TRAV9-2*01 | TRAJ28*01 | CALSLYSGAGSYQLTF | TRBV5-1*01 | TRBJ2-5*01 | CASSLAQGGETQYF | QAFWIDLFETIG |
| 4may | DQA1*01/DQB1*05 | TRAV13-1*01 | TRAJ48*01 | CAASSFGNEKLTF | TRBV7-3*01 | TRBJ2-3*01 | CATSALGDTQYF | QLVHFVRDFAQL |
| 5ks9 | DQA1*03/DQB1*03 | TRAV20*01 | TRAJ39*01 | CAVALNNNAGNMLTF | TRBV9*01 | TRBJ2-3*01 | CASSVAPGSDTQYF | APSGEGSFQPSQENPQ |
| 4gg6 | DQA1*03/DQB1*03 | TRAV26-2*01 | TRAJ45*01 | CILRDGRGGADGLTF | TRBV9*01 | TRBJ2-7*01 | CASSVAVSAGTYEQYF | QQYPSGEGSFQPSQENPQ |
| 4z7u | DQA1*03/DQB1*03 | TRAV26-2*01 | TRAJ49*01 | CILRDRSNQFYF | TRBV9*01 | TRBJ2-5*01 | CASSTTPGTGTETQYF | APSGEGSFQPSQENPQGS |
| 4z7v | DQA1*03/DQB1*03 | TRAV26-2*01 | TRAJ54*01 | CILRDSRAQKLVF | TRBV9*01 | TRBJ2-7*01 | CASSAGTSGEYEQYF | APSGEGSFQPSQENPQGS |
| 4z7w | DQA1*03/DQB1*03 | TRAV8-3*01 | TRAJ36*01 | CAVGETGANNLFF | TRBV6-1*01 | TRBJ2-1*01 | CASSEARRYNEQFF | APSGEGSFQPSQENPQGS |
| 4ozh | DQA1*05/DQB1*02 | TRAV26-1*01 | TRAJ32*01 | CIVWGGATNKLIF | TRBV7-2*01 | TRBJ2-3*01 | CASSVRSTDTQYF | APQPELPYPQPGS |
| 4ozg | DQA1*05/DQB1*02 | TRAV26-1*01 | TRAJ45*01 | CIVLGGADGLTF | TRBV7-2*01 | TRBJ2-3*01 | CASSFRFTDTQYF | APQPELPYPQPGS |
| 4ozf | DQA1*05/DQB1*02 | TRAV26-1*01 | TRAJ54*01 | CIAFQGAQKLVF | TRBV7-2*01 | TRBJ2-3*01 | CASSFRALAADTQYF | APQPELPYPQPGS |
| 4ozi | DQA1*05/DQB1*02 | TRAV4*01 | TRAJ4*01 | CLVGDGGSFSGGYNKLIF | TRBV20-1*01 | TRBJ2-5*01 | CSAGVGGQETQYF | QPFPQPELPYPGS |
| 5ksa | DQA1*05/DQB1*03 | TRAV20*01 | TRAJ33*01 | CAVQFMDSNYQLIW | TRBV9*01 | TRBJ2-7*01 | CASSVAGTPSYEQYF | QPQQSFPEQEA |
| 5ksb | DQA1*05/DQB1*03 | TRAV20*01 | TRAJ6*01 | CAVQASGGSYIPTF | TRBV9*01 | TRBJ2-3*01 | CASSNRGLGTDTQYF | GPQQSFPEQEA |
| 4e41 | DRA*01/DRB1*01 | TRAV22*01 | TRAJ18*01 | CAVDRGSTLGRLYF | TRBV5-8*01 | TRBJ2-5*01 | CASSQIRETQYF | GELIGILNAAKVPAD |
| 2iam | DRA*01/DRB1*01 | TRAV22*01 | TRAJ54*01 | CAALIQGAQKLVF | TRBV6-6*01 | TRBJ1-3*01 | CASTYHGTGYF | GELIGILNAAKVPAD |
| 1fyt | DRA*01/DRB1*01 | TRAV8-4*01 | TRAJ48*01 | CAVSESPFGNEKLTF | TRBV28*01 | TRBJ1-2*01 | CASSSTGLPYGYTF | PKYVKQNTLKLAT |
| 3o6f | DRA*01/DRB1*04 | TRAV26-2*01 | TRAJ32*01 | CTVYGGATNKLIF | TRBV20-1*01 | TRBJ1-6*01 | CSARGGSYNSPLHF | FSWGAEGQRPGFGSGG |
| 1j8h | DRA*01/DRB1*04 | TRAV8-4*01 | TRAJ48*01 | CAVSESPFGNEKLTF | TRBV28*01 | TRBJ1-2*01 | CASSSTGLPYGYTF | PKYVKQNTLKLAT |
| 2wbj | DRA*01/DRB1*15 | TRAV17*01 | TRAJ40*01 | CATDTTSGTYKYIF | TRBV20-1*01 | TRBJ2-1*01 | CSARDLTSGANNEQFF | MDFARVHFISALHGSGG |
| 4h1l | DRA*01/DRB3*03 | TRAV8-3*01 | TRAJ37*01 | CAVGASGNTGKLIF | TRBV19*01 | TRBJ2-2*01 | CASSLRDGYTGELFF | QHIRCNIPKRISA |
| 1zgl | DRA*01/DRB5*01 | TRAV9-2*01 | TRAJ12*01 | CALSGGDSSYKLIF | TRBV5-1*01 | TRBJ1-1*01 | CASSLADRVNTEAFF | VHFFKNIVTPRTPGG |
-
*If there are multiple structures with the same TCR and HLA allele, only the ID of the highest-resolution structure is given. During CDR3 contact analysis, however, we combined the contacts from all redundant structures, downweighting so as to equalize the contribution from all TCR/HLA pairs.
Additional files
-
Transparent reporting form
- https://doi.org/10.7554/eLife.38358.034
Download links
A two-part list of links to download the article, or parts of the article, in various formats.
Downloads (link to download the article as PDF)
Open citations (links to open the citations from this article in various online reference manager services)
Cite this article (links to download the citations from this article in formats compatible with various reference manager tools)
Human T cell receptor occurrence patterns encode immune history, genetic background, and receptor specificity
eLife 7:e38358.
https://doi.org/10.7554/eLife.38358


