Efficient support of virus-like particle assembly by the HIV-1 packaging signal
- National Cancer Institute, United States
Figures
Figure 1
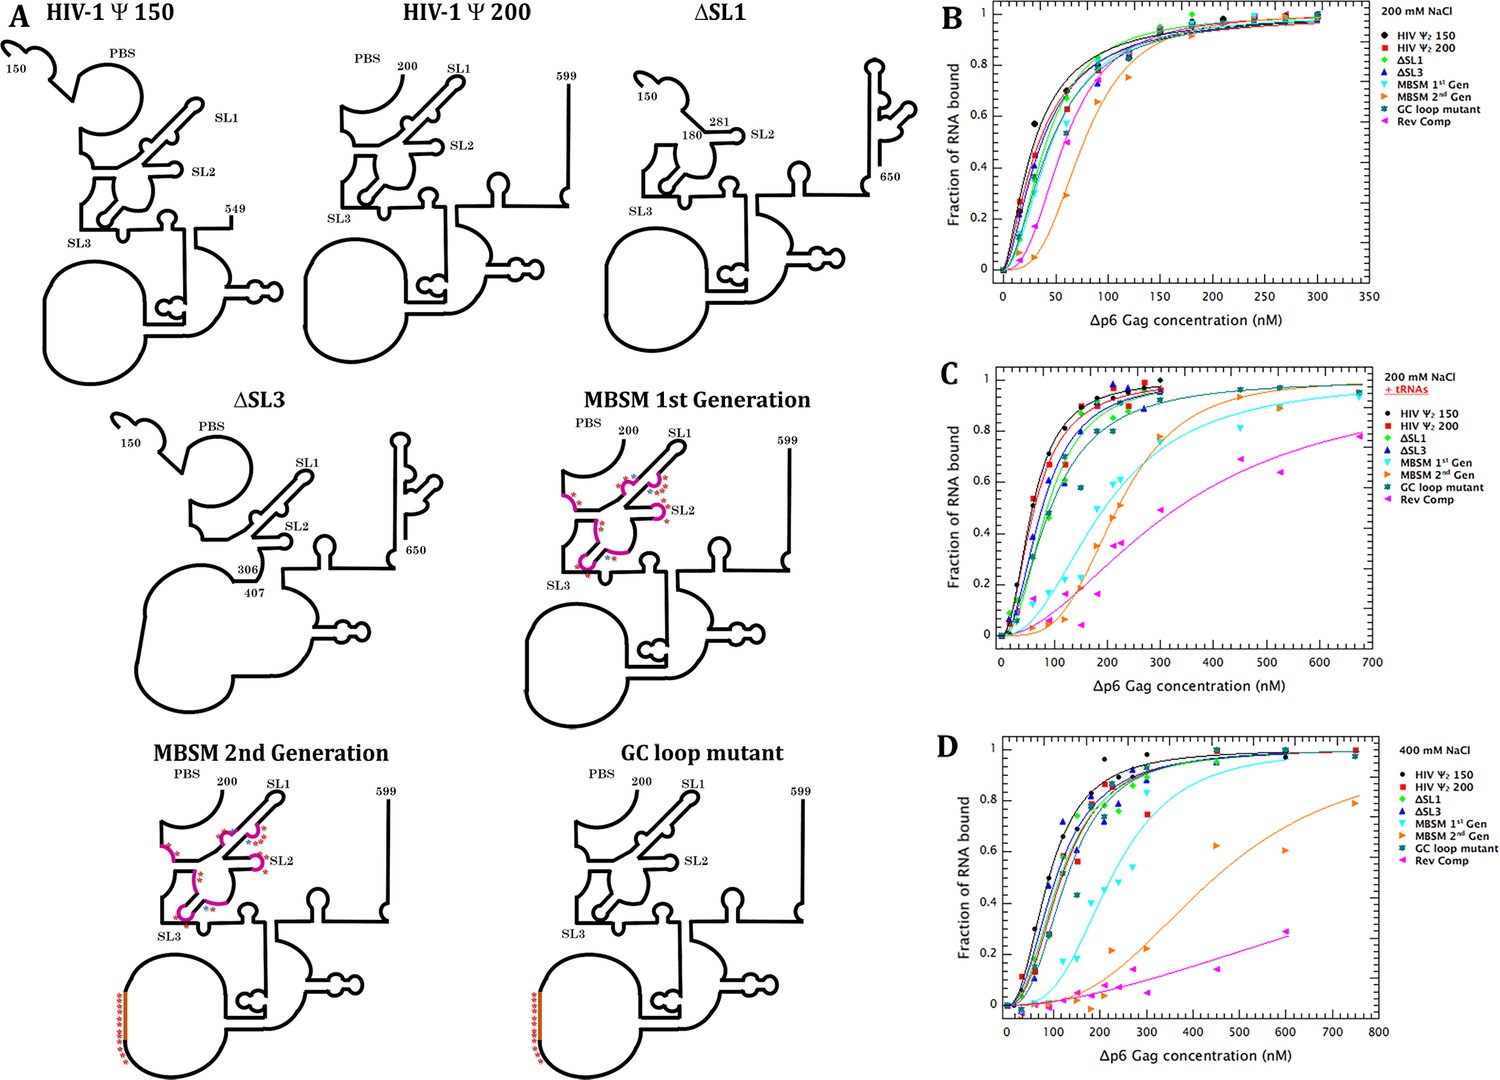
Schematic representation of the tested RNAs and their binding profiles to Gag measured by Cy5 quenching.
(A) Schematic representation of the expected secondary structure of the RNAs used in these experiments. These representations are based on the secondary structure proposed by Wilkinson and co-workers (Wilkinson et al., 2008). The purple stars in the MBSM first and second generation and the GC loop mutant RNAs indicate mutations of G to A, while the blue stars represent C to A mutations. (B) Binding curves for all of the tested RNAs with Δp6 Gag at 200 mM NaCl, monitored by quenching as previously described (Comas-Garcia et al., 2017). The buffer in this assay contained 0.2M NaCl, 20 mM Tris-HCl pH 7.5, 5 mM MgCl2, 1 µM ZnCl2, 0.1 mM PMSF, 1 mM β-mercaptoethanol, and 0.05%(v/v) Tween 20. (C) Binding curves obtained as in (B), but in the presence of a 50-fold excess by mass of yeast tRNA. (D) Binding curves obtained as in (B), but in a buffer containing 400 mM, rather than 200 mM, NaCl. Values in (B–D) are means of two independent experiments, and each point in each experiment is the mean of 10 measurements. Experiments giving KD values differing by >10% from the consensus values were discarded.
Figure 2 with 1 supplement

Comparison of RNA-Gag binding measurements by Cy5 quenching and Microscale Thermophoresis (MST).
(A) Comparison of FCS (i.e. Cy5 quenching in FCS apparatus) and MST methods for measurement of binding of Δp6 Gag to dimeric Ψ 200 RNA. The Cy5-tagged RNA was dimerized as described (Comas-Garcia et al., 2017) and diluted into binding buffer B to a concentration of 7 nM. This buffer was composed of 50 mM phosphate, pH 7.0, 0.05% Tween 20, 0.1 mM PMSF, and 1 mM β-mercaptoethanol, together with either 0.15 M or 0.45 M NaCl. The sample was then divided and, after 16 hr at 4°C, used for binding measurements by FCS or MST. Both methods give very similar KDs, although the MST curves suggest somewhat higher cooperativity in the binding than FCS. (B) Binding of Δ16–99 Gag protein to the three RNAs used for the Virus-like-particle (VLP) assembly experiments. Ψ 150 RNA, MBSM second generation RNA, and Reverse Complement RNA were all treated as described (Comas-Garcia et al., 2017) for Ψ dimerization. They were then diluted into Assembly Buffer (20 mM Tris pH 7.5, 0.15M NaCl, 5 mM MgCl2, 1 µM ZnCl2, 0.1% Tween 20, 0.1 mM PMSF, and 1 mM DTT). Binding of Δ16–99 Gag to the RNAs was then measured by MST. The FCS data in Figure 2A was treated as in Figure 1B–D. All MST data results are the means of three independent experiments. Each data-point in each MST experiment is the mean of triplicate measurements.
Figure 2—figure supplement 1
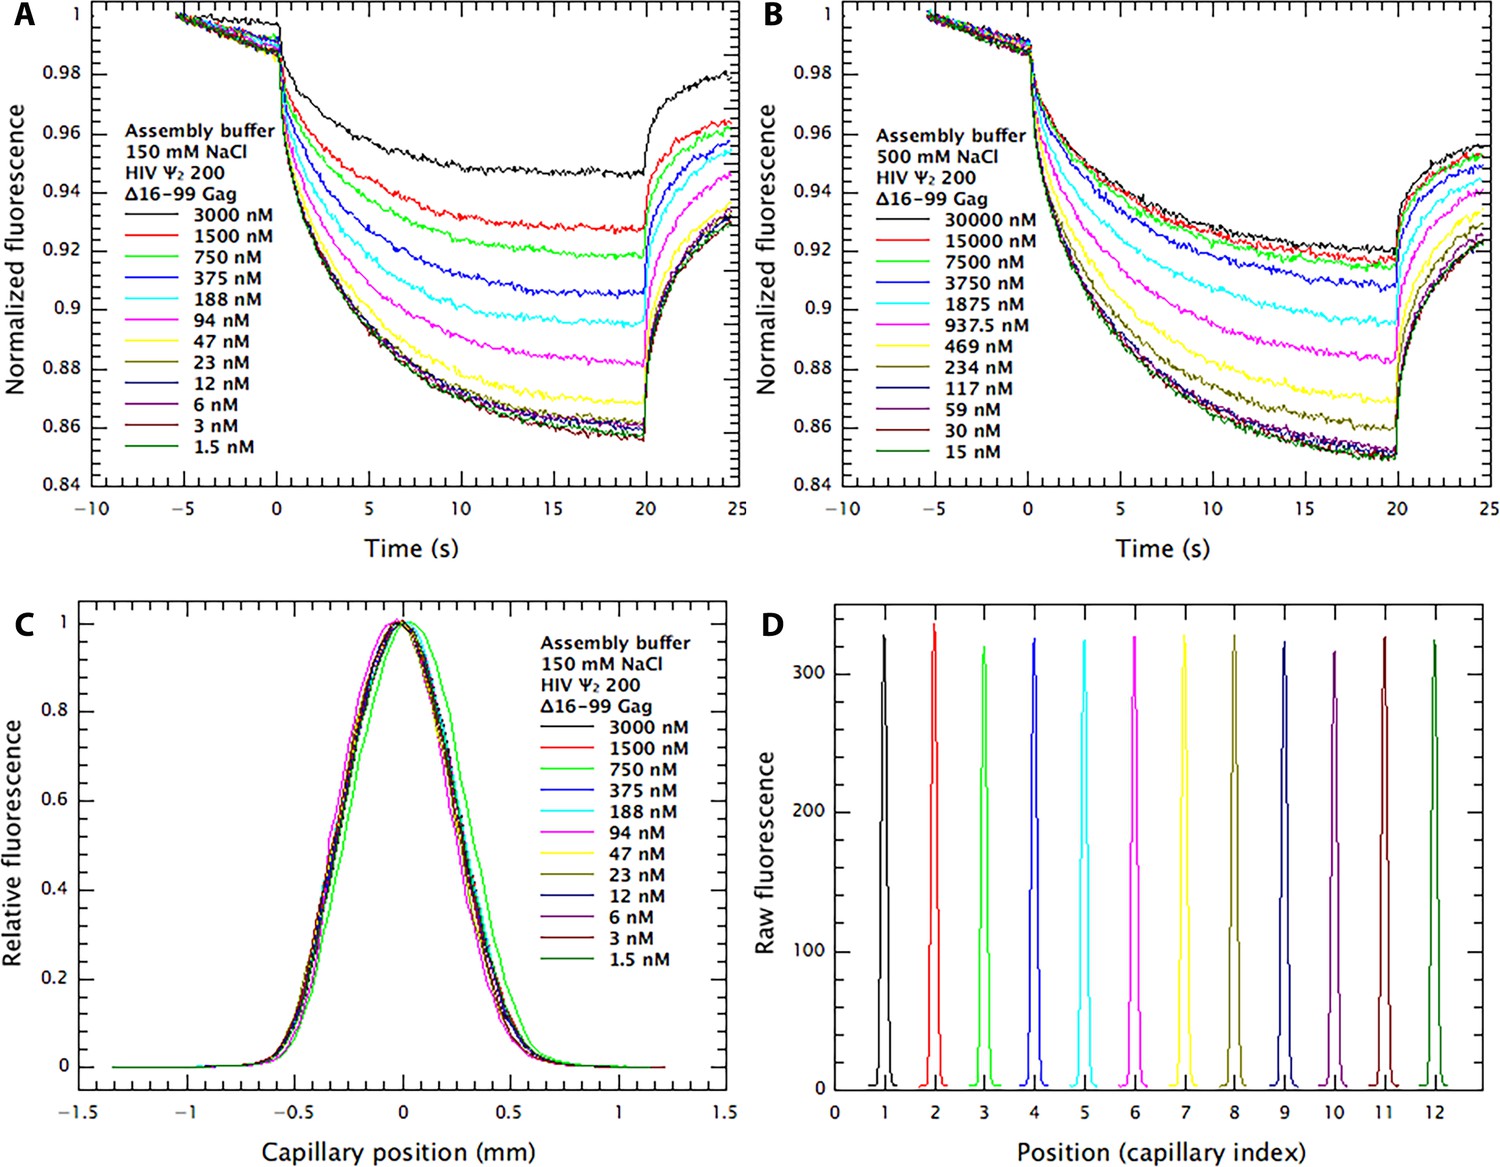
MST data on binding of Δ16–99 Gag protein to ψ RNA.
(A) and (B) Time traces of change in fluorescence as fluorescent ψ200 RNA diffuses in response to initiation of temperature jump at time 0 in different amounts of protein. (A), 0.15M NaCl; (B), 0.5M NaCl. (C), Superimposed cross-sectional fluorescence profiles in capillaries containing different amounts of protein in addition to the fluorescent RNA. The symmetrical curves indicate that no significant amount of fluorescent RNA is binding to the capillary walls. (D) Cross-sectional fluorescence profiles of the 12 capillaries in 0.15M NaCl, demonstrating that they contain nearly identical RNA concentrations.
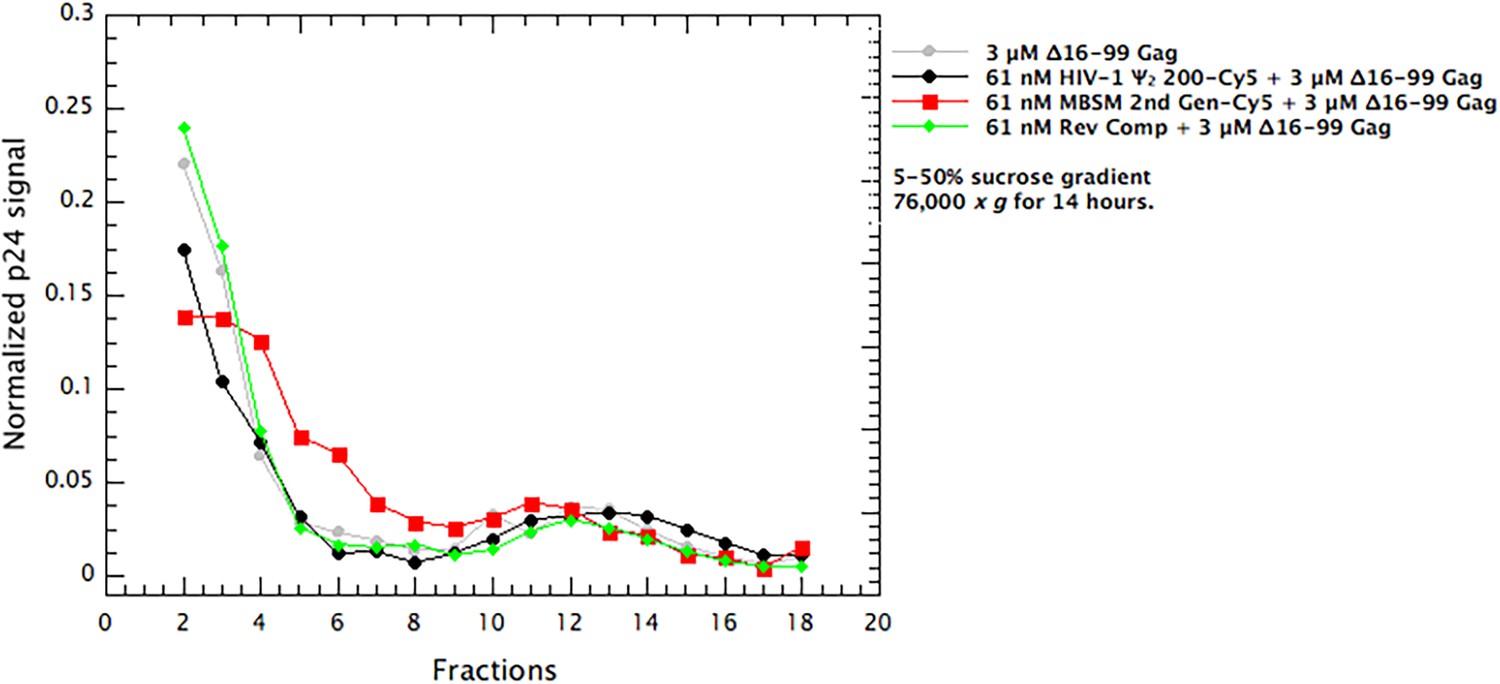
Figure 3
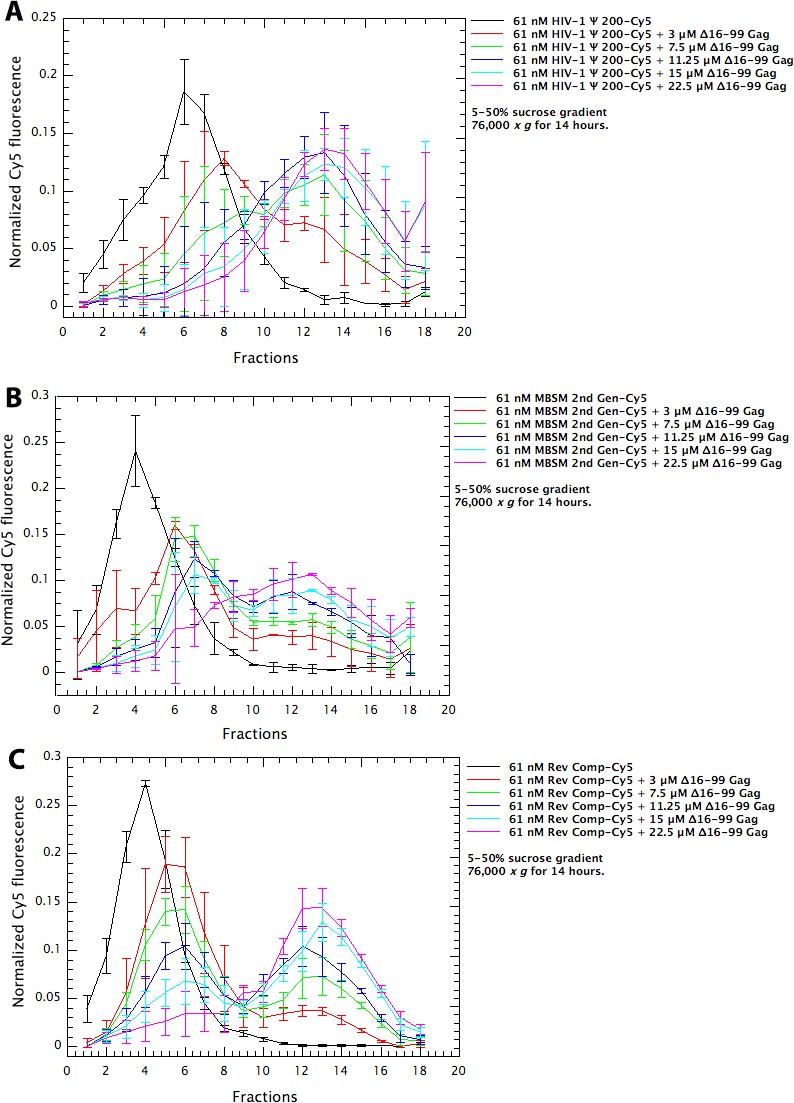
Assembly of Δ16–99 Gag protein on different RNAs.
Cy5-tagged Ψ 200 RNA (panel A), MBSM second generation RNA (panel B), and Reverse Complement RNA (panel C) were all treated as in the ‘RNA Dimerization’ protocol (Comas-Garcia et al., 2017). They were then diluted to 61 nM in Assembly Buffer and Δ16–99 Gag was titrated into these solutions. After 6 hr at 4°C, the mixtures were layered on 5–50% (w/v) sucrose gradients. The gradients had the same composition as Assembly Buffer except that they did not contain Tween 20, β-mercaptoethanol, or PMSF. After centrifugation for 14 hr at 76,000 x g, fractions were collected from top to bottom and assayed for Cy5 fluorescence and for Gag protein content by spotting aliquots onto nitrocellulose membrane and immunoblotting with anti-p24CA antiserum. The points are means and standard deviations of 3 independent experiments; experiments were excluded if the positions of the peaks were different from these consensus profiles.
Figure 4
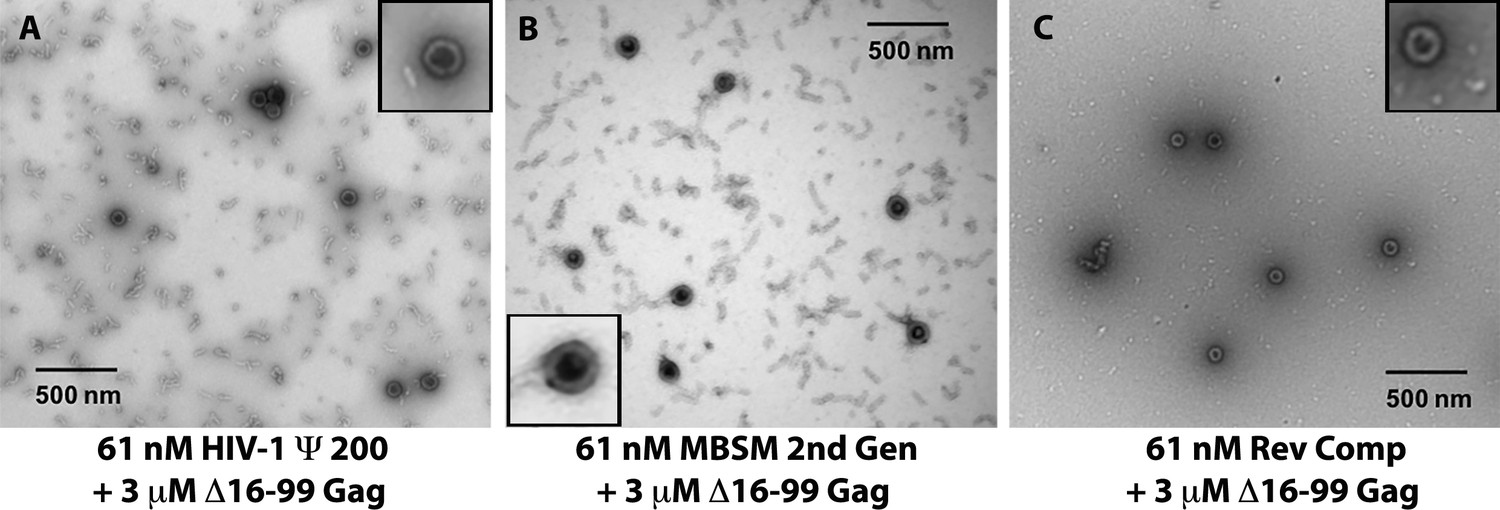
Negative stain electron micrographs on aliquots from the assembly reactions in (A-C).
Insets: well-formed VLPs at higher magnification.
Figure 5
Distribution of Δ16–99 Gag in the gradients in Figure 3A–C.
Aliquots of the gradient fractions were spotted on membranes and treated as in immunoblotting. A parallel dilution series showed that the measurements were within the linear range of the assay. The values are the means of two independent experiments.
Figure 6
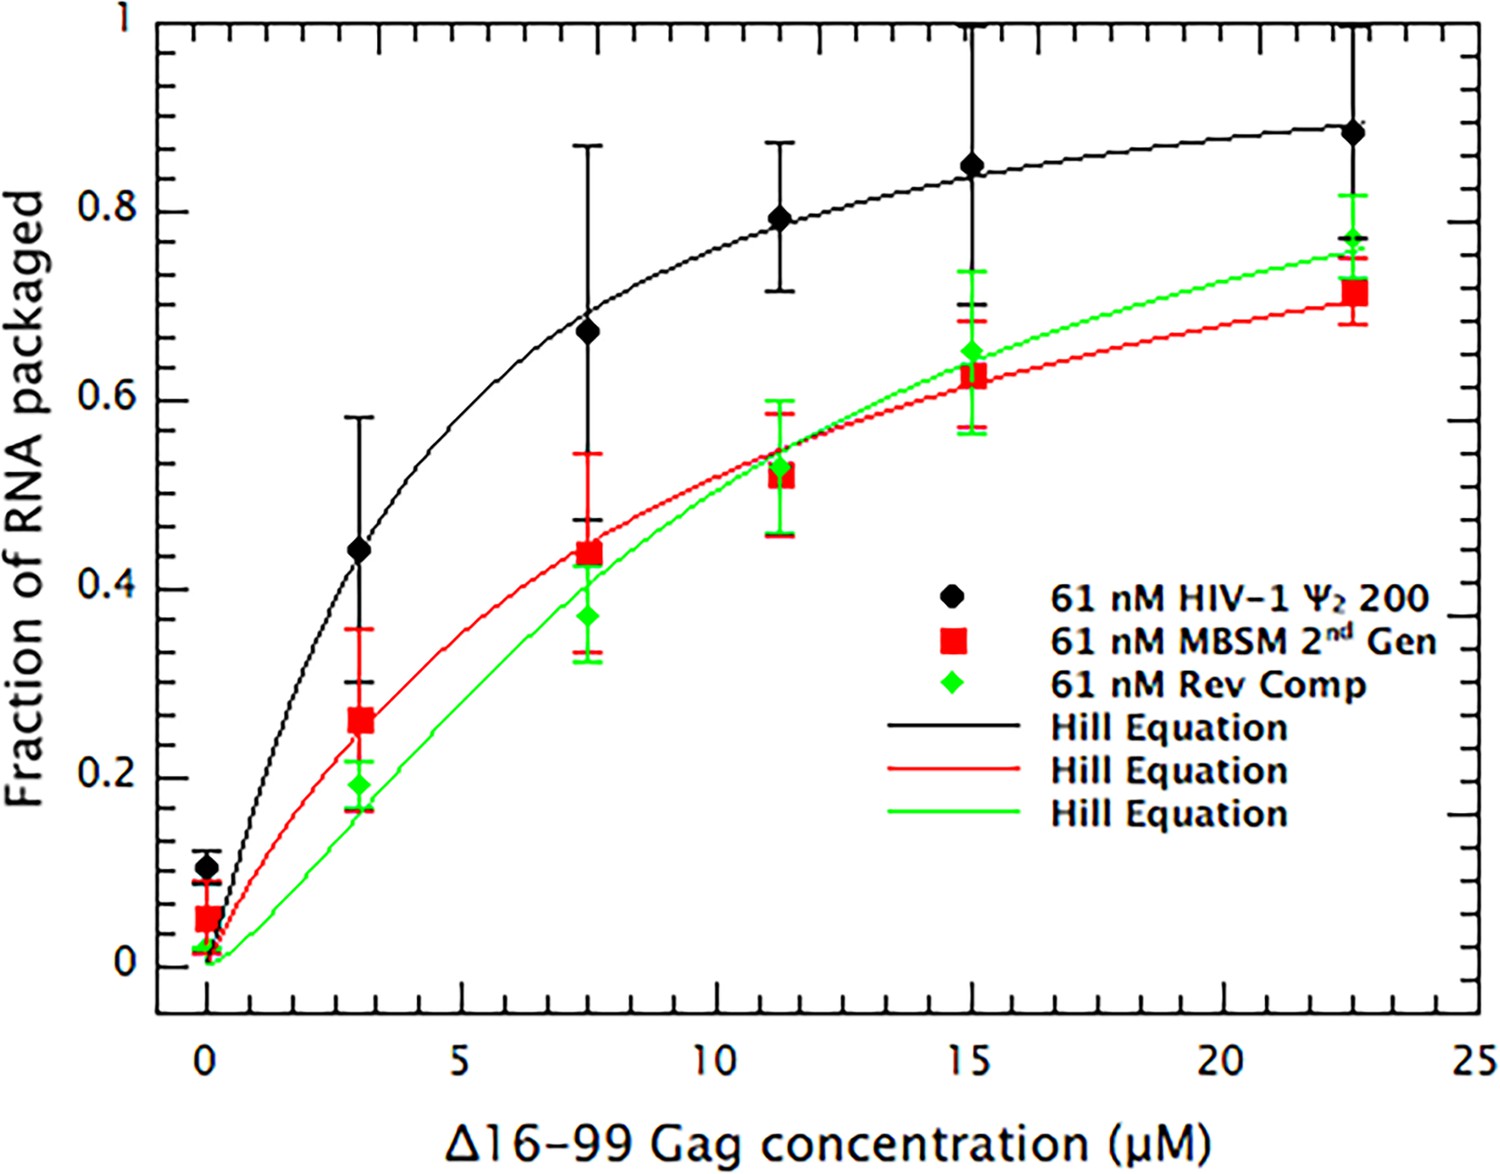
Quantitative comparison of the ability of dimeric HIV Ψ 200, MBSM second generation, and Reverse Complement RNAs to support VLP assembly.
RNA in fractions 10–18 in Figure 3(A–C is summed and plotted vs. the concentration of Δ16–99 Gag protein in the assembly reaction. The points are fitted with a cooperative model.
Tables
Table 1
Results of MST measurements of binding of Δ16-99 Gag to RNAs at 0.15 and 0.5M NaCl.
The Table shows means and standard deviations of replicate measurements.
| RNA (0.15M NaCl) | Kd (nM) | Error | nH | Error |
|---|---|---|---|---|
| Ψ200 | 645 | 16 | 3.2 | 0.2 |
| MBSM 2nd gen | 737 | 17 | 3.5 | 0.3 |
| Rev Comp | 1042 | 42 | 2.5 | 0.2 |
| RNA (0.5M NaCl) | ||||
| Ψ200 | 945 | 267 | 1.4 | 0.1 |
| MBSM 2nd gen | 2200 | 151 | 1.1 | 0.1 |
| Rev Comp | 2479 | 109 | 1.3 | 0.1 |
Table 2
K and n values and their errors from data shown in Figure 6.
https://doi.org/10.7554/eLife.38438.010| Sample | K (μM) | Error (μM) | N | Error |
|---|---|---|---|---|
| HIV Ψ 200 | 3.74 | ±0.56 | 1.2 | ±0.2 |
| MBSM 2nd Gen | 9.34 | ±0.58 | 1.0 | ±0.1 |
| Rev Comp | 9.94 | ±0.42 | 1.3 | ±0.1 |
Key resources table
| Reagent type (species) or resource | Designation | Source or reference | Identifiers | Additional information |
|---|---|---|---|---|
| Recombinant DNA reagent | Δp6 Gag expression plasmid | PMID 9971810 | ||
| Recombinant DNA reagent | Δ16–99 Gag expression plasmid | PMID 10619849 | ||
| Other | Ψ150 RNA | GenBank: AF324493.2 | nt 150–550 | |
| Other | Ψ200 RNA | GenBank: AF324493.2 | nt 200–600 | |
| Other | ΔSL1 RNA | GenBank: AF324493.2 | nt 150–180 joined to nt 280–650 | |
| Other | ΔSL3 RNA | GenBank: AF324493.2 | nt 150–305 joined to nt 405–650 | |
| Other | MBSM first generation RNA | GenBank: AF324493.2 | G224, G226, G240, G241, C243, G270, G272, G273, C274, G275, G289, G290, G292, G310, C312, G318, G320, G328, G239 of Ψ200 replaced with A's | |
| Other | MBSM second generation RNA | GenBank: AF324493.2 | G442, G443, G444, C445, G448, C449, G451, G452, G453, G455, C456, G459 of MBSM 1 st generation replaced with A's | |
| Other | GC loop mutant RNA | GenBank: AF324493.2 | G442, G443, G444, C445, G448, C449, G451, G452, G453, G455, C456, G459 of Ψ200 replaced with A's | |
| Other | Reverse Complement RNA | GenBank: AF324493.2 | RNA is complementary to Ψ150 |
Additional files
-
Transparent reporting form
- https://doi.org/10.7554/eLife.38438.011
Download links
A two-part list of links to download the article, or parts of the article, in various formats.
Downloads (link to download the article as PDF)
Open citations (links to open the citations from this article in various online reference manager services)
Cite this article (links to download the citations from this article in formats compatible with various reference manager tools)
Efficient support of virus-like particle assembly by the HIV-1 packaging signal
eLife 7:e38438.
https://doi.org/10.7554/eLife.38438


