NMDA spikes mediate amplification of inputs in the rat piriform cortex
- The Rappaport Faculty of Medicine and Research Institute, Technion-Israel Institute of Technology, Israel
- University of Haifa, Israel
- University of Southern California, United States
- University of Colorado School of Medicine, United States
Figures
Figure 1
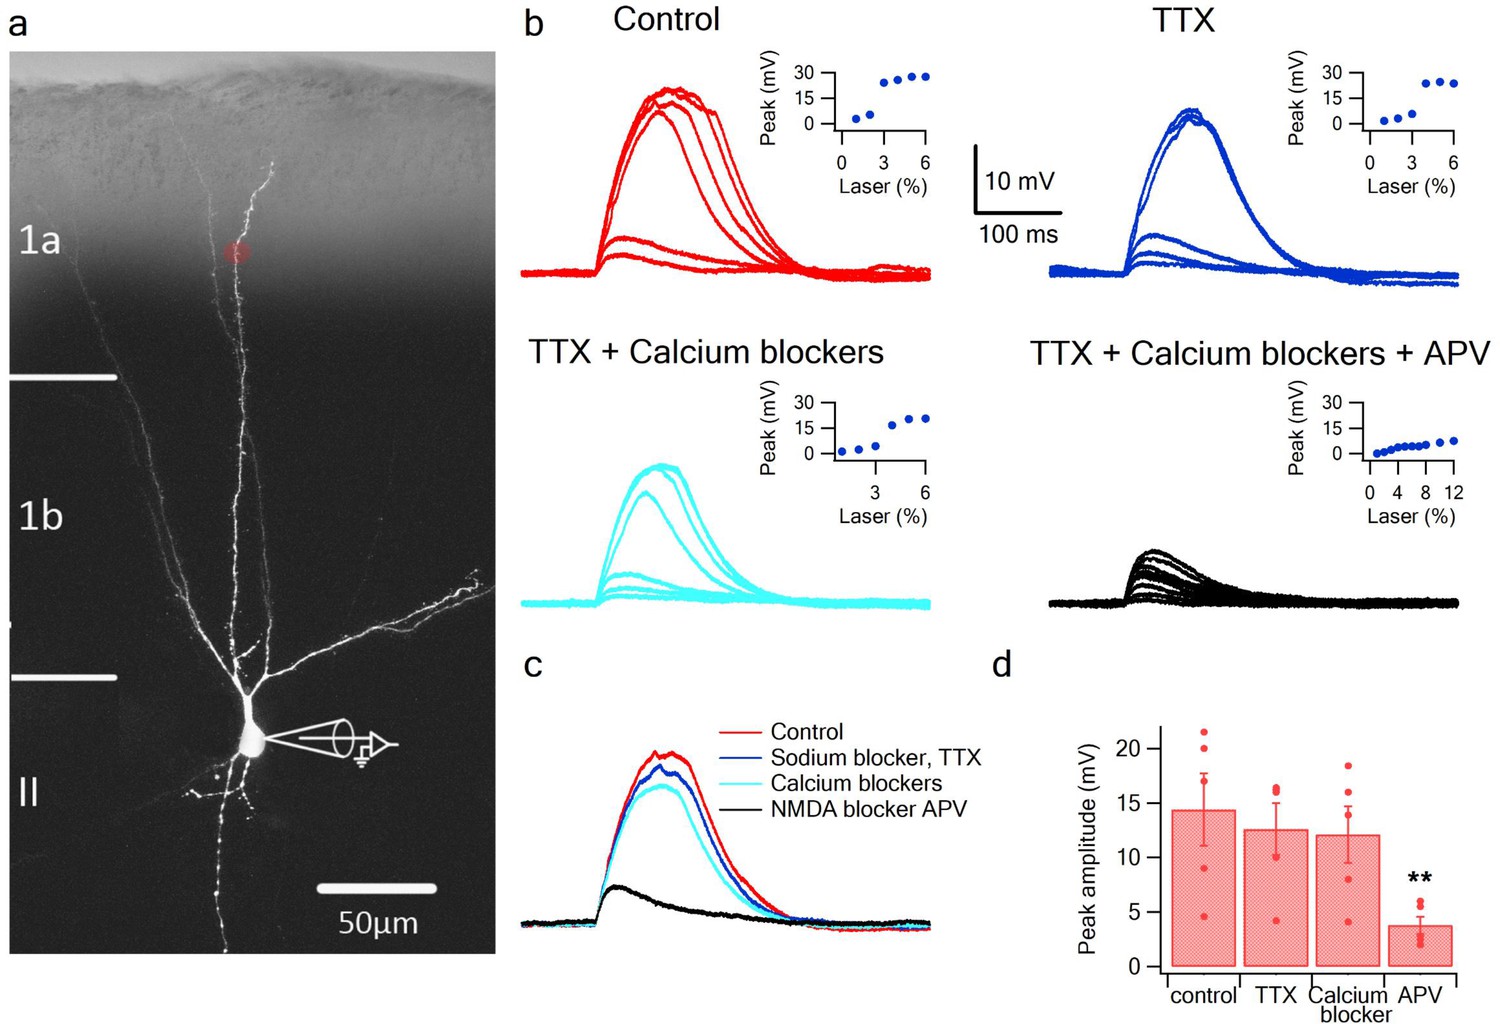
Glutamate uncaging evoked NMDA spikes in dendrites of PCx pyramidal neurons.
(a) Fluorescence image reconstruction of a pyramidal neuron filled with CF633 (200 µM) via the patch recording electrode. Uncaging location is indicated by the red dot. (b) Voltage responses and dendritic spikes were evoked by uncaging of MNI-glutamate at increasing laser intensities in the Control condition (red); in the presence of the voltage gated sodium channel blocker TTX (1 µm; blue); with an additional cocktail of voltage-gated calcium channel blockers (w-agatoxin 0.5 µM, conotoxin-GVIA 5 µM; SNX 482 200 nM, nifedipine 10 µM; cyan), and finally adding APV (50 µm; black). Insets, peak voltage response at increasing laser intensity for the different conditions. (c) Overlay of the spike in the Control condition (red), in TTX (blue), in TTX + calcium channel blockers (cyan) and with APV (black). All traces were collected using the same laser stimulation intensity. The spike was completely blocked with APV, and could not be reinitiated at higher laser intensities. (d) Summary plot of the peak response amplitude in control, TTX, Ca2+ blockers, and APV (n = 5). ** ANOVA test for comparison of all four groups (control, TTX, Ca blockers and APV) showed statistical significance (p < 0.05). Post-hoc analysis (Dunnett test) comparing each of the three groups (TTX, Ca blockers and APV) to the control yielded a significant difference only for comparison of APV to the control (p < 0.05).
Figure 2 with 1 supplement
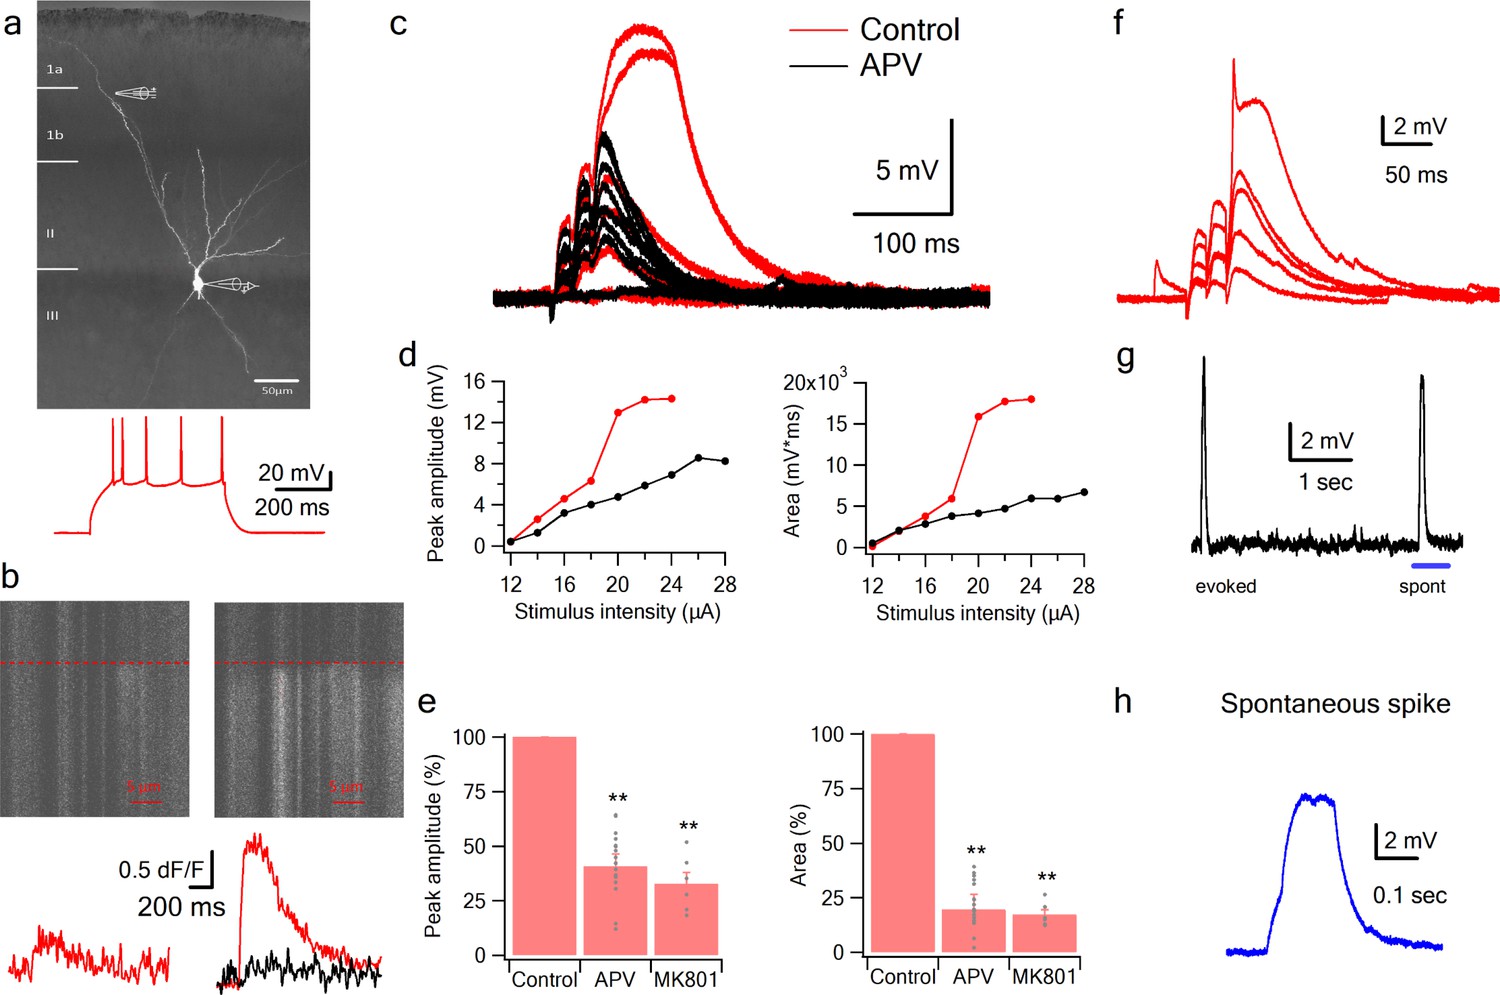
NMDA spikes evoked by LOT stimulation in PCx pyramidal neurons.
(a) A pyramidal neuron from PCx was loaded with the calcium sensitive dye OGB-6F (200 µm) and CF633 (200 µm) via the patch recording electrode. A focal double-barreled synaptic stimulating theta electrode was placed distally within the LOT innervation zone (280 µm from soma). Bellow, is somatic action potential firing patter in response to somatic step current injection (500 ms). (b) Line scan crossing the dendrite close to the stimulating electrode, showing calcium transients for a subthreshold EPSP (left) and for a dendritic spike at the same site (right). Dashed line denotes the time when the stimulus was delivered. Bottom traces show calcium transients in Control (red) and after addition of APV (black) for a subthreshold EPSP (left) and a dendritic spike (right). (c) Voltage responses evoked by gradually increasing synaptic stimulation consisting of a burst of 3 pulses at 50 Hz. With gradually increasing stimulus intensity, an all-or-none response was evoked in control solution (red), which was blocked with the addition of the NMDAR blocker APV (50 µM, black). No biccuculine was added in this experiment. (d) Voltage response peak and area plotted as a function of stimulus intensity for the cell shown in A, showing a sigmoidal curve in the Control condition (red) and a linear curve with APV (black). (e) Summary plot mean (±SEM) for spike peak amplitude and area in Control (n = 48) and after APV application (n = 17) or intracellular MK801 (n = 6). The tip of the electrode was filled with 1 µL of control solution and back-filled with solution containing MK801(1 mM). (f) Example of a combined NMDA spike and fast spikelet probably representing a local sodium event. (g) Example of a spontaneous spike recorded in succession to the synaptically evoked spike denoted by the blue bar is shown with higher time resolution in (h) **p < 0.01 for comparison with control. Comparison between APV and MK801 did not reach statistical significance.
Figure 2—figure supplement 1
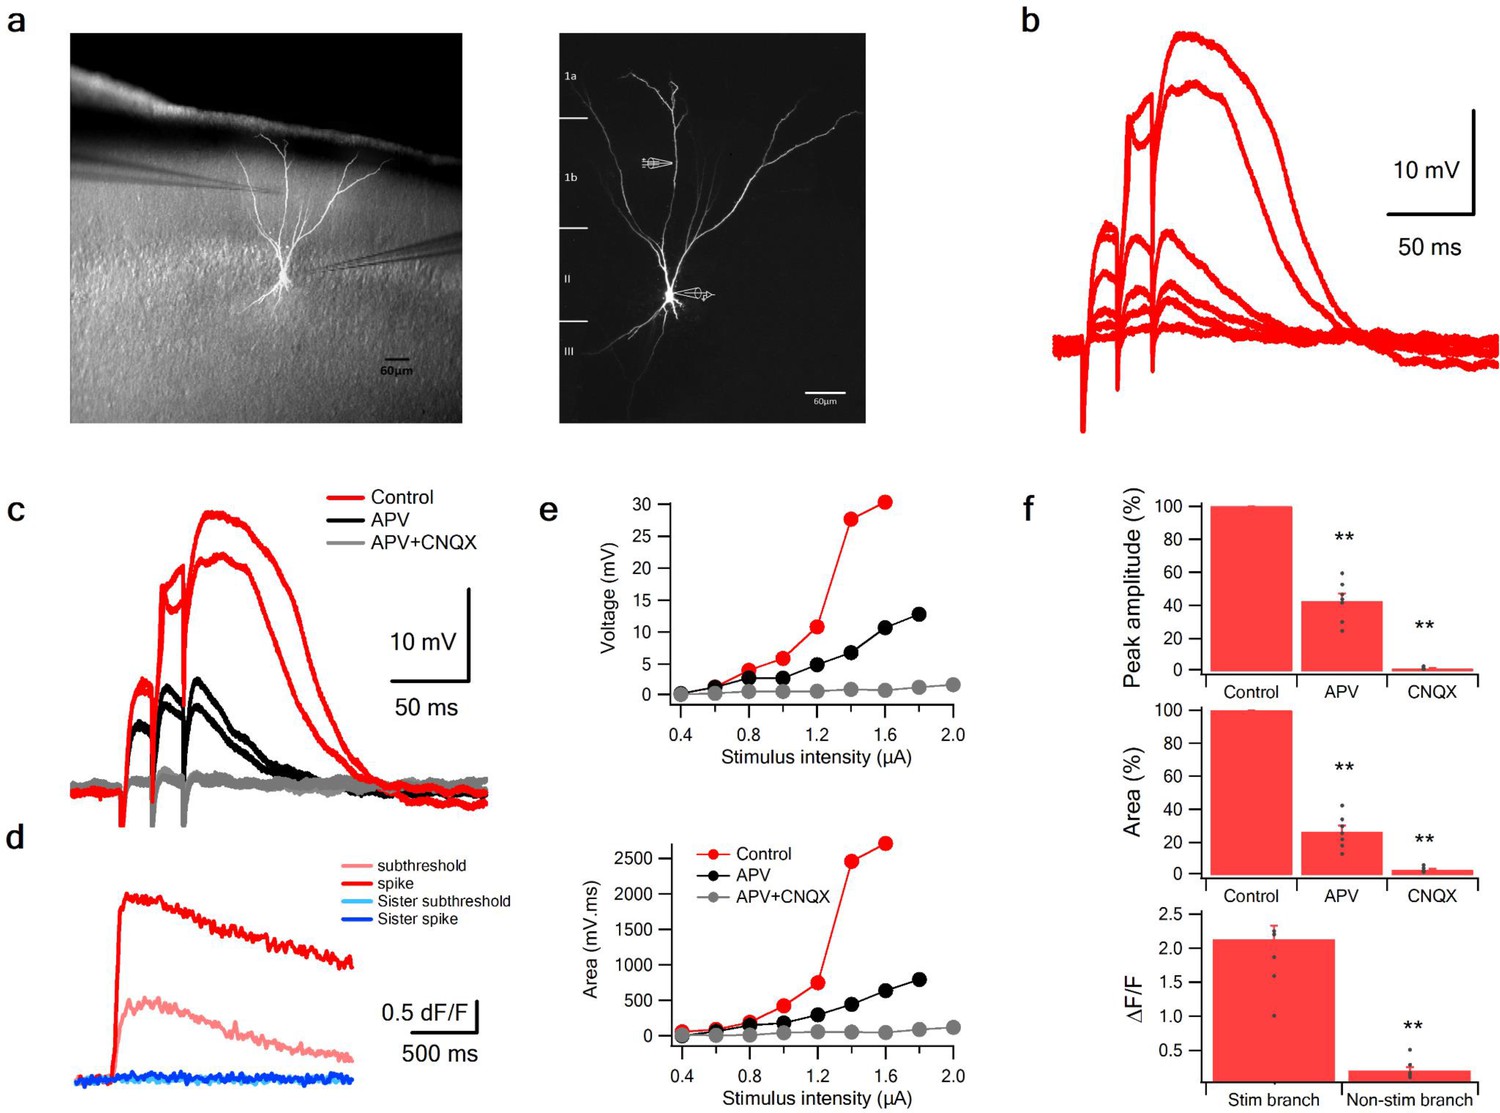
NMDA spikes in PCx pyramidal neurons: parasagittal slices.
(a) Parasagittal PCx slice showing reconstructed layer two pyramidal neuron. Right, same neuron as shown with higher magnification, patch clamp recording electrode and stimulating electrodes (200 µm from soma) are illustrated. The pyramidal neuron was filled with intracellular solution containing high chloride concentration (20 mM) and calcium sensitive dye OGB-6F (200 µM). Calcium imaging was performed from the stimulated dendrite (red circle) and non-stimulated sister dendrite (blue circle). (b) Voltage responses evoked by gradually increasing synaptic stimulation consisting of a burst of 3 pulses at 50 Hz. (c) Spike was evoked in control conditions (red), which was blocked with the addition of the NMDAR blocker APV (50 µM, black). The residual EPSP was abolished with CNQX (10 µM, grey). (d) Calcium transients evoked at just threshold stimulation (ligh red and blue) and at threshold stimulation for NMDA spike (red and blue) at the stimulated dendrite (red) and sister dendrite (blue). **p < 0.01 (e). Current voltage (upper panel) and area (bottom panel) relationship in control (red), APV (black) and CNQX (grey). (f). Summary plot mean (±SEM) for spike peak amplitude (upper panel) and area (middle panel) in control (n = 10), after APV application (n = 7) and CNQX (n = 6). Lower panel peak calcium transients (ΔF/F) in the stimulated and non-stimulated dendritic branches (n = 8). ANOVA test for comparison of all three groups (control, APV and CNQX) showed statistical significance (p < 0.01). **p < 0.01 for post-hoc analysis (Dunnett test) comparing each of the two groups (APV and CNQX) to the control yielded a significant difference (p < 0.01). In addition, comparison of the CNQX and APV groups using the post-hoc Tuckey-Kramer test also yielded p < 0.01.
Figure 3
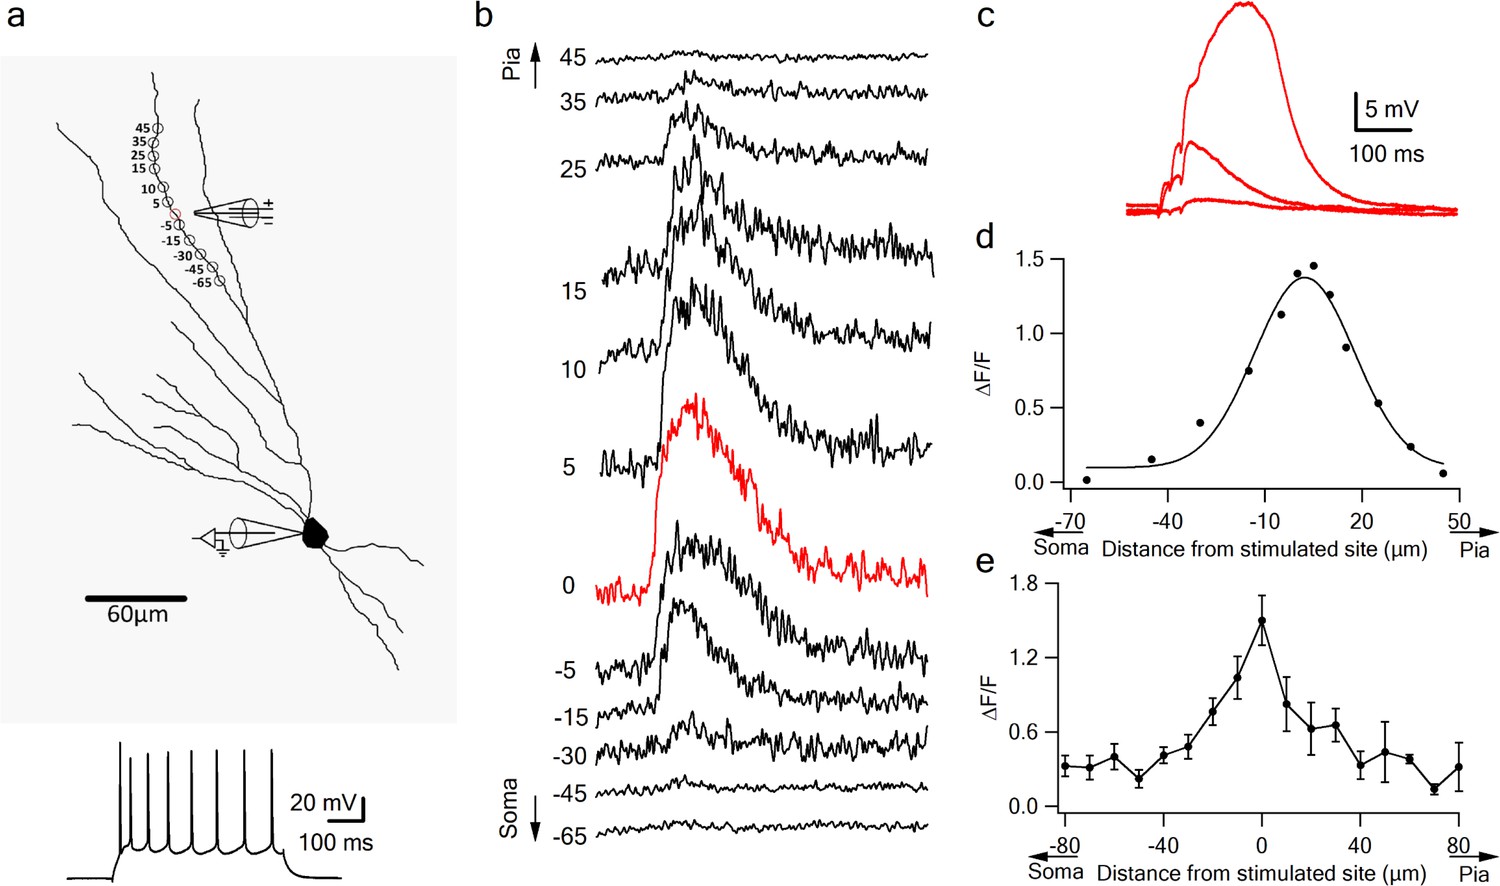
Local calcium transients evoked by dendritic NMDA spikes.
(a) Fluorescence reconstruction of a layer IIB pyramidal neuron, showing stimulation electrode (288 µm from soma) and the sites of calcium imaging (red circle denotes the location of synaptic stimulation). Bellow, is somatic action potential firing patter in response to somatic step current injection (500 ms). (b) Calcium profile along the stimulated apical dendrite. Calcium transients are expressed as ∆F/F shown for different segments around the stimulated site (as illustrated in A). ‘0’ denotes stimulation location, while distances (in µm) from stimulation site towards pia is indicated as +ve and towards soma as –ve. (c) Example of subthreshold EPSPs and an NMDA spike evoked at this recording site. d. Calcium profile (peak ∆F/F) fitted by a Gaussian curve plotted as a function of distance of spike location (for the experiment shown in a-b). (e) Summary plot of mean change in calcium transient (∆F/F ± SEM) evoked by an NMDA spike, as a function of the distance from the center of a stimulated segment (0) averaged in 10 µm segments, from proximal (-ve values) to distal (+ve locations). All cells contained OGB-6F dye, perfused through the patch pipette (n = 5).
Figure 4
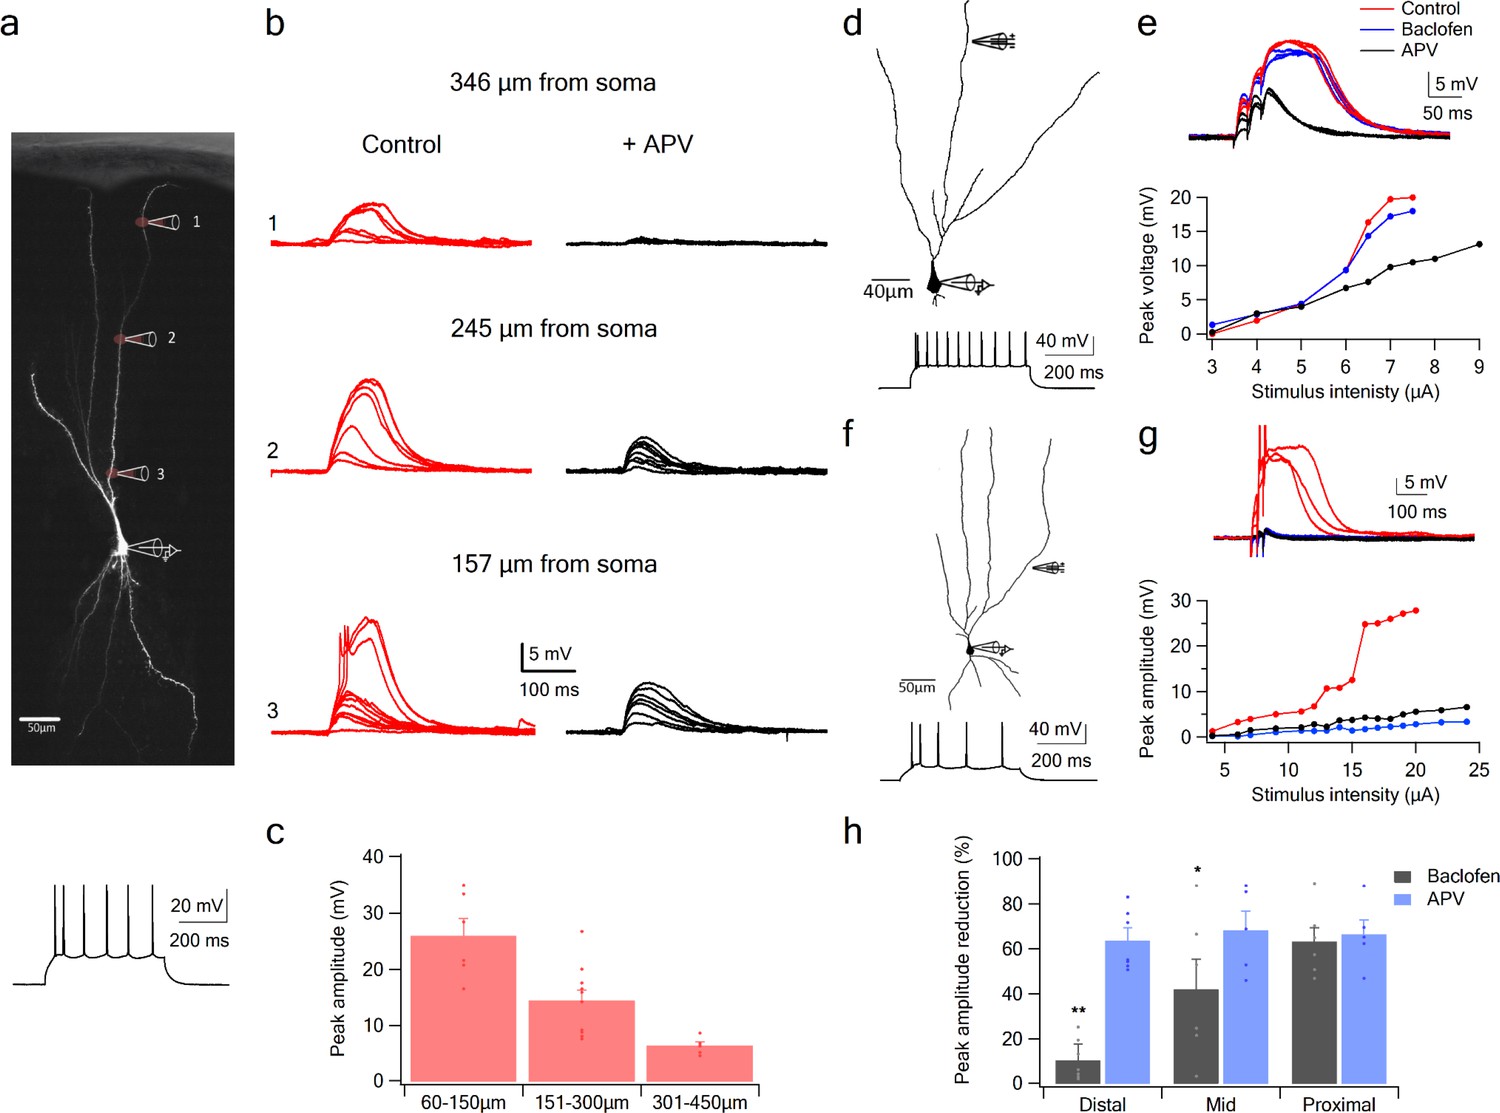
NMDA spike initiation with LOT and IC inputs.
(a) Pyramidal neuron was loaded with the fluorescent dye CF-633 (200 µm) via the somatic patch recording electrode. Glutamate (MNI-glutamate) was uncaged at three sites as indicated by red circles (346 µM, 245 µM and 157 µm from soma). Bellow, is somatic action potential firing patter in response to somatic step current injection (500 ms). (b) Somatic voltage responses evoked by increasing laser intensity at the dendritic locations indicated in A, in Control (left, red) and with the blocker APV (right, black). (c) Summary plot of dendritic spike peak amplitudes as recorded at the soma, as a function of distance from the soma (n = 11). (d) Reconstruction of a pyramidal neuron showing a focal stimulation electrode at a distal LOT receiving zone (244 µm from soma). Bellow, is somatic action potential firing patter in response to somatic step current injection (500 ms). (e) NMDA spike in Control (red), after sequential addition of Baclofen (100 µM; blue) and APV (50 µM; black). Bottom, plot of peak voltage response as a function of stimulus intensity for Control (red), in the presence of baclofen (blue) and sequential addition of APV (black). (f) Reconstruction of a pyramidal neuron showing focal stimulating electrode at a proximal IC dendritic receiving zone (148 µm from soma). Bellow, is somatic action potential firing patter in response to somatic step current injection (500 ms). (g) NMDA spike in Control (red), after sequential addition of Baclofen (100 µM; blue) and APV (50 µM; black). Bottom, plot of peak voltage response as a function of stimulus intensity for Control (red), in the presence of baclofen (blue) and sequential addition of APV (black). (h) Summary plot of mean percent reduction in voltage amplitude measured at NMDA spike threshold in control conditions (mean % reduction peak voltage ± SEM) in the presence of baclofen and APV, for distal (n = 7), middle (n = 6) and proximal (n = 6) spike locations. *p < 0.05; **p < 0.01.
Figure 5 with 1 supplement
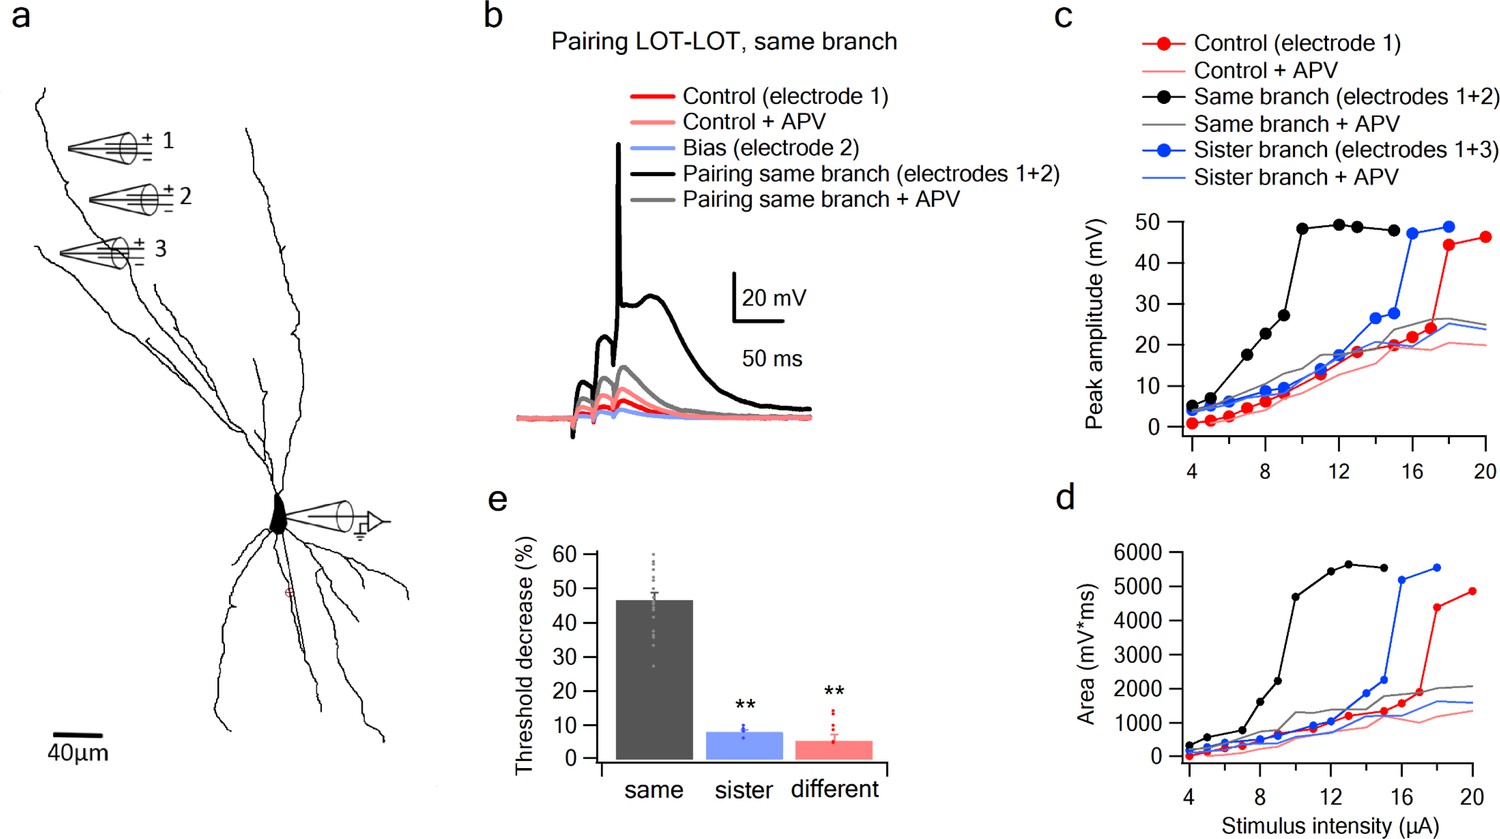
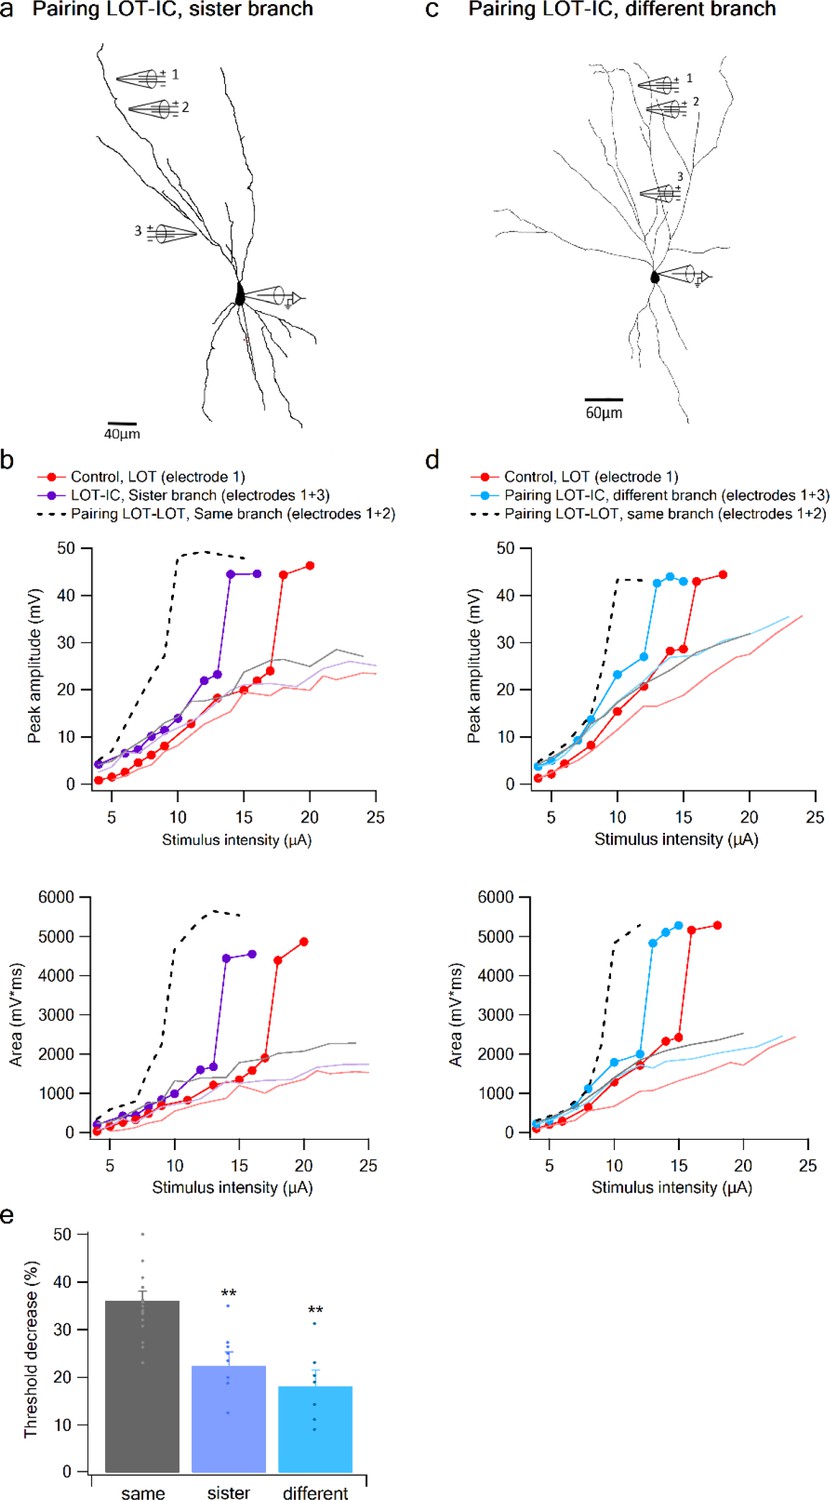
Summation of LOT inputs on same, sister and different dendritic branches.
(a) Reconstruction of a layer IIB pyramidal neuron filled with the fluorescent dye CF-633 (200 µM) with stimulating electrodes positioned within an LOT-receiving zone in same dendritic branch (electrodes 1, 2) and sister branch (electrode 3). (b) Voltage responses to pairing LOT inputs in same branch (electrodes 1 + 2) in Control (black) and with APV (grey). Example responses to electrode one separately (red), electrode 2 (blue, bias voltage), and electrode one with APV (light red) are shown. c. Stimulus response curves (peak voltage) for paired LOT inputs within the same branch (electrodes 1 + 2; inter-electrode distance 38 µm) and pairing with a sister branch (electrode 1 + 3). d. Same as in C, for area of the responses. e. Summary plot of percent decrease of spike threshold in the paired condition relative to Control for LOT-LOT inputs in same branch (grey) sister branch (blue) and different branch (red). ** ANOVA test for comparison between the three groups (same, sister, different branches) showed statistical significance (p < 0.01). Post-hoc analysis (Tukey-Kramer test) comparing each group with every other group yielded significant differences between same branch and sister and different branches (p < 0.01), but no statistical significance between sister and different branches (p = 0.37).
Figure 5—figure supplement 1
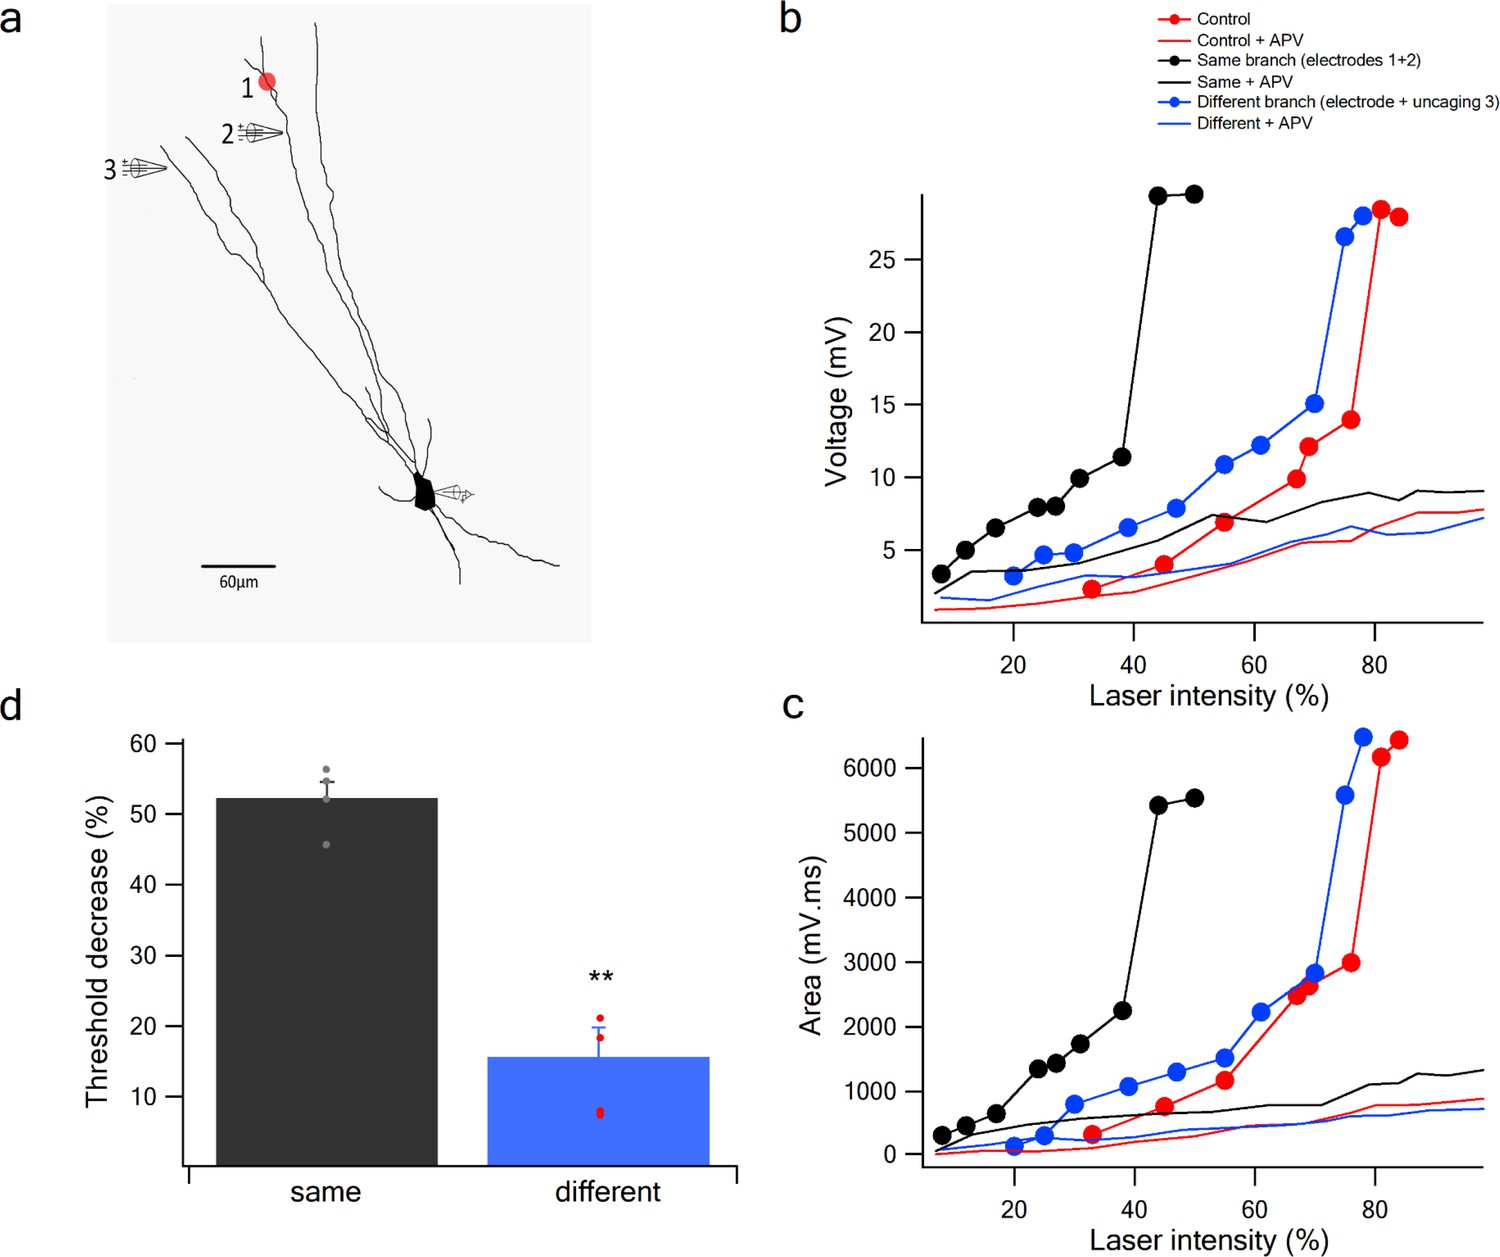
Pairing activation of LOT inputs with glutamate uncaging at distal dendritic branches.
(a) Reconstruction of a layer IIA pyramidal neuron filled with the fluorescent dye CF-633 (200 µM) with a single glutamate uncaging spot at distal dendrite (red spot) along with a stimulating electrode positioned within an LOT-receiving zone in same dendritic branch (electrodes 2) or different branch (electrode 3) providing bias voltage. (b) Stimulus response curves (peak voltage) for glutamate uncaging (red), paired glutamate uncaging with LOT inputs within the same branch (black; spot 1 and electrode 2; inter-electrode distance 34 µm) and with a different branch (blue; spot 1 and electrode 3). (c) Same as in b, for area of the responses. Solid lines in the presence of APV. (d) Summary plot of percent decrease of spike threshold in the paired condition relative to Control for glutamate uncaging-LOT inputs in same branch (black) and different branch (blue). n = 4; **p < 0.01.
Figure 6
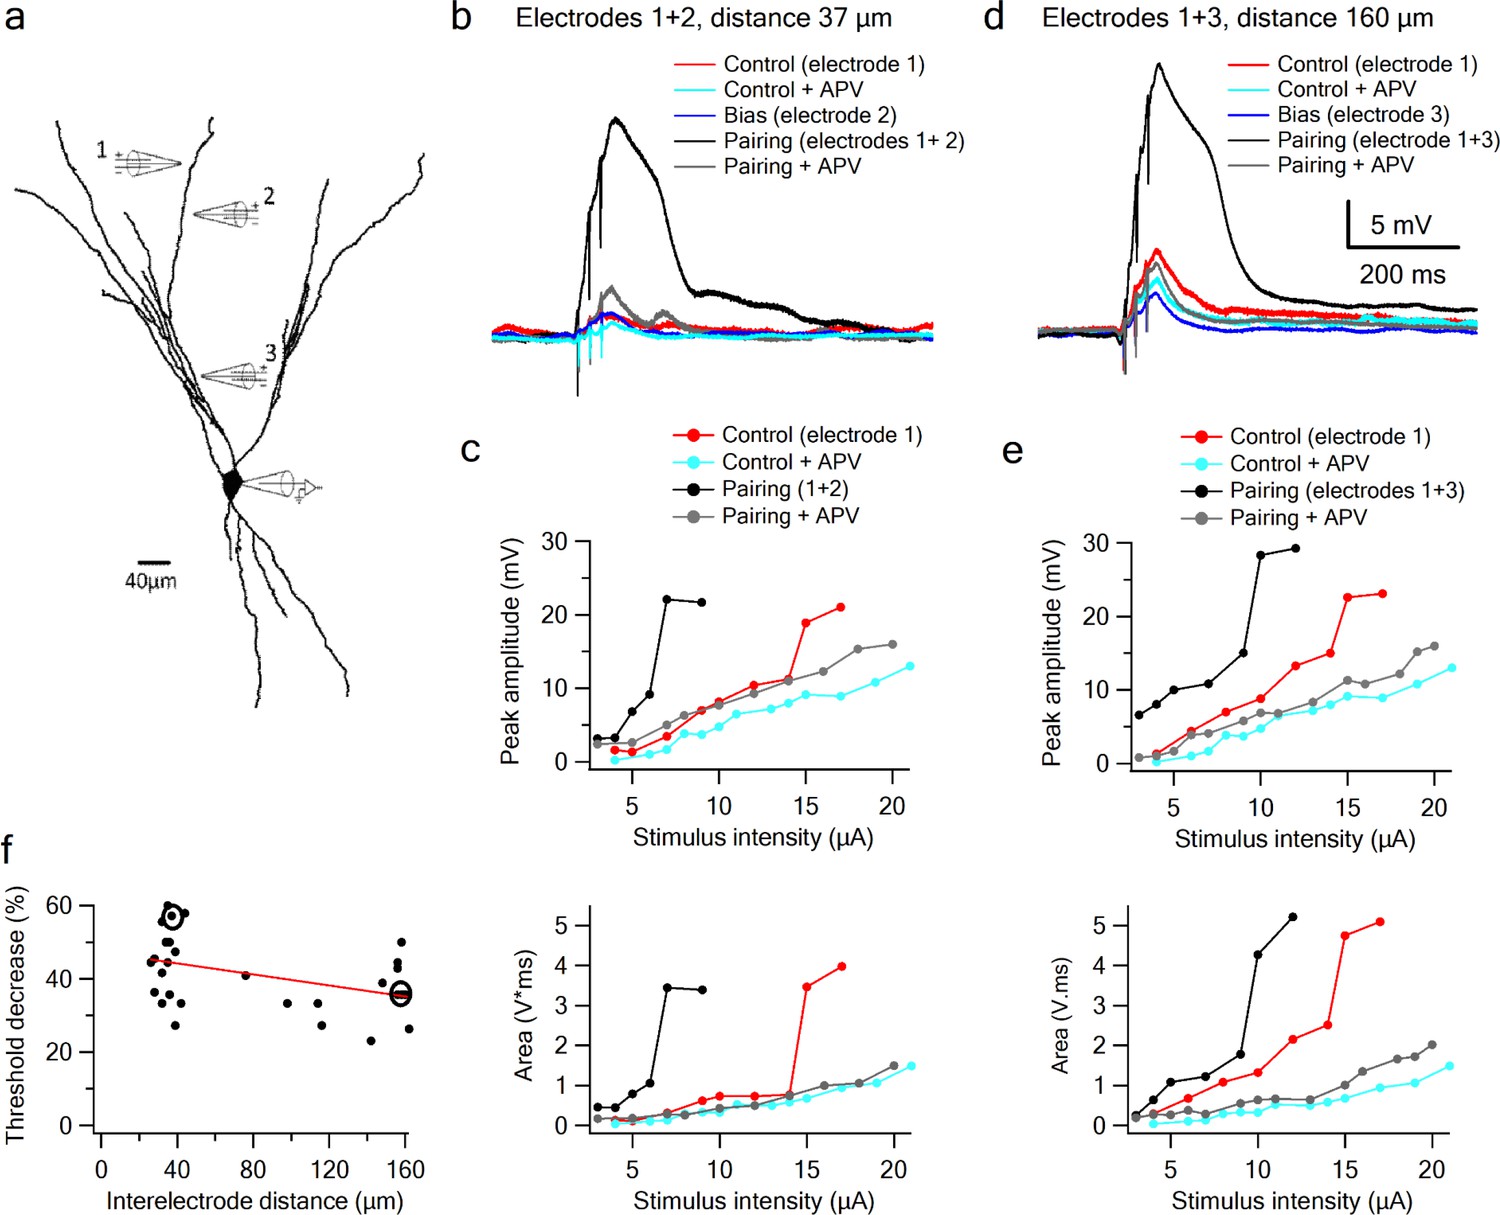
Supralinear summation of LOT and IC inputs on a single dendritic branch.
(a) Reconstruction of a layer III pyramidal neuron filled with the fluorescent dye CF-633 (200 µM). Three stimulating electrodes where positioned in close proximity to same dendritic branch, with electrodes 1 and 2 within the LOT-receiving zone and electrode three within the IC-receiving zone. (b) Voltage responses for paired LOT inputs on the same branch (electrodes 1 and 2, inter-electrode distance 37 µm). Example responses are shown for electrode 1 (red), electrode 1 + APV (cyan), electrode 2 (blue, bias voltage), pairing activation of electrodes 1 + 2 (black), and pairing activation of electrodes 1 + 2 in the presence of APV. (c) Stimulus response curves for LOT pairing on the same branch (top voltage; bottom area). (d) Same as b, for pairing LOT and IC inputs on the same branch (electrodes 1 and 3, inter-electrode distance 160 µm). (e) Stimulus response curves for LOT and IC pairing on same branch (top voltage; bottom area). (f) Summary plot of percent decrease of spike threshold (paired condition relative to control) as a function of inter-electrode distance in same branch. Circles show the examples shown in the figure. Slope = −0.075 ± 0.03 mV/µm.
Figure 7
Summation of LOT and IC inputs on sister and different dendritic branches.
(a) Reconstruction of a layer IIB pyramidal neuron (same as in Figure 6) filled with the fluorescent dye CF-633 (200 µM) with electrodes positioned within LOT regions of the same branch (electrodes 1,2), or at IC-receiving dendritic regions at sister branch (electrode 3). (b) Stimulus response curves for a single electrode (1, red), paired LOT-IC responses located on sister branches (1 + 3, purple), shown for peak amplitude (top) and area (bottom). Solid lines show same responses in the presence of APV. For comparison the paired LOT-LOT curve on the same branch (dotted black) is shown. (c) Reconstruction of a layer IIB pyramidal neuron filled with the fluorescent dye CF-633 (200 µM) with electrodes positioned within the LOT-receiving region of the same branch (electrodes 1,2), or at IC-receiving dendritic region at different branch (electrode 3). (d) Same as in B but for LOT and IC inputs activated on different branches. (e) Summary plot of percent decrease of spike threshold in paired condition relative to control for LOT-IC inputs to the same branch (grey), sister branch (blue), and different branch (teal). **p < 0.01.
Figure 8 with 3 supplements
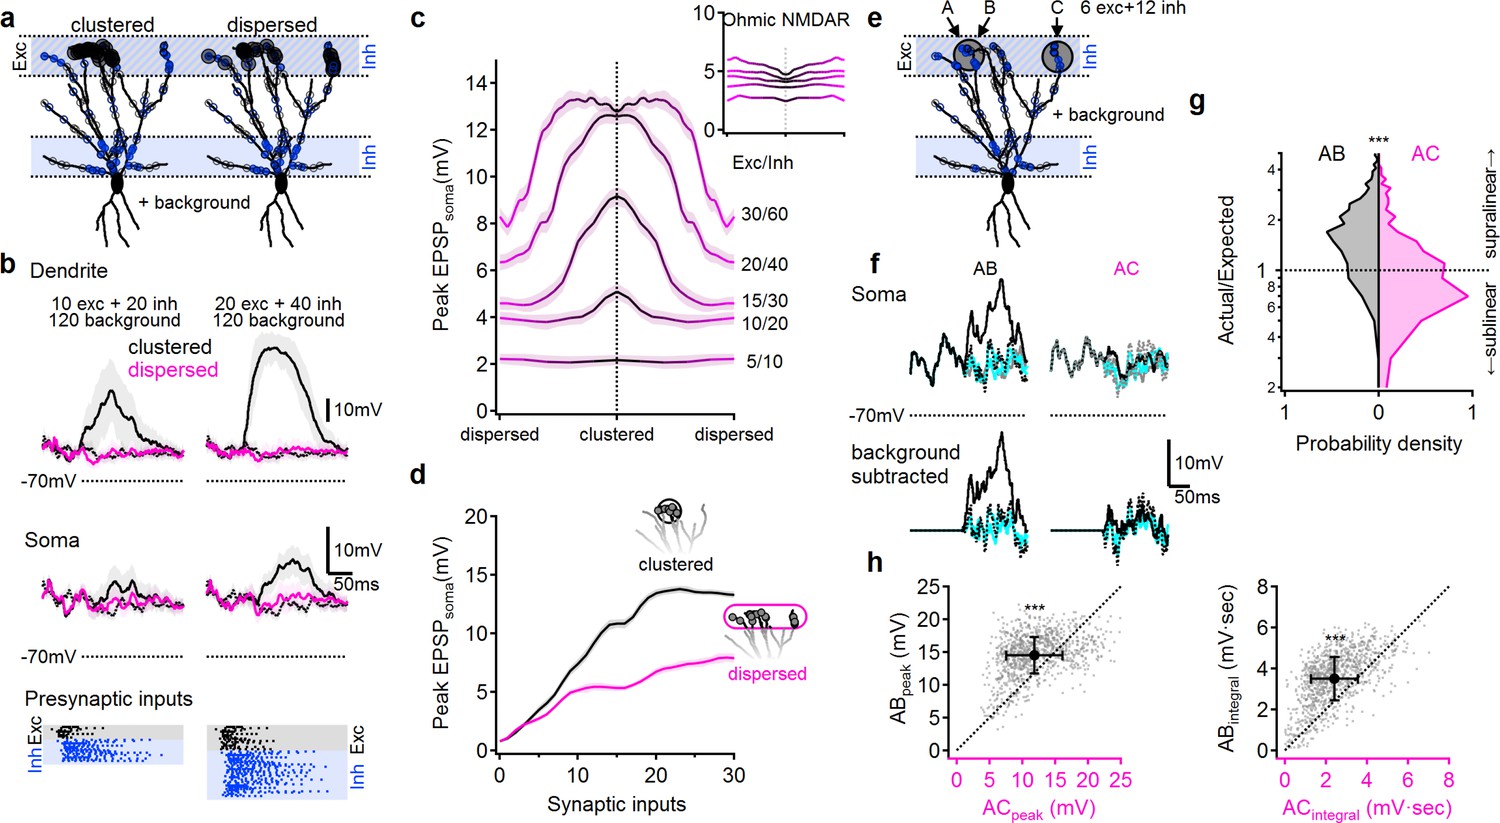
NMDA spikes can produce combination-sensitive dendritic receptive fields: modeling results.
(a) Example distribution of glutamatergic inputs (grey circles) and GABAergic inputs (blue) on the reconstructed cell (for clarity, some dendrites are not shown). Olfactory information was mediated by 20 excitatory and 40 inhibitory inputs marked by closed circles. Open circles indicate additional 120 background synaptic inputs that were activated at random times. Left, clustered distribution, where stimulus-encoding excitatory inputs are concentrated on a single postsynaptic branch. Right, dispersed excitatory distribution over all distal dendrites. (b) Example postsynaptic responses to stimulation with 10/20 (left) and 20/40 (right) presynaptic excitatory/inhibitory inputs over a 120 input background. Top, voltages recorded from the stimulated dendrite. Middle, somatic EPSPs. Bottom, the temporal presynaptic activation pattern of signal–bearing inputs, simulated to mimic typical odor responses of mitral cells in-vivo. The presynaptic firing trains were identical between clustered and dispersed distributions. (c) Peak somatic EPSPs as a function of input clustering for different number of synaptic inputs. Blockage of NMDA spikes with Ohmic NMDA channels abolished the preference for clustered excitatory drive (n = 100 repetitions for each stimulation intensity) (d) The simulated peak EPSP amplitude recorded at the soma as a function of the number of presynaptic inputs. (e-h) Dendritic odorant selectivity with NMDA spikes. (e) Distribution of excitatory inputs (black) from three glomeruli (A-C, six inputs each; A and B target the same dendrite, while C innervated a different branch) and odor-unselective inhibitory inputs (24 synapses), on a background of 120 randomly activated background inputs. (f) Example somatic voltage profiles following activation of inputs from two glomeruli that converge on the same distal apical dendrite (AB, left) and glomerular input on two different dendrites (AC, right). Grey-background activity in the absence of LOT activation, magenta-somatic potential following activation of a single glomerulus, dotted black – expected linear summation, solid black – actual response to simultaneous pairing of two glomerular inputs. Top, original traces, bottom, with background activity subtracted. (g) pairing nonlinearity, quantified as the ratio between the area under the curve of the background subtracted actual response to the pairing vs. the area under the curve of the expected linear summation. Pairing nonlinearity of 1 represents a linear system, larger/smaller values represent supra/sub-linear responses respectively. n = 1000 simulation repeats, p < 10−9 between AB and AC conditions, Kolmogorov-Smirnov test. (h) The peak (left) and the area under the curve (right) of the background-subtracted EPSPs in same (AB) vs. different (AC) dendritic pairing. Each data point represents a trail with similar spatial and temporal synaptic distribution of the background and stimuli inputs (save for the location of inputs B and C). n = 1000, p < 10−9, paired t-test. Shaded areas-SEM.
Figure 8—figure supplement 1
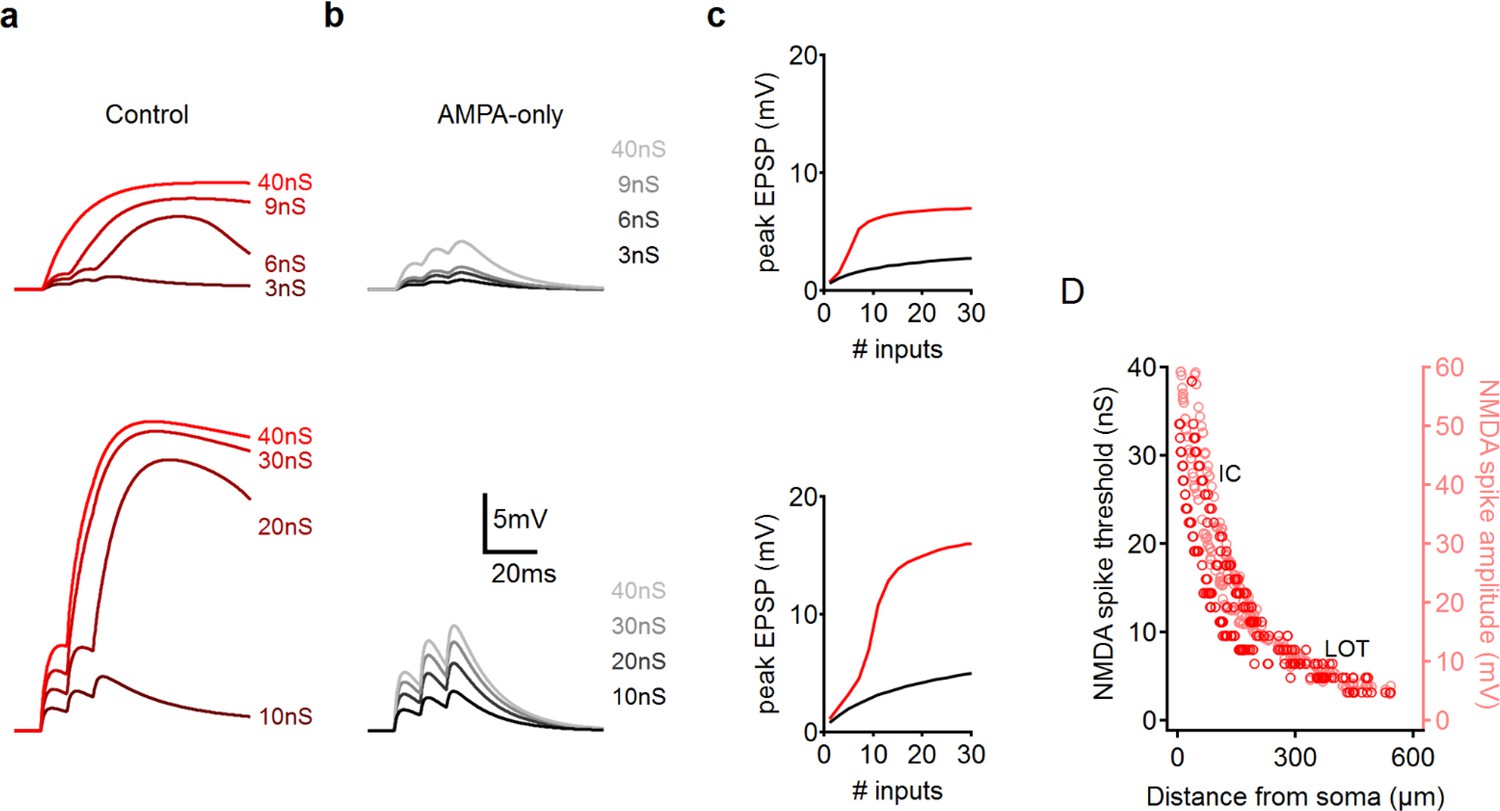
NMDA spikes in PCx pyramidal neurons: modeling results.
(a) Representative examples of focal synaptic stimulation at the LOT (top) and the IC (bottom) regions. (b) AMPAR only stimulation, same locations. Colors code synaptic strength as labeled. (c) Peak somatic EPSP as a function of synaptic conductance for the two dendritic locations, LOT (top) IC (bottom). (d) Dependence of NMDA spike threshold (red) and NMDA spike amplitude (pink) on the distance of the stimulation site from the soma.
Figure 8—figure supplement 2
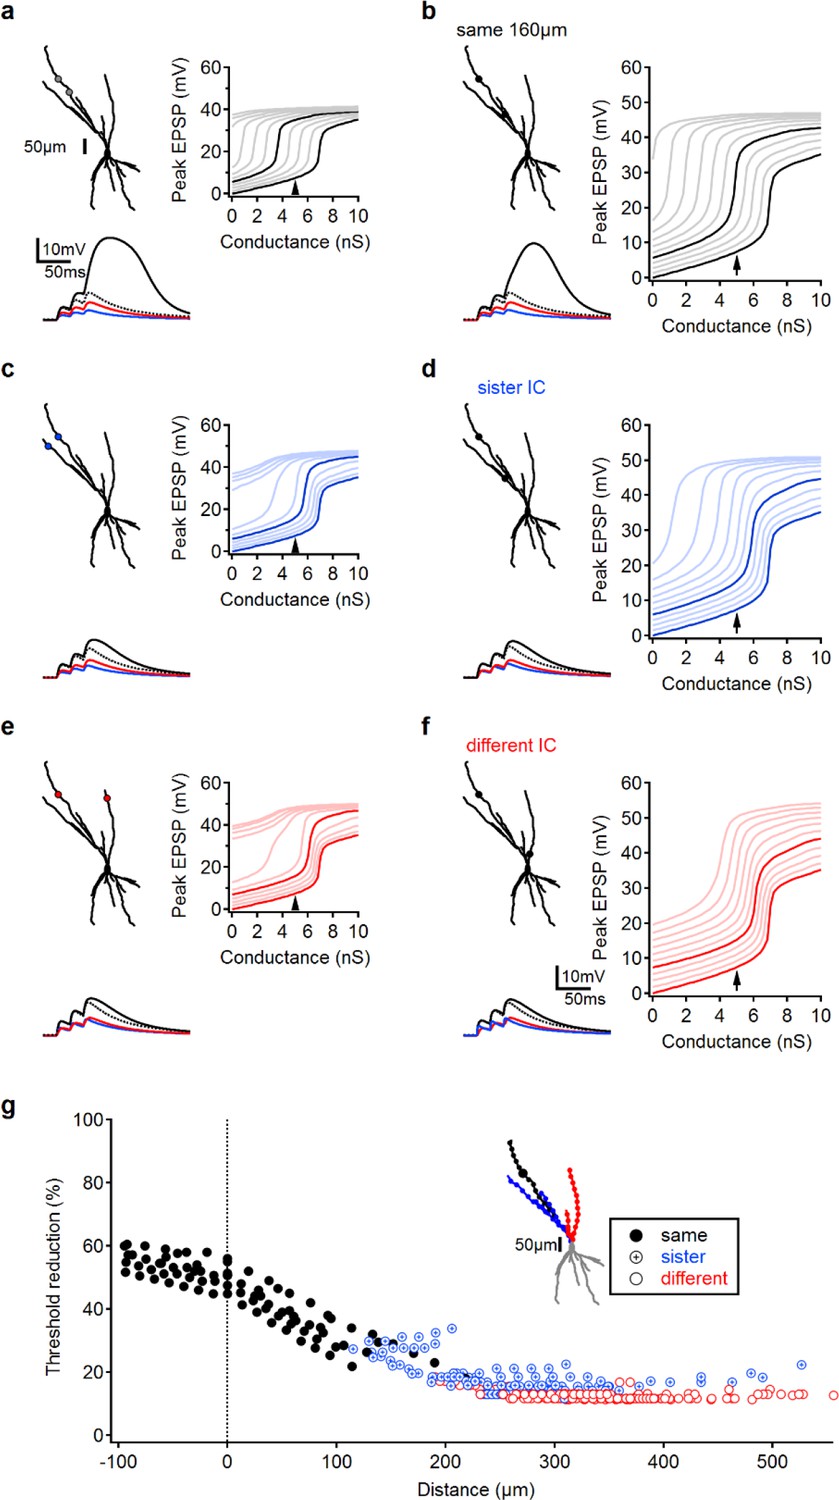
Pairing LOT and IC inputs: modeling results.
(a-f) Example paring of a glutamatergic synaptic input on a distal apical branch (control) and a bias input located on the same branch (a, b), sister branch (c, d) or ‘different’ dendrite (i.e. that do not share a primary branch, (e, f). Left, top – morphology of the reconstructed cell and stimulation locations. Left, bottom, example paring; red – somatic EPSP following activation of 5 nS control input; blue, EPSP following activation of a 4 nS bias, this bias level was selected to produce ~5 mV depolarization at the soma and ~50% reduction in NMDA spike threshold for paring of nearby inputs, similar to experimental conditions. Black, combined activation of bias and control synapses. Dotted line, the expected linear summation of the two individual inputs. Right, peak somatic EPSP amplitudes for progressively increasing stimulation intensities of the control input. Right bold trace – in the absence of bias, lighter traces – simulations in the presence of a bias input; traces differ by the magnitude of the bias intensity (left bold trace, bias of 4 nS). Arrow indicated the stimulation intensity of the control input used to produce the left, bottom plots. (g) Reduction in spike threshold between control activation only and pairing of control with 4 nS bias inputs as a function of distance between the two stimulation locations. Data from six different control locations in three reconstructed cells. Inset, schematic locations of the bias input color coded by same/sister/different dendrites, location of the control input is as in (a-f); also depicted here by the large circle.
Figure 8—figure supplement 3
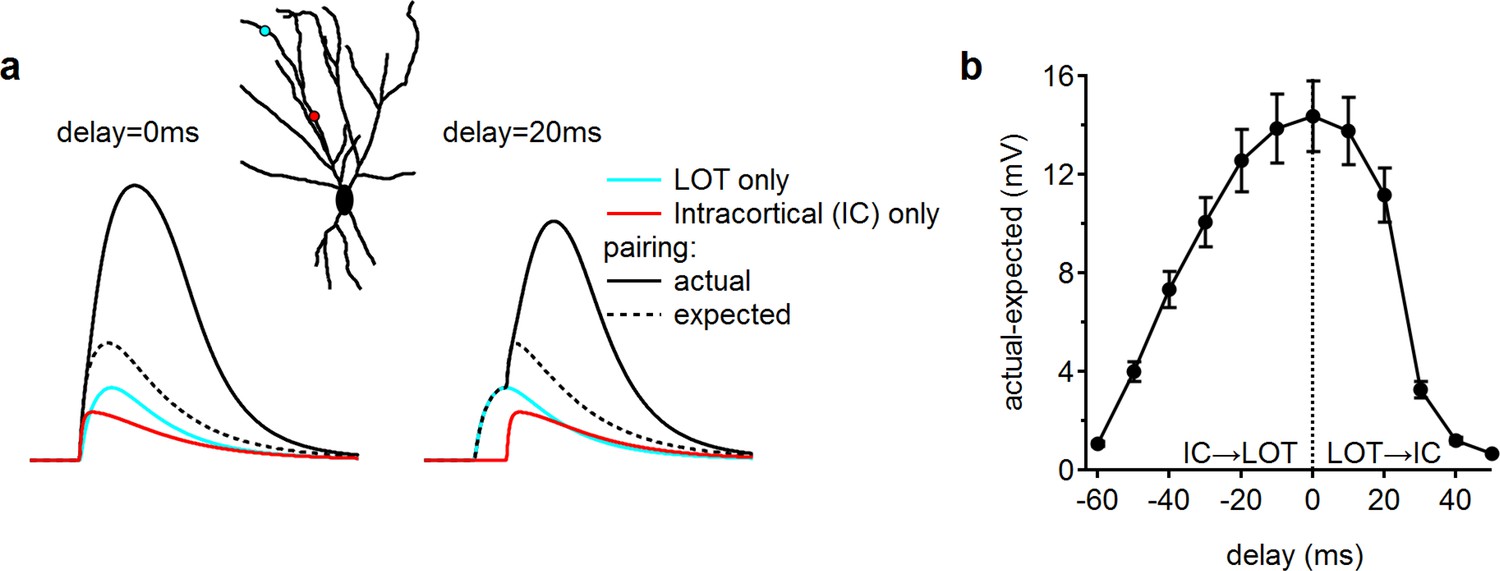
A wide integration window for a simulated pairing of LOT and IC inputs:
(a) Example somatic EPSPs recorded following activation of a single distal input, representing LOT activation (cyan), a single proximal input within the intracortical (IC) layer (red) together with a paired activation of the two (solid black). Dotted black trace - the calculated expected linear summation of the individual EPSPs. Left, simultaneous stimulation; right, simulation with a 20 ms delay between LOT and IC input activation. Inset, input location. (b) The difference between the simulated paired peak somatic EPSP amplitudes to the expected values based on the linear EPSP shape summation as a function of the temporal difference between input activation. Synaptic intensity was set to 16 nS for the NMDAR and to 8 nS for the AMPAR conductance for both inputs. Negative delay represents initial activation of the IC input followed by the LOT input; in a positive delay, the temporal sequence is reversed.
Additional files
-
Transparent reporting form
- https://doi.org/10.7554/eLife.38446.015
Download links
A two-part list of links to download the article, or parts of the article, in various formats.
Downloads (link to download the article as PDF)
Open citations (links to open the citations from this article in various online reference manager services)
Cite this article (links to download the citations from this article in formats compatible with various reference manager tools)
NMDA spikes mediate amplification of inputs in the rat piriform cortex
eLife 7:e38446.
https://doi.org/10.7554/eLife.38446


