Inhibition of mTORC1 by ER stress impairs neonatal β-cell expansion and predisposes to diabetes in the Akita mouse
- The Hebrew University of Jerusalem, Israel
- University of Miami, United States
Figures
Figure 1 with 2 supplements
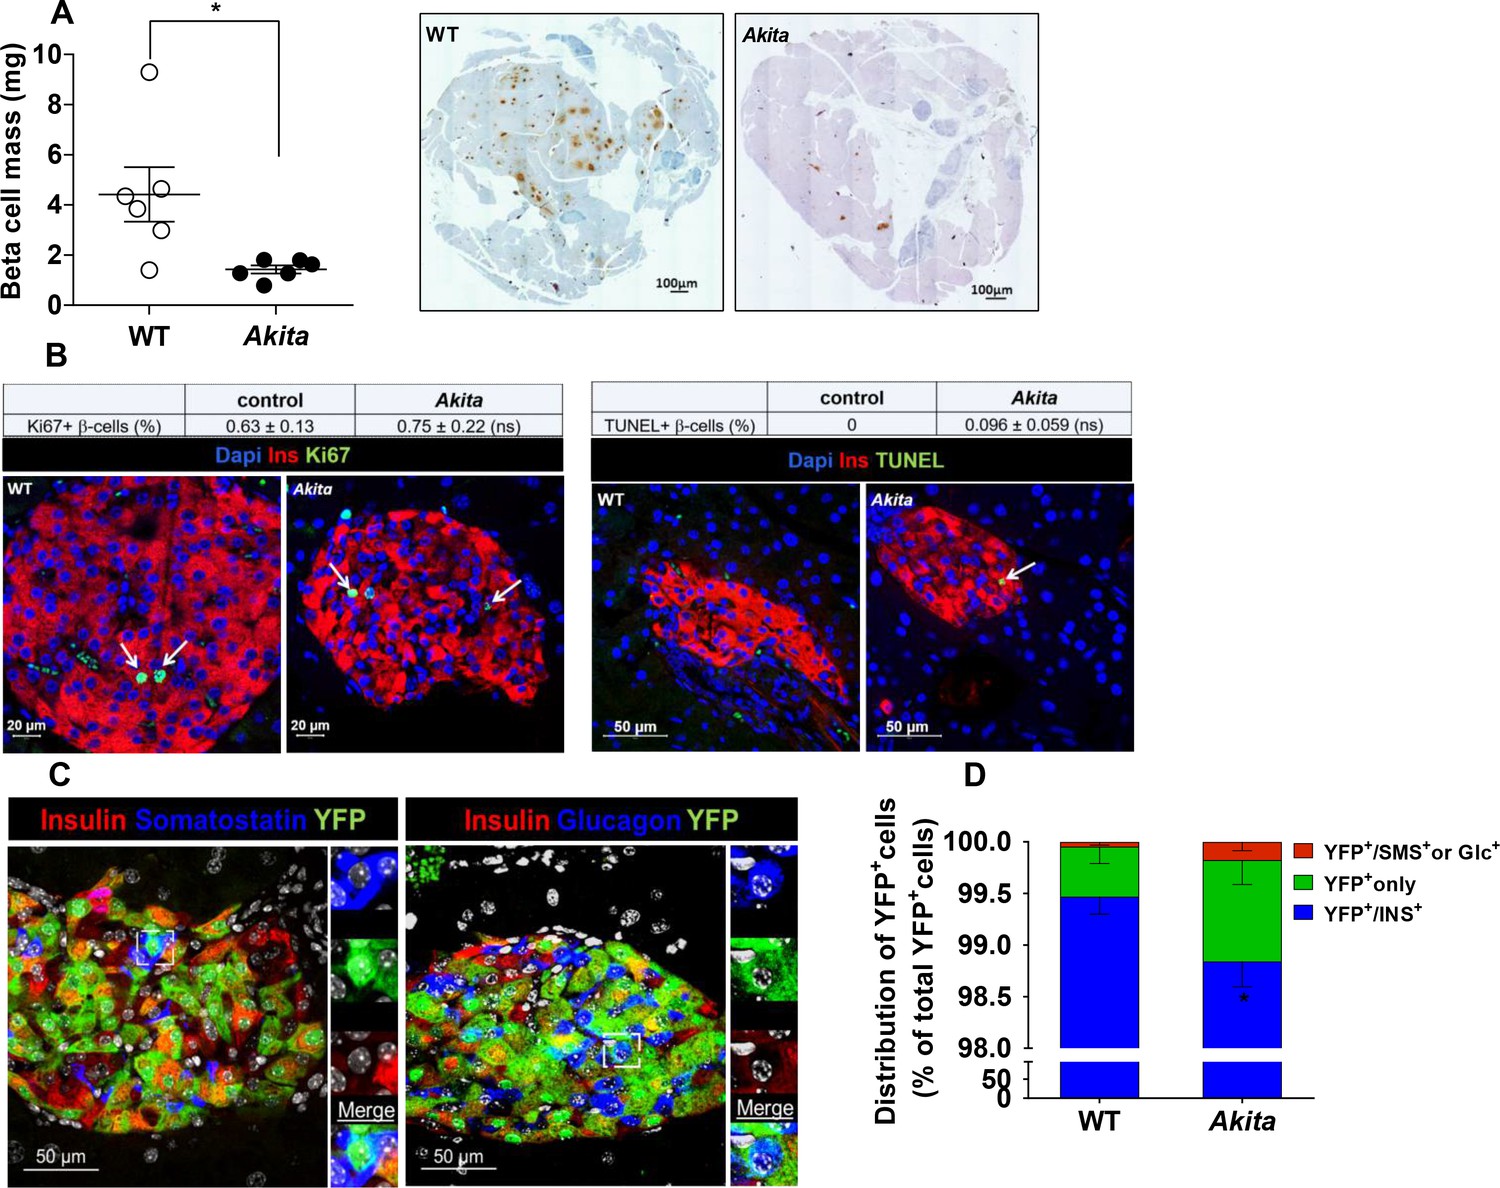
β-Cell mass, turnover and differentiation in adult Akita mice.
Analyses were performed on 2- to 3-month-old Akita mice and age-matched controls. (a) β-cell mass (n = 6 in each group); (b) β-cell proliferation and apoptosis assessed by staining for insulin and Ki67 (n = 6–7 mice in each group; a total of 4909 wild type (WT) and 2523 Akita β-cells were quantified) or TUNEL (n = 4–5 mice in each group; 2592 WT and 1754 Akita β-cells). The percentage of Ki67+ and TUNEL+β-cells is shown in the table above; (c–d) β-cell differentiation was assessed by lineage tracing. Wild-type and Akita mice were crossed with RIP-Cre:Rosa26-Yfp reporter mice; (c) pancreatic sections of Akita mice were immunostained for insulin and somatostatin or glucagon. Lineage-traced β-cells (YFP+) expressing somatostatin or glucagon is shown in squares and zoomed in; (d) quantification of insulin-expressing β-cells (percentage of insulin+/YFP+ cells), insulin-degranulated β-cells (percentage of insulin-/YFP+ cells) and of cells with misexpression of somatostatin or glucagon (percentage of somatostatin+ or glucagon+/YFP+ cells) in WT and Akita mice is shown; *p<0.05.
Figure 1—figure supplement 1
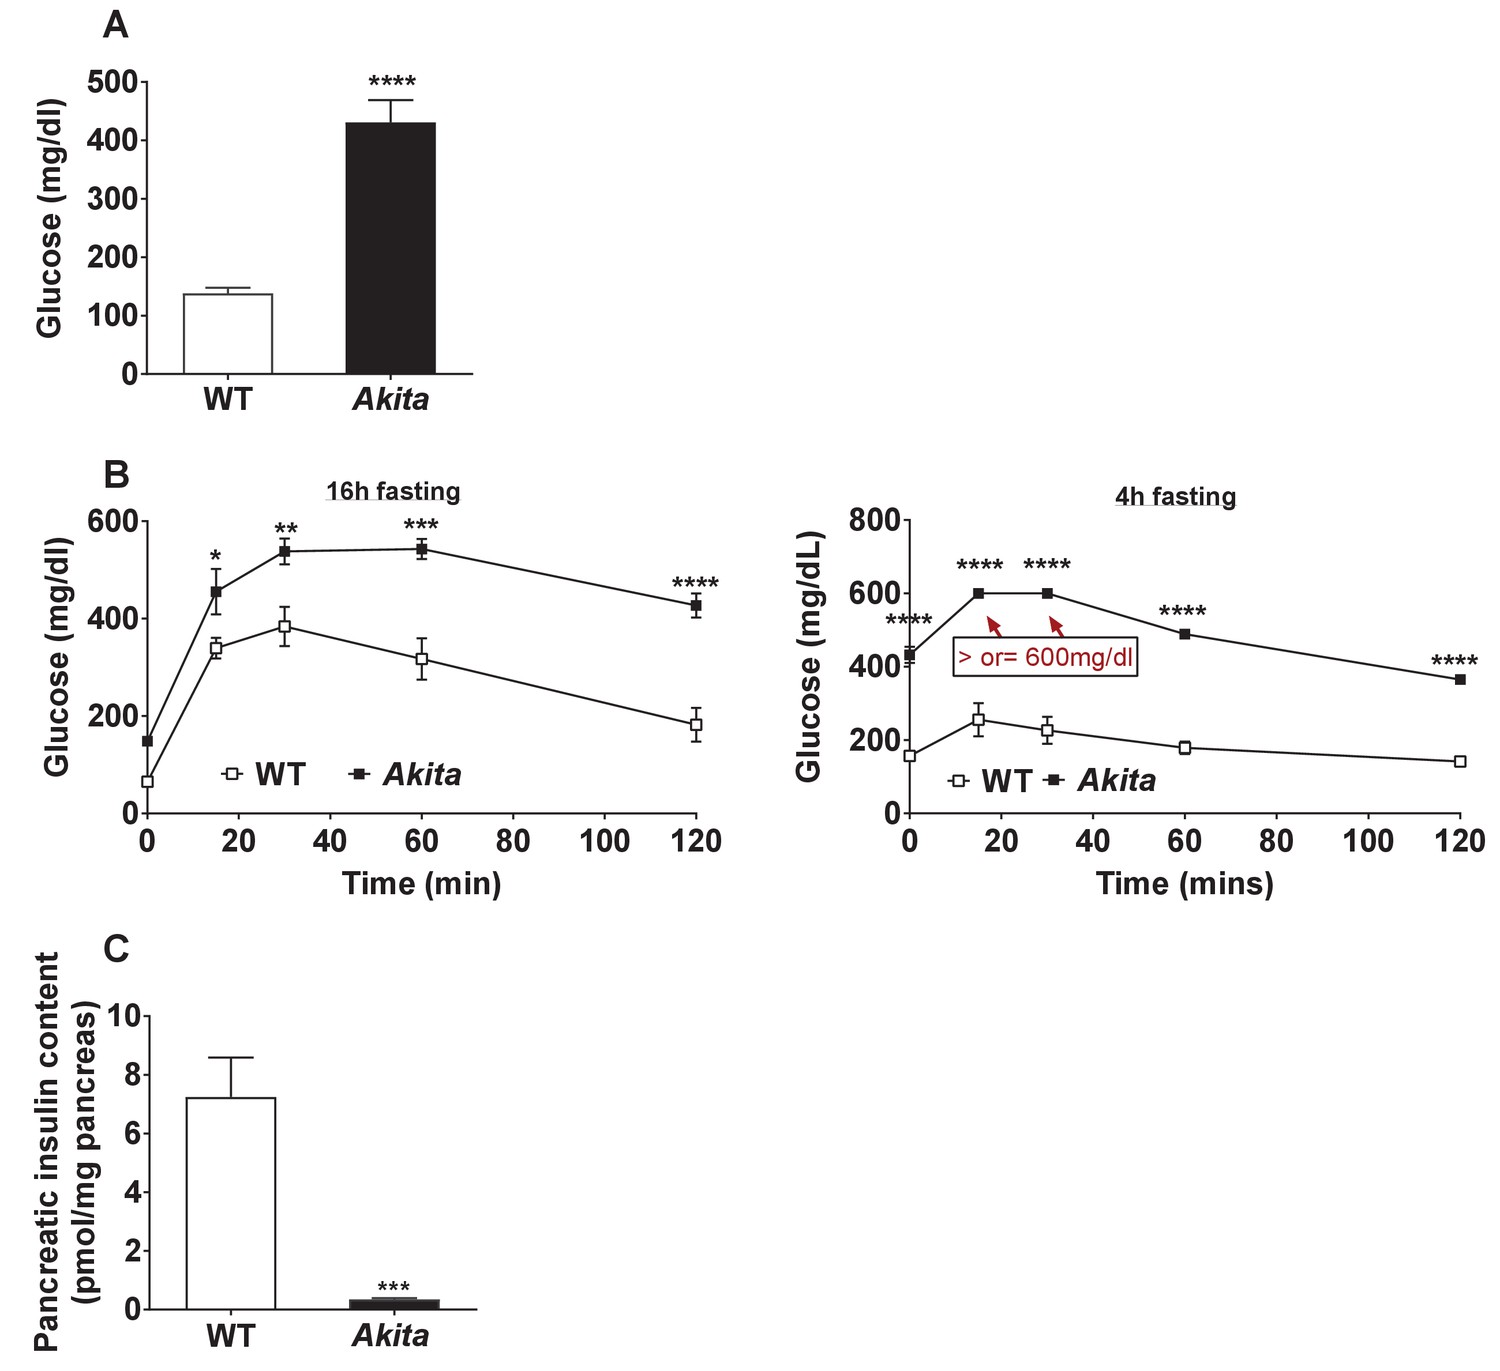
Glycemia and β-cell function in adult Akita and control mice.
(a) Fed blood glucose (n = 11–15 in each group); (b) IPGTT- glucose (1.5 g/kg) was injected intraperitoneally after an overnight or 4 hr fast (n = 4–5 in each group); (c) pancreatic insulin content analyzed by ELISA on whole pancreas extracts (n = 4–5 in each group). *p<0.05, **p<0.01, ***p<0.001, ****p<0.0001.
Figure 1—figure supplement 2
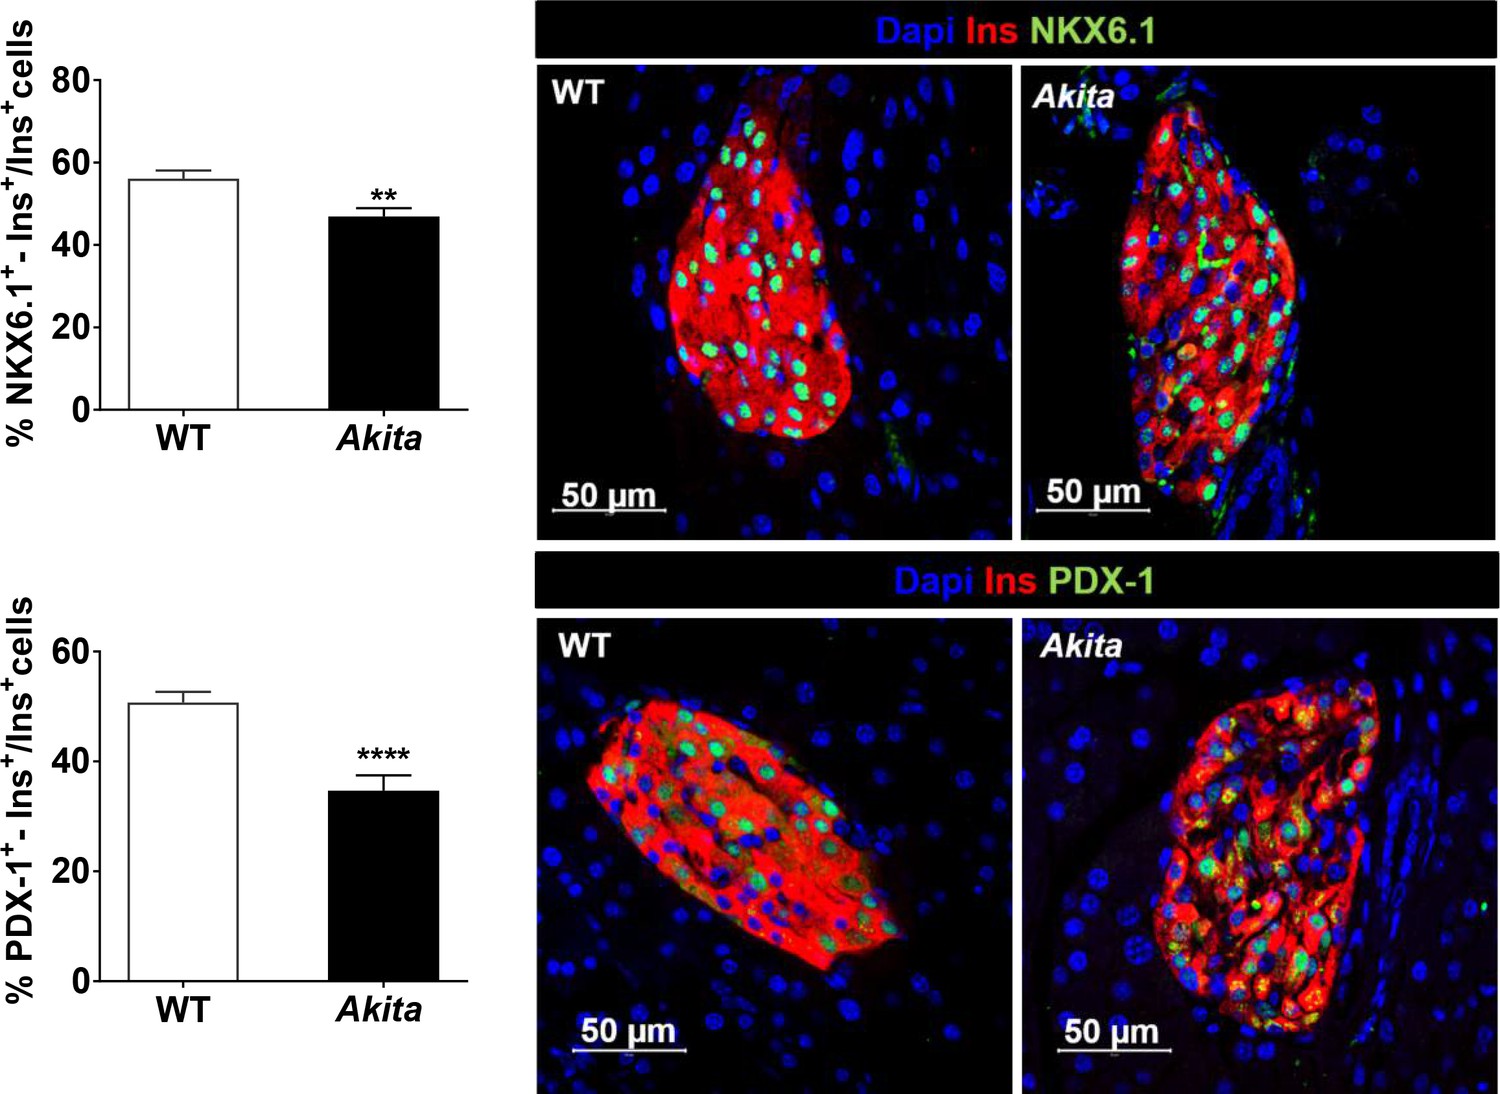
NKX6.1 and PDX-1 expression in adult Akitaβ-cells.
Pancreatic sections of 2- to 3-month-old Akita and control mice were stained for NKX6.1 (n = 5 mice in each group; 3348 WT and 2370 Akita β-cells) or PDX-1 and insulin (n = 5–7 mice in each group; 4580 WT and 2320 Akita β-cells). Values are mean ± SE. **p<0.01, ****p<0.0001.
Figure 2

Dynamic changes of body and pancreas growth and glycemia, β-cell mass, proliferation and differentiation in Akita and control mice at P1-2.
(a) body weight, (b) pancreas weight of wild-type and Akita mice at P1-2, P19-21 and at the age of 2–3 months. (a) P1-2: WT (n = 8); Akita mice (n = 4), P19-21: WT (n = 21); Akita mice (n = 23), 2–3 months: WT (n = 33); Akita mice (n = 39); (b) P1-2: WT (n = 8); Akita mice (n = 4), P19-21: n = 14 in each group, 2–3 months: n = 17 mice in each group). (c) fed blood glucose (n = 7–8 mice in each group); (d) β-cell mass (n = 5 mice in each group); (e) β-cell proliferation assessed by immunostaining for insulin and Ki67 (n = 4 mice in each group; 1886 WT and 1483 Akita β-cells). The percentage of Ki67+ β-cells is shown in the table above; (f–g) quantification of β-cells (insulin+) expressing NKX6.1 (n = 3–4 mice in each group; 1148 WT and 1808 Akita β-cells) and PDX-1 (n = 3–5 mice in each group; 1364 WT and 1507 Akita β-cells). *p<0.05, ****p<0.0001.
Figure 3
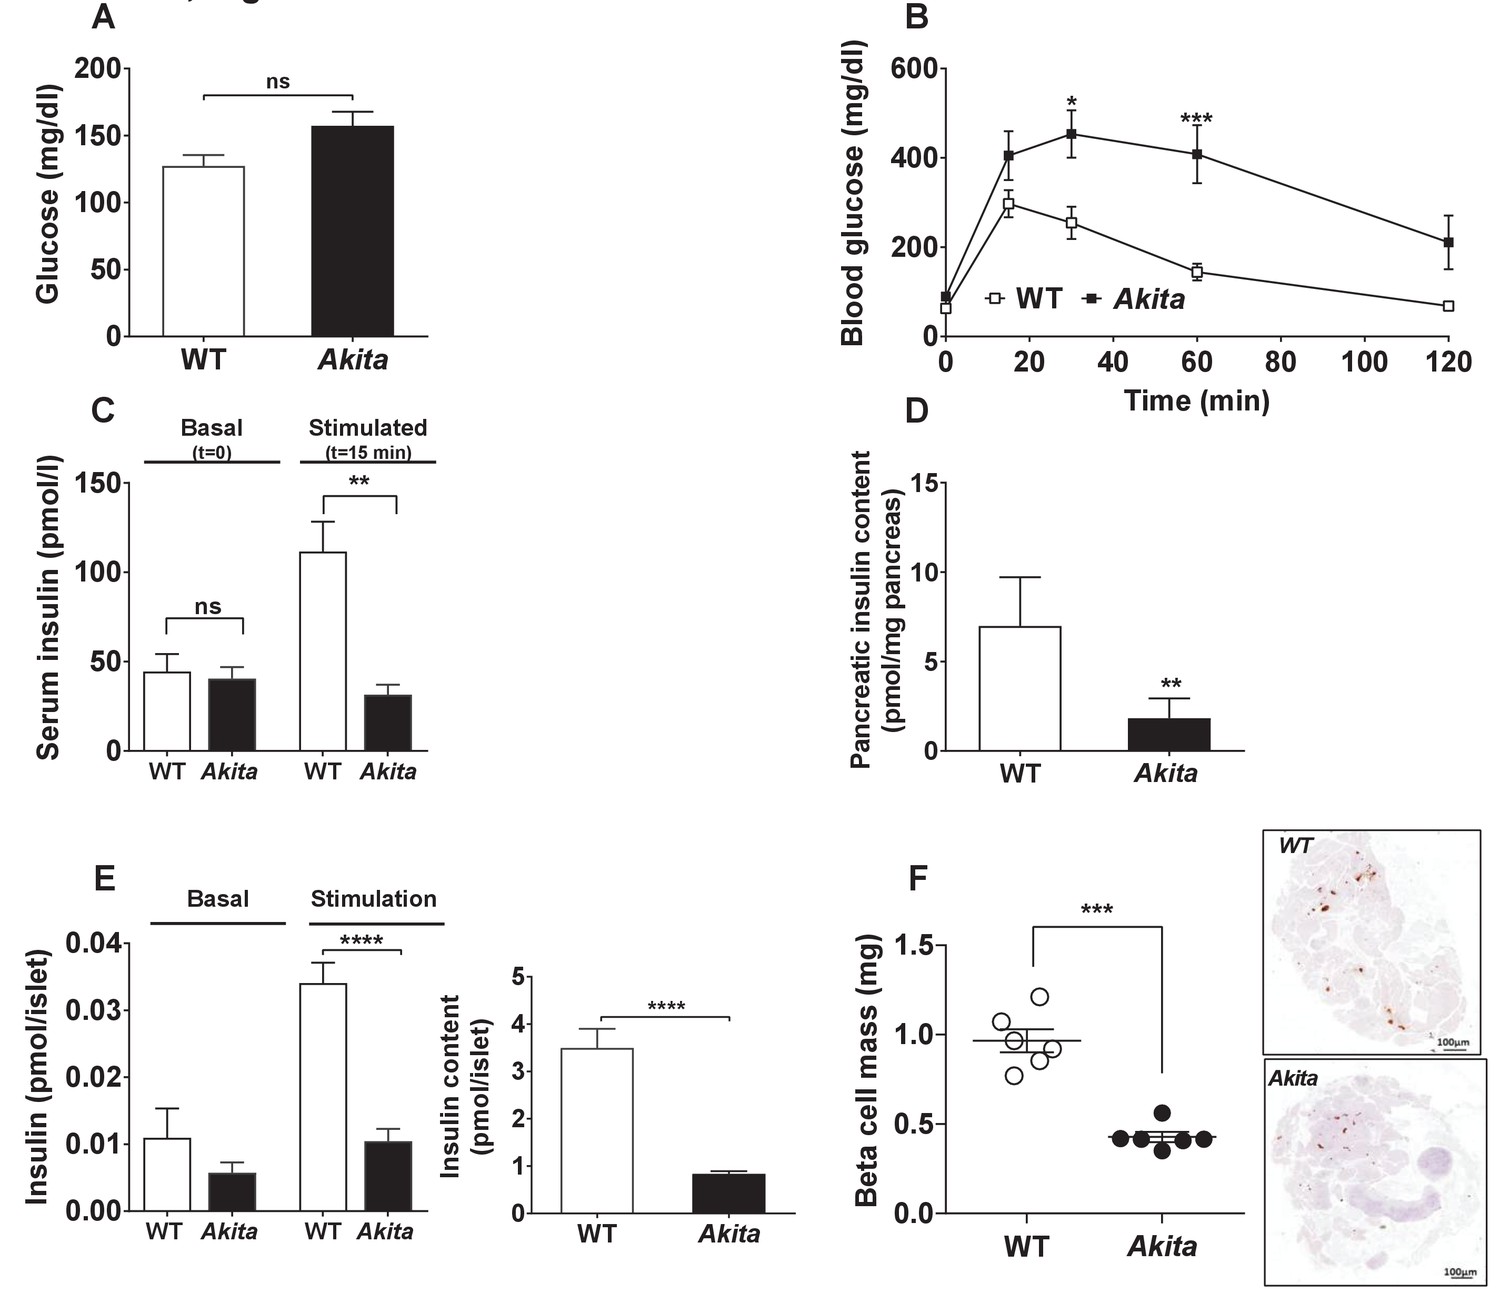
Metabolic state, β-cell function and mass in pre-weaning (P19-21) Akita mice and age-matched controls.
(a) fed blood glucose (n = 7 in each group); (b) IPGTT- glucose (1.5 g/kg) was injected intraperitoneally after an overnight fast (n = 5 in each group); (c) glucose-stimulated insulin secretion in vivo. Insulin was measured before and 15 min following IP glucose injection (1.5 g/kg); (d) pancreatic insulin content (n = 4–5 in each group); (e) basal (3.3 mmol/l glucose) and stimulated (16.7 mmol/l glucose) insulin secretion and insulin content of Akita and control islets analyzed by static incubations. Islets were divided into 4 batches of 25 islets per group (n = 3); (f) β-cell mass (n = 6 mice in each group). *p<0.05, **p<0.01, ***p<0.001, ****p<0.0001.
Figure 4 with 1 supplement

Dynamic changes in β-cell expansion in Akita and control mice.
(a) β-cell proliferation assessed by immunostaining for insulin and Ki67 (n = 6 mice in each group; 2541 WT and 3391 Akita β−cells); (b) β-cell size at P1-2 (newborn, n = 4–5 mice in each group; 334 WT and 435 Akita β-cells), P19-21 (pre-weaning, n = 3 mice in each group; 330 WT and 364 Akita β−cells) and in adult mice (2–3 month-old, n = 3 mice in each group; 266 WT and 417 Akita β−cells) assessed by immunostaining for E-cadherin and insulin. Quantifications of β-cell size (c), proliferation (d), and mass (e) are shown. *p<0.05, **p<0.01, ****p<0.0001.
Figure 4—figure supplement 1
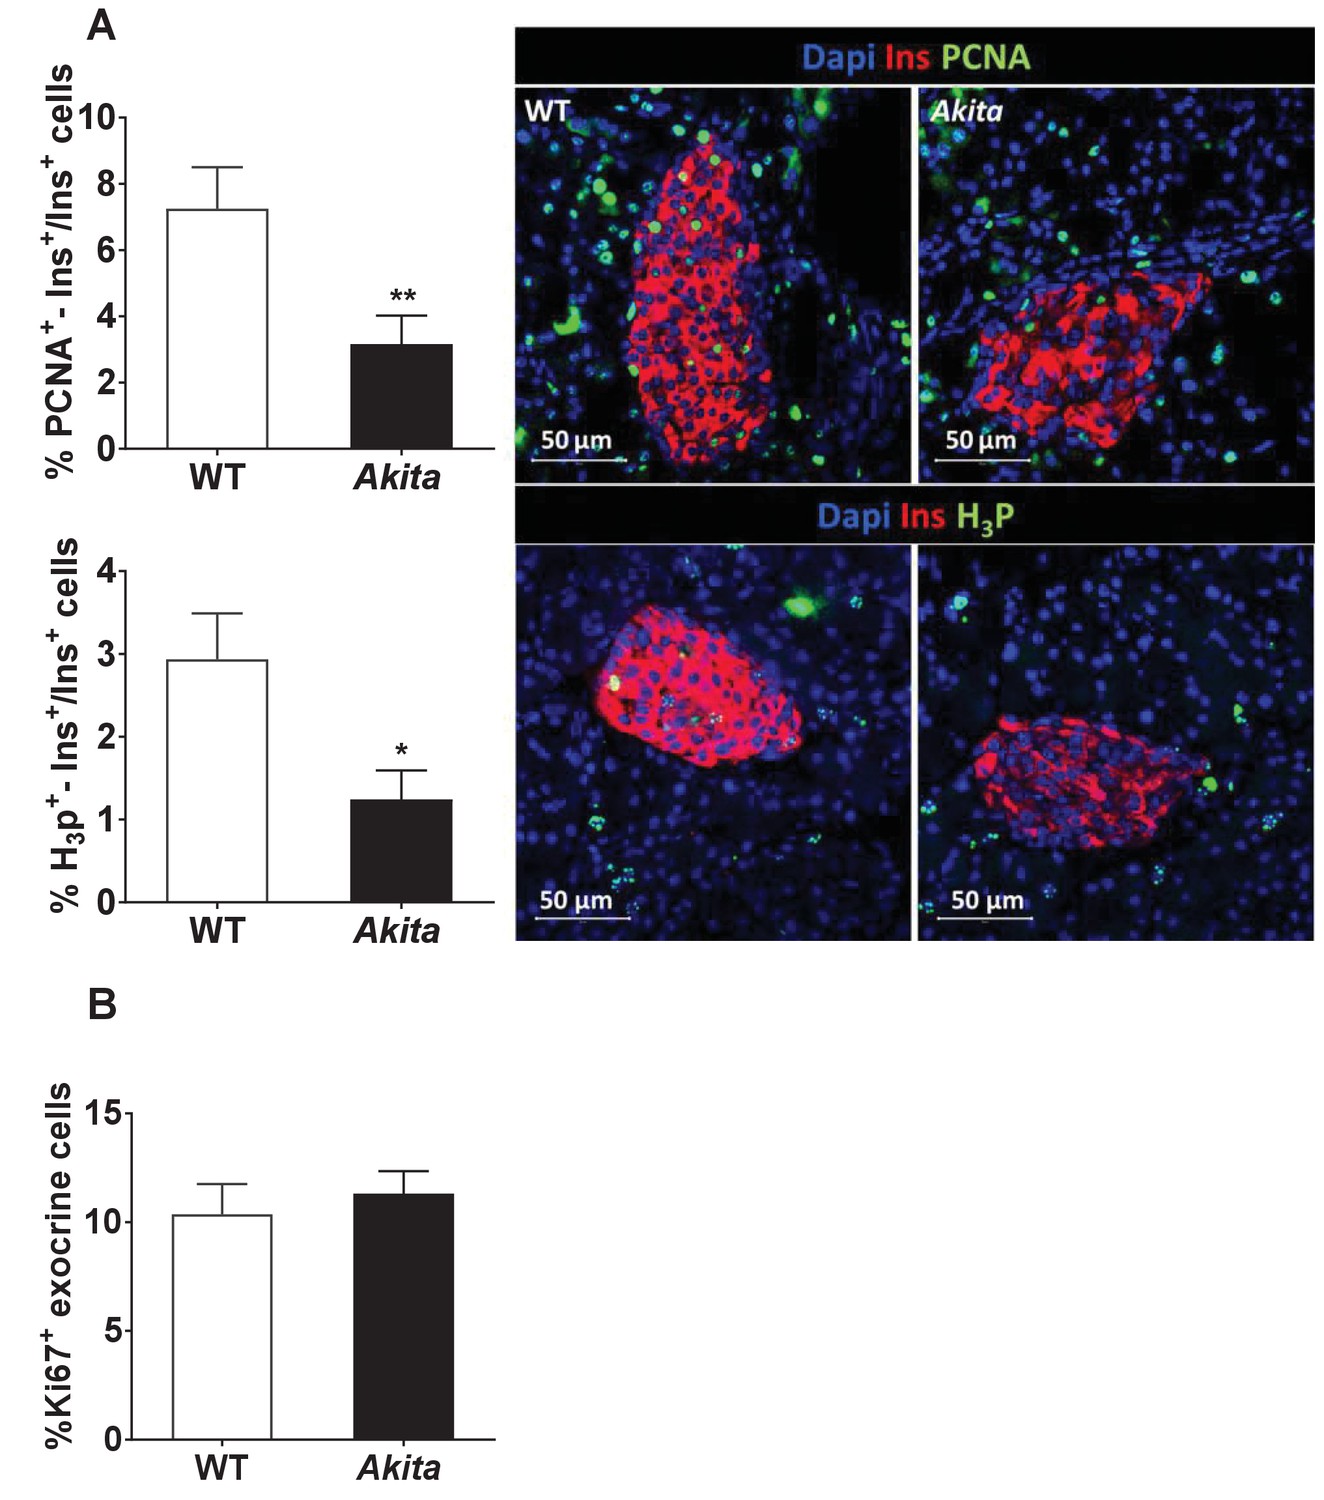
Proliferation of β-cells and exocrine cells in pre-weaning Akita and control mice.
Analyses were performed on pancreatic sections of Akita mice and age-matched controls at 19–21 days stained for proliferation markers. (a) β-Cell proliferation was assessed by staining for insulin and PCNA (n = 3 mice in each group; 1241 WT and 1944 Akita β cells), or phospho-Histone H3 (H3P n = 3 mice in each group; 1176 WT and 1982 Akita β−cells). (b) Proliferation of pancreatic exocrine cells in pre-weaning Akita and control mice. Pancreatic sections of pre-weaning Akita and control mice were stained for insulin and Ki67 and exocrine cells surrounding the islets were used for quantification. The percentage of proliferating exocrine cells (Ki67+/INS-) is shown (n = 6 mice in each group; 2486 WT and 2670 Akita cells). *p<0.05, **p<0.01.
Figure 5 with 1 supplement
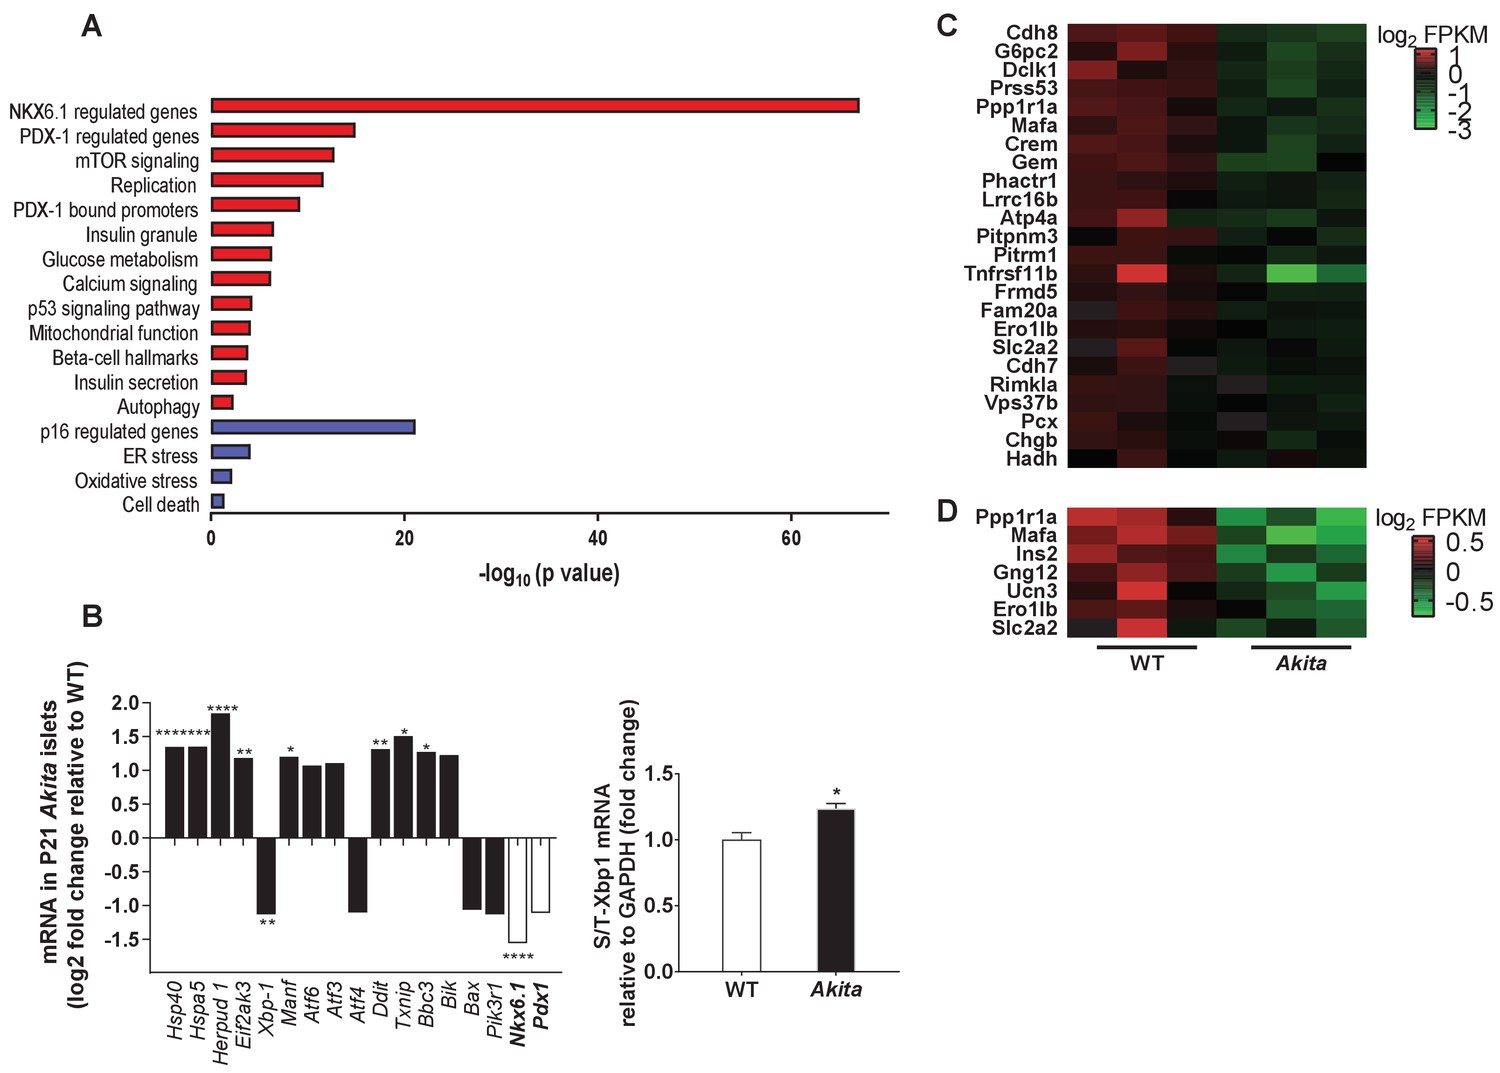
Transcriptomic analysis of ER stress markers and β-cell gene signature in neonate Akita islets.
(a) RNA-seq comparing the transcriptome of islets from P19-21 Akita and age-matched control mice (n = 3 samples in each group, each sample is a pool of islets from three mice). Columns represent pathways that are differentially regulated in Akita mice; (b) expression of UPR and apoptosis genes and of Nkx6.1 and Pdx1 in islets of Akita compared to control mice at P19-21. Spliced and total Xbp1 were also quantified by qPCR. The spliced/total Xbp1 ratio is shown beside (n = 3); (c–d) heat map of genes regulated by NKX6.1 (c) and PDX-1 (d) in Akita islets and controls. *p<0.05, **p<0.01, ***p<0.001, ****p<0.0001.
Figure 5—figure supplement 1
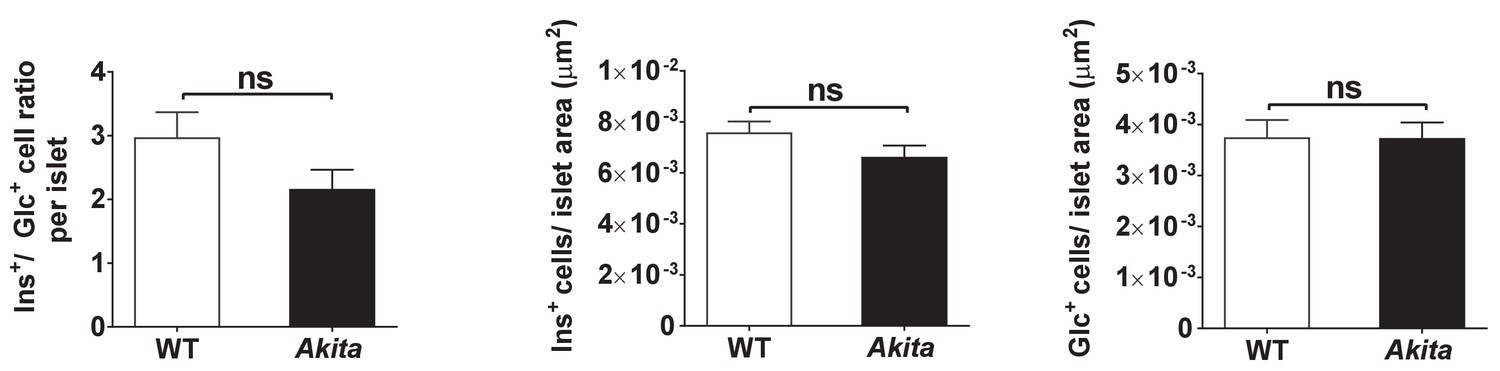
Islet composition of wild-type and Akita mice.
β/α cell ratio and number of β and α cells per islet area in P19-21 wild-type and Akita mice (n = 44 and 35 islets isolated from three to four mice in each group).
Figure 6
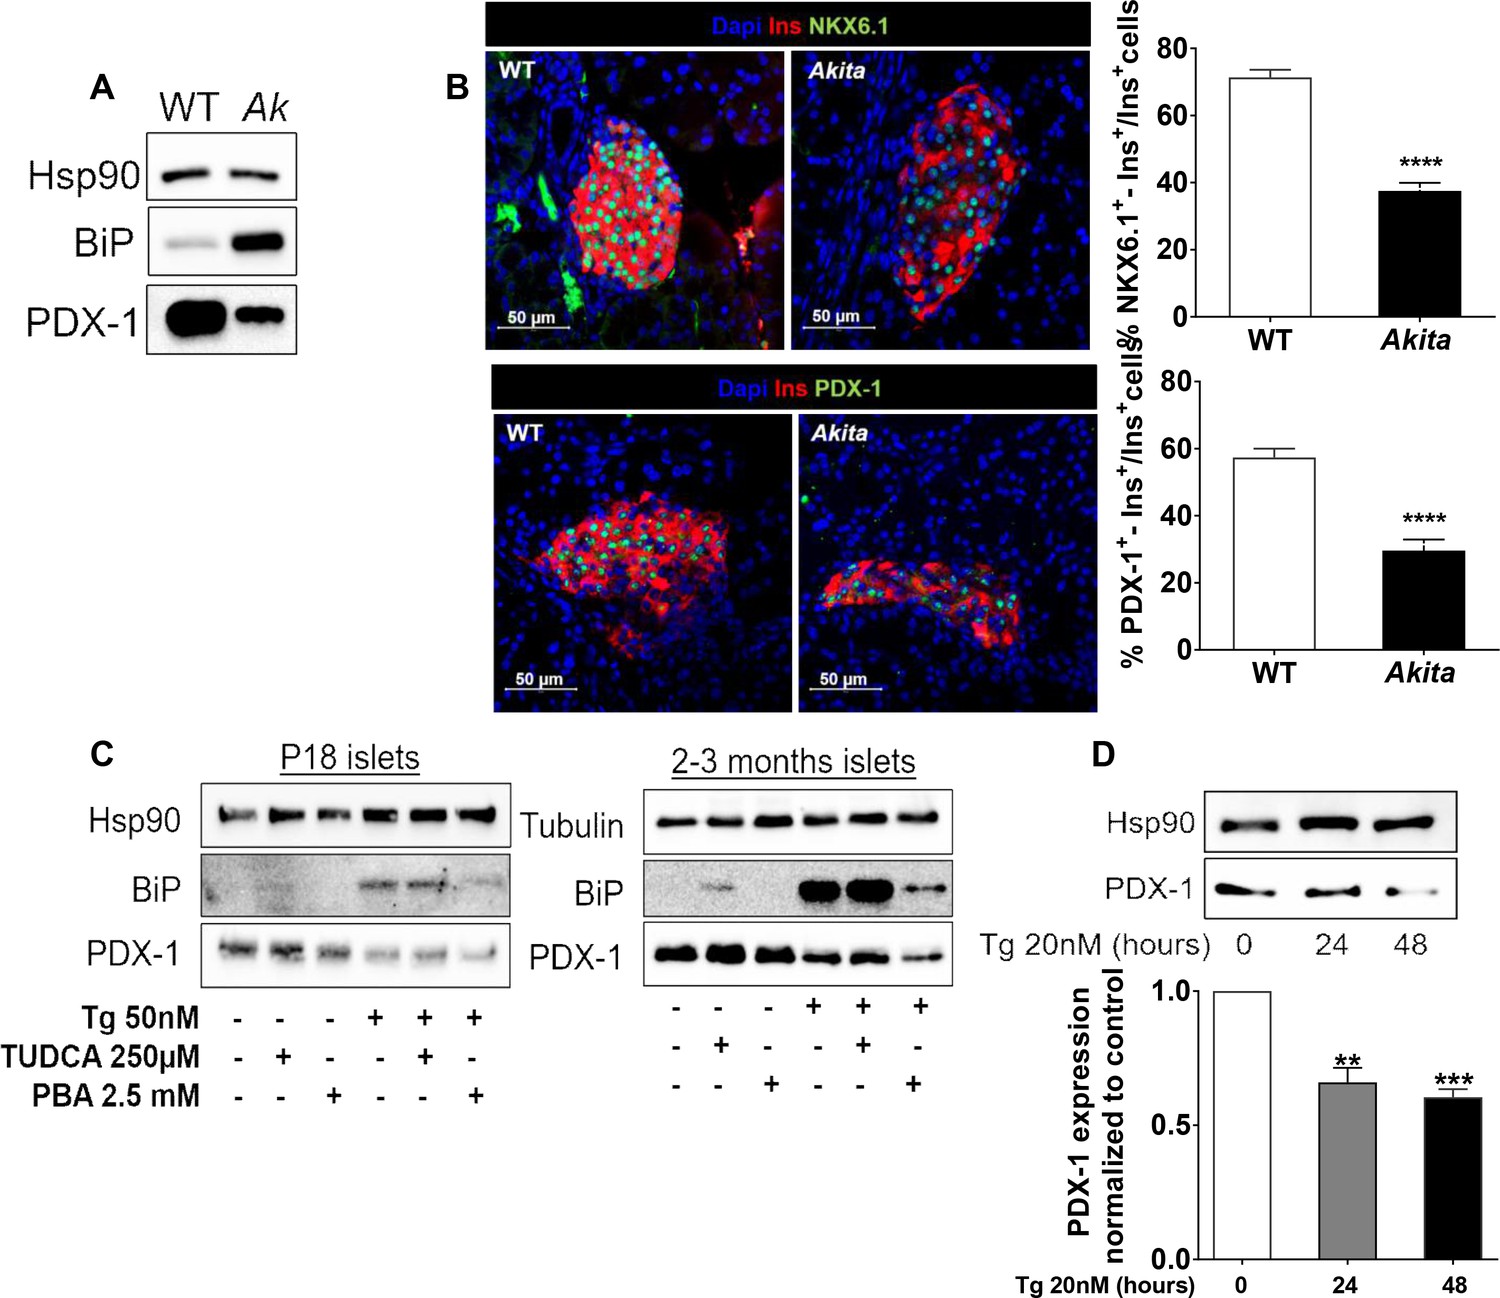
Effects of ER stress on the expression of β-cell transcription factors in neonate Akita islets (P19-21) and islets treated with thapsigargin.
(a) PDX-1 and BiP protein level analyzed by Western blotting (n = 3, each sample is a pool of islets from four to six mice); (b) quantification of NKX6.1 (n = 3 mice in each group; 1646 WT and 728 Akita β−cells), and PDX-1 (n = 3 mice in each group; 1534 WT and 844 Akita β−cells) expressing β-cells. Pancreatic sections were immunostained for NKX6.1 or PDX-1 and insulin. The percentage of NKX6.1- and PDX-1-positive β-cells is shown. (c) Islets from young (P19-21) and adult wild-type mice were treated with low-dose thapsigargin (50 nmol/l) and TUDCA (250 µmol/l) or PBA (2.5 mmol/l) for 48 hr with daily media changes and further analyzed by western blotting for PDX-1 and BiP (n = 3, each sample is a pool of islets from six to nine mice); (d) INS-1E cells were treated with 20 nmol/l thapsigargin for 24 and 48 hr followed by western blotting for PDX-1. **p<0.01, ***p<0.001, ****p<0.0001.
Figure 7
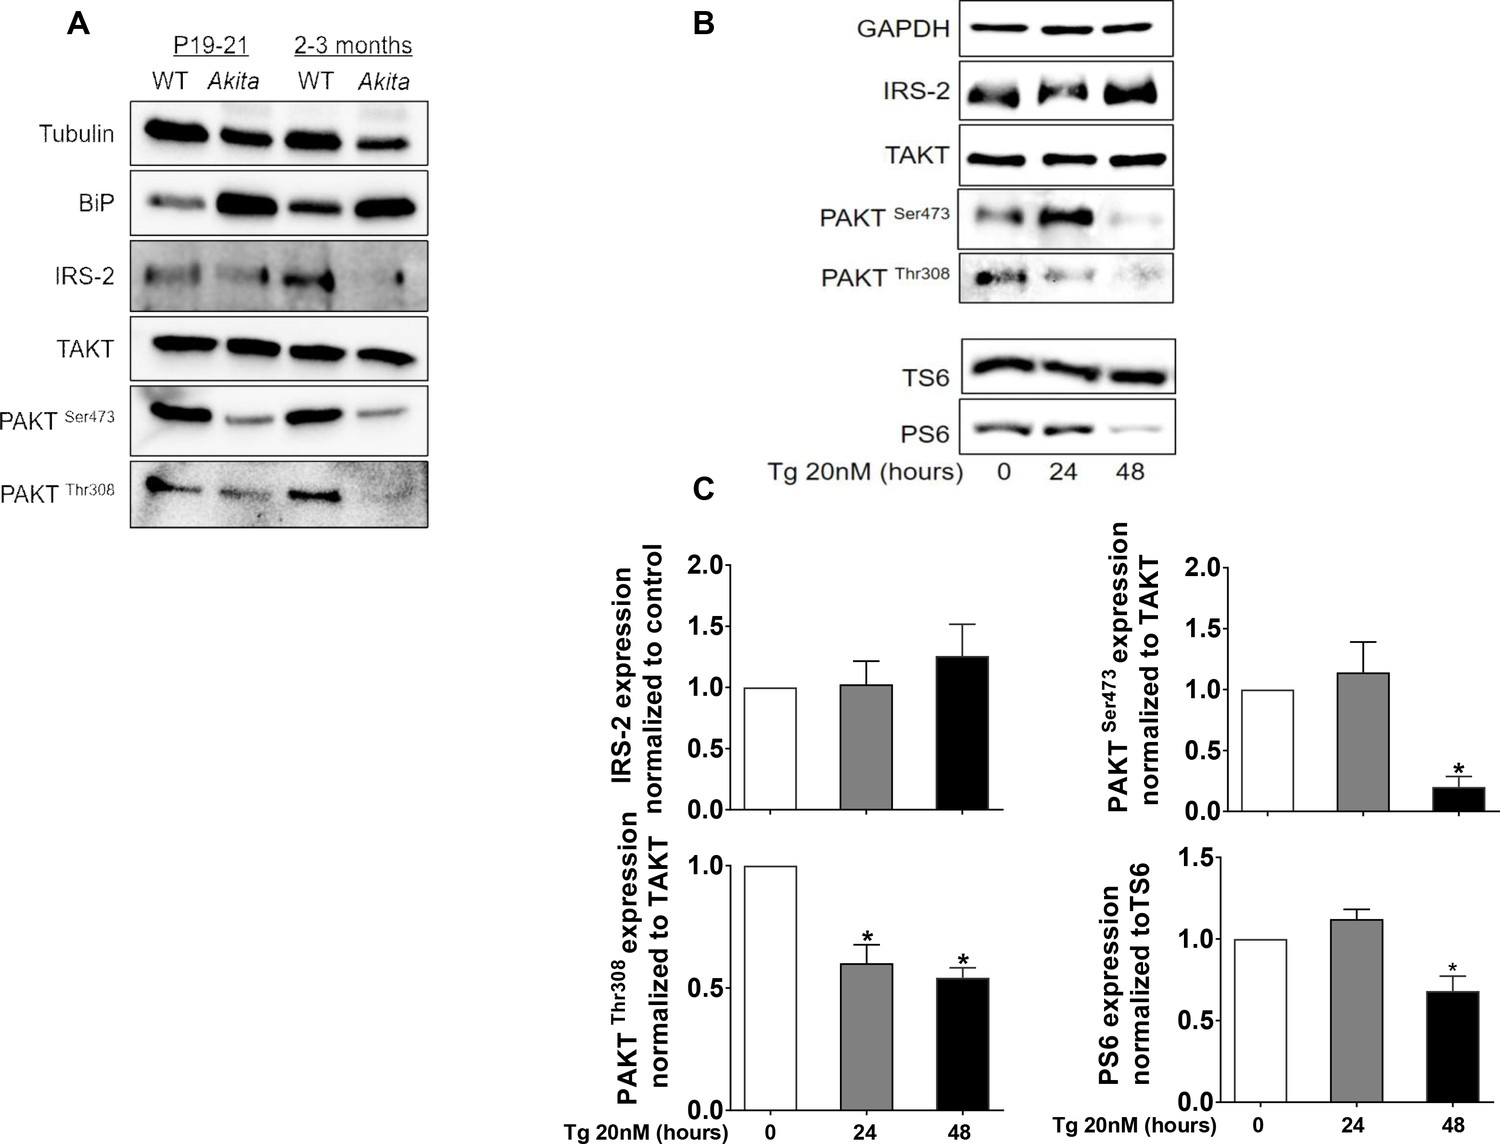
Effects of ER stress on IRS2/Akt signaling in Akita islets and in INS-1E treated with low-dose thapsigargin.
(a) IRS2/Akt signaling in islets from neonate (P19-21) and adult wild-type and Akita mice. Each sample is a pool of islets from 4 to 15 mice (n = 4 for neonate islets and n = 2 for adult islets). (b–c) INS-1E cells were treated with 20 nmol/l thapsigargin for 24 and 48 hr followed by western blotting for IRS2, total and phosphorylated Akt (Ser473 and Thr308) and S6 (Ser240/244). A representative experiment (b) and quantification (c) are shown (n = 4–6). *p<0.05.
Figure 8 with 1 supplement
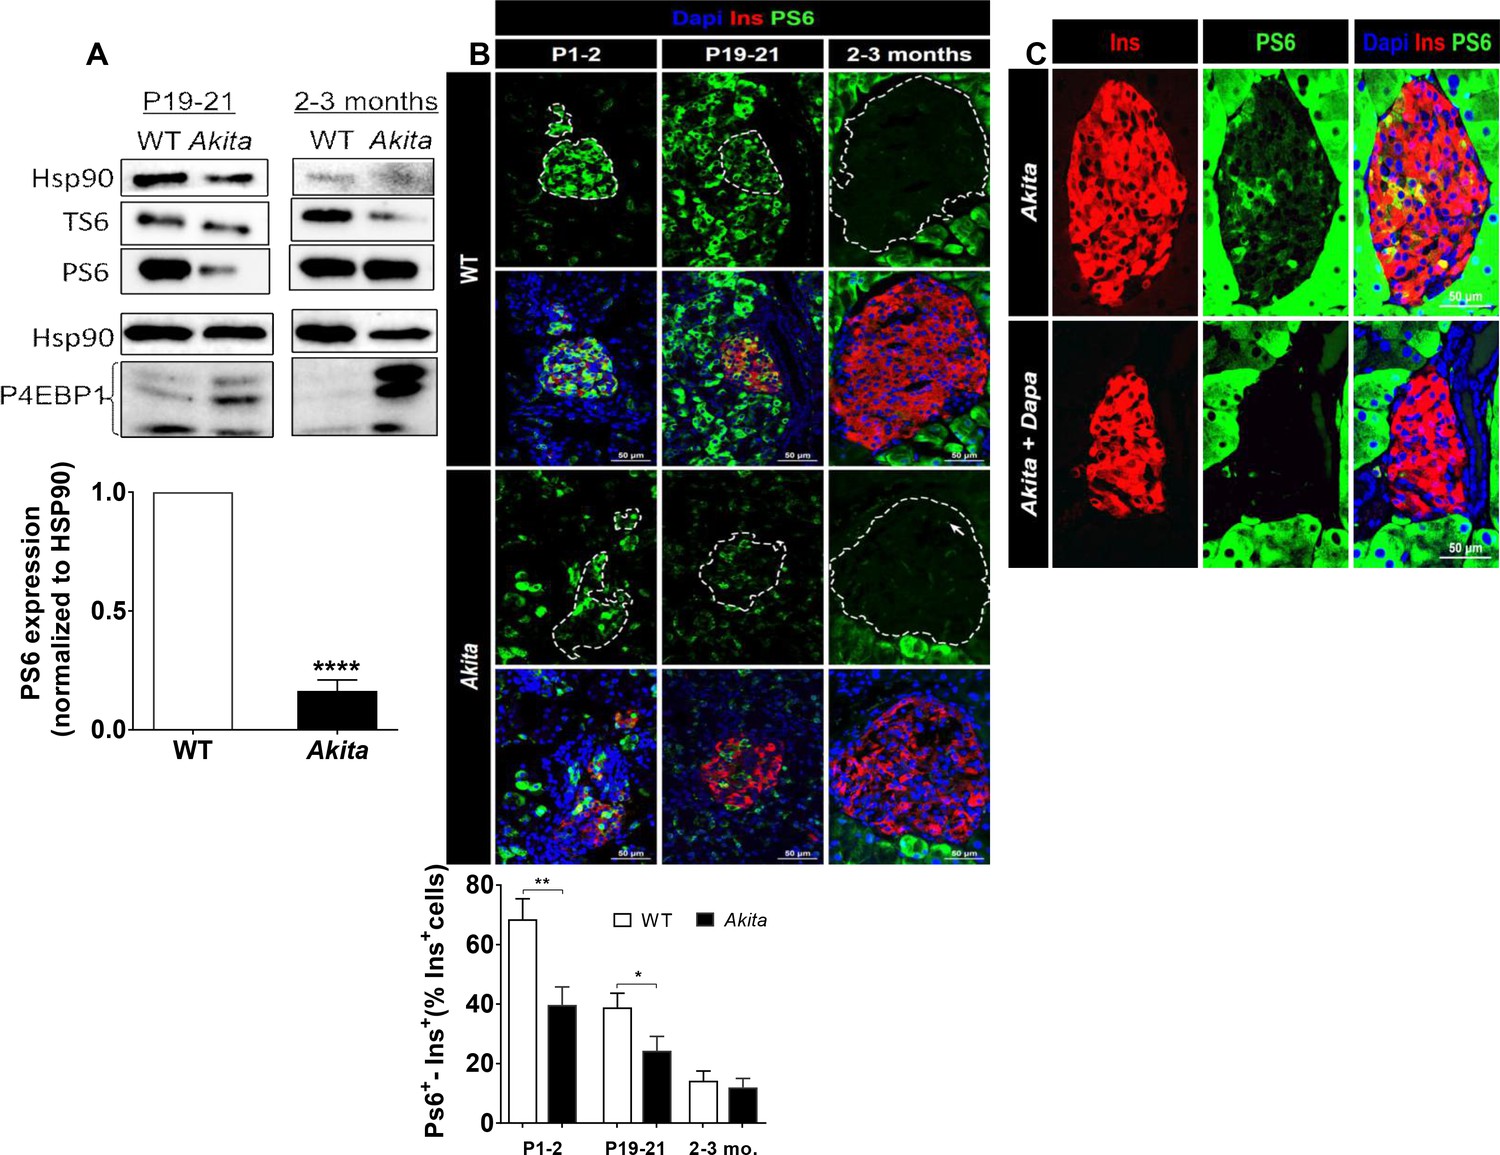
mTORC1 signaling in neonate and adult Akita islets.
(a) Western blot analysis of S6 and 4EBP1 phosphorylation in islets of neonate (P19-21) and adult wild-type and Akita mice. Quantification of phosphorylated S6 in neonate Akita compared to control islets is shown (n = 3, each sample is a pool of islets from 4 to 7 mice); (b) immunostaining for phospho-S6 on pancreatic sections of P1-2, P19-21 and adult Akita mice and age-matched controls and quantifications of the percentage of S6+ β-cells (P1-2: n = 4 mice in each group; 1159 WT and 1655 Akita β−cells; P19-21: n = 6 mice in each group; 2259 WT and 1567 Akita β−cells; adult: n = 4–5 mice in each group; 2391 WT and 1383 Akita β-cells). Islet boundaries are marked by dotted line; (c) adult Akita mice were treated with 25 mg/kg dapagliflozin in drinking water for 72 hr. Blood glucose in dapagliflozin-treated Akita mice was ~ 200 mg/dl compared to ~ 500 mg/dl in control Akita mice. Pancreatic sections were immunostained for insulin and phospho-S6 (n = 3 mice in each group). *p<0.05, **p<0.01, ****p<0.0001.
Figure 8—figure supplement 1
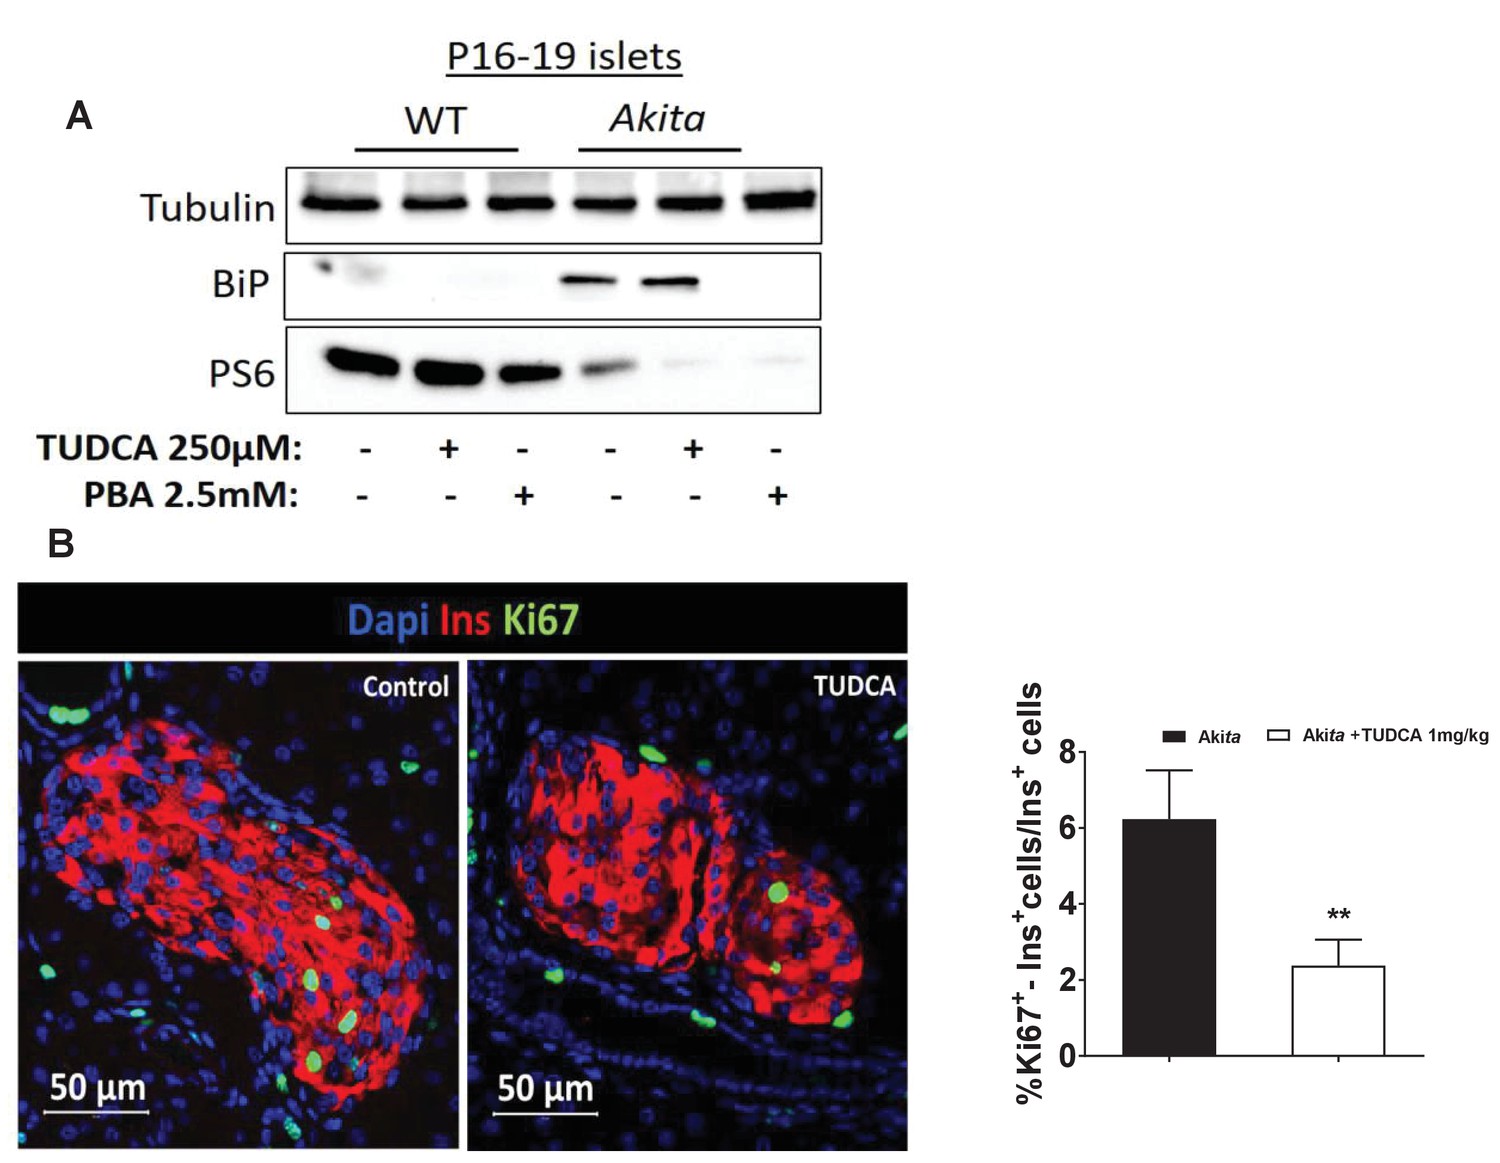
Effects of chemical chaperones on mTORC1 activity in neonate Akita islets and controls.
(a) islets of P16-19 Akita and wild-type (WT) mice were treated with 250 μmol/l TUDCA or 2.5 mmol/l PBA for 48 hr followed by western blotting for BiP and phosphorylated S6 (n = 3, each sample is a pool of islets from 4 to 9 mice); (b) effects of TUDCA on β-cell proliferation in neonate Akita mice (P18-20). TUDCA (1 mg/kg) was injected IP twice daily for 48 hr followed by immunostaining of pancreatic sections for Ki67 and insulin (n = 4–6 mice in each group; 1403 control Akita and 2183 TUDCA-treated Akitaβ-cells). **p<0.01.
Figure 9 with 1 supplement

Effects of mTORC1 activation in neonate Akita β-cells on β-cell size and proliferation.
Studies were performed on heterozygous and homozygous βTsc1 knockout Akita mice (RIP-Cre:Tsc1flox/+:Akita (Akita, βTsc1+/-) and RIP-Cre:Tsc1flox/flox:Akita (Akita, βTsc1-/-). Tsc1flox/+:Akita and Tsc1flox/flox:Akita were used as Akita controls. RIP-Cre:Tsc1flox/+ mice (βTsc1+/-) and RIP-Cre:Tsc1flox/flox mice (βTsc1-/-) were used as WT controls (a, b). (a) Western blotting for phospho-S6 on islets from homozygous and heterozygous knockout mice and matched controls (n = 4, each sample is a pool of islets from two to four mice); (b) Western blotting and quantification of BiP expression in wild-type, Akita and Akita, βTsc1 +/- mice (n = 4, each sample is a pool of islets from two to four mice); (c) β-cell size was assessed by immunostaining for insulin and E-cadherin (n = 400–500 β-cells per group), (d) β-cell proliferation was assessed by immunostaining for insulin and Ki67 (n = 1200–1400 β−cells per group). Quantifications and representative images are shown. *p<0.05, **p<0.01, ***p<0.001, ****p<0.0001.
Figure 9—figure supplement 1
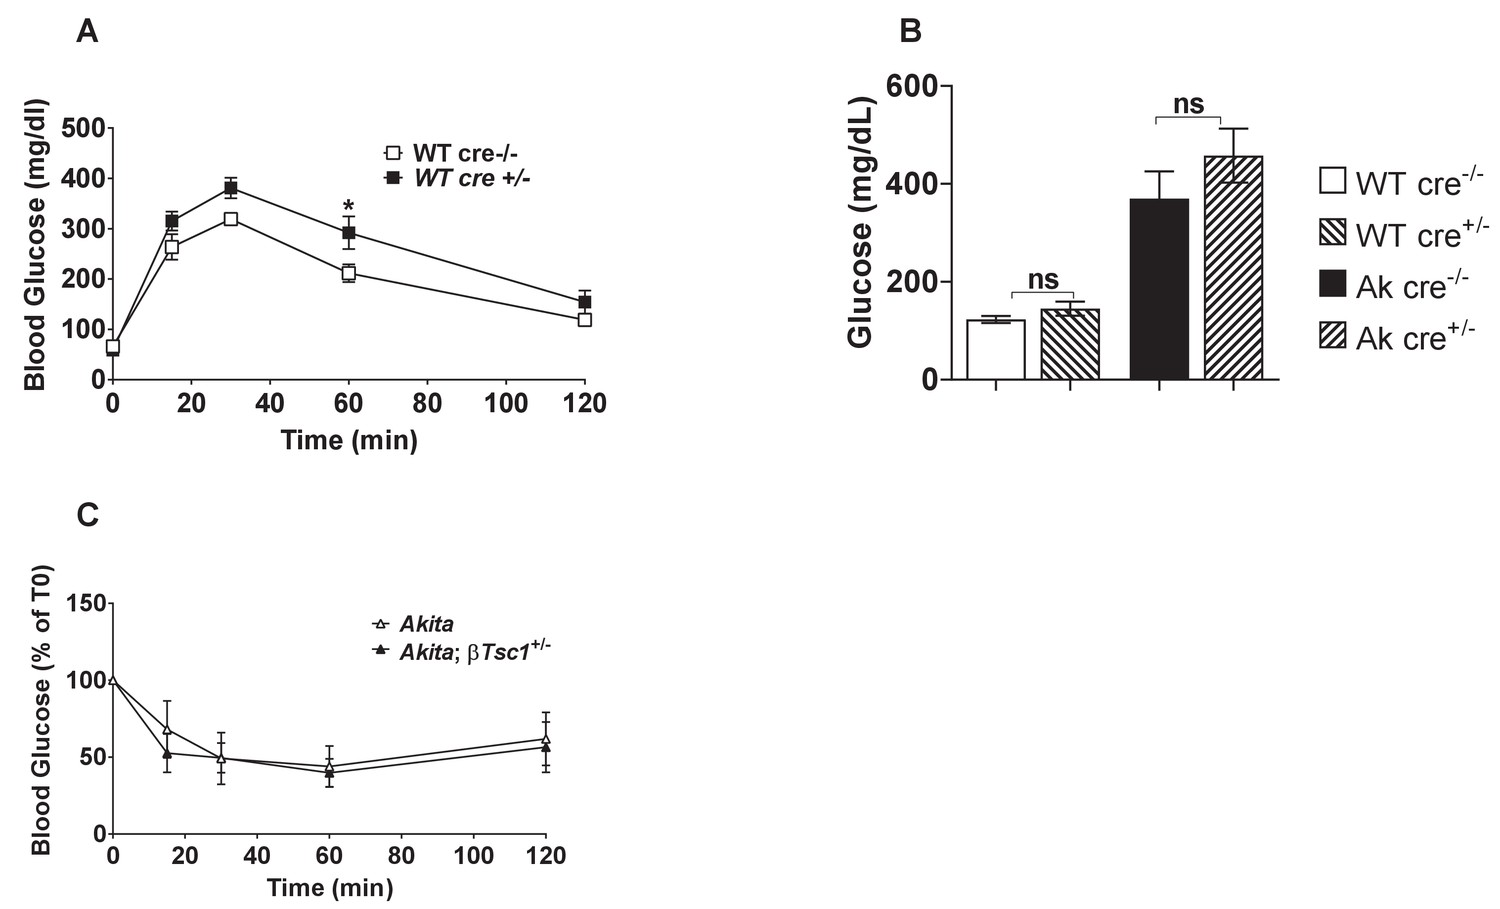
Metabolic characterization of RIP-Cre mouse.
(a) IPGTT- glucose (1.5 gr/kg) was injected after an overnight fast to adult RIP-Cre and non-transgenic control mice (n = 3); (b) fed blood glucose of adult RIP-Cre mice and RIP-Cre:Akita mice compared to non-transgenic controls (n = 6–8); (c) insulin tolerance test on Akita and RIP-Cre:Akita mice (n = 3). *p<0.05.
Figure 10 with 2 supplements
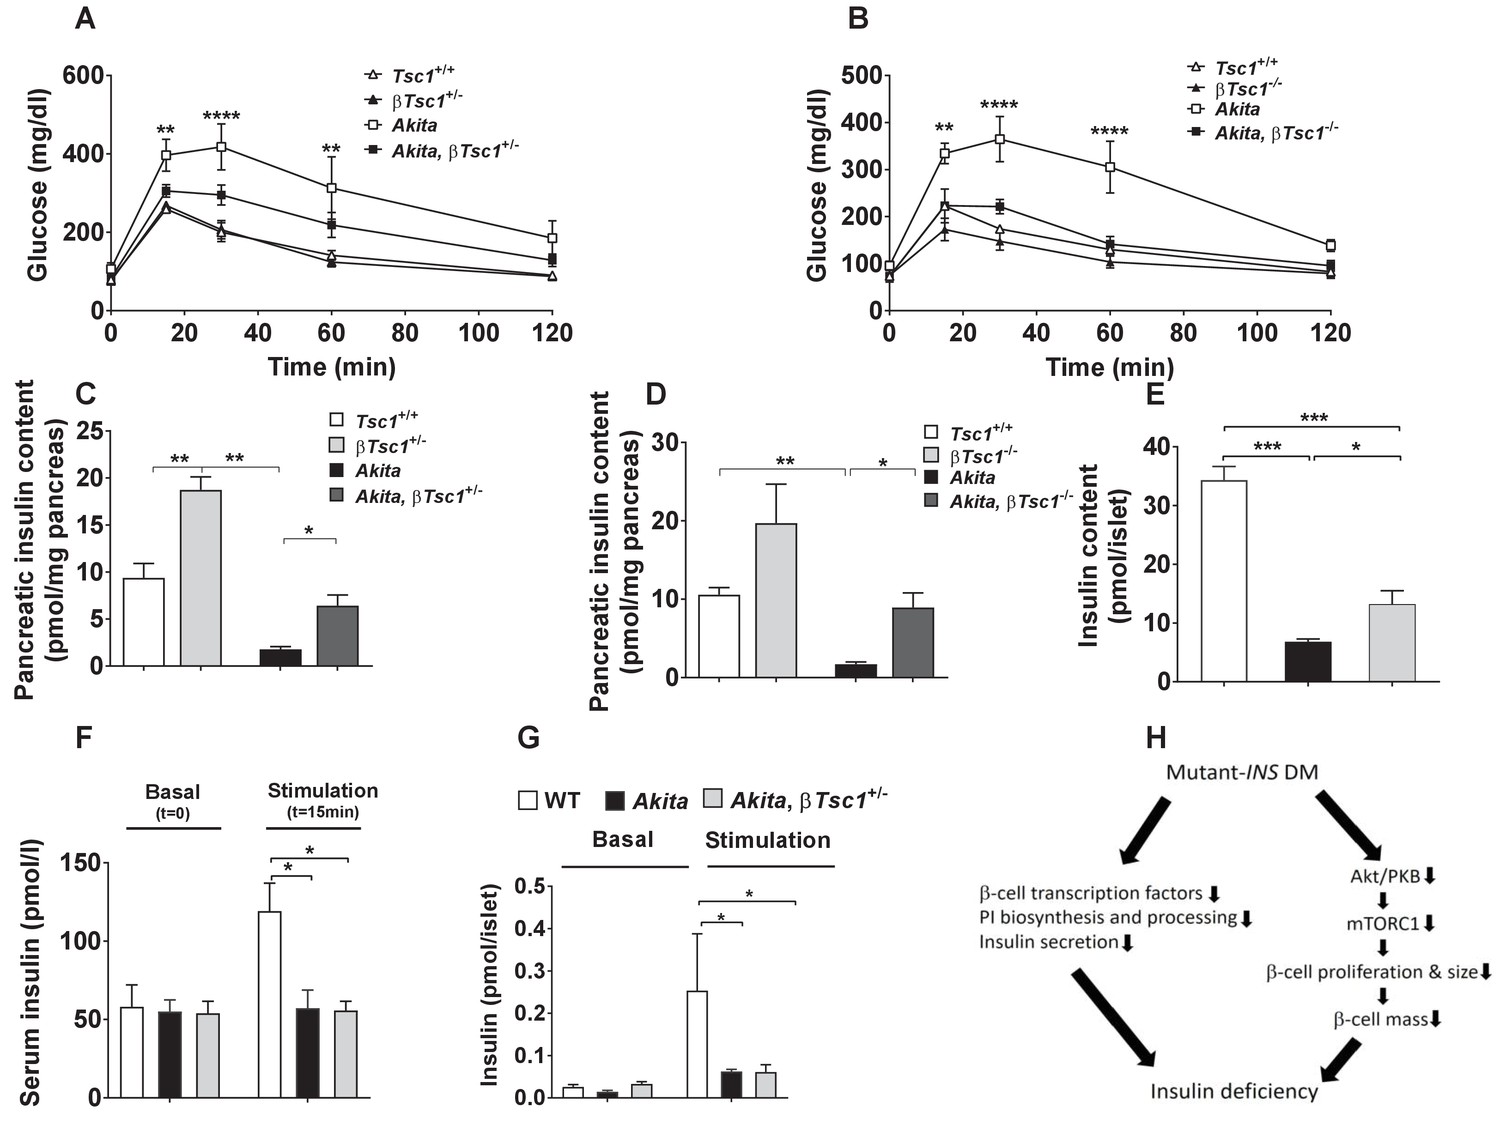
Effects of mTORC1 activation in neonate Akita β-cells on diabetes.
(a–b) IPGTT at P30-35: glucose (1 g/kg) was injected IP after an overnight fast; (a) heterozygous Tsc1 knockout Akita mice (RIP-Cre:Tsc1flox/+:Akita (Akita, βTsc1+/-) and matched controls: Tsc1flox/+ mice (Tsc1+/+), RIP-Cre:Tsc1flox/+ mice (βTsc1+/-), and Tsc1flox/+:Akita (Akita) (n = 3–5 mice in each group); (b) homozygous Tsc1 knockout Akita mice (RIP-Cre:Tsc1flox/flox:Akita (Akita, βTsc1-/-) and matched controls: Tsc1flox/flox mice (Tsc+/+), RIP-Cre:Tsc1flox/flox mice (βTsc1-/-), and Tsc1flox/flox:Akita (Akita) (n = 3–5 in each group); (c–d) pancreatic insulin content of heterozygous and homozygous Tsc1 knockout Akita mice and matched controls at P30-35 (WT (n = 7), Akita (n = 11), Akita, βTsc1+/- (n = 3) and Akita, βTsc1-/- (n = 4); (e) islet insulin content. (f–g) Effects of mTORC1 activation in neonate Akita β-cells on insulin secretion in vivo and ex vivo. (f) insulin secretion in response to IP glucose injection (n = 6 mice in each group); (g) islets were isolated from Tsc1flox/+ WT mice (WT), Tsc1flox/+:Akita (Akita) and RIP-Cre:Tsc1flox/+:Akita (Akita, βTsc1+/-) mice and insulin secretion assessed following static incubations at basal (3.3 mmol/l) and stimulated (16.7) mmol/l glucose. (h) a model of the pathophysiology of permanent neonatal diabetes. *p<0.05 **, p<0.01, ***, p<0.001****, p<0.0001.
Figure 10—figure supplement 1
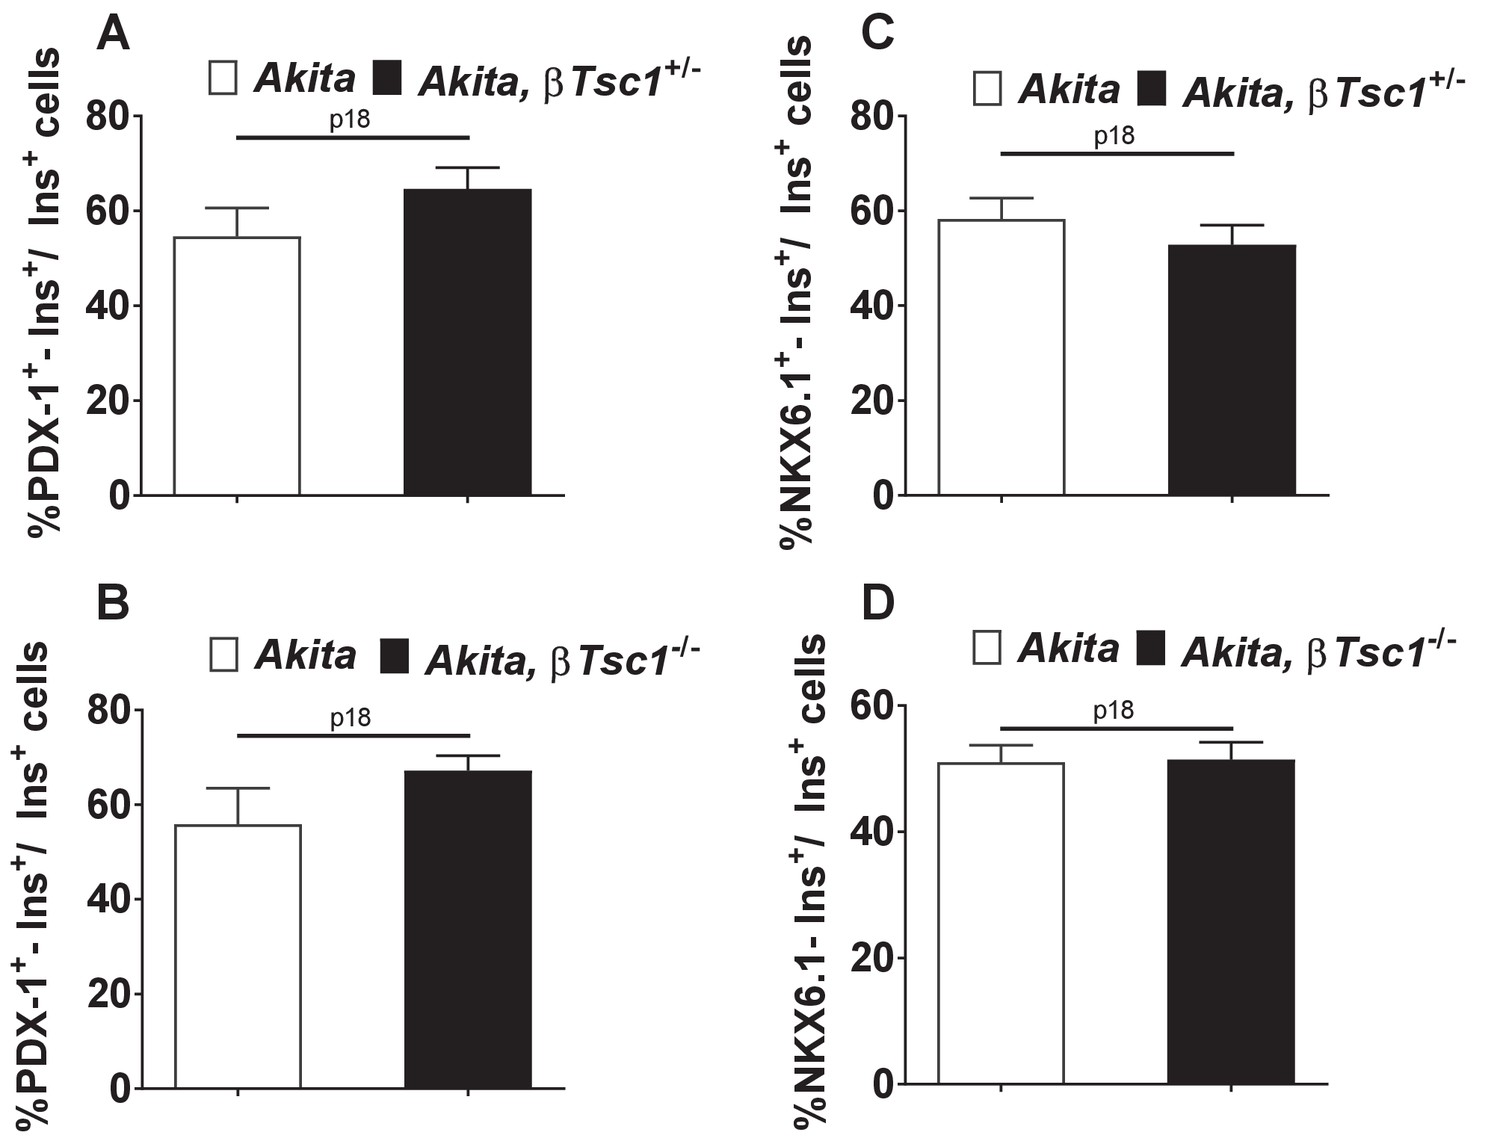
Effects of mTORC1 activation in Akitaβ-cells on PDX-1 (a, b) and NKX6.1 expression (c, d).
Heterozygous (a, c) and homozygous (b, d) βTsc1 knockout Akita and age-matched controls were sacrificed at P18. Pancreatic sections were stained for insulin and PDX-1 (Akita (n = 1760 β-cells); Akita, βTsc1+/- (n = 814 β-cells); Akita, βTsc1-/- (n = 1458 β−cells) or NKX6.1 (Akita (n = 1500 β-cells); Akita, βTsc1+/- (n = 1438 β-cells); Akita, βTsc1-/- (n = 1584 β-cells).
Figure 10—figure supplement 2
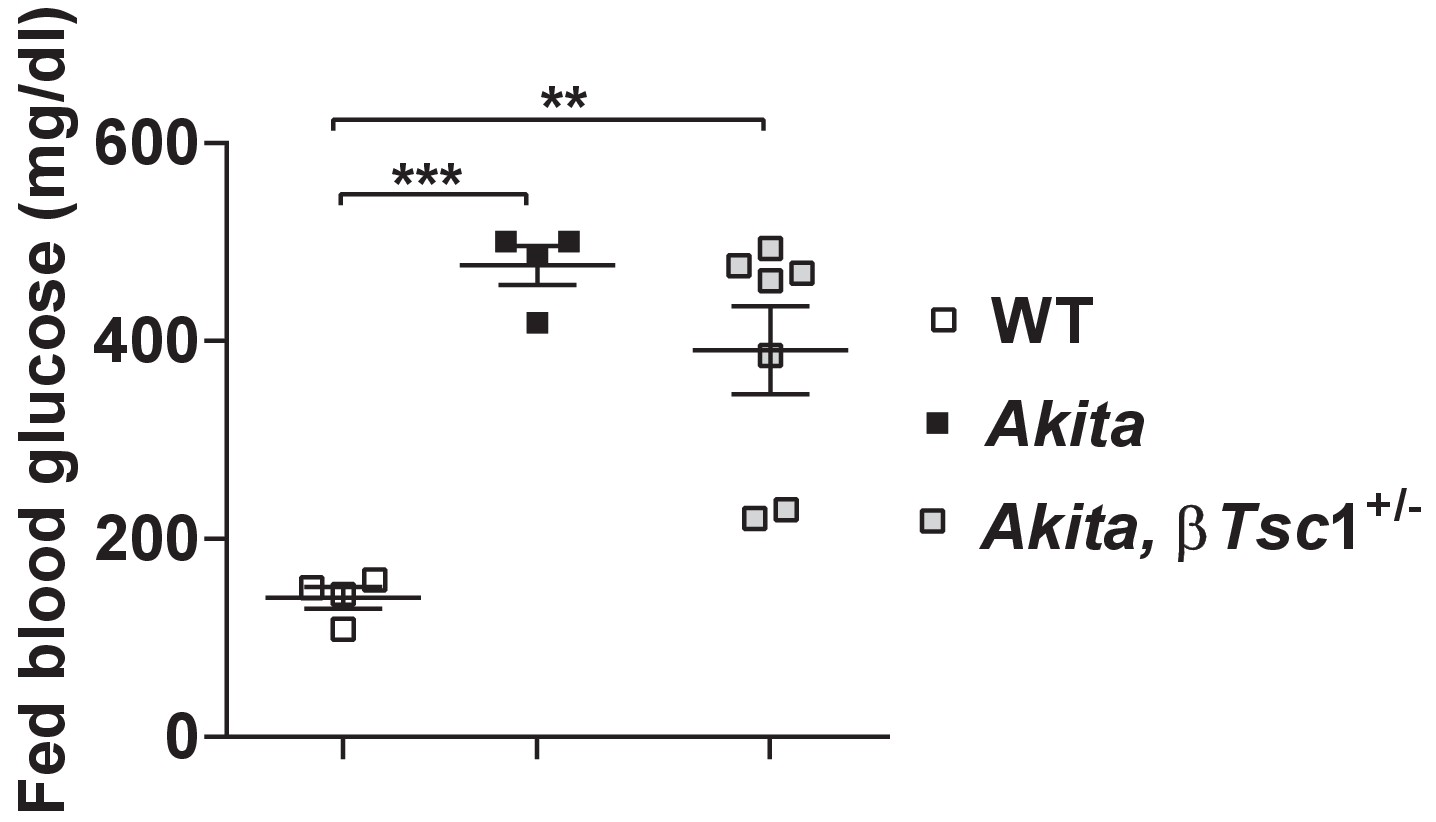
Fed blood glucose of Tsc1flox/+ mice (WT), Tsc1flox/+:Akita (Akita) and heterozygous Tsc1 knockout RIP-Cre:Tsc1flox/+:Akita (Akita,βTsc1+/-) mice at the age of 2–3 months.
Blood glucose levels are the mean of the last three consecutive glucose measurements.
**p<0.01, ***p<0.001.
Author response image 1
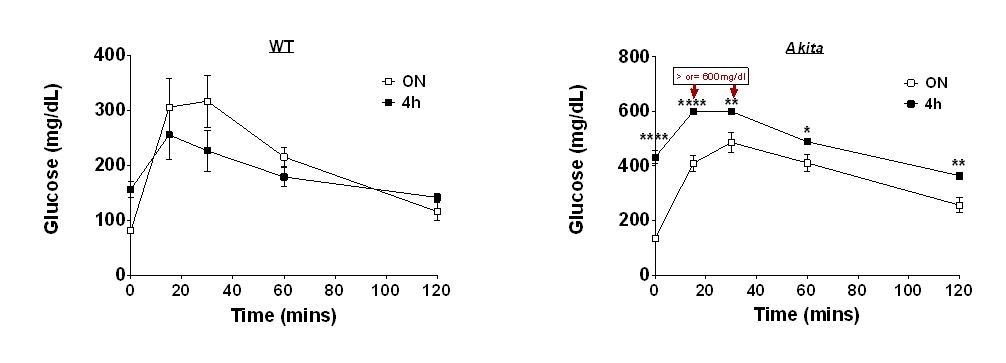
Effects of 4 and 16h fast on IPGTT.
Wildtype (WT) and Akita mice were fasted for 4 or 16h followed by IPGTT (1.5 gr/kg glucose) (n=4 in each group).
Tables
Table 1
Transcriptome changes in P19-21 Akita islets compared to age-matched controls (n = 3 per each group).
https://doi.org/10.7554/eLife.38472.013| Gene symbol | log2 Fold change | p value | Gene symbol | log2 Fold change | p value | |
|---|---|---|---|---|---|---|
| β cell signature | Growth factors and mTOR signaling | |||||
| Pcsk1 | −2.1101 | 1.1341E-13 | Dapp1 | −2.0554 | 7.7092E-09 | |
| Mafa | −1.9801 | 2.1124E-12 | Egfr | −2.0185 | 2.0824E-08 | |
| Igsf11 | −1.7632 | 2.8185E-05 | Cth | −1.9445 | 4.9302E-05 | |
| Insulin II | −1.7070 | 5.9006E-14 | Igf2 | −1.5846 | 4.3954E-03 | |
| Ucn3 | −1.5979 | 2.8193E-06 | Tubg1 | −1.5134 | 3.6446E-06 | |
| Nkx6-1 | −1.5542 | 5.0005E-11 | Sqle | −1.4758 | 5.5074E-07 | |
| Vdr | −1.4299 | 3.0451E-08 | IGF1r | −1.4735 | 1.5160E-05 | |
| Slc2a2 | −1.4352 | 5.3528E-04 | Tpi1 | −1.4516 | 1.4280E-15 | |
| Insulin I | −1.3988 | 1.7436E-11 | Btg2 | −1.4350 | 1.5855E-03 | |
| Nkx2-2 | −1.2408 | 8.1578E-04 | Elovl6 | −1.3484 | 3.1052E-03 | |
| Elovl5 | −1.3484 | 6.7970E-08 | ||||
| Insulin secretion, Insulin granules | Mllt11 | −1.3283 | 9.1320E-04 | |||
| Sytl4 | −2.1903 | 6.6331E-18 | Ppa1 | −1.3162 | 4.9816E-04 | |
| Pcsk1 | −2.1101 | 1.1341E-13 | Uchl5 | −1.3085 | 8.1939E-03 | |
| Vgf | −2.1003 | 2.1515E-18 | IGF2r | −1.2440 | 1.9131E-05 | |
| Gng12 | −1.6254 | 3.0041E-07 | ||||
| Syt5 | −1.5143 | 1.3141E-04 | Cell cycle, replication | |||
| Iqgap1 | −1.4997 | 2.8284E-08 | Pak6 | −2.1602 | 1.0026E-12 | |
| Chrm3 | −1.4571 | 1.2136E-05 | Tmem71 | −2.0697 | 3.8133E-12 | |
| Gng4 | −1.4365 | 2.7040E-06 | S100a10 | −2.0519 | 9.5186E-07 | |
| Chgb | −1.3739 | 1.4523E-03 | Spc25 | −1.8739 | 1.1632E-05 | |
| Gpr119 | −1.3712 | 2.6136E-03 | Mpp6 | −1.8457 | 3.7249E-06 | |
| Ptprn | −1.3342 | 1.7018E-04 | Plagl1 | −1.8253 | 1.5119E-12 | |
| Nup93 | −1.7850 | 1.1110E-06 | ||||
| Calcium signaling | Orc6 | −1.6260 | 1.5634E-04 | |||
| Npy | −3.2026 | 3.9755E-13 | Tmem144 | −1.6091 | 2.9040E-03 | |
| Crem | −1.9204 | 2.4035E-09 | Vrk1 | −1.5578 | 1.0175E-08 | |
| Gem | −1.8187 | 2.6277E-05 | Shmt1 | −1.5410 | 1.6394E-03 | |
| Dusp1 | −1.5182 | 9.3142E-10 | Mcm3 | −1.5330 | 4.7341E-04 | |
| Plat | −1.5137 | 8.2853E-03 | Plch1 | −1.5305 | 6.9677E-11 | |
| Tpcn2 | −1.4906 | 3.5030E-03 | Hells | −1.5287 | 2.7324E-03 | |
| Mif | −1.4597 | 9.0441E-04 | Mns1 | −1.5270 | 5.1788E-06 | |
| Vcl | −1.3870 | 3.6093E-03 | Plat | −1.5137 | 8.2853E-03 | |
| Serca2 | −1.2529 | 5.7379E-03 | Tubg1 | −1.5134 | 3.6446E-06 | |
| Dnmt1 | −1.4820 | 3.7757E-06 | ||||
| ER sress | Junb | −1.4651 | 5.6951E-04 | |||
| Herpud1 | 1.8461 | 4.6638E-24 | Pcna | −1.4557 | 7.8393E-04 | |
| Nucb1 | 1.4045 | 3.0361E-08 | Cast | −1.4562 | 9.4477E-04 | |
| Hspa5 | 1.3517 | 4.1005E-04 | Net1 | −1.4507 | 1.6503E-03 | |
| Dnajc3 | 1.3468 | 3.2649E-06 | Myo5a | −1.4252 | 1.2734E-03 | |
| Ddit3 | 1.3153 | 7.5196E-03 | Alms1 | −1.4229 | 1.1049E-03 | |
| Manf | 1.2009 | 3.2893E-02 | Chaf1a | −1.4137 | 6.1889E-03 | |
| Lig1 | −1.4101 | 9.1110E-04 | ||||
| Oxidative stress | Ramp2 | −1.3860 | 4.0237E-03 | |||
| Gstp1 | 1.6177 | 6.5804E-06 | Nphp4 | −1.3854 | 8.2551E-03 | |
| Txnip | 1.5075 | 1.0152E-02 | Mcm6 | −1.3587 | 5.1079E-03 | |
| Gstz1 | 1.4388 | 4.9681E-04 | Ywhah | −1.3561 | 7.3805E-05 | |
| Tubb4b | −1.3543 | 1.8881E-04 | ||||
| Cell death | Rgs3 | −1.3424 | 3.2137E-04 | |||
| Card14 | 4.3450 | 8.5040E-32 | Bex2 | −1.3389 | 5.1152E-04 | |
| Gdf15 | 3.1410 | 1.6785E-27 | Clic1 | −1.3291 | 3.9543E-04 | |
| Bmp3 | 2.5051 | 5.7201E-18 | Polh | −1.3169 | 9.9122E-03 | |
| Proc | 2.0628 | 1.5909E-07 | Tpm4 | −1.3125 | 3.3364E-04 | |
| Rorc | 1.9612 | 7.4298E-07 | Uchl5 | −1.3085 | 8.1939E-03 | |
| Bdnf | 1.8487 | 8.2780E-05 | Kpnb1 | −1.3081 | 3.7374E-05 | |
| Herpud1 | 1.8461 | 4.6638E-24 | Phf6 | −1.3048 | 5.1520E-05 | |
| Creb3l1 | 1.7775 | 5.6240E-11 | Pitpnm1 | −1.3032 | 5.6223E-04 | |
| Eph7 | 1.7461 | 1.7641E-04 | Aim1 | −1.3023 | 9.1456E-03 | |
| Pde3a | 1.7236 | 2.3400E-04 | Cdk5rap2 | −1.3022 | 1.7257E-03 | |
| Ascl1 | 1.7219 | 6.1969E-04 | ||||
| Mpz | 1.7049 | 1.2768E-04 | Mitochondria and electron transport chain | |||
| Relt | 1.6992 | 3.9164E-07 | Ndufs2 | −1.6249 | 6.6049E-16 | |
| Cnr1 | 1.6906 | 1.3432E-03 | Sdhc | −1.2008 | 9.8858E-04 | |
| Osgin1 | 1.6732 | 1.0137E-06 | Cox6a2 | −5.1088 | 1.1287E-24 | |
| Vip | 1.6721 | 1.5422E-03 | Cox6c | −1.2150 | 2.0212E-02 | |
| Gstp1 | 1.6177 | 6.5804E-06 | Pdk1 | 2.0052 | 4.3578E-11 | |
| Klf11 | 1.6138 | 6.0024E-05 | Pdk2 | 1.5897 | 1.6104E-04 | |
| Rgn | 1.5784 | 4.3567E-03 | Pdk4 | 1.3010 | 6.7512E-02 | |
| Dlc1 | 1.5682 | 9.9181E-05 | Pcx | −1.3978 | 4.8333E-09 | |
| Rass2f | 1.5651 | 5.6005E-03 | Fh1 | −1.8589 | 1.7194E-07 | |
| Wnt4 | 1.5573 | 4.4795E-08 | ||||
| Tle1 | 1.5488 | 1.0352E-13 | Non-beta cell hormones | |||
| Fgb | 1.5356 | 7.8501E-03 | Glucagon | 1.3727 | 7.0468E-03 | |
| Bmpr1b | 1.5335 | 3.1844E-03 | Somatostatin | 1.1510 | 6.5084E-02 | |
| Pycr1 | 1.5308 | 4.0752E-04 | Pancreatic polypeptide | 1.3546 | 1.9982E-03 | |
| Cd44 | 1.5265 | 9.8606E-03 | Ghrelin | 1.2195 | 1.3036E-01 | |
| Nod1 | 1.5259 | 5.4041E-05 | ||||
| Rasgrf2 | 1.5068 | 2.4891E-04 | ||||
| Dapk1 | 1.5036 | 7.5147E-06 | ||||
Additional files
-
Transparent reporting form
- https://doi.org/10.7554/eLife.38472.022
Download links
A two-part list of links to download the article, or parts of the article, in various formats.
Downloads (link to download the article as PDF)
Open citations (links to open the citations from this article in various online reference manager services)
Cite this article (links to download the citations from this article in formats compatible with various reference manager tools)
Inhibition of mTORC1 by ER stress impairs neonatal β-cell expansion and predisposes to diabetes in the Akita mouse
eLife 7:e38472.
https://doi.org/10.7554/eLife.38472


