A liquid-like organelle at the root of motile ciliopathy
- University of Texas, United States
- Washington University School of Medicine, United States
Figures
Figure 1 with 5 supplements
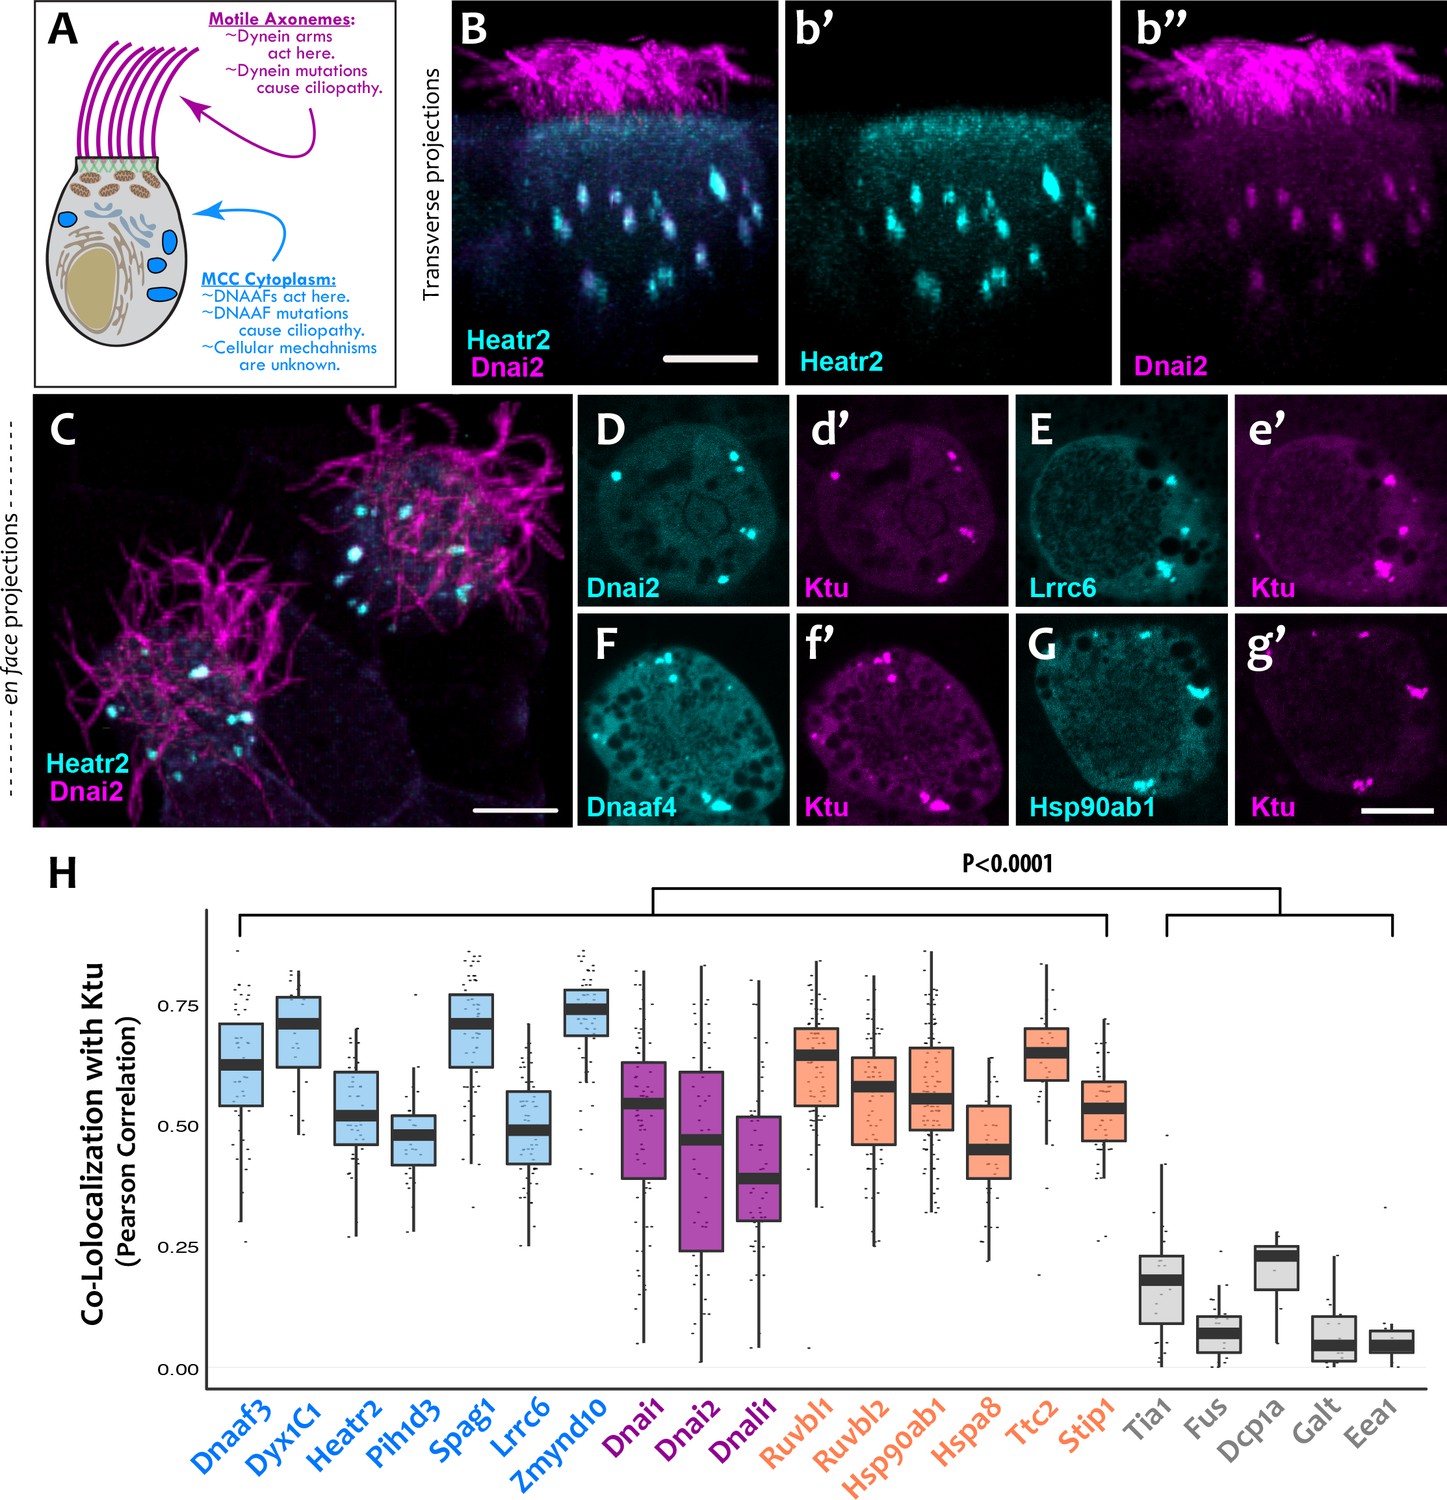
DNAAFs, Dyneins, and chaperones co-localize together in DynAPs.
(A) Schematic showing a multiciliated cell (MCC) indicating the site of function for proteins linked to motile ciliopathy. Proteins and events in the cytoplasm are indicated in blue; those in the axonemes are indicated in magenta (B) Cross-sectional projection of mucociliary epithelium; GFP-Heatr2 is localized in MCCs to cytoplasmic foci (b’), whereas mCherry-Dnai2 localizes to both axonemes and cytoplasmic foci (b’’). (C) En face projection showing mCherry-Dnai2 localization in motile axonemes and cytoplasmic foci (magenta), with GFP-Heatr2 showing restricted localization to cytoplasmic foci. (D–G) En face optical sections showing co-localization of fluorescent protein (FP) fusions to the indicated proteins. (H) Graph displaying Pearson Correlation Coefficients for colocalization of GFP fusion proteins with mCherry-Ktu at DynAPs. Scale bars 10 µm. p < 0.0001 by one-way ANOVA and post-hoc Tukey-Kramer HSD test. n-values for each FRAP experiment can be found in Table 2.
-
Figure 1—source data 1
Colocalization results presented in Figure 1H and Figure 1—figure supplement 2.
- https://doi.org/10.7554/eLife.38497.008
Figure 1—figure supplement 1
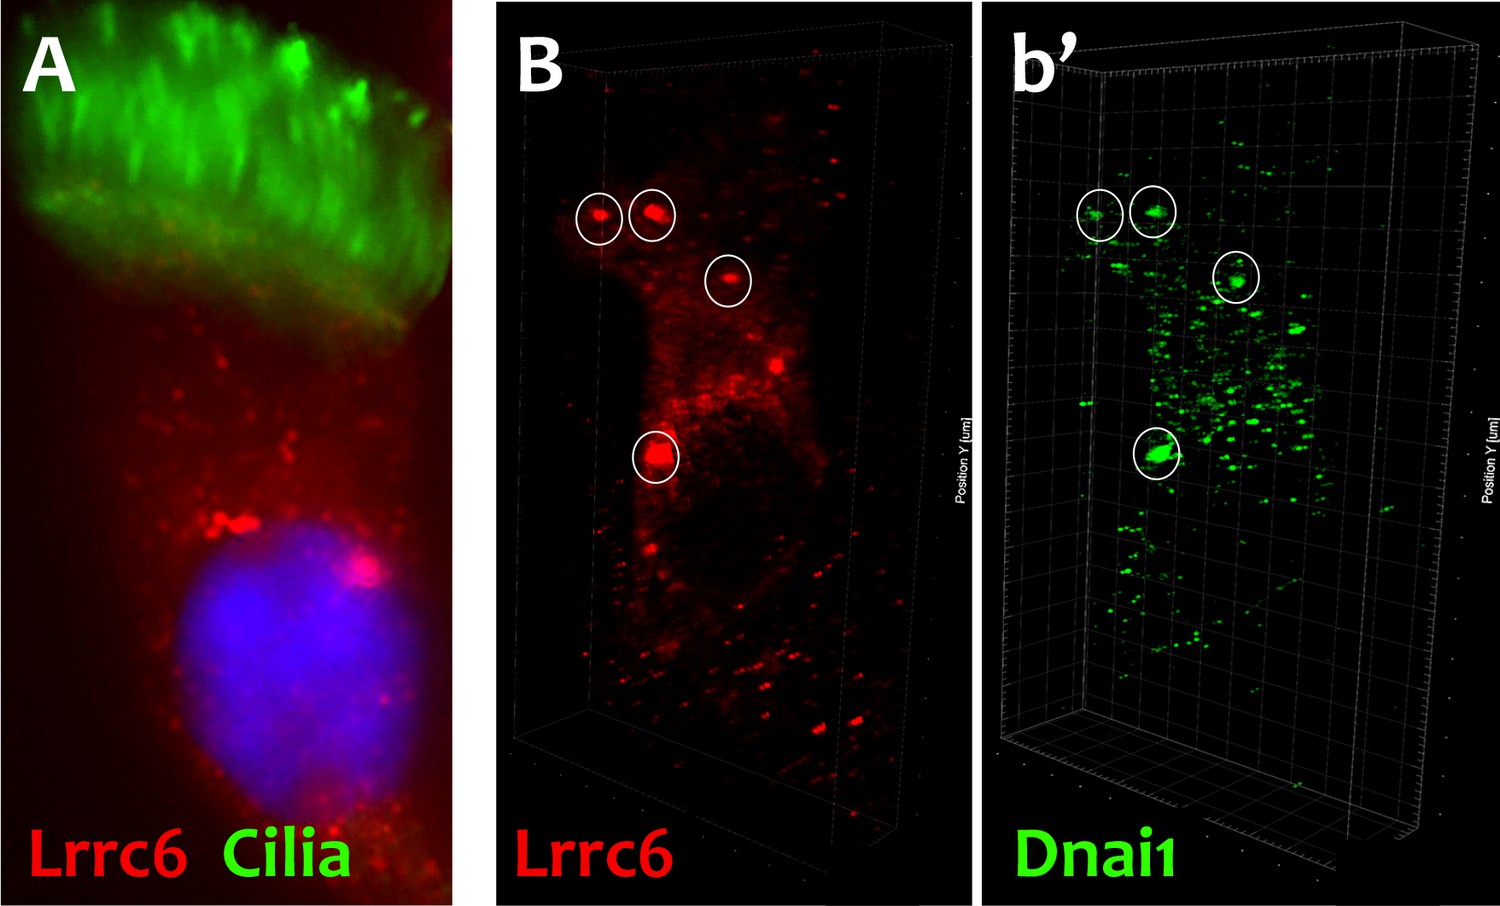
DNAAFs and Dyneins co-localize in DynAPs in primary human MCC.
(A) Immunostaining of primary human MCC reveals endogenous LRRC6 (red) in cytoplasmic foci, cilia are marked by acetylated tubulin (green). (B) LRRC6 labeled foci (red) are enriched in Dnai1 (green in b’) in human MCCs.
Figure 1—figure supplement 2
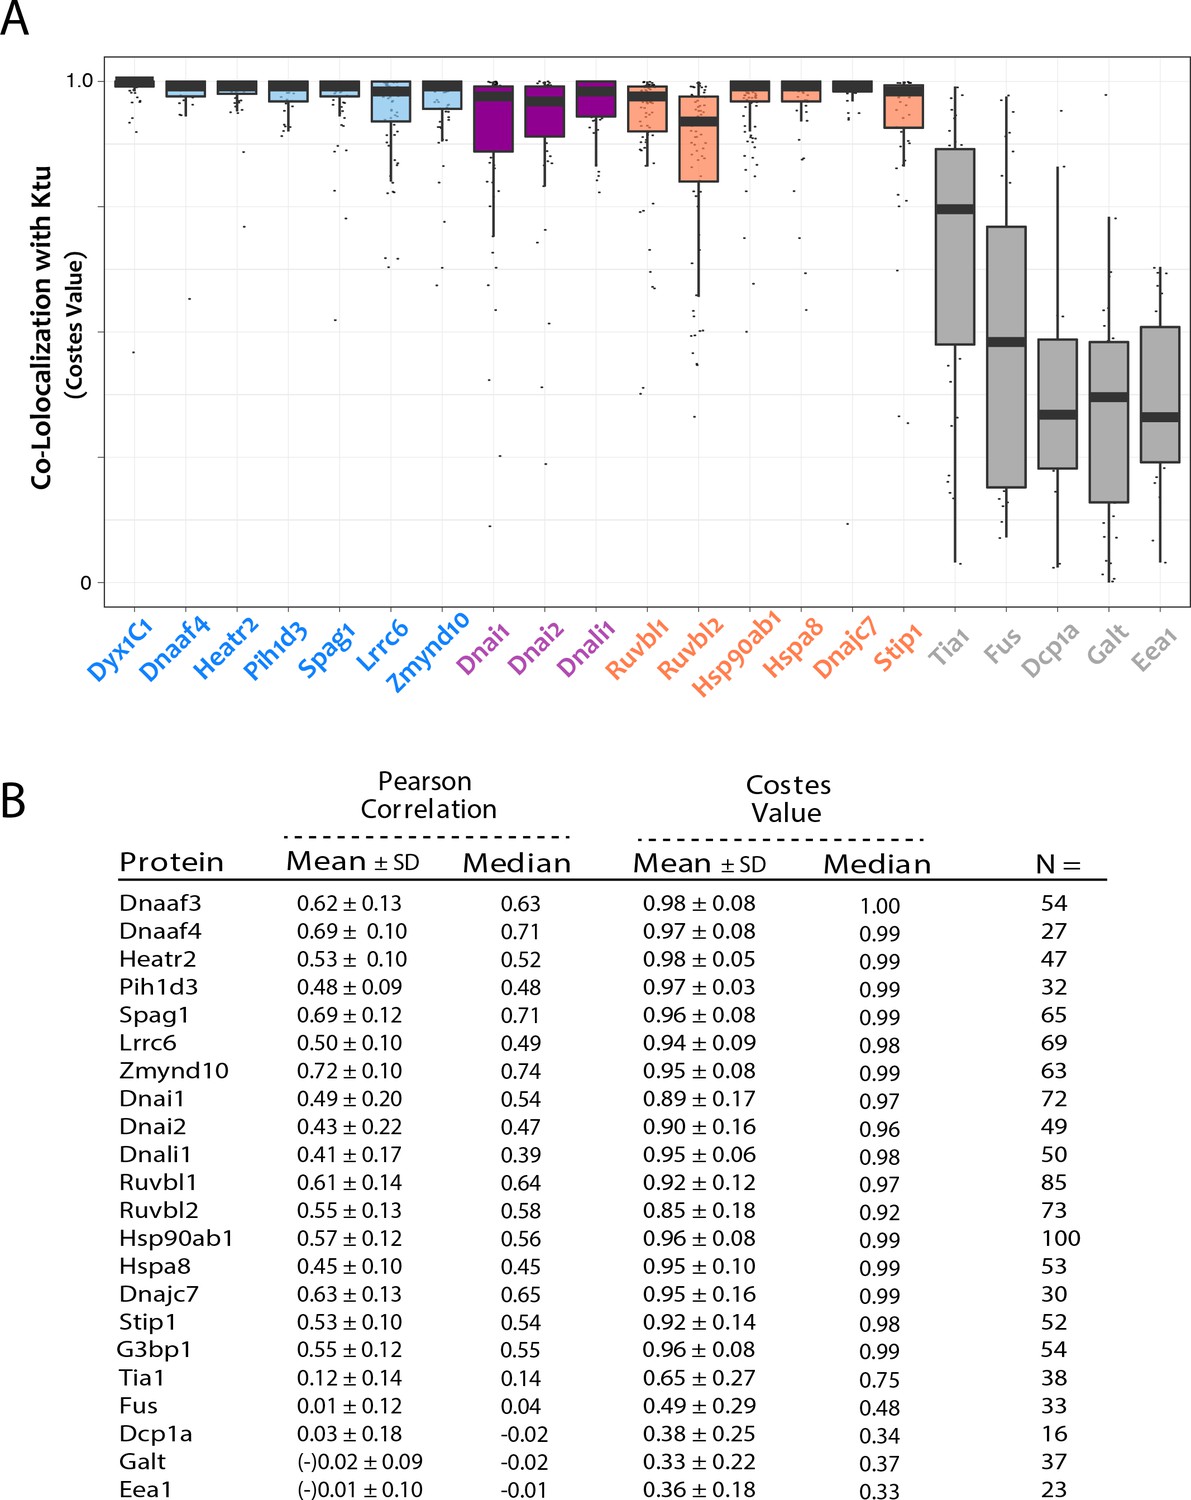
Analysis of co-localization in DynAPs.
(A) Graph displaying Costes P-values for colocalization of GFP fusion proteins with mCherry-Ktu. (B) Table containing mean and median for both Pearson and Costes analyses of colocalziation as well as n-values for each of the proteins tested.
Figure 1—figure supplement 3
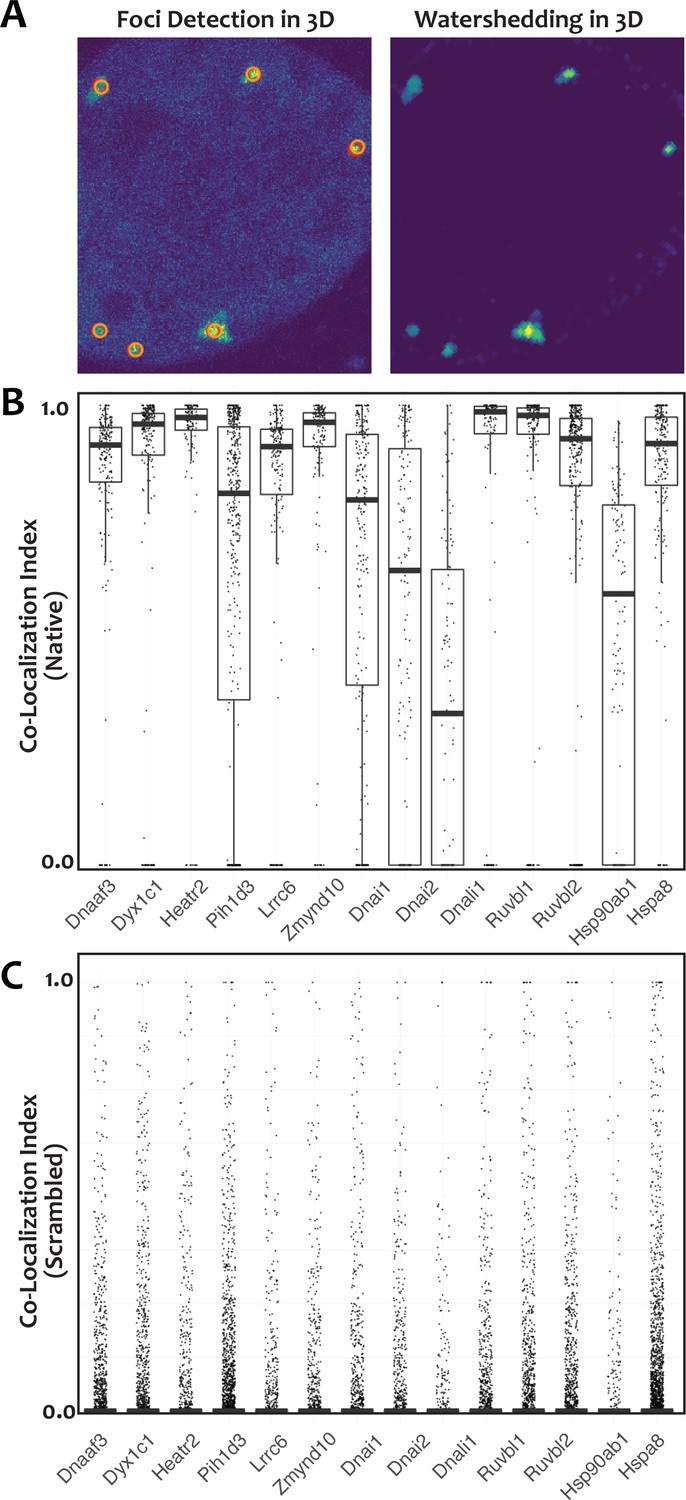
For unbiased assessment of co-localization, custom software was developed for automated detection of foci in confocal stacks and calculation of 3D co-localization in foci (see Materials and methods).
(A) Left panel shows focus detection in the current slice (red circle) and in the adjacent slice (orange circle) of a confocal stack. Right panel shows voxel intensity of the identified foci after watershedding. (B) Plot of the co-localization index (see Materials and methods) of FP fusions to indicated proteins relative to GFP-Ktu after automated identification of foci. (C) Plot of co-localization index for the same data after computational randomization of foci position. Reduction in co-localization of all tested proteins after randomization was extremely significant (p<2.2×10⁻¹⁶), suggesting that the colocaliztion patterns in B did not occur by chance.
Figure 1—figure supplement 4
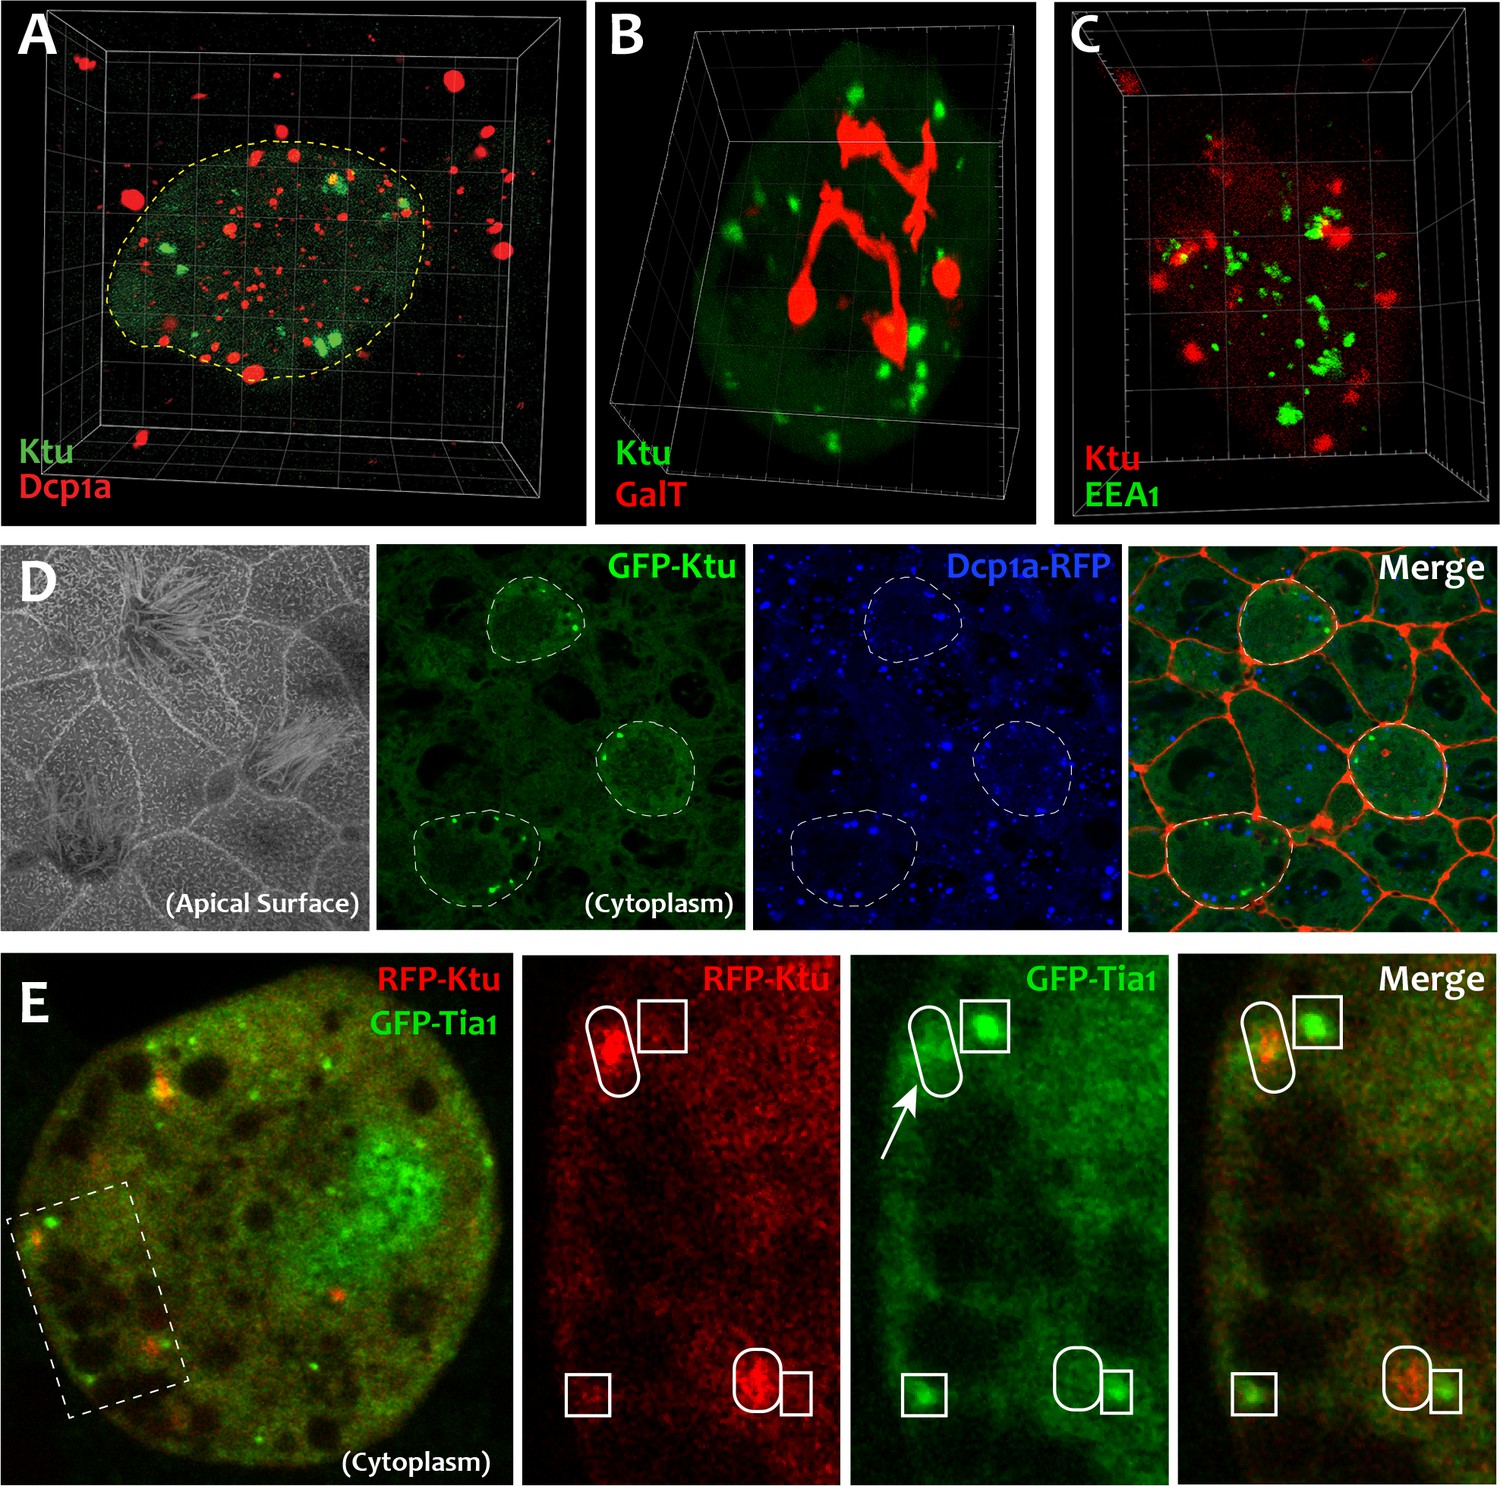
DynAPs are specific cellular compartments.
(A) GFP-Ktu labeled DynAPs (green) do not overlap with Dcp1a-labeled P bodies (red). In addition, while Dcp1a forms foci both in the MCC (dashed circle) and in the neighboring cells. (B, C) Ktu-FP-labeled DynAPs (green in B, and red in C) do not co-localize with the trans-Golgi labeled by GalT (red) or with endosome labeled with Eea1 (green). (D) Membrane labeling at the apical surface reveals MCCs surrounded by non-ciliated goblet cells. Panels to the right show en face projections through the cytoplasm of the same cells. GFP-Ktu forms foci only in MCCs (dashed circles, compare with apical surface image. Dcp1a-RFP (blue) forms foci in all cells. Cellular membrane is labeled as red. (E) Projection through the cytoplasm reveals GFP-Tia1 foci (green) in a single MCC. Higher magnification views of the boxed area in B showing GFP-Tia1 (green) localizes strongly to small foci (boxes) but only weakly to the larger DynAPs (ovals) labeled by mCherry-Ktu (red).
Figure 1—figure supplement 5
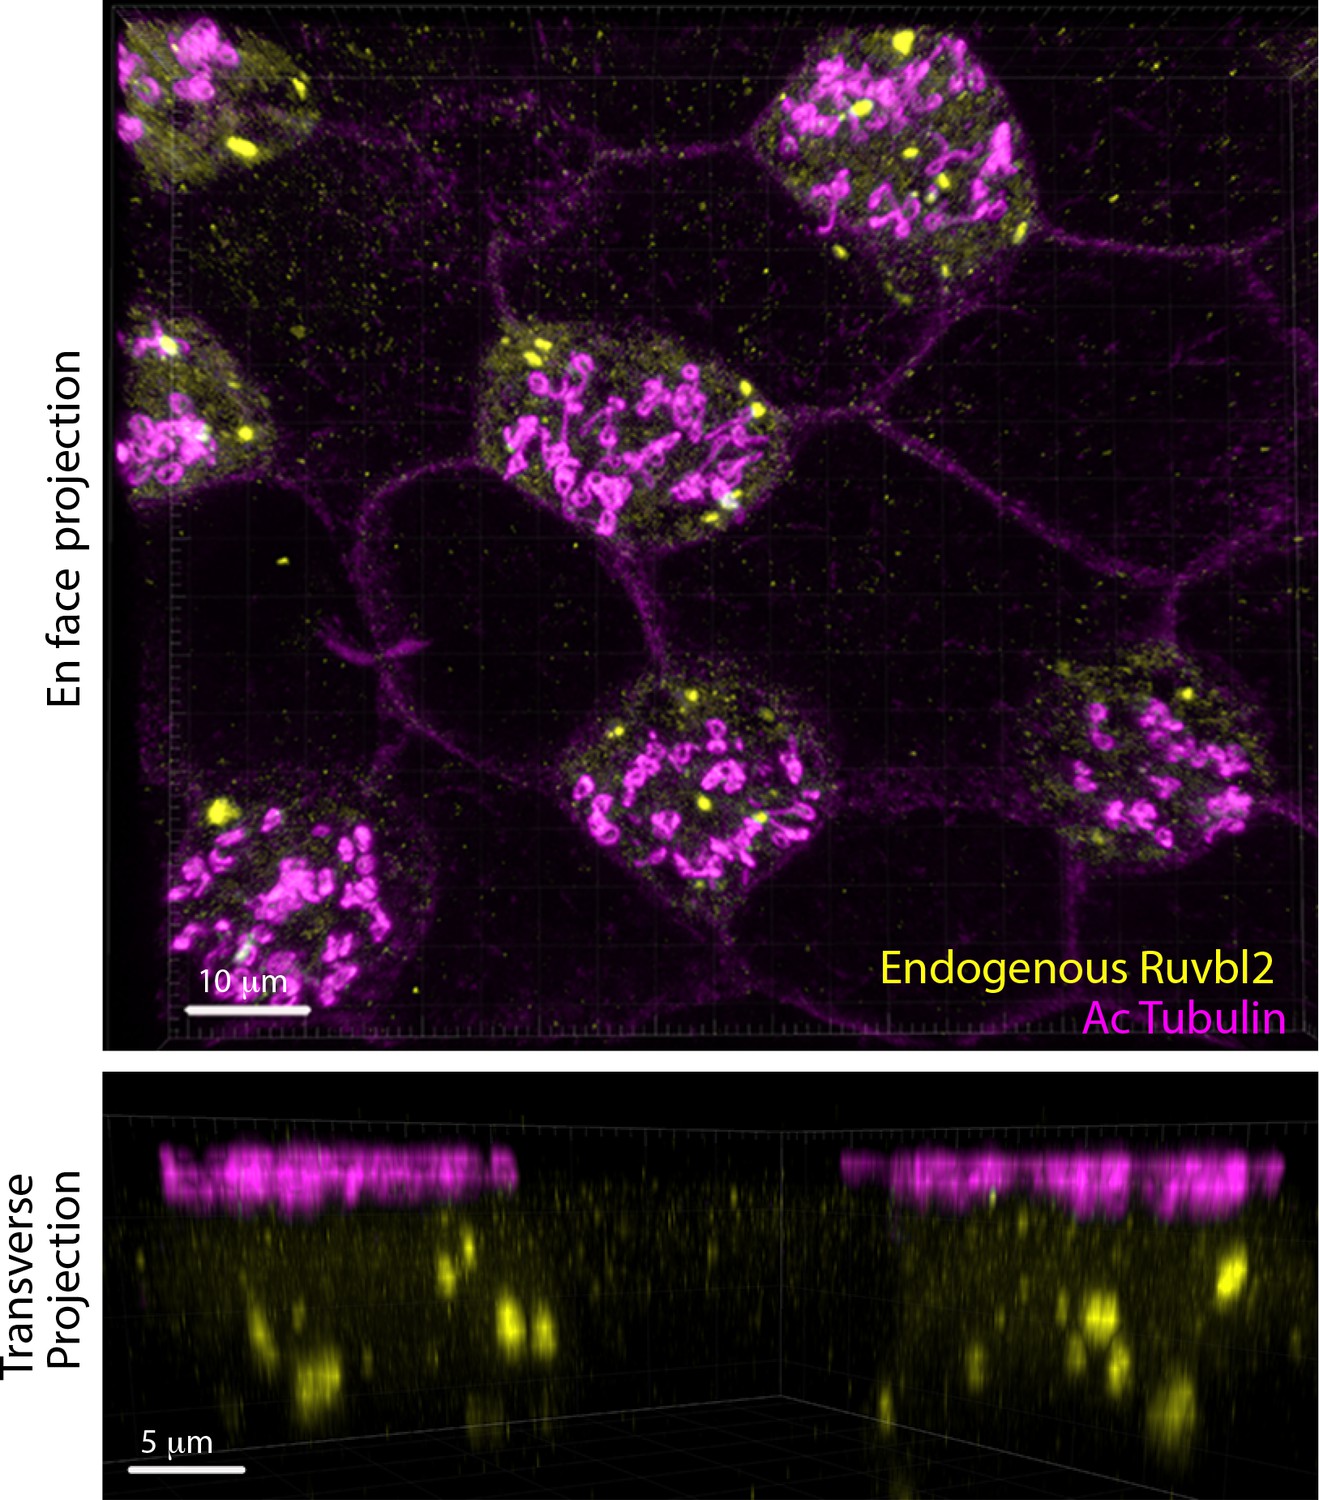
DynAPs labeled by endogenous Ruvbl2 are present only in MCCs.
Upper Panel: DynAPs are labeled by immunostaining for endogenous Ruvbl2 (yellow) and present specifically in MCCs (upper panel, magenta indicates acetylated tubulin immunostaining to label cilia. Lower panel: A cross-sectional projection shows endogenous Ruvbl2 in DynAPs (yellow) and cilia (acetylated tubulin, magenta).
Figure 2
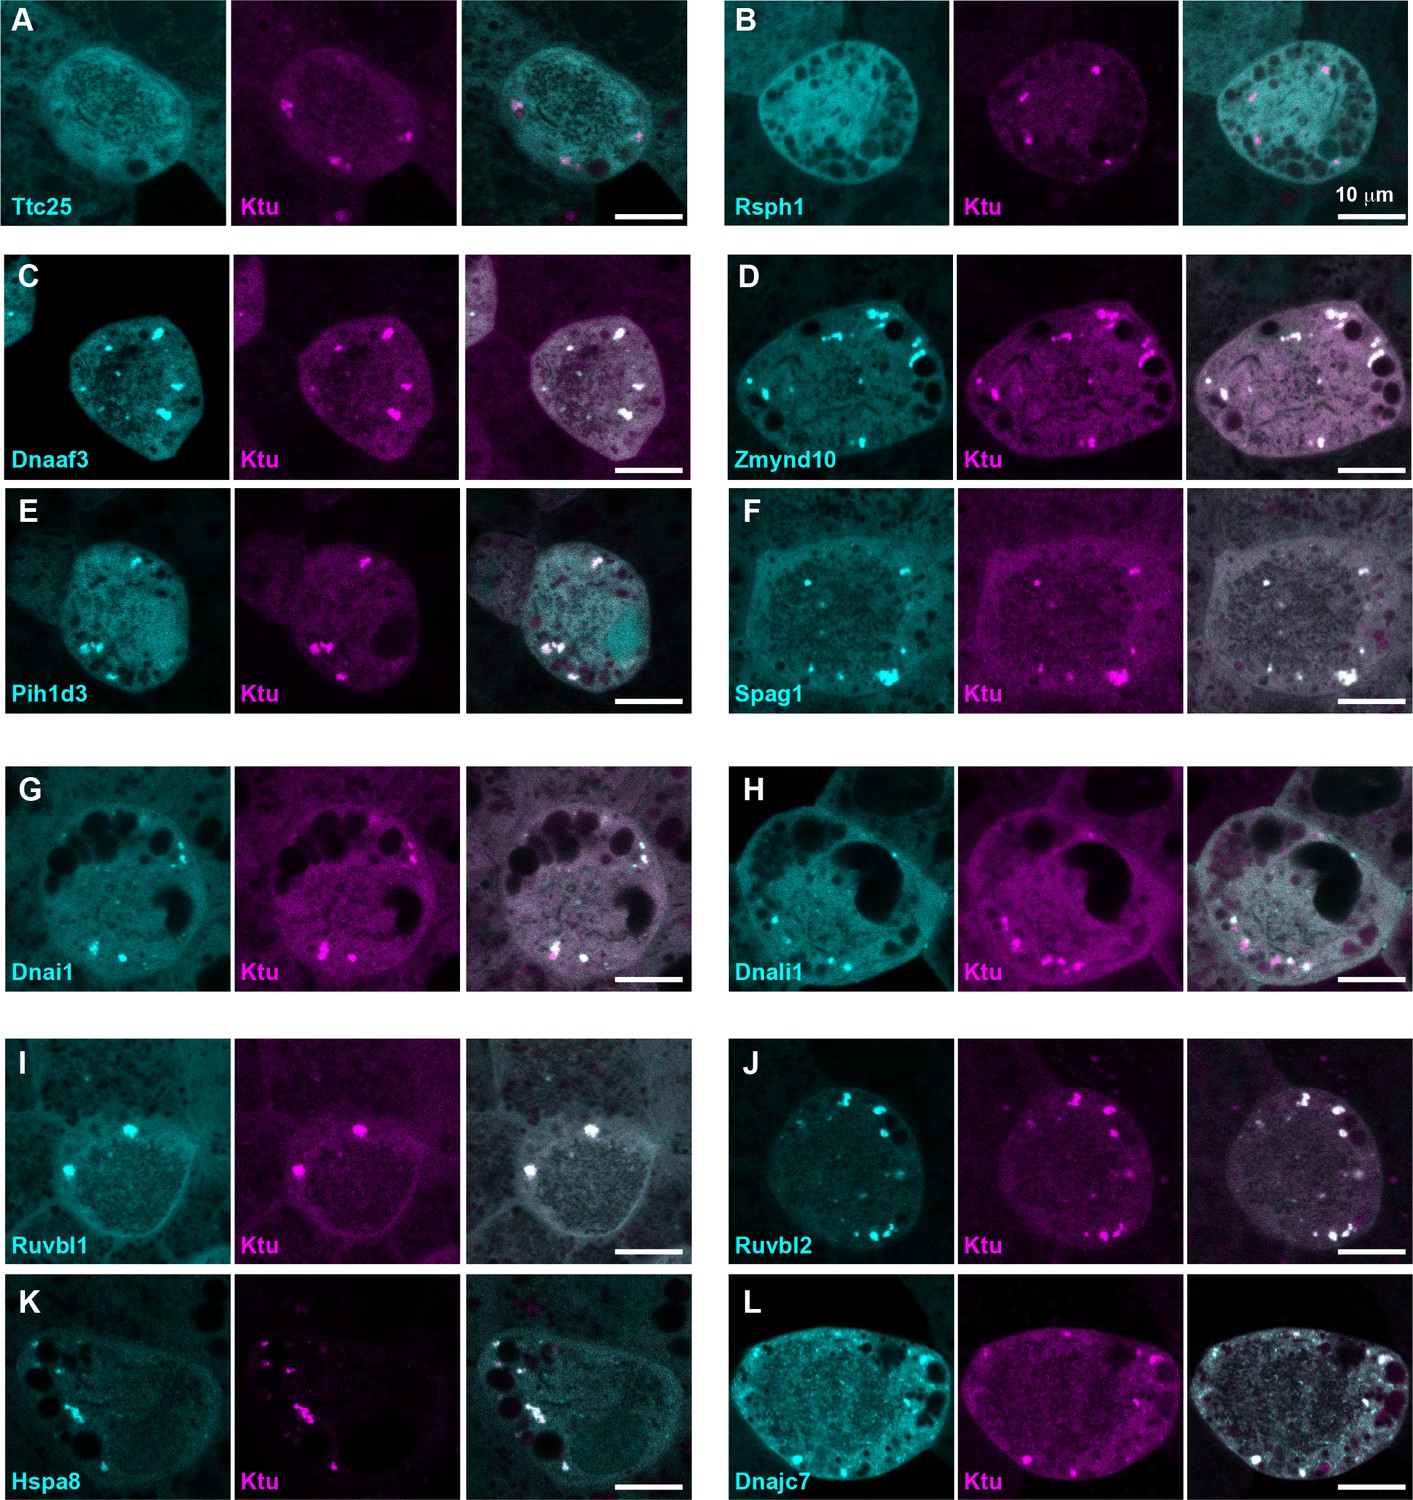
DynAPs concentrate DNAAFs, dynein subunits, and Hsp70/90 chaperones.
All left panels show GFP fusions (cyan) to indicated proteins, note all co-localize in DynAPs with the mCherry-Ktu (magenta) shown in middle panels. All right panels are merged views. The docking complex protein Ttc25 (panel A) and the radial spoke protein Rsph1 (panel B) serve as negative controls and do not localize in DynAPs. All other do co-localize; see quantifications in Figure 1H and Figure 1—figure supplements 2 and 3. Scale bars = 10 um.
Figure 3
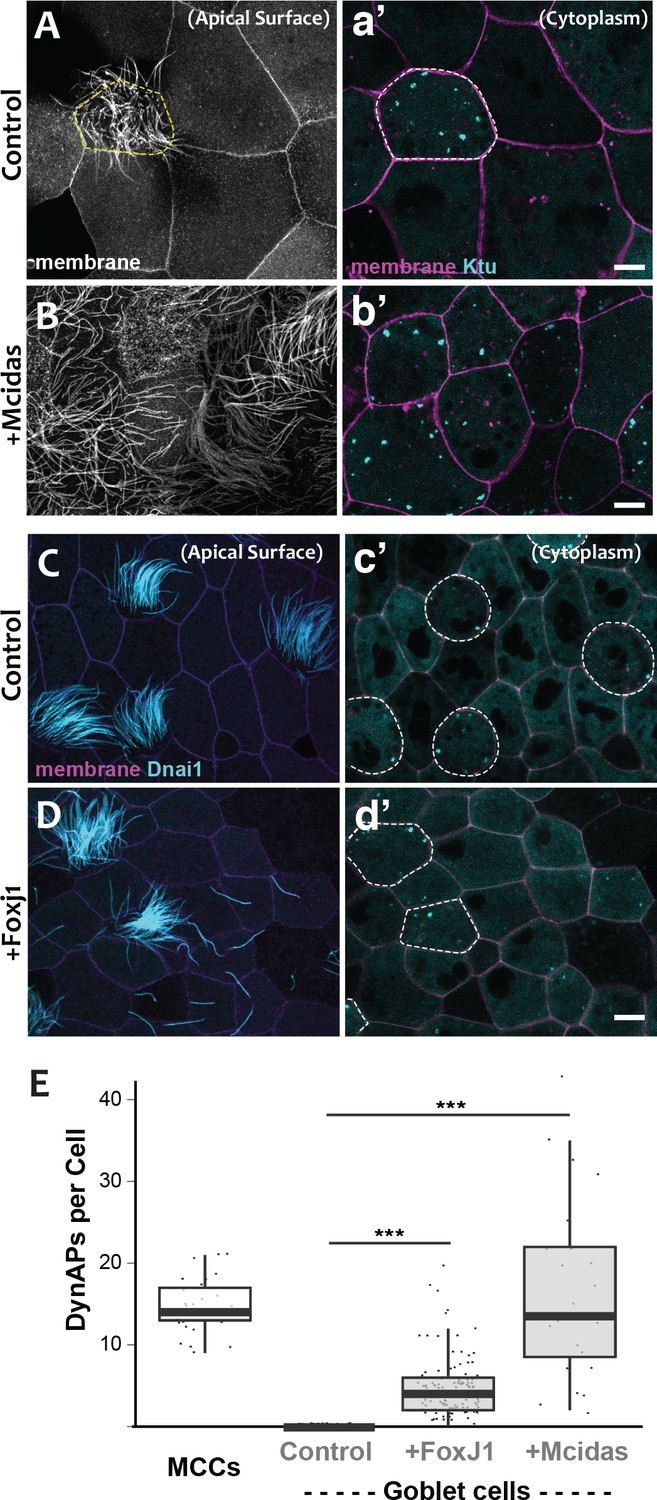
DynAPs are MCC-specific and controlled by the motile ciliogenic transcriptional circuitry.
(A) Membrane labeling with CAAX-RFP at the apical surface reveals a single MCC (cilia, dashed circle) surrounded by non-ciliated goblet cells. (a’) Projection of the cytoplasm of the same cells in A. GFP-Ktu is expressed throughout, but forms foci only in the MCC. (B) Membrane labeling at the apical surface reveals that expression of Mcidas converts all cells to MCCs. (b’) Projection of the cytoplasm of the same cells in B; GFP-Ktu forms foci in all cells upon expression of Mcidas.( C–D) Apical surface views of a control mucociliary epithelium (C) and one ectopic expressing Foxj1 (D). (c’–d’) Projection of the cytoplasm of the same cells in C and D. GFP-Dnai1 labels both of axonemes at the surface in C, D and DynaAPs in cytoplasm in c’d’. CAAX-BFP labels membranes; Dashed lines mark MCCs. Expression of Foxj1 induces solitary ectopic motile cilia (D) and ectopic DynAPs (d’).(E) Graph displaying number of cytoplasmic GFP-Ktu foci in wild-type MCCs and goblet cells as well as ciliogenesis-induced goblet cells. p < 2.2×10⁻¹⁶ for Foxj1 and p = 1.68×10⁻⁷ for Mcidas experiments by two-sample t-test. n = 29 (wild-type MCC), n = 130 (wild-type goblet cell), n = 122 (Foxj1-OE goblet cells), and n = 24 (Mcidas-HGR Goblet cells) across three embryos. Scale bars 10 µm.
-
Figure 3—source data 1
Foci counts for WT MCCs and WT, FoxJ1-OE and Mcidas-OE goblet cells.
- https://doi.org/10.7554/eLife.38497.014
Figure 4
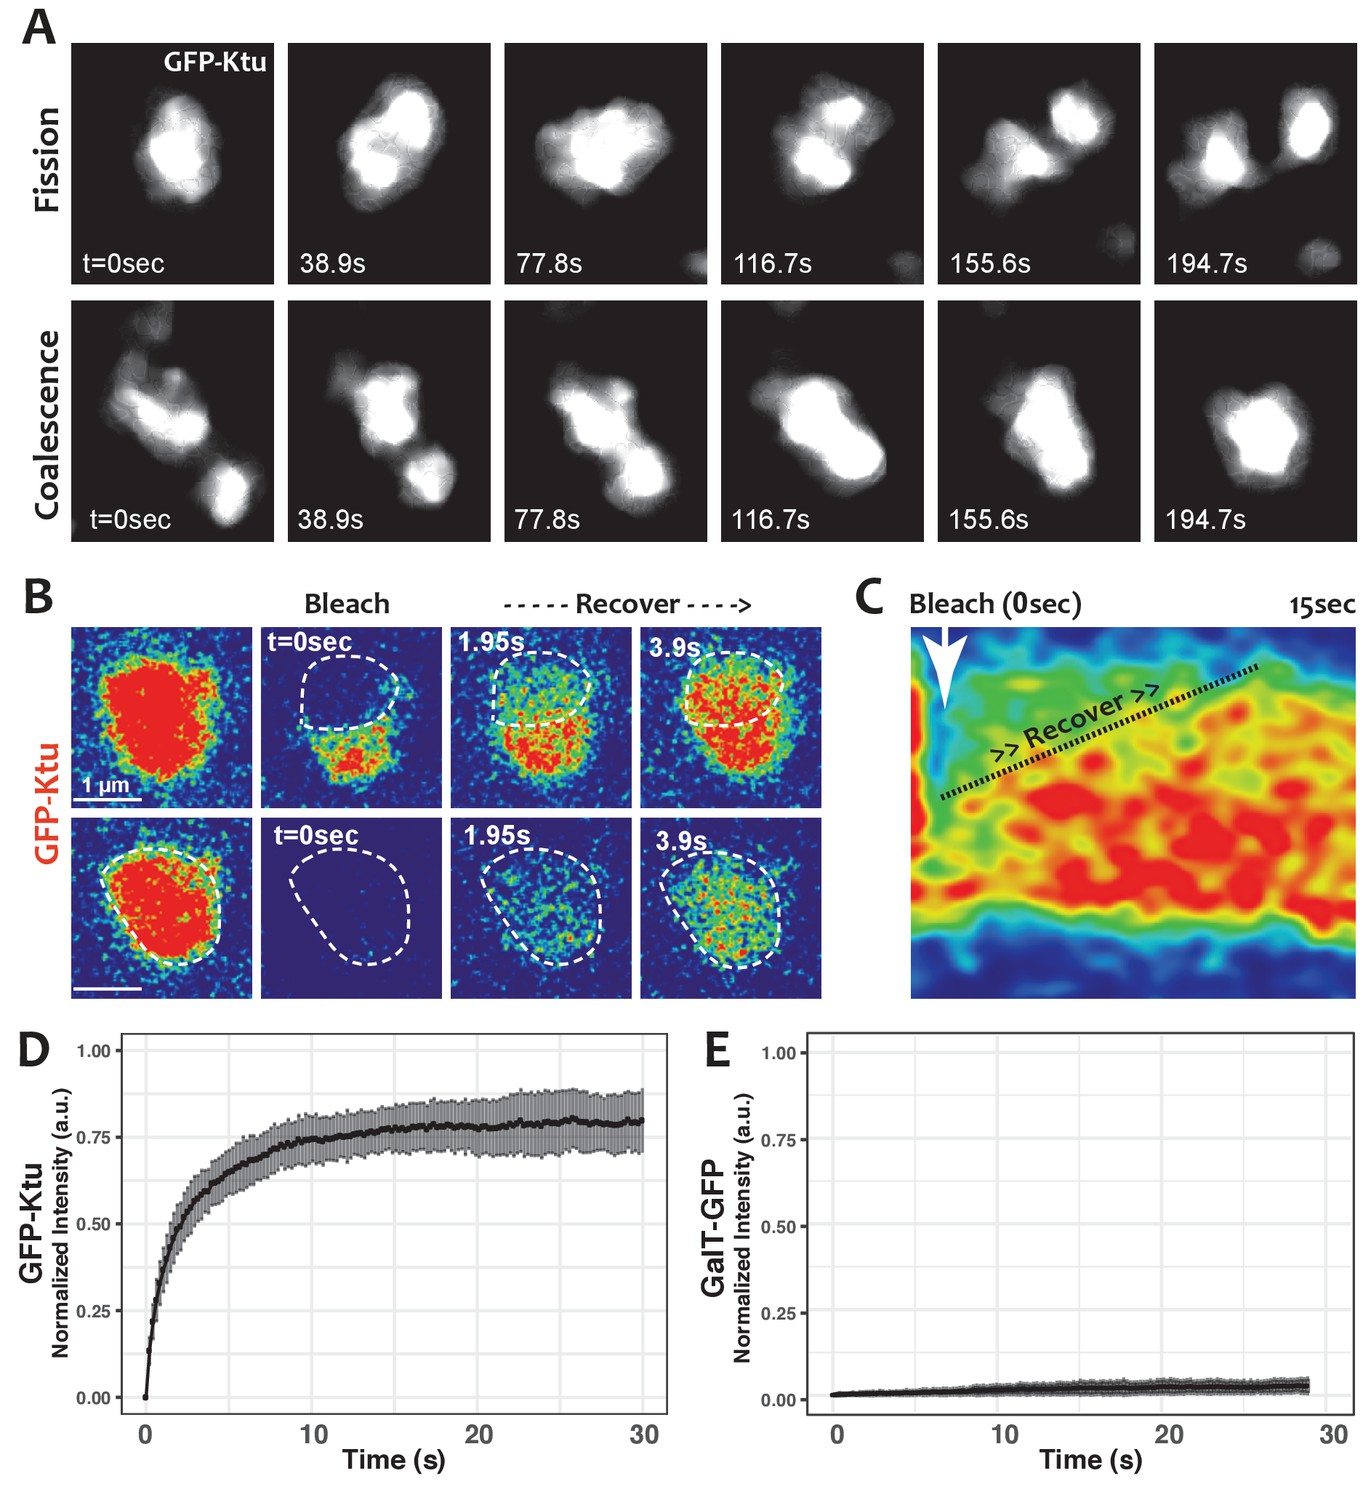
DynAPs display liquid-like behaviors.
(A) Stills from time-lapse imaging of an individual DynAP labeled with GFP-Ktu undergoing fission (upper) and later coalescence (lower) (time in seconds). (B) Time-lapse images of GFP-Ktu recovery after photobleaching of partial (upper) or entire DynAPs (lower). Images are color-coded to highlight changes in pixel intensity (blue = low; red = high; green = intermediate. Dashed line marks the photobleaching area. (C) Kymograph of GFP-Ktu recovery after partial bleach, showing that recovery of the bleached area occurs from within the DynAP, rather than from the cytoplasm. Note, however, that FRAP of whole DynAPs indicates that rapid exchange also occurs between DynAPs and the cytoplasm (Panel B, lower; and see Table 2). (D) FRAP kinetics of GFP-Ktu after bleaching entire DynAPs. (E) FRAP kinetics of the trans-golgi protein GalT-GFP after bleaching golgi-derived vesicles.
-
Figure 4—source data 1
Aggregate data for FRAP curves presented in Figures 4 and 5.
- https://doi.org/10.7554/eLife.38497.016
Figure 5
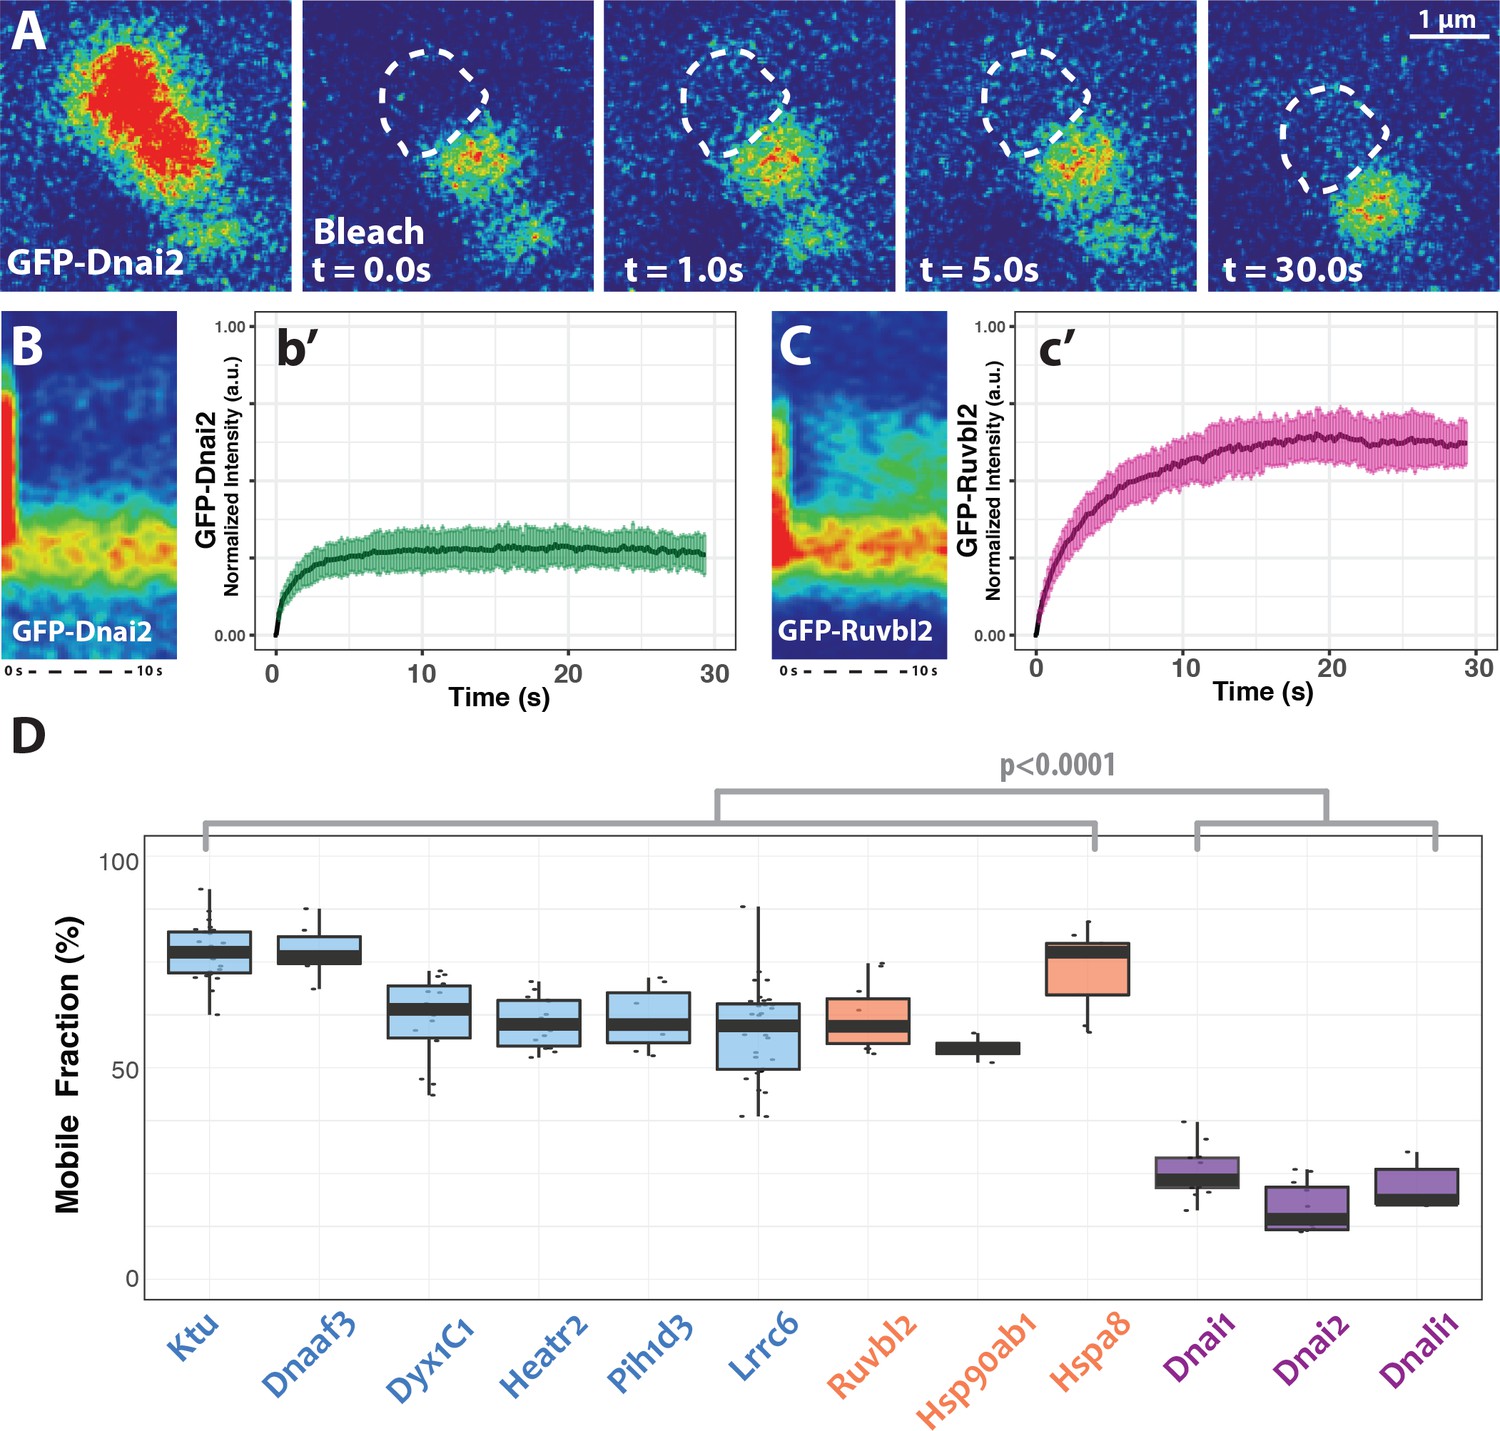
DynAP stably retain axonemal dynein subunits.
(A) Time-lapse images of GFP-Dnai2 recovery after partial photobleaching of a DynAP reveals little recovery after 30 s. Dashed line marks the photobleaching area. (B) Kymograph of the first 10 s following photobleaching displays little recovery of GFP-Dnai2. This is reflected by the FRAP kinetics of Dnai2 after complete bleaching of DynAPs (b’). (C) In stark contrast, the kymograph of the first 10 s following partial photobleaching of the DNAAF GFP-Ruvbl2 displays rapid recovery at DynAPs. This is reflected by the FRAP kinetics of GFP-Ruvbl2 after complete bleaching of DynAPs (c’). (D) Boxplots of the mobile fractions of various resident proteins at DynAPs. Ciliopathy-related DNAAFs (blue) and canonical chaperones (orange) display greater fluorescence recovery than dynein arm components (purple). p<0.0001 by one-way ANOVA and post-hoc Tukey-Kramer HSD test. n-values for each FRAP experiment can be found in Table 2.
-
Figure 5—source data 1
Aggregate data for FRAP curves presented in Figures 4 and 5.
- https://doi.org/10.7554/eLife.38497.020
Figure 6
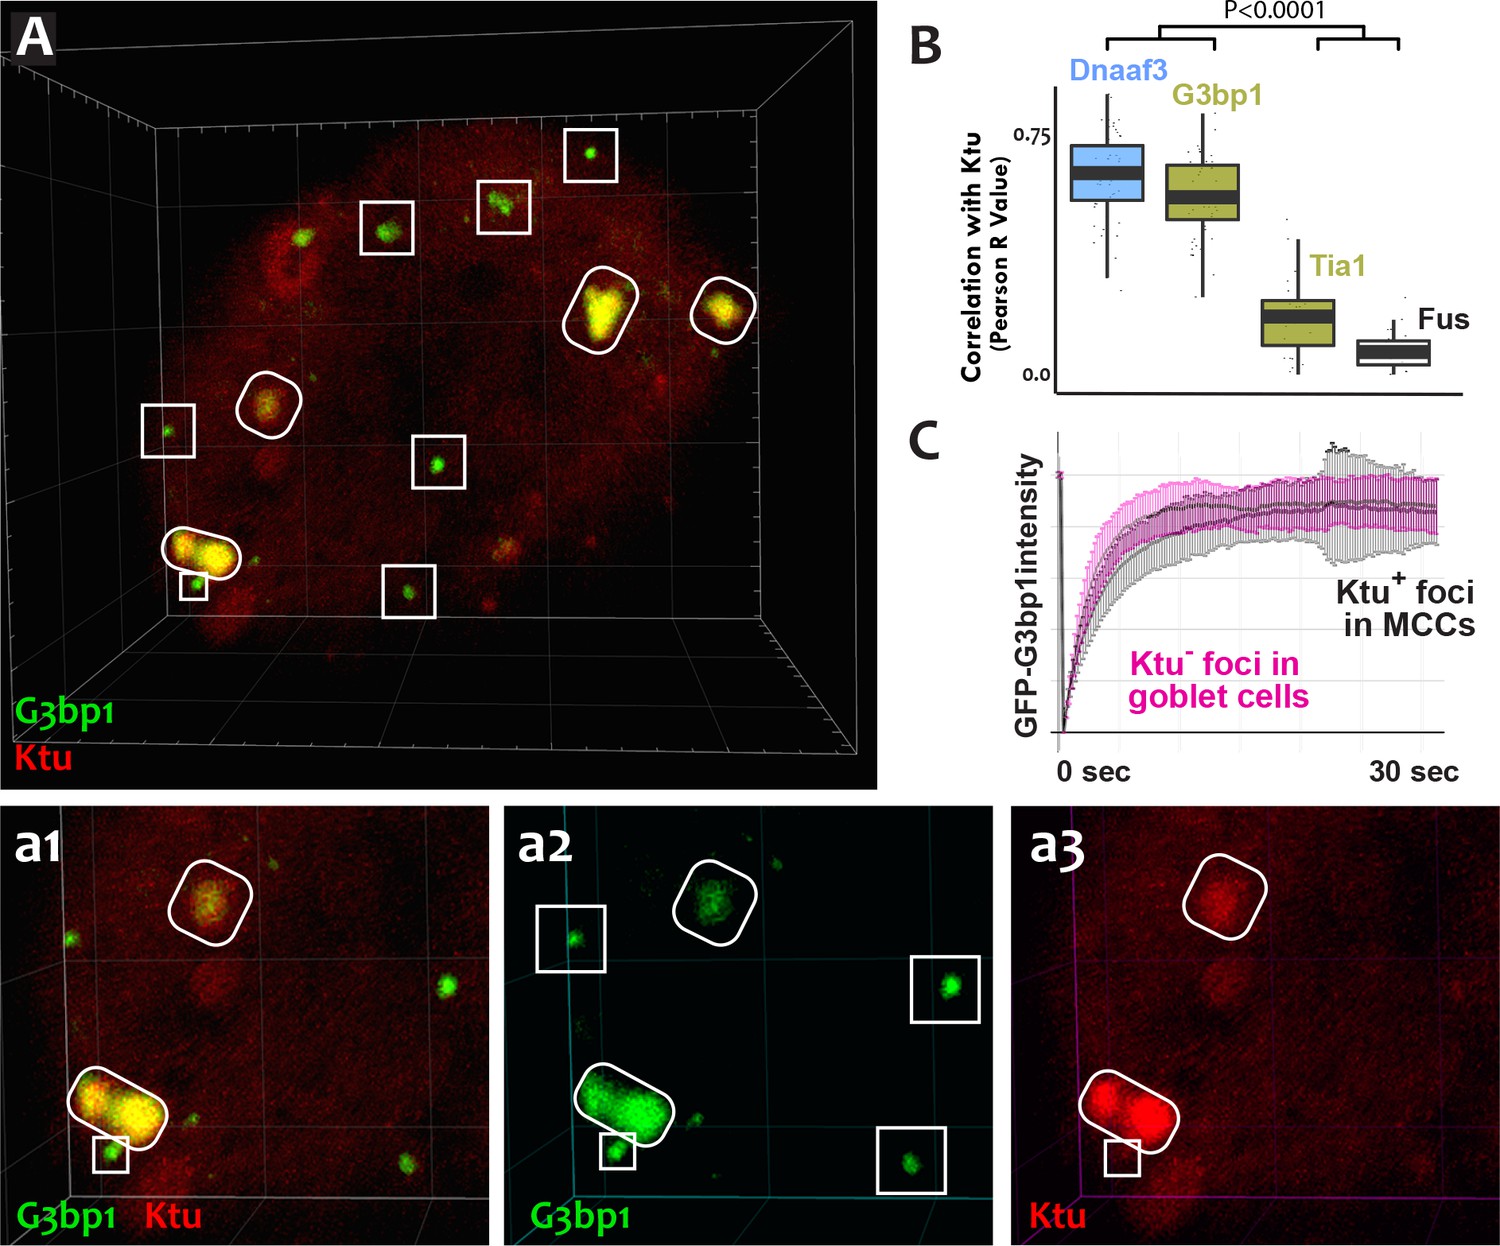
DynAPs share molecular and physical properties with stress granules.
(A) GFP-G3bp1 strongly co-localizes with DNAAFs in DynAPs (ovals), but also labels smaller foci that do not contain DNAAFs (boxes). (a1–a3) Higher magnification views of the bottom left corner of the MCC shown in panel A. (B) Quantification of co-localization relative to mCherry-Ktu (Dnaaf4 and Fus data from Figure 1 are recapitulated here for comparison). (C) FRAP kinetics of GFP-G3bp1 in Ktu-positive DynAPs (black) in MCCs and in Ktu-negative foci in neighboring goblet cells (pink). p < 0.0001 by one-way ANOVA and post-hoc Tukey-Kramer HSD test. n-values for each FRAP experiment can be found in Table 2.
-
Figure 6—source data 1
Data for GFP-G3bp1 FRAP experiments presented in Figure 6C.
- https://doi.org/10.7554/eLife.38497.022
Figure 7
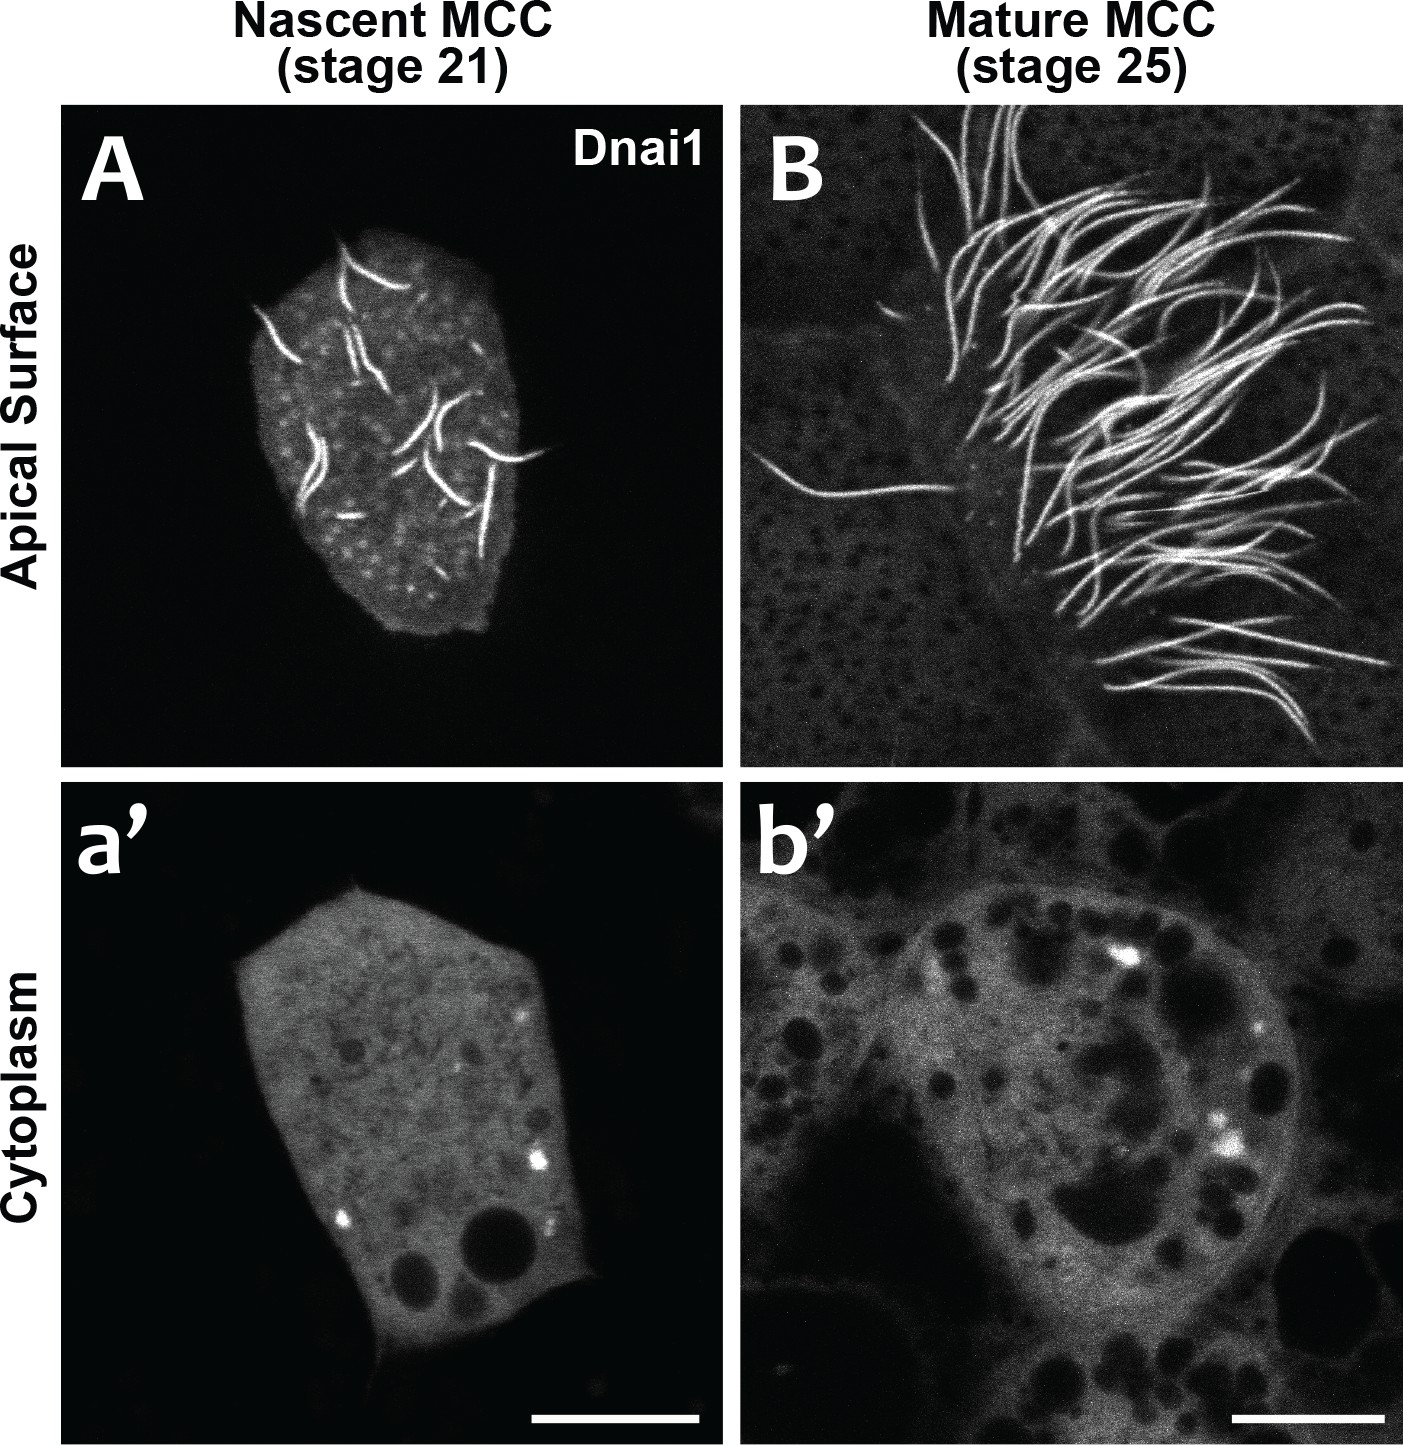
DynAPs are present in nascent MCCs during ciliogenesis.
(A) GFP-Dnai1 labels the short, still-growing axonemes during MCC ciliogenesis at stage 21. (B) GFP-Dnai1 also labels the longer, mature axonemes at stage 25. (a', b') GFP-Dnai1 labeled DynAPs are present in the cytoplasm at both stages. Scale bars = 10 um.
Figure 8 with 1 supplement
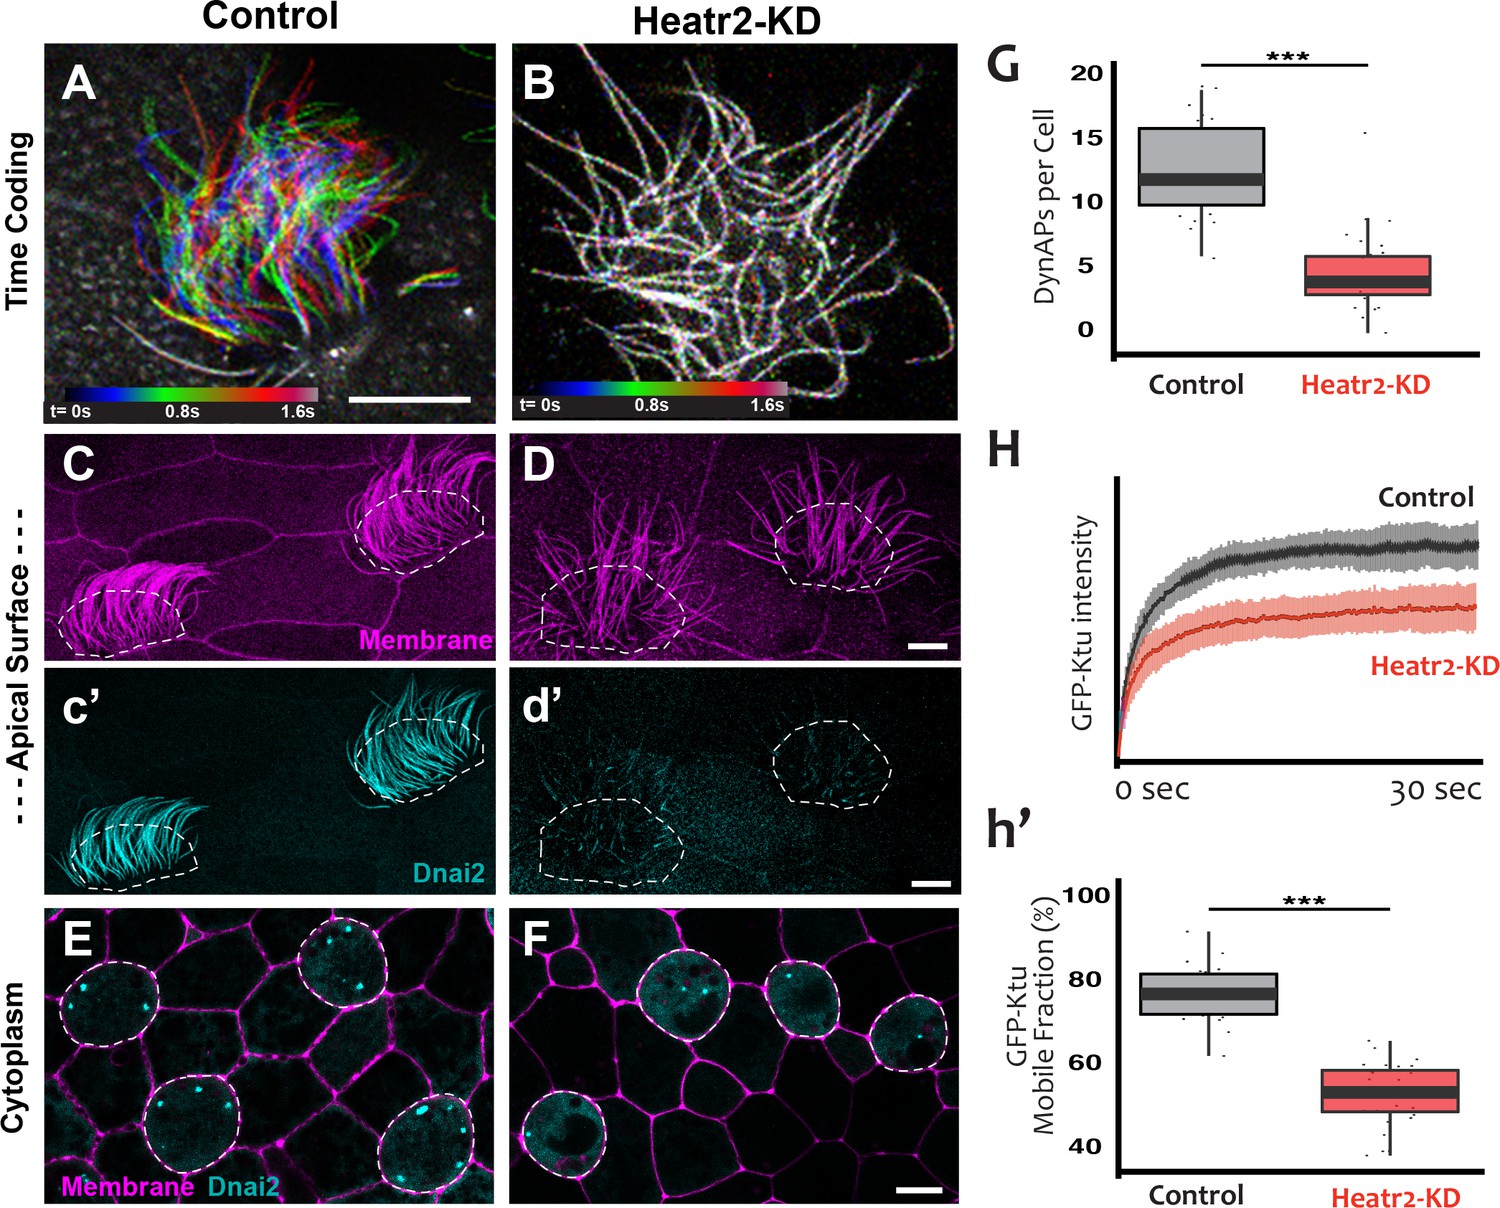
Loss of Heatr2 disrupts formation of DynAPs and alters the liquid-like behavior of Ktu.
(A) Color-based time coding of a high-speed time-lapse movie of an MCC; Successive frames of the movie are color coded as indicated in the time key and overlaid; distinct colors in the overlay reveals ciliary movement. (B) Similar time-coding of an MCC after Heatr2-KD; the lack of color reflects the absence of ciliary movement between frames in the movie. (C) Membrane labeling with CAAX-RFP (pink) reveals normal cilia morphology in control MCCs (an projection of the confocal optical slices specifically through the apical surface is shown with; dashed lines indicate MCCs. (c’) Labelling with GFP-Dnai2 reveals normal localization to the motile axonemes shown in panel C. (D) Membrane labeling reveals normal morphology of motile cilia in MCCs after Heatr2 KD. (d’) GFP-Dnai2 is lost from the motile cilia shown in panel D. (E) Dnai2 is present in DynAPs visible in an en face projection through the cytoplasm of control MCCs (indicated by dashed lines). (F) Despite loss from motile axonemes, Dnai2 remains localized to DynAps in the cytoplasm of MCCs after Heatr2 knockdown. (G) Despite the presence of DynAPs in Heatr2-KD MCCs, the number of foci in these cells is significantly reduced relative to wild-type MCCs. p = 1.27 × 10 −10 by two-sample t-test (n = 25 wild-type cells, 26 Heatr2-KD cells across two experiments, three embryos each). (H, h’) FRAP reveals that Heatr2 knockdown significantly impairs the mobility of GFP-Ktu in DynAPs. Control vs. Heatr2-KD GFP-Ktu mobile fraction, p < 2.2 × 10 −16 by two-sample t-test (n = 25 vs. 31 observations, each in independent cells across three experiments, three embryos each). Scale bars 10 µm.
-
Figure 8—source data 1
GFP-Ktu foci counts for WT and Heatr2-MO (Set #1) MCCs.
- https://doi.org/10.7554/eLife.38497.026
-
Figure 8—source data 2
Kinetic data for GFP-Ktu FRAP experiments in WT and Heatr2-MO MCCs.
- https://doi.org/10.7554/eLife.38497.027
-
Figure 8—source data 3
GFP-Ktu foci counts for WT and Heatr2-MO (Set #2) MCCs.
- https://doi.org/10.7554/eLife.38497.028
Figure 8—figure supplement 1
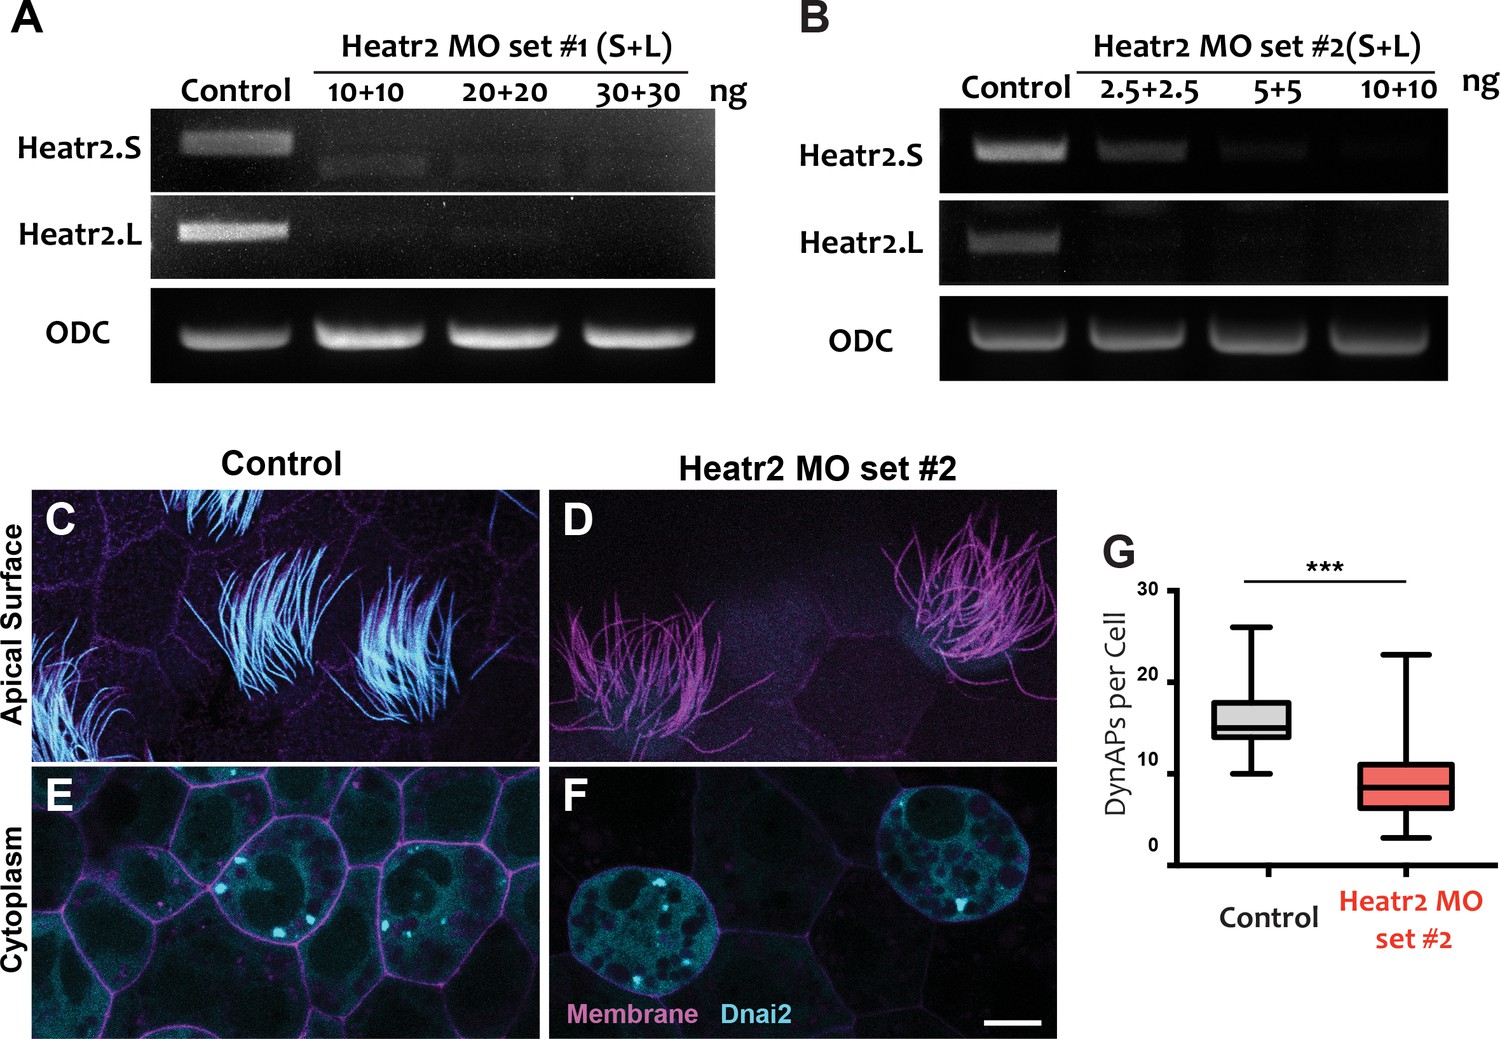
MOs targeting a distinct splice sites in heatr2 elicited defects in dynein delivery to axonemes and DynAP assembly.
(A-B) RT-PCR shows effective disruption of splicing by injection of a combination of Heatr2-MO targeting the long and short (L and S) alloalleles of Heatr2 in the allotetraploid genome of Xenopus laevis. MO set #1 (A), MO set #2 (B). (C–D) Apical surface views of MCCs labeled with CAAX-RFP. GFP-Dnai2 reveals normal localization to the motile axonemes in control (C), while GFP-Dnai2 is lost from the motile cilia after Heatr2 KD by MO set #2 (D). (E–F) DynAPs labeled with GFP-Dnai2 are visible in an en face projection through the cytoplasm of control MCCs(E) and Heatr2-KD MCC(F). Scale bar = 10 µm. (G) The number of foci in Heatr2-KD MCC by MO set #2 is significantly reduced relative to wild-type MCCs. (p < 0.0001, n = 32 for each across two experiments, three embryos each).
Videos
Video 1
DynAPs form specifically in the cytoplasm of multiciliated cells.
This annotated movie shows a rotating nearest-point projection of a 3D confocal stack of a section of mucociliary epithelium labeled by expression of membrane-RFP (red) and GFP-Ktu (green).
Video 2
Endogenous Ruvbl2 is present in DynAPs specifically in the cytoplasm of multiciliated cells.
This annotated movie shows a rotating maximum intensity projection of a 3D confocal stack of a section of mucociliary epithelium labeled by immunostaining for acetylated tubulin to label cilia (red) and Ruvbl2 (green). Note that the contrast levels in this projection obscure the smaller Ruvbl2 foci present in both MCCs and gobelt cells (see Figure 1—figure supplement 5).
Video 3
Liquid-like fission and fusion of a single DynAP.
This non-annotated movie shows smoothened data from a time-lapse movie of a single Heatr2-labeled DynAP. Stills from this movie are presented in Figure 4A.
Tables
Table 1
List of proteins investigated in this study, their functions, and their localization.
https://doi.org/10.7554/eLife.38497.011| Protein | Localization | Function | |
|---|---|---|---|
| Ciliopathy Associated DNAAFs | Ktu (Dnaaf2) | DynAPs | DNAAF |
| Dnaaf3 | DynAPs | DNAAF | |
| Dyx1C1(Dnnaf4) | DynAPs | DNAAF | |
| Heatr2 (Dnaaf5) | DynAPs | DNAAF | |
| Lrrc6 | DynAPs | DNAAF | |
| Zmynd10 | DynAPs | DNAAF | |
| Spag1 | DynAPs | DNAAF | |
| Pih1d3 | DynAPs | DNAAF | |
| C21orf59 | DynAPs | DNAAF | |
| Dynein Arm Subunits | Dnai1 | DynAPs | Outer Dynein Arm |
| Dnai2 | DynAPs | Outer Dynein Arm | |
| DnaL1 | DynAPs | Outer Dynein Arm | |
| Dnal4 | DynAPs | Outer Dynein Arm | |
| Dnali1 | DynAPs | Inner Dynein Arm | |
| Wdr78 | DynAPs | Inner Dynein Arm | |
| Hsp Family Chaperone-Related | Hsp90ab1 | DynAPs | Hsp90 Chaperone |
| Hspa8 | DynAPs | Hsp70 Chaperone | |
| Ruvbl1 (Pontin) | DynAPs | Hsp90 Co-chaperone (R2TP) | |
| Ruvbl2 (Reptin) | DynAPs | Hsp90 Co-chaperone (R2TP) | |
| DnajC7 (Ttc2) | DynAPs | Hsp70 Co-chaperone | |
| Stip1 (Hop) | DynAPs | Hsp70 Co-chaperone | |
| Ttc9c | DynAPs | Hsp Co-chaperone | |
| Other MCC-Related | Centrin4 | Baseal Bodies | Basal Bodies |
| Ccdc63 | Other foci | Deuterosome marker | |
| Mns1 | Baseal Bodies | Docking complex-related | |
| Armc4 | Axeoneme | Docking complex-related | |
| Ttc25 | Cytosol | Docking complex-related | |
| Rsph1 | Cytosol | Radial Spoke | |
| Nme5 | Cytosol | Radial Spoke | |
| Known Foci-Forming | Dcp1a | Other foci | P-body marker |
| Lsm4 | Other foci | P-body marker | |
| Fus | Nuclear foci | Known foci forming | |
| Tia1(Tiar) | Other foci | Stress granule marker | |
| G3bp1 | DynAPs (+other foci) | Stress granule marker | |
| Other Organelles | GalT | Golgi | |
| EEA1 | Other foci |
Table 2
FRAP data for all tested proteins.
https://doi.org/10.7554/eLife.38497.018| Protein | Mobile fraction (%) | N | |
|---|---|---|---|
| Total Bleach | Ktu | 77.38 ± 6.63 | 25 |
| Dnaaf3 | 77.57 ± 6.64 | 6 | |
| Dnaaf4 | 61.64 ± 10.01 | 14 | |
| heatr2 | 60.71 ± 6.02 | 14 | |
| Lrrc6 | 58.53 ± 10.75 | 32 | |
| Pih1d3 | 61.66 ± 7.14 | 7 | |
| Ruvbl2 | 61.82 ± 7.14 | 13 | |
| Hsp90ab1 | 54.60 ± 2.89 | 4 | |
| Hspa8 | 74.00 ± 9.67 | 16 | |
| Dnai1 | 25.15 ± 5.76 | 13 | |
| Dnai2 | 16.88 ± 5.75 | 13 | |
| Dnali1 | 22.02 ± 5.71 | 5 | |
| G3bp1 (DynAP) | 84.11 ± 6.43 | 11 | |
| G3bp1(SG) | 83.93 ± 11.08 | 11 | |
| Partial Bleach | Ktu | 66.66 ± 8.43 | 13 |
| Ruvbl2 | 55.20 ± 9.59 | 4 | |
| Dnai2 | 20.10 ± 9.77 | 7 | |
| G3bp1 (DynAP) | 74.83 ± 12.26 | 12 | |
| G3bp1(SG) | 88.95 ± 10.06 | 6 |
Additional files
-
Transparent reporting form
- https://doi.org/10.7554/eLife.38497.029
Download links
A two-part list of links to download the article, or parts of the article, in various formats.
Downloads (link to download the article as PDF)
Open citations (links to open the citations from this article in various online reference manager services)
Cite this article (links to download the citations from this article in formats compatible with various reference manager tools)
A liquid-like organelle at the root of motile ciliopathy
eLife 7:e38497.
https://doi.org/10.7554/eLife.38497


