Spatial patterning of liver progenitor cell differentiation mediated by cellular contractility and Notch signaling
- University of Illinois at Urbana-Champaign, United States
Figures
Figure 1 with 3 supplements
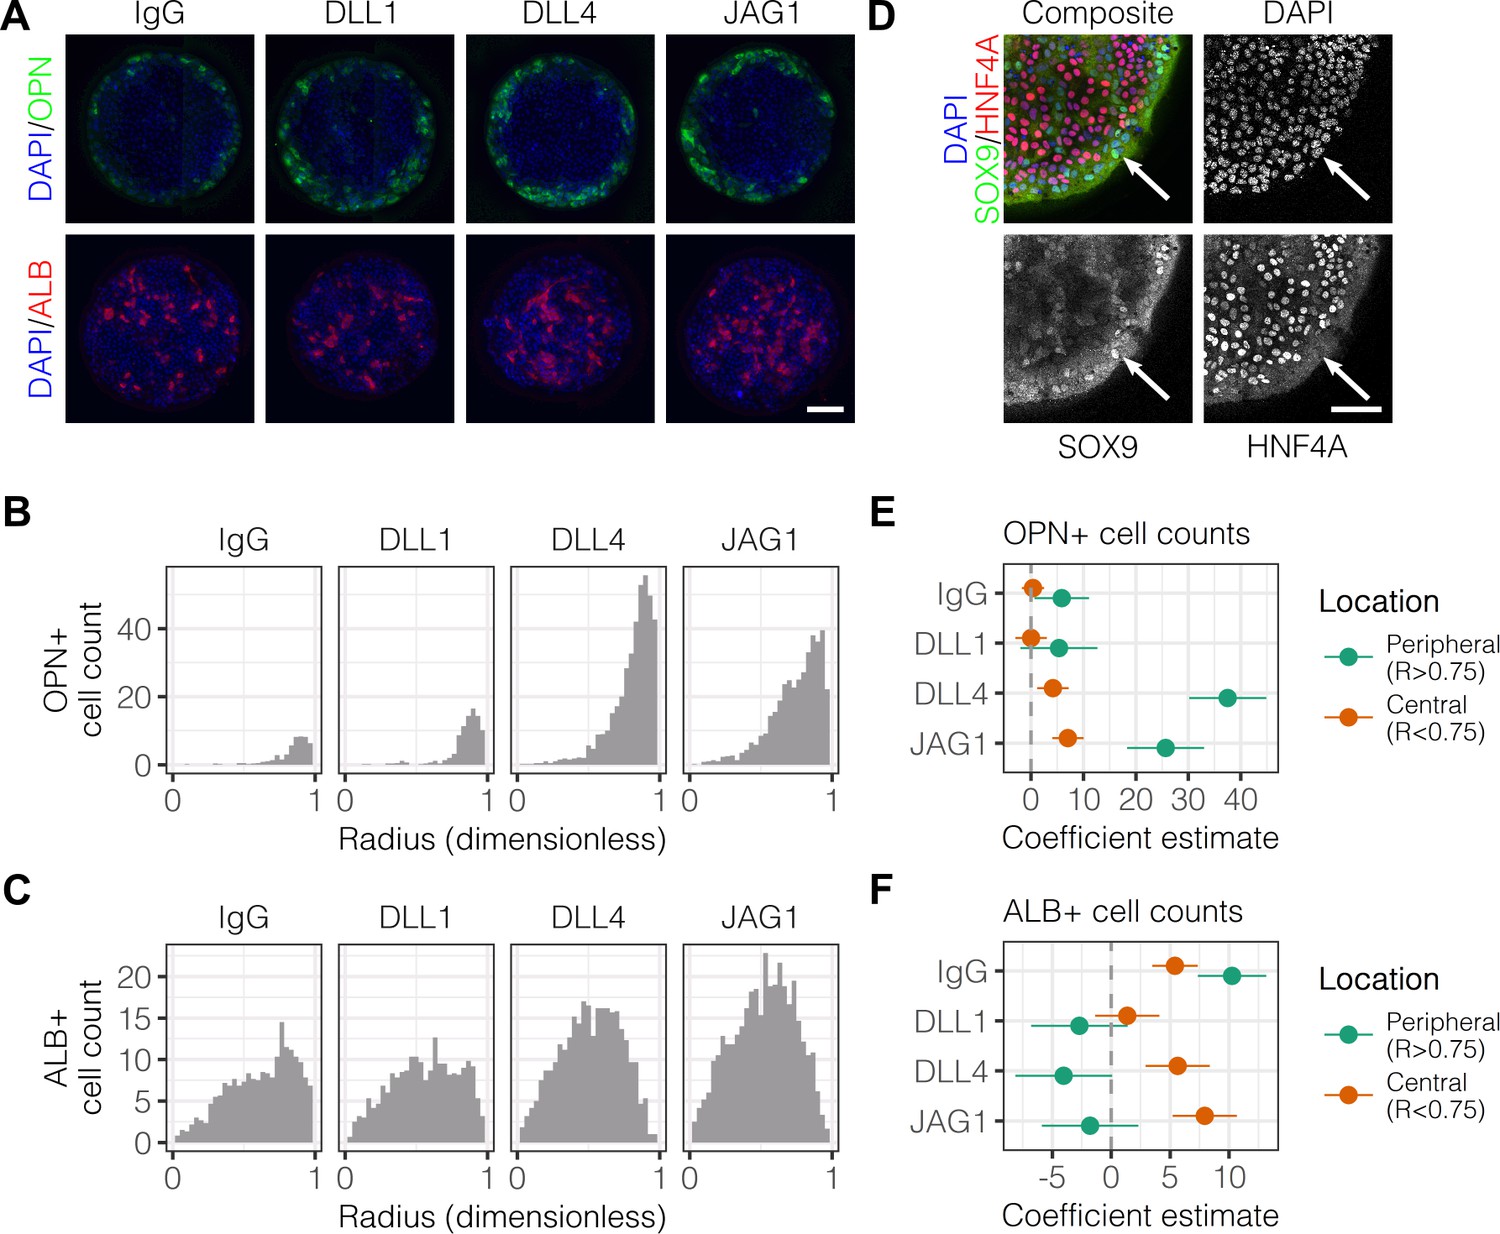
Localized differentiation of liver progenitors in arrayed patterns.
(A) Immunolabeling of BMEL cells for the biliary marker OPN and hepatocyte marker ALB on arrayed collagen I patterns with control IgG or Fc-recombinant Notch ligands DLL1, DLL4, and JAG1. (B) Quantification of OPN+ cell counts as a function of radial distance from the centroid of each island. (C) Quantification of ALB+ cell counts as a function of radial distance from the centroid of each island. (D) Immunolabeling of BMEL cells presented with DLL4 for the biliary transcription factor SOX9 and hepatocyte transcription factor HNF4A. Arrow in each image indicates the same SOX9+/HNF4A− cell. Scale bar indicates 75 µm. (E, F) Regression analysis of OPN+ and ALB+ cell counts. Data in Figure 1B and Figure 1C were separated into peripheral and central subsets for which dimensionless radius was greater than 0.75 () and less than 0.75 (). Separate multiple regression models were generated for each data subset for which coefficient estimates (corresponding to mean change in cell counts) and 95% CI were plotted for OPN+ (E) and ALB+ (F) cells. For each factor, 95% CI that do not intersect with the dashed line indicate regression coefficient estimates for which . (A, E) Scale bars indicate 150 µm.
-
Figure 1—source data 1
Summary table for OPN data in Figure 1B.
- https://doi.org/10.7554/eLife.38536.007
-
Figure 1—source data 2
Summary table for ALB data in Figure 1C.
- https://doi.org/10.7554/eLife.38536.008
Figure 1—figure supplement 1
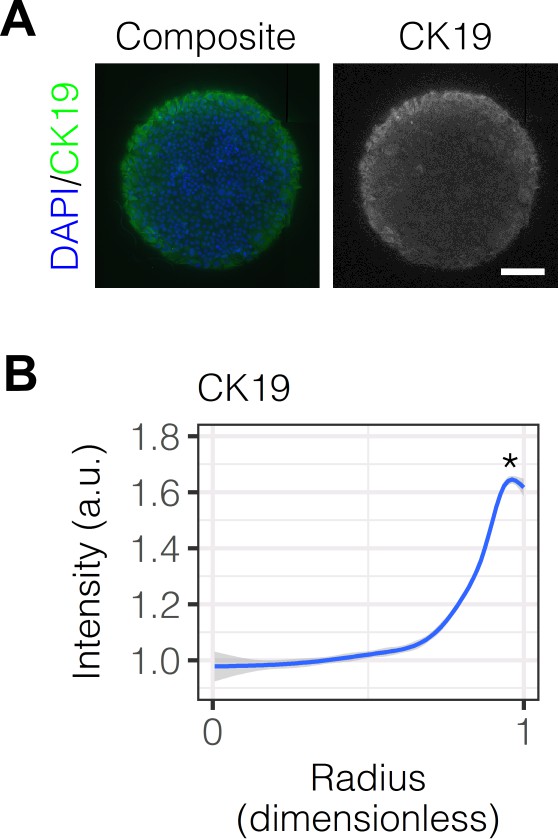
Immunolabeling and quantification of CK19.
(A) Immunolabeling of BMEL cells presented with IgG for the biliary marker CK19. (B) Quantification of CK19 intensity in BMEL cells presented with IgG as a function of radial distance from the centroid of each island. Asterisk (*) indicates for peak intensity () compared with central intensity () using Welch’s t-test.
Figure 1—figure supplement 2

Immunolabeling of OPN and CK19 at and cell density with radius at .
(A) Immunolabeling at of BMEL cells on 30 kPa substrates presented with IgG and DLL4 for the biliary markers OPN and CK19. Scale bar indicates 75 µm. (B) Measurement of cell density with radius for 30 kPa and 4 kPa substrates at . Vertical black bars indicate computed mean radius using the most central 95% of cells within the data set.
Figure 1—figure supplement 3
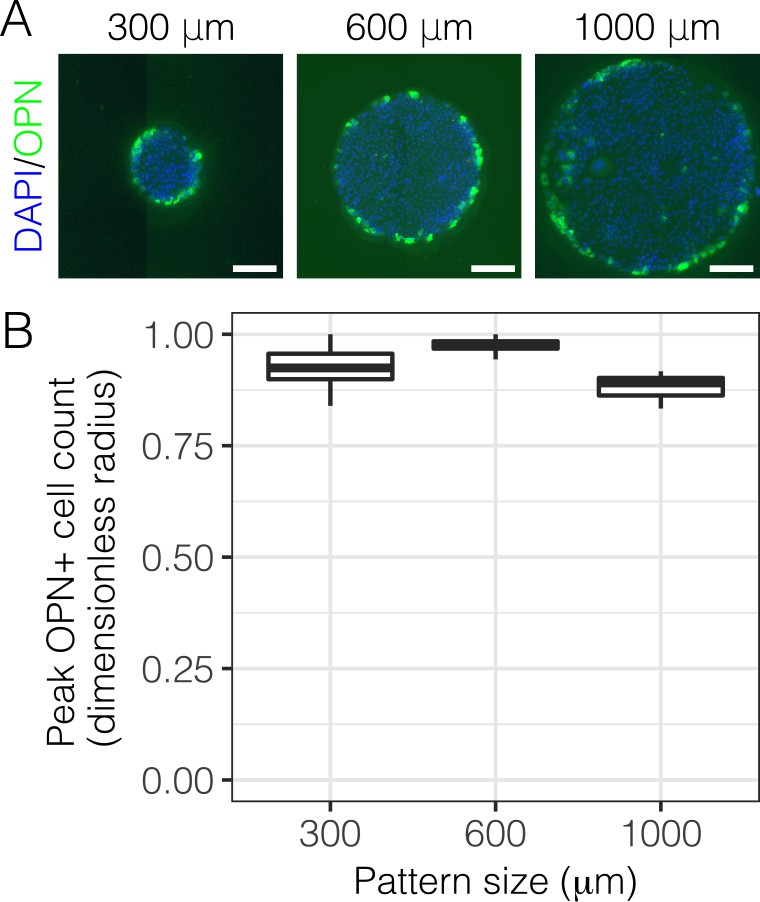
Immunolabeling for OPN with 300, 600, and 1000 µm diameter patterns.
(A) Immunolabeling for OPN of BMEL cells presented with DLL4 on 30 kPa substrates at . Both 300 µm and 1000 µm pattern diameters were included in this experiment in addition to the 600 µm pattern diameter. Scale bars indicate 150 µm. (B) Quantification of peak OPN+ cell counts for 300, 600, and 1000 µm diameter pattern. Boxplots show median, 25th and 75th percentiles (hinges), and 1.5 IQR (whiskers).
Figure 2 with 3 supplements

Peripheral biliary differentiation is dependent on both Notch signaling and substrate stiffness.
(A) Immunolabeling for OPN of BMEL cells presented with DLL4 on 30 kPa and 4 kPa substrates. Cells were treated with vehicle control (DMSO) or an inhibitor of Notch signaling (-secretase inhibitor X, GSI, 5 µM). (B) Quantification of OPN+ cell counts on 30 kPa and 4 kPa substrates after treatment with DMSO or GSI. (C) Immunolabeling for SOX9 and HNF4A of BMEL cells on 30 kPa and 4 kPa substrates. (D) Quantification of SOX9 and HNF4A intensity on 30 kPa and 4 kPa substrates. (E) RNA in situ hybridization for Jag1, Dll1, and Notch2 on 30 kPa and 4 kPa substrates. Cells were exogenously presented with IgG or DLL4. (A, C, E) Scale bars indicate 150 µm. (B, D) Mean ± 95% CI.
-
Figure 2—source data 1
Summary table for OPN data in Figure 2B and Figure 2—figure supplement 1.
- https://doi.org/10.7554/eLife.38536.013
-
Figure 2—source data 2
Summary table for SOX9 and HNF4A data in Figure 2D.
- https://doi.org/10.7554/eLife.38536.014
Figure 2—figure supplement 1
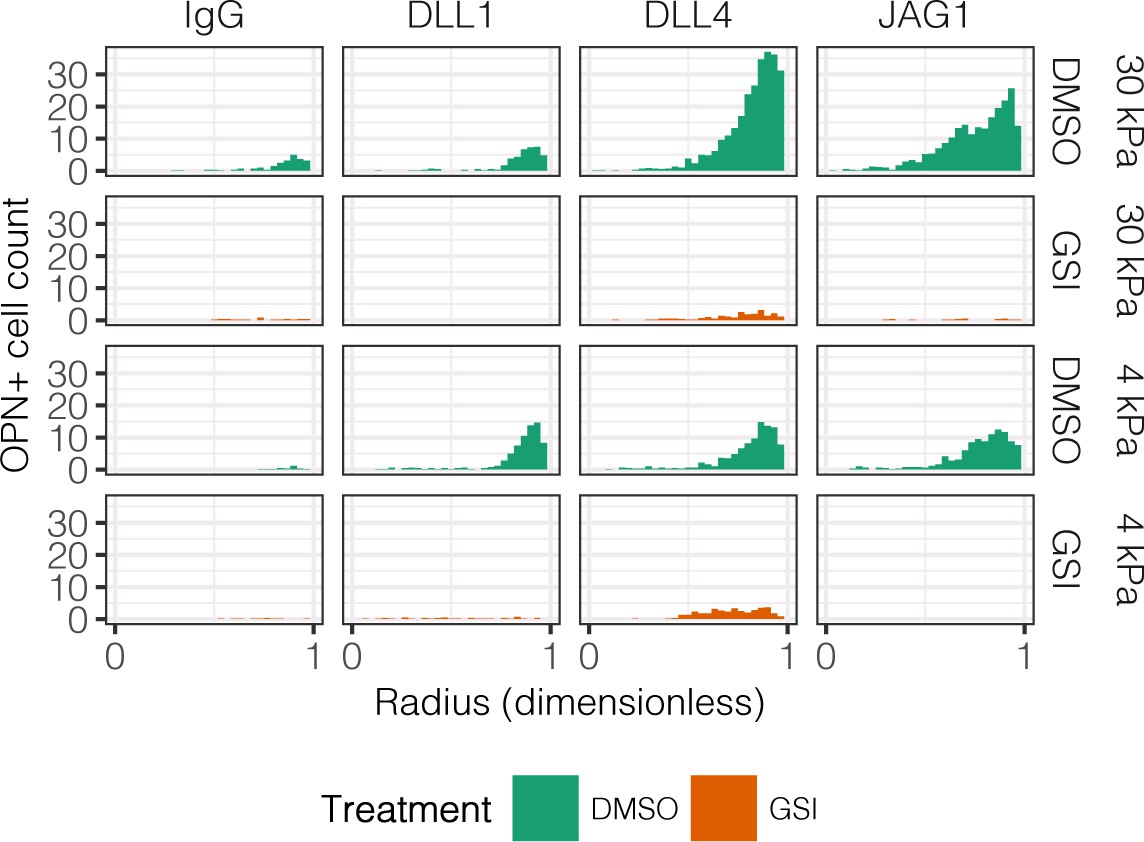
Quantification of OPN+ cell counts in arrayed patterns.
Cells were cultured on 30 kPa and 4 kPa substrates and presented with IgG, DLL1, DLL4, and JAG1. Treatments included vehicle control (DMSO) or an inhibitor of Notch signaling (-secretase inhibitor X, GSI, 5 µM).
Figure 2—figure supplement 2

Regression analysis of OPN+ and ALB+ cell counts.
Data in Figure 2B were separated into peripheral and central subsets for which dimensionless radius was greater than 0.75 () and less than 0.75 (). Separate multiple regression models were generated for each data subset for which coefficient estimates (corresponding to mean change in cell counts) and 95% CI were plotted for OPN+ (A) and ALB+ (B) cells. For each factor, 95% CI that do not intersect with the dashed line indicate regression coefficient estimates for which . Cells were cultured on 30 kPa and 4 kPa substrates and presented with IgG, DLL1, DLL4, and JAG1. Treatments included vehicle control (DMSO) or an inhibitor of Notch signaling (-secretase inhibitor X, GSI, 5 µM).
Figure 2—figure supplement 3
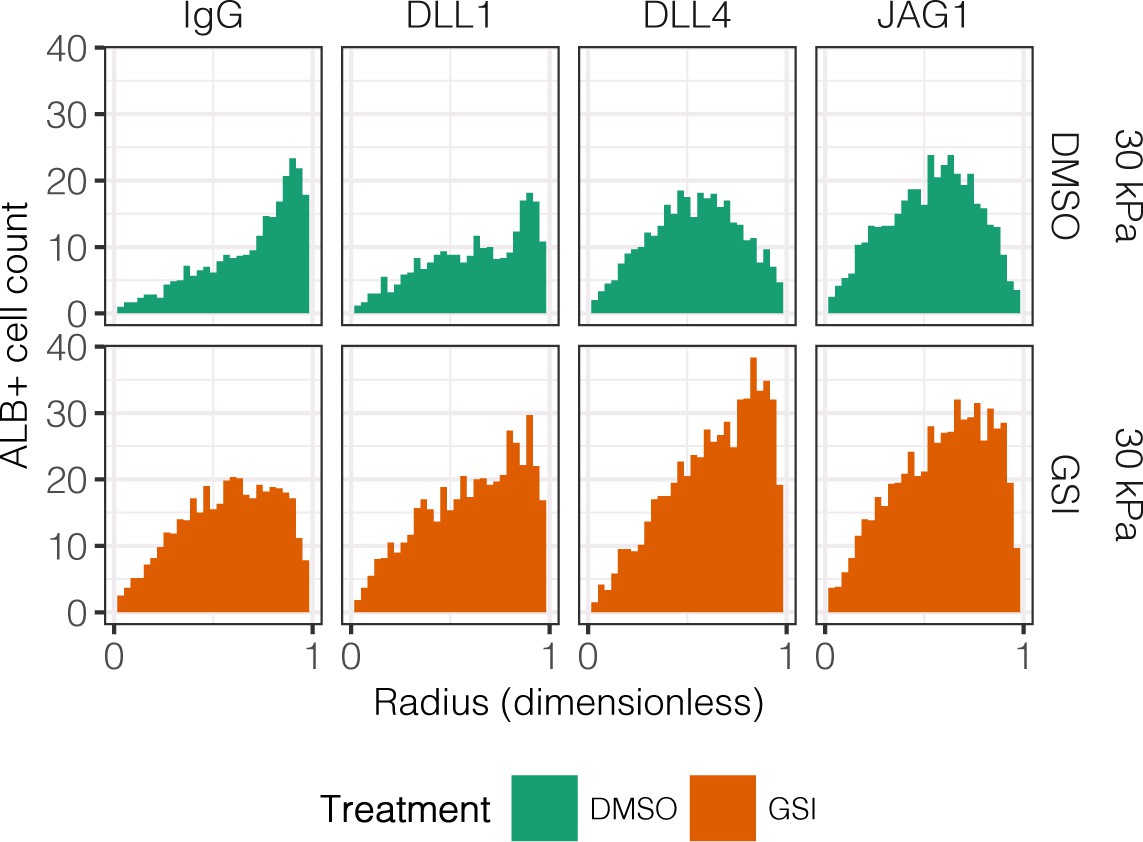
Quantification of ALB+ cell counts in arrayed patterns.
Cells were cultured on 30 kPa substrates and presented with IgG, DLL1, DLL4, and JAG1. Treatments included vehicle control (DMSO) or an inhibitor of Notch signaling (-secretase inhibitor X, GSI, 5 µM).
Figure 3 with 2 supplements
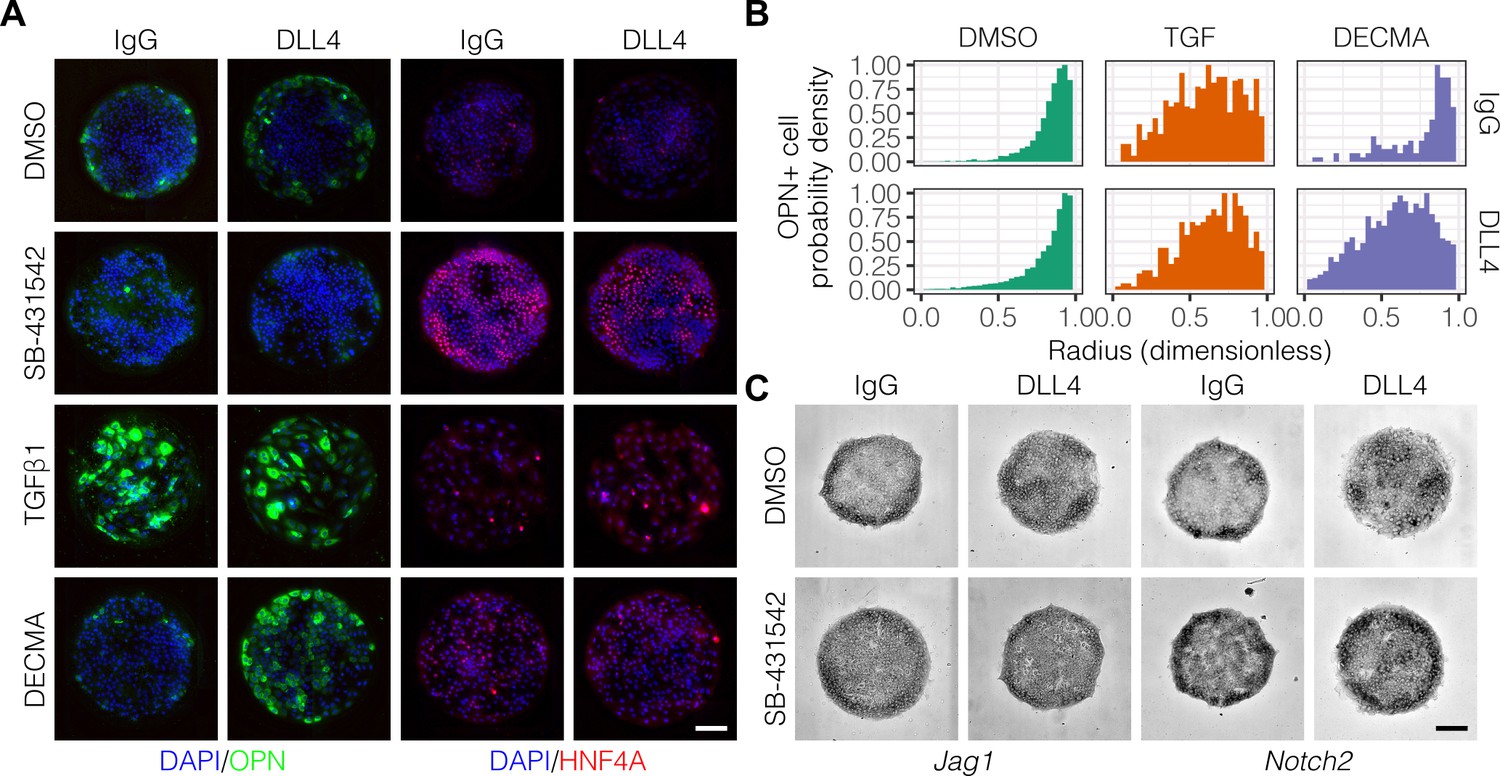
TGFβ signaling and cell–cell interaction strength modulate pattern formation.
(A) Immunolabeling for OPN and HNF4A of BMEL cells presented with IgG and DLL4 on 30 kPa substrates. Cultures were treated with vehicle control (DMSO), inhibitor of TGFβ signaling (SB-431542, 10 µm), TGFβ1 (1.5 ng/ml), or functional anti-E-cadherin (DECMA, 10 µg/ml). (B) Quantification of OPN+ cell probability density distributions after treatment with DMSO, TGFβ1, or DECMA. (C) RNA in situ hybridization for Jag1 and Notch2 of cells exogenously presented with IgG or DLL4 and treated with DMSO or SB-431542. (A, C) Scale bars indicate 150 µm.
-
Figure 3—source data 1
Summary table for OPN+ probability density data in Figure 3B.
- https://doi.org/10.7554/eLife.38536.029
Figure 3—figure supplement 1

Quantification of OPN+ cell counts and HNF4A intensity with SB-431542 and DECMA treatment.
(A) Quantification of OPN+ cell counts on 30 kPa substrates presented with DLL4 after treatment with vehicle control (DMSO) or inhibitor of TGFβ signaling (SB-431542, 10 µm). (B) Quantification of HNF4A intensity of cells on 30 kPa substrates after treatment with DMSO, SB-431542, or functional anti-E-cadherin (DECMA, 10 µg/ml). (A, B) Mean ± 95% CI.
Figure 3—figure supplement 2

TGFβ1 induces Notch ligand and receptor expression uniformly.
BMEL cells were cultured on 30 kPa substrates, presented with IgG or DLL4, and treated with TGFβ1 (1.5 ng/ml). Scale bar is 150 µm.
Figure 4 with 2 supplements
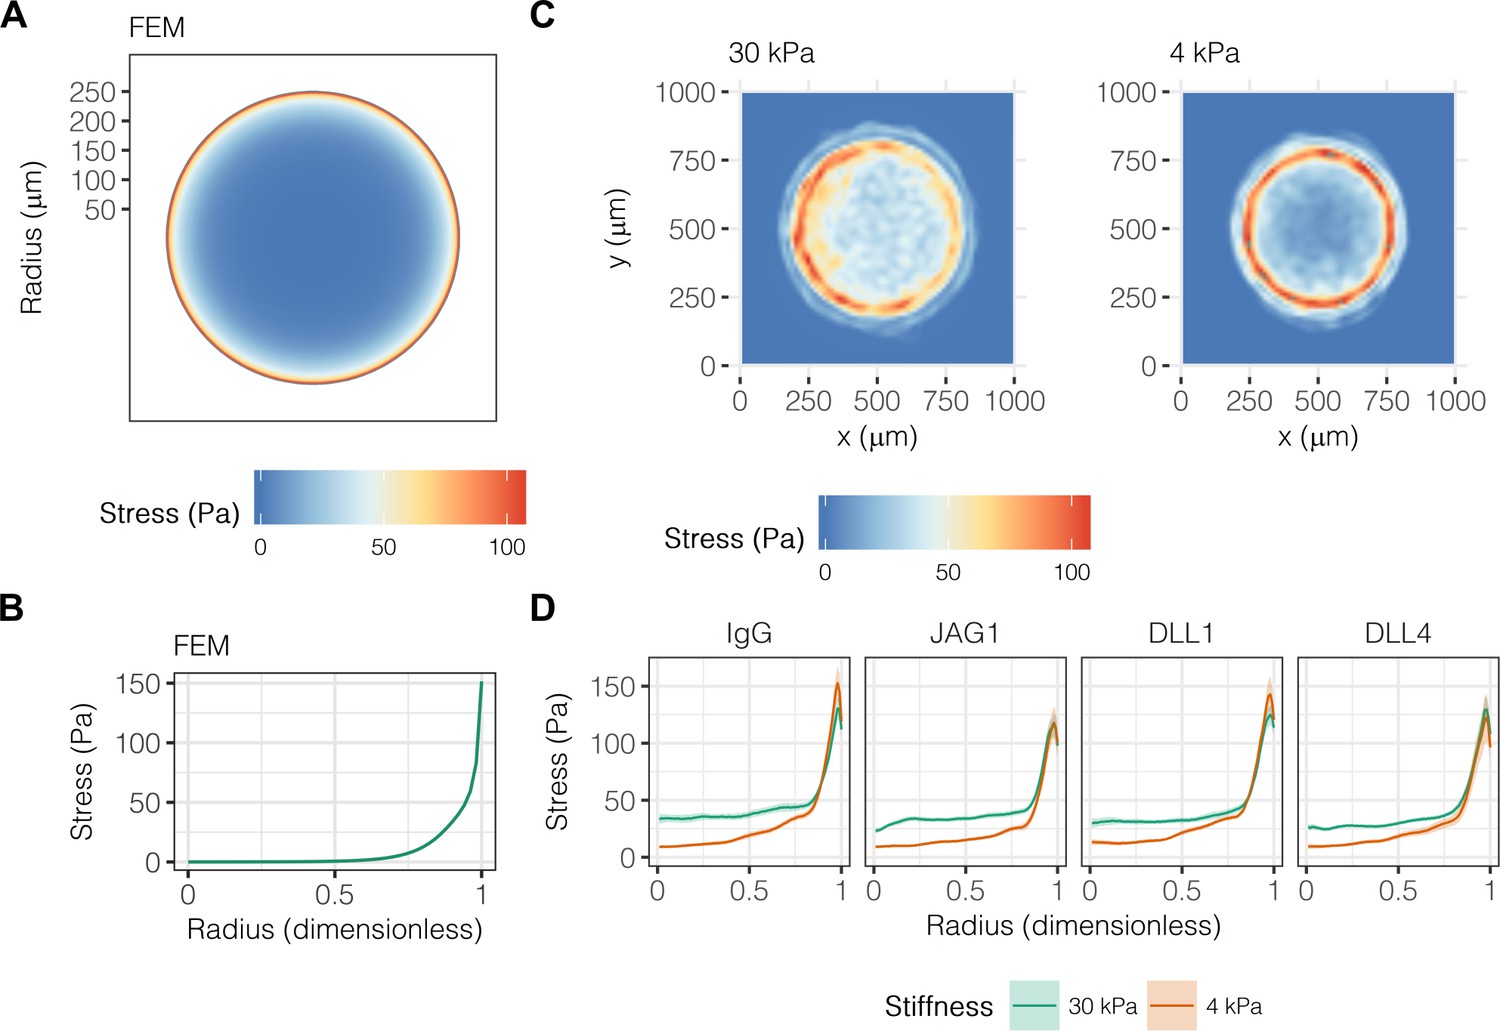
Liver progenitors in arrayed patterns generate gradients of traction stress independent of ligand presentation.
(A) Simulated finite element modeling (FEM) stress profile of arrayed patterns. (B) Stress from FEM as a function of radius. (C) Experimental stress profiles obtained by traction force microscopy (TFM) of BMEL cells on 30 kPa and 4 kPa substrates presented with DLL4. (D) Stress from TFM as a function of radius, substrate stiffness (30 kPa and 4 kPa), and ligand (IgG, JAG1, DLL1, DLL4). Mean ± 95% CI.
Figure 4—figure supplement 1
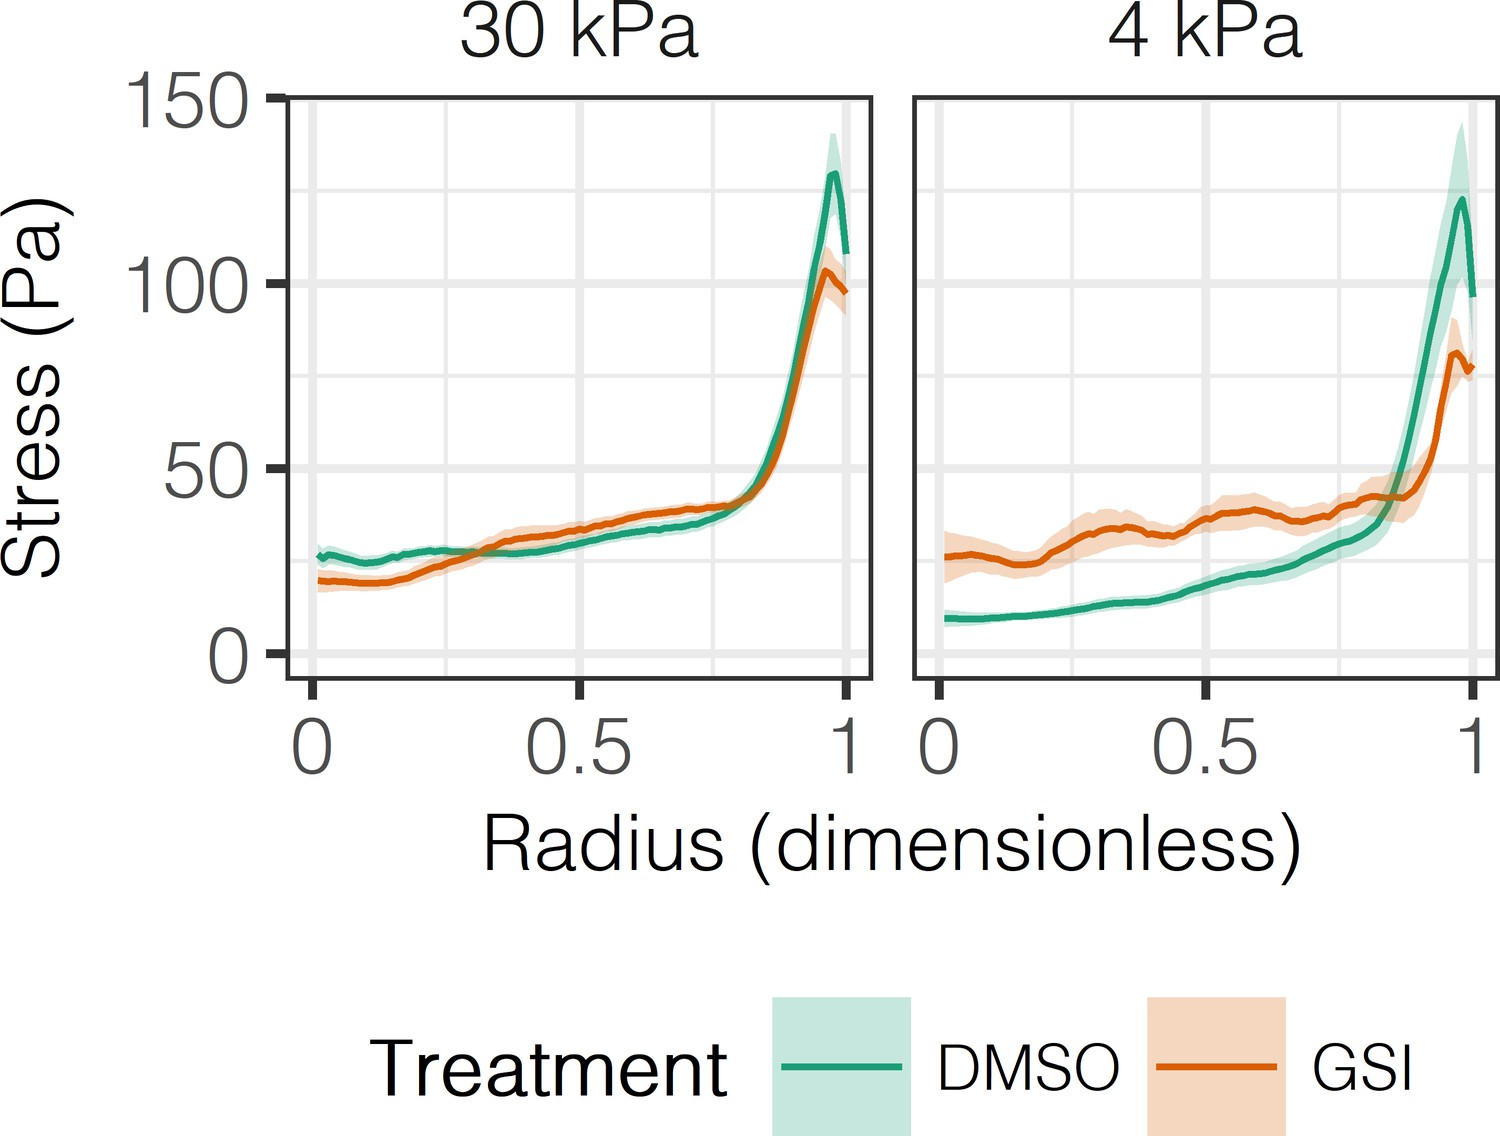
Effect of Notch inhibition on experimental stress profiles.
Experimental stress profiles were obtained by TFM of BMEL cells presented with DLL4 on 30 kPa and 4 kPa substrates and treated with vehicle control (DMSO) or GSI (10 µM). Mean ± 95% CI.
Figure 4—figure supplement 2
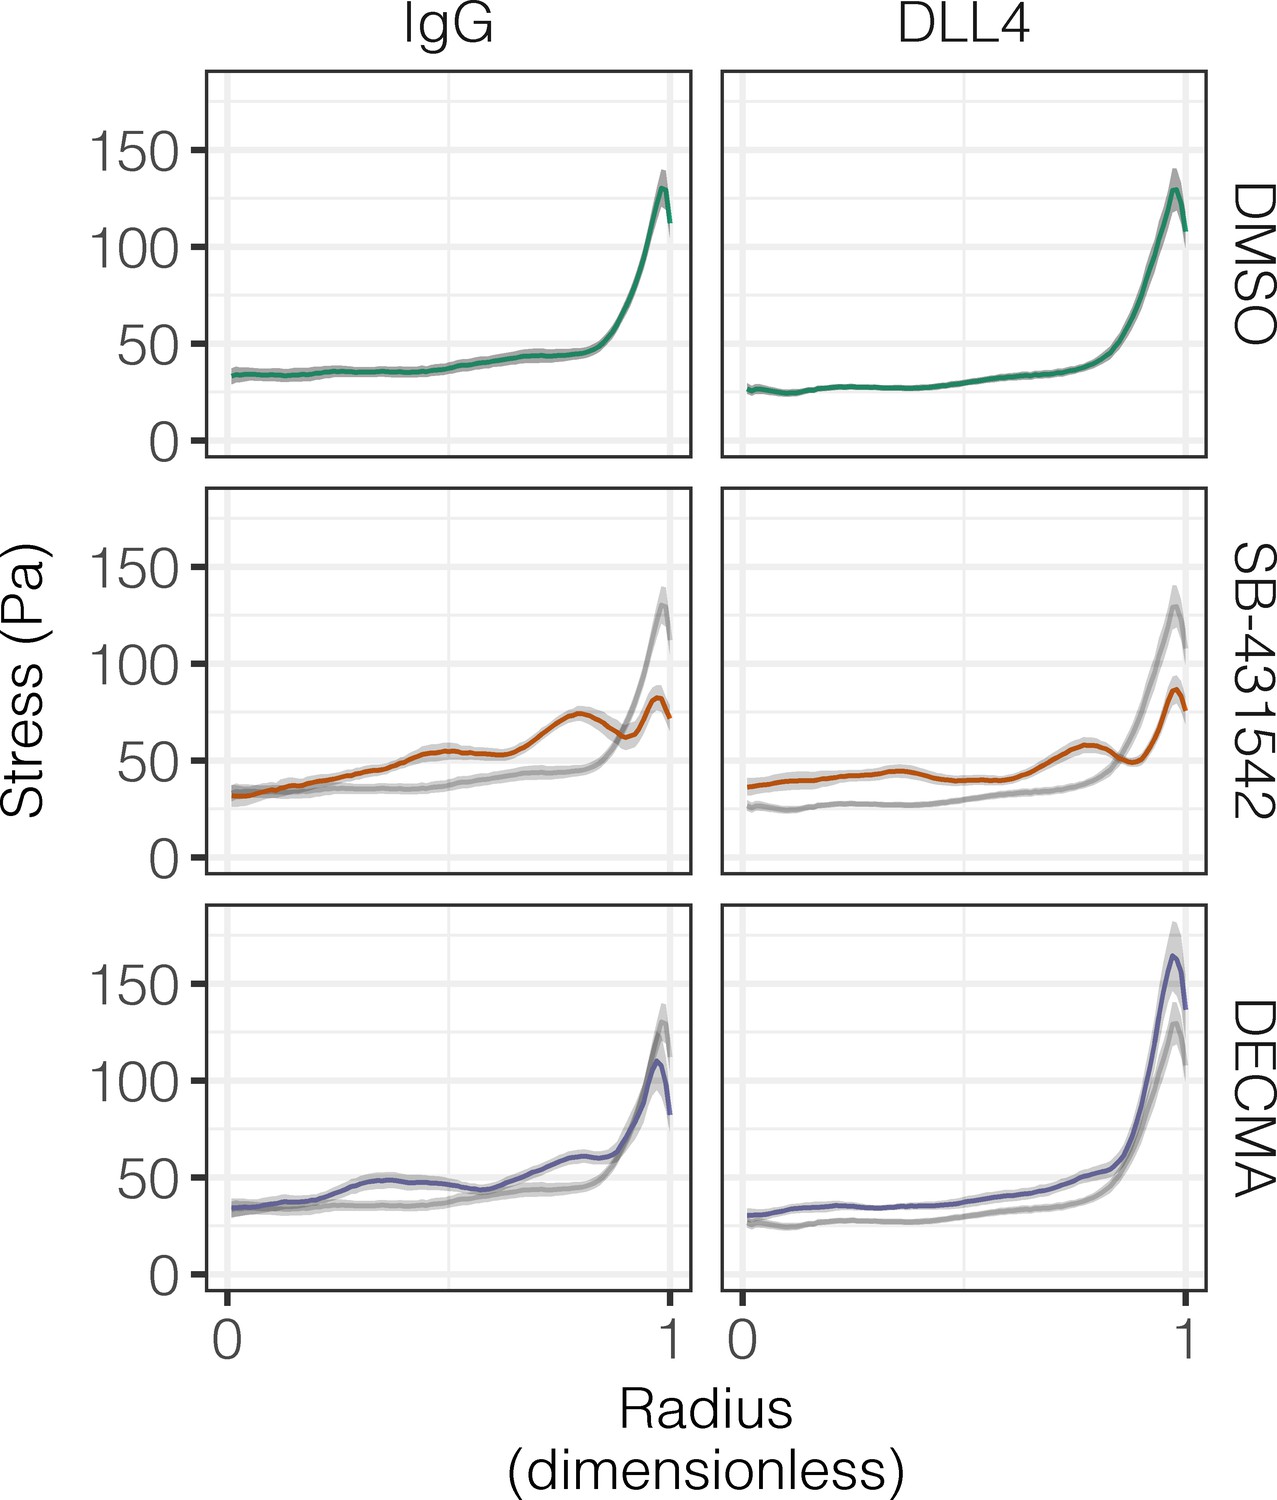
Effect of TGFβ and E-cadherin inhibition on experimental stress profiles.
Experimental stress profiles were obtained by TFM of BMEL cells on 30 kPa and 4 kPa substrates presented with ligand (IgG and DLL4) and treated with vehicle control (DMSO), inhibitor of TGFβ signaling (SB-431542, 10 µm), or functional anti-E-cadherin (DECMA, 10 µg/ml). Gray lines and associated ribbons represent the DMSO control replotted in additional panels to aid comparison. Mean ± 95% CI.
Figure 5
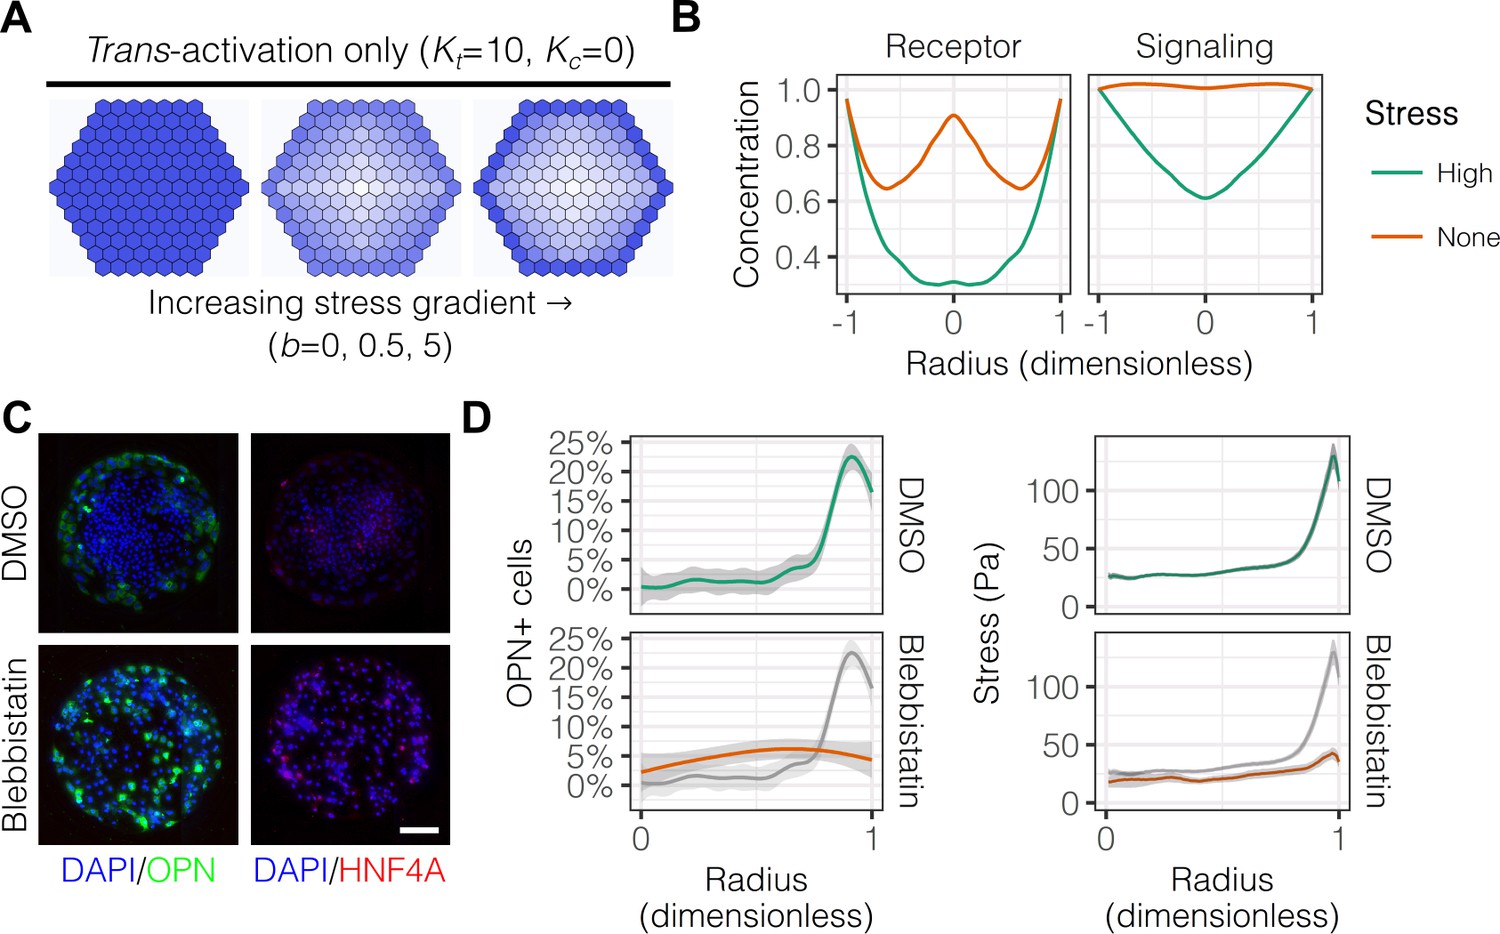
Peripheral differentiation is dependent on a gradient of actomyosin contractility.
(A) Simulated effect of stress gradients of increasing steepness on Notch signaling activity via trans-activation. Darker shades of blue represent increased Notch signaling activity as measured by repressor levels. (B) Quantification of simulated Notch receptor and cleavage events generating repressor, a measure of Notch signaling activity, under conditions of no () and high () stress gradients. Concentration is in arbitrary units normalized to the periphery for each condition. (C) BMEL cells on 30 kPa substrates were presented with DLL4 and treated with vehicle control (DMSO) and inhibitor of myosin II ATPases (blebbistatin, 25 µM). Samples were immunolabeled for OPN and HNF4A. Scale bar is 150 µm. (D) Quantification of OPN+ cell percentages and stress from TFM after treatment with DMSO and blebbistatin. Gray lines and associated ribbons represent the DMSO control replotted in additional panels to aid comparison. Mean ± 95% CI.
Figure 6
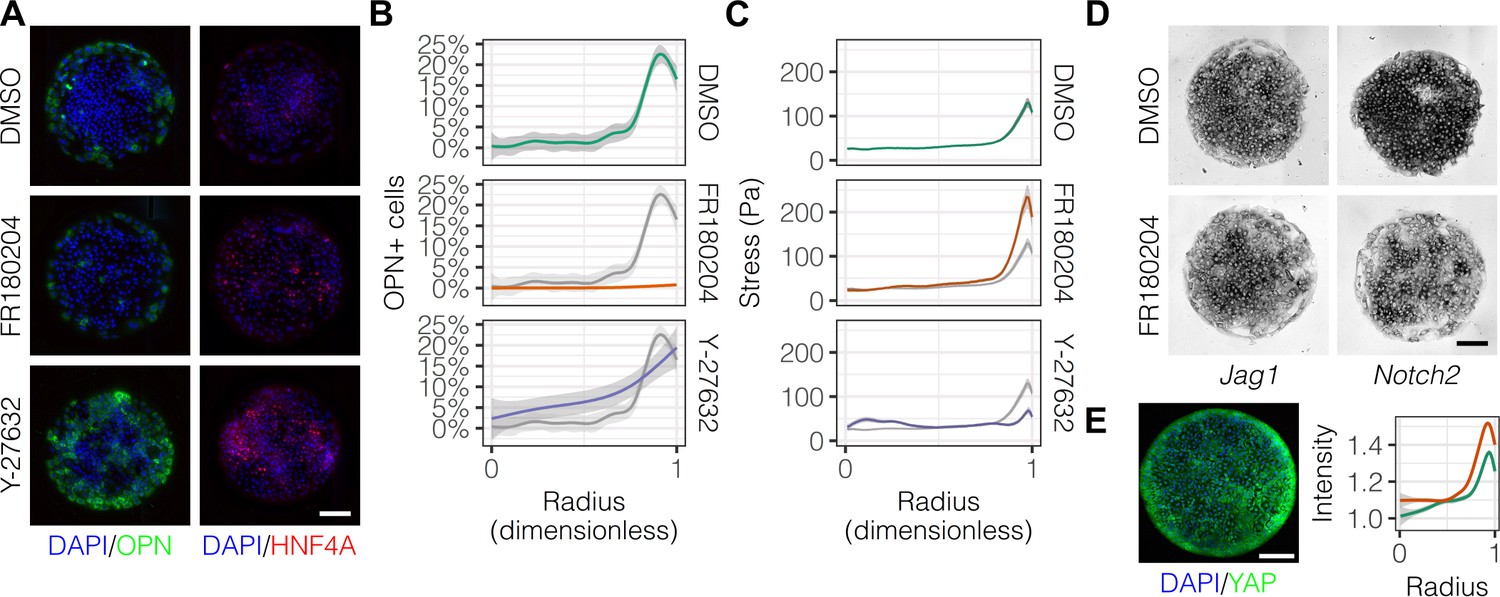
Mechanotransduction by ERK and ROCK modulate peripheral biliary fate.
(A) BMEL cells on 30 kPa substrates were presented with DLL4 and treated with vehicle control (DMSO) and inhibitors of ERK signaling (FR180204, 10 µM) and ROCK (Y-27632, 10 µM). Samples were immunolabeled for OPN and HNF4A. (B) Quantification of OPN+ cell percentages after treatment with DMSO, FR180204, or Y-27632. (C) Stress from TFM after treatment with DMSO, FR180204, or Y-27632. (D) RNA in situ hybridization for Jag1 and Notch2 of cells exogenously presented with DLL4 and treated with DMSO or FR180204. (E) Immunolabeling for YAP of BMEL cells presented with DLL4 on 30 kPa substrates. Quantification shows YAP intensity (a.u.) of cells presented with DLL4 on 30 kPa (green) and 4 kPa (orange) substrates by dimensionless radius. Mean ± 95% CI. (A, D, E) Scale bars are 150 µm. (B, C) Gray lines and associated ribbons represent the DMSO control replotted in additional panels to aid comparison. Mean ± 95% CI.
-
Figure 6—source data 1
Summary table for OPN+ percentage data in Figure 5D and Figure 6B.
- https://doi.org/10.7554/eLife.38536.020
-
Figure 6—source data 2
Summary table for TFM data in Figure 4D, Figure 4—figure supplement 1, Figure 4—figure supplement 2, Figure 5D, and Figure 6C.
- https://doi.org/10.7554/eLife.38536.021
Figure 7 with 1 supplement

Notch ligands Jag1 and Dll1 are both required for segregation of hepatocytic fate centrally and biliary fate peripherally.
(A) Immunolabeling for OPN and HNF4A of BMEL cells presented with DLL4 on 30 kPa substrates. Control cells were transduced with an shRNA vector coding for a non-mammalian target. shJag1 and shDll1 cells were transduced with shRNA vectors targeting Jag1 and Dll1, respectively. Scale bar is 150 µm. (B) Confocal imaging of immunolabeled SOX9 and HNF4A in control, shJag1, and shDll1 cells presented with DLL4 on 30 kPa substrates. Scale bar is 75 µm. (C) Quantification of OPN+ cell counts of control, shJag1, and shDll1 cells presented with DLL4 on 30 kPa substrates. (D) Quantification of SOX9 and HNF4A intensity of control, shJag1, and shDll1 cells presented with DLL4 on 30 kPa substrates. (C, D) Mean ± 95% CI.
-
Figure 7—source data 1
Summary table for OPN data in Figure 7C.
- https://doi.org/10.7554/eLife.38536.024
-
Figure 7—source data 2
Summary table for SOX9 and HNF4A data in Figure 7D.
- https://doi.org/10.7554/eLife.38536.025
Figure 7—figure supplement 1
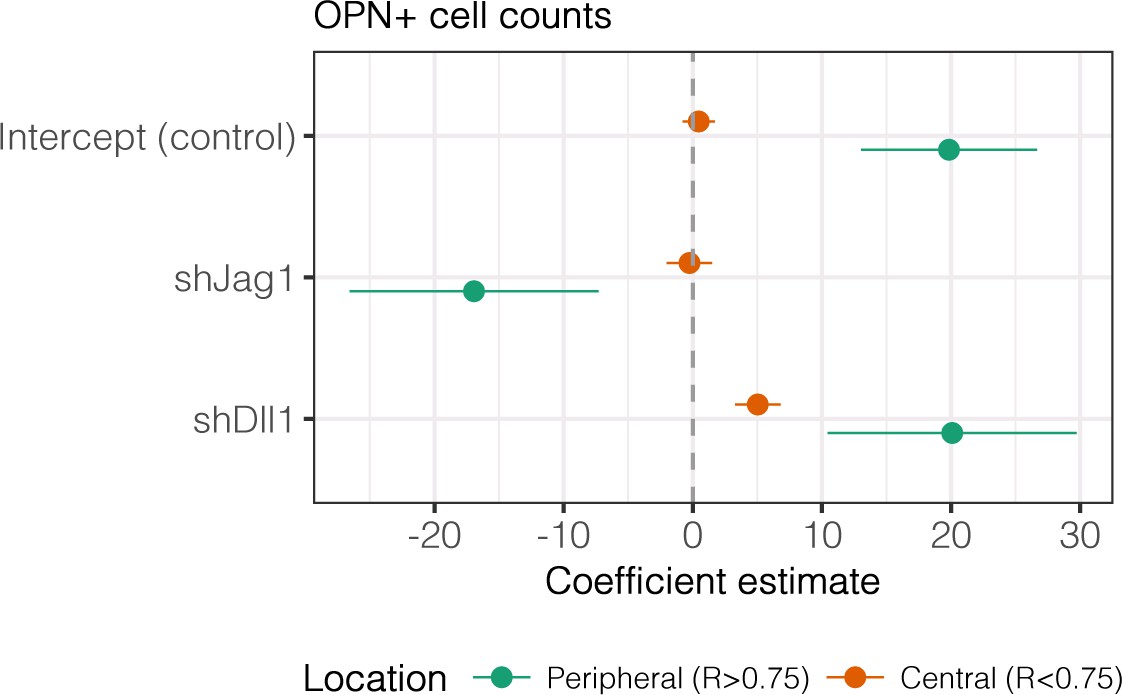
Regression analysis of OPN+ cell counts.
Data in Figure 7B were separated into peripheral and central subsets for which dimensionless radius was greater than 0.75 () and less than 0.75 (). Separate multiple regression models were generated for each data subset for which coefficient estimates (corresponding to mean change in cell counts) and 95% CI were plotted. For each factor, 95% CI that do not intersect with the dashed line indicate regression coefficient estimates for which . Control, shJag1, and shDll1 cells were presented with DLL4 on 30 kPa substrates.
Tables
Table 1
List of growth factors and drugs.
https://doi.org/10.7554/eLife.38536.030| Factor or drug | Stock | Target | Manufacturer | Catalog # |
|---|---|---|---|---|
| (–)-Blebbistatin | 1 mg/ml | 25 μM | Cayman Chemical | 13013 |
| DECMA | 1 mg/ml | 10 μg/ml | Fisher Scientific | 50-245-625 |
| FR180204 | 10 mg/ml | 10 μM | Sigma-Aldrich | SML0320 |
| L-685,458 (GSI) | 1 mM | 5 μM | Tocris | 2627 |
| SB-431542 | 10 mM | 10 μM | Sigma-Aldrich | S4317 |
| TGFβ1 | 5 μg/ml | 1.5 ng/ml | R&D Systems | 240-B-002 |
| Y-27632 | 5 mg/ml | 10 μM | Enzo Life Sciences | 270–333-M005 |
Table 2
List of primary antibodies.
https://doi.org/10.7554/eLife.38536.031| Antibody target | Dilution | Manufacturer | Catalog # |
|---|---|---|---|
| ALB | 1/100 | Bethyl | A90-134A |
| CK19 | 1/200 | Abcam | ab52625 |
| Digoxigenin | 1/500 | Roche | 11 093 274 910 |
| HNF4A | 1/200 | Abcam | ab41898 |
| OPN (SPP1) | 1/50 | R&D Systems | AF808 |
| SOX9 | 1/200 | EMD Millipore | AB5535 |
| YAP1 | 1/50 | ProteinTech | 13584–1-AP |
Additional files
-
Source code 1
MATLAB function to process TFM images.
- https://doi.org/10.7554/eLife.38536.032
-
Source code 2
MATLAB function to analyze and plot TFM data.
- https://doi.org/10.7554/eLife.38536.033
-
Source code 3
MATLAB function to retrieve plane data.
- https://doi.org/10.7554/eLife.38536.034
-
Source code 4
MATLAB function to retrieve the reader for an image.
- https://doi.org/10.7554/eLife.38536.035
-
Source code 5
MATLAB function to draw boundaries around cells automatically.
- https://doi.org/10.7554/eLife.38536.036
-
Source code 6
MATLAB function to find the best fit of an ellipse for a given set of points.
- https://doi.org/10.7554/eLife.38536.037
-
Source code 7
MATLAB function to rotate and center cell boundaries for averaging.
- https://doi.org/10.7554/eLife.38536.038
-
Source code 8
COMSOL FEM simulation of cells on 30 kPa and 4 kPa substrates.
- https://doi.org/10.7554/eLife.38536.039
-
Source code 9
MATLAB Notch simulation for no stress (b=0).
- https://doi.org/10.7554/eLife.38536.040
-
Source code 10
MATLAB Notch simulation for intermediate stress (b=0.5).
- https://doi.org/10.7554/eLife.38536.041
-
Source code 11
MATLAB Notch simulation for high stress (b=5).
- https://doi.org/10.7554/eLife.38536.042
-
Transparent reporting form
- https://doi.org/10.7554/eLife.38536.043
Download links
A two-part list of links to download the article, or parts of the article, in various formats.
Downloads (link to download the article as PDF)
Open citations (links to open the citations from this article in various online reference manager services)
Cite this article (links to download the citations from this article in formats compatible with various reference manager tools)
Spatial patterning of liver progenitor cell differentiation mediated by cellular contractility and Notch signaling
eLife 7:e38536.
https://doi.org/10.7554/eLife.38536


