Decoding hierarchical control of sequential behavior in oscillatory EEG activity
- University of Oregon, United States
Figures
Figure 1
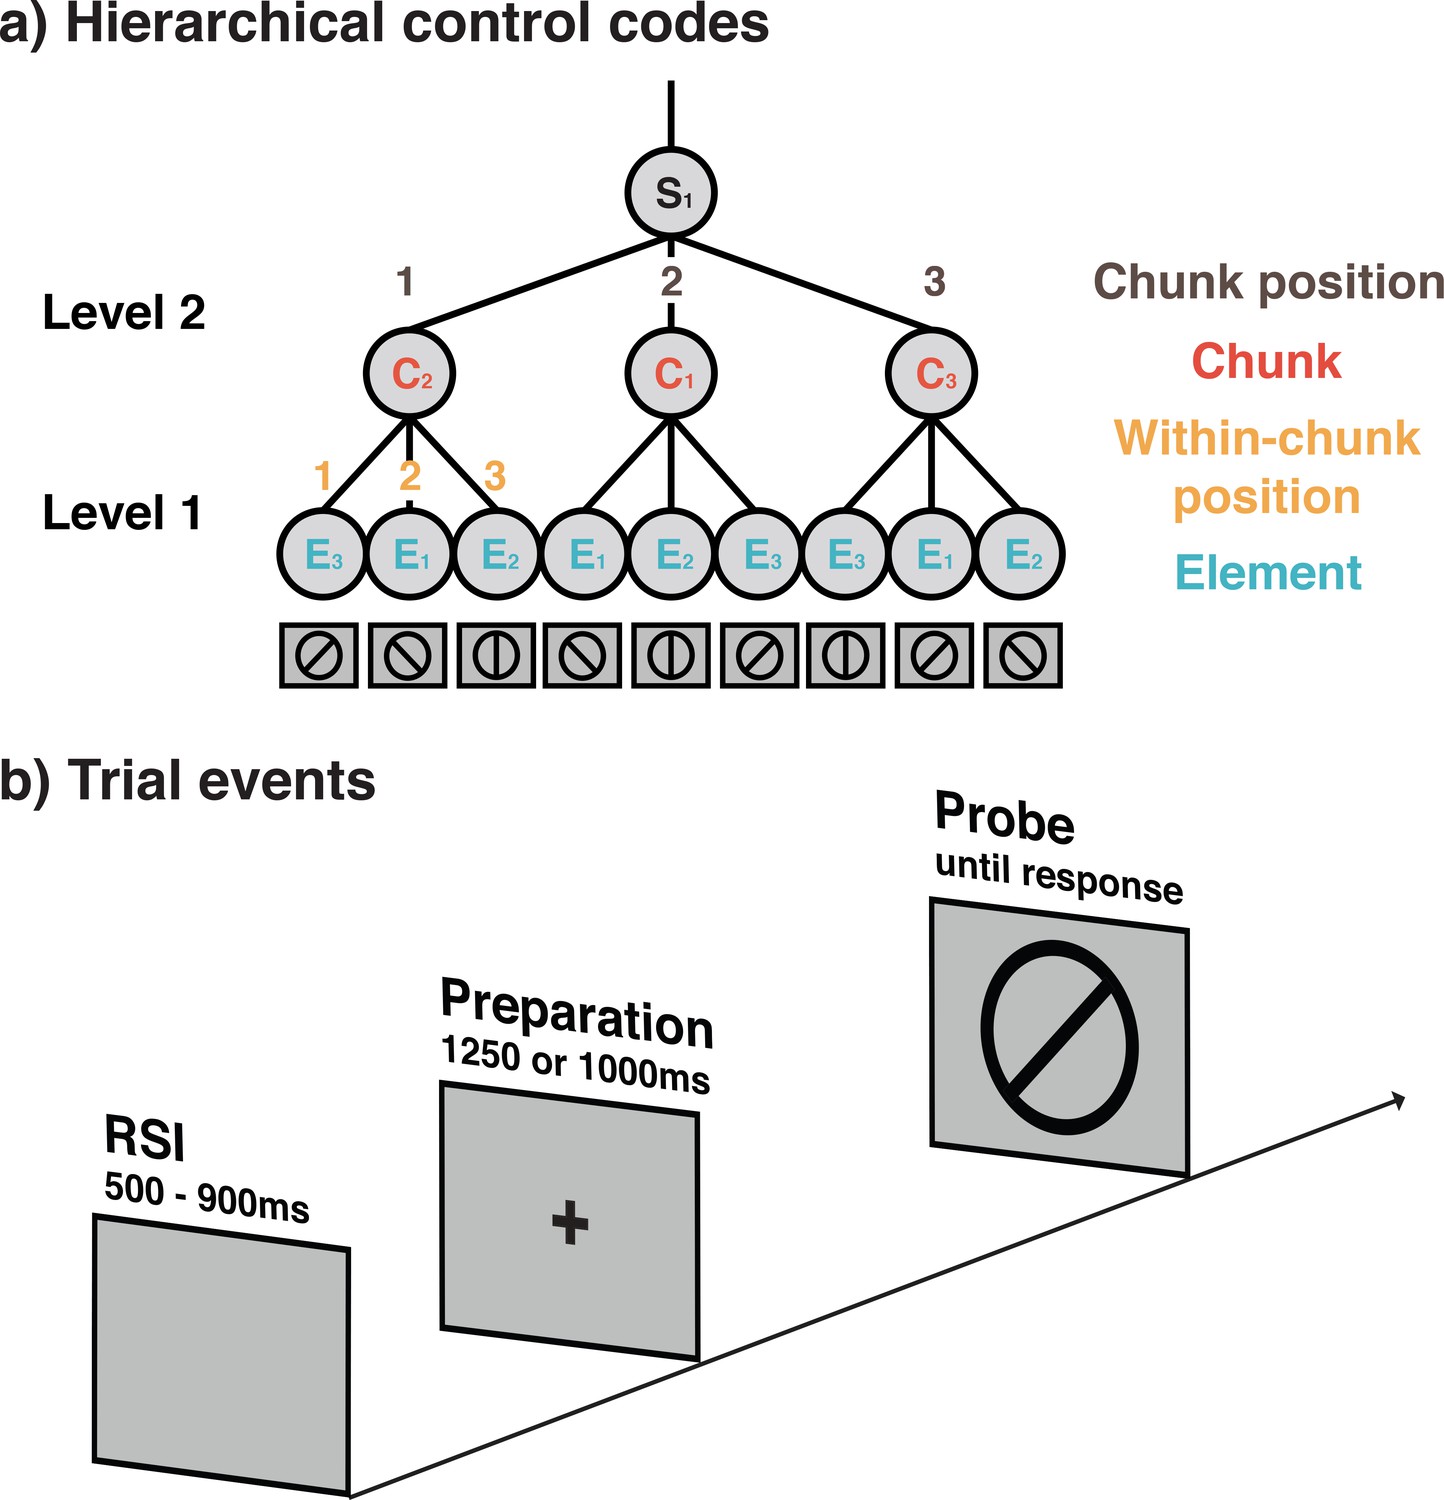
Schematic representation of hierarchically organized control codes for a sequence used in Experiments 1 and 2 (a) and the seqeunce of trial events (b).
(a) Example of the 9-element sequences used in Experiments 1 and 2 and the proposed control structure. Sequences in these experiments were constructed from three different elements (orientations), three possible positions within chunks, three possible chunks, and three possible chunk positions. For each block, a new sequence following this general structure was instructed and had to memorized before the block was initiated. During instruction, memorization was aided by presenting each sequence spatially organized in terms of its different chunks. (b) Structure of individual trials in Experiments 1 and 3. Trials in Experiment 2 included a self-paced retrieval period prior to the preparation period. In all experiments, participants were asked to make keypress yes/no responses depending on whether or not the line orientation relevant for the current sequence position matched with the line orientation probe, presented on the screen. Importantly, on regular, non-error trials the screen provided no additional cues about the current position in the sequence.
Figure 2
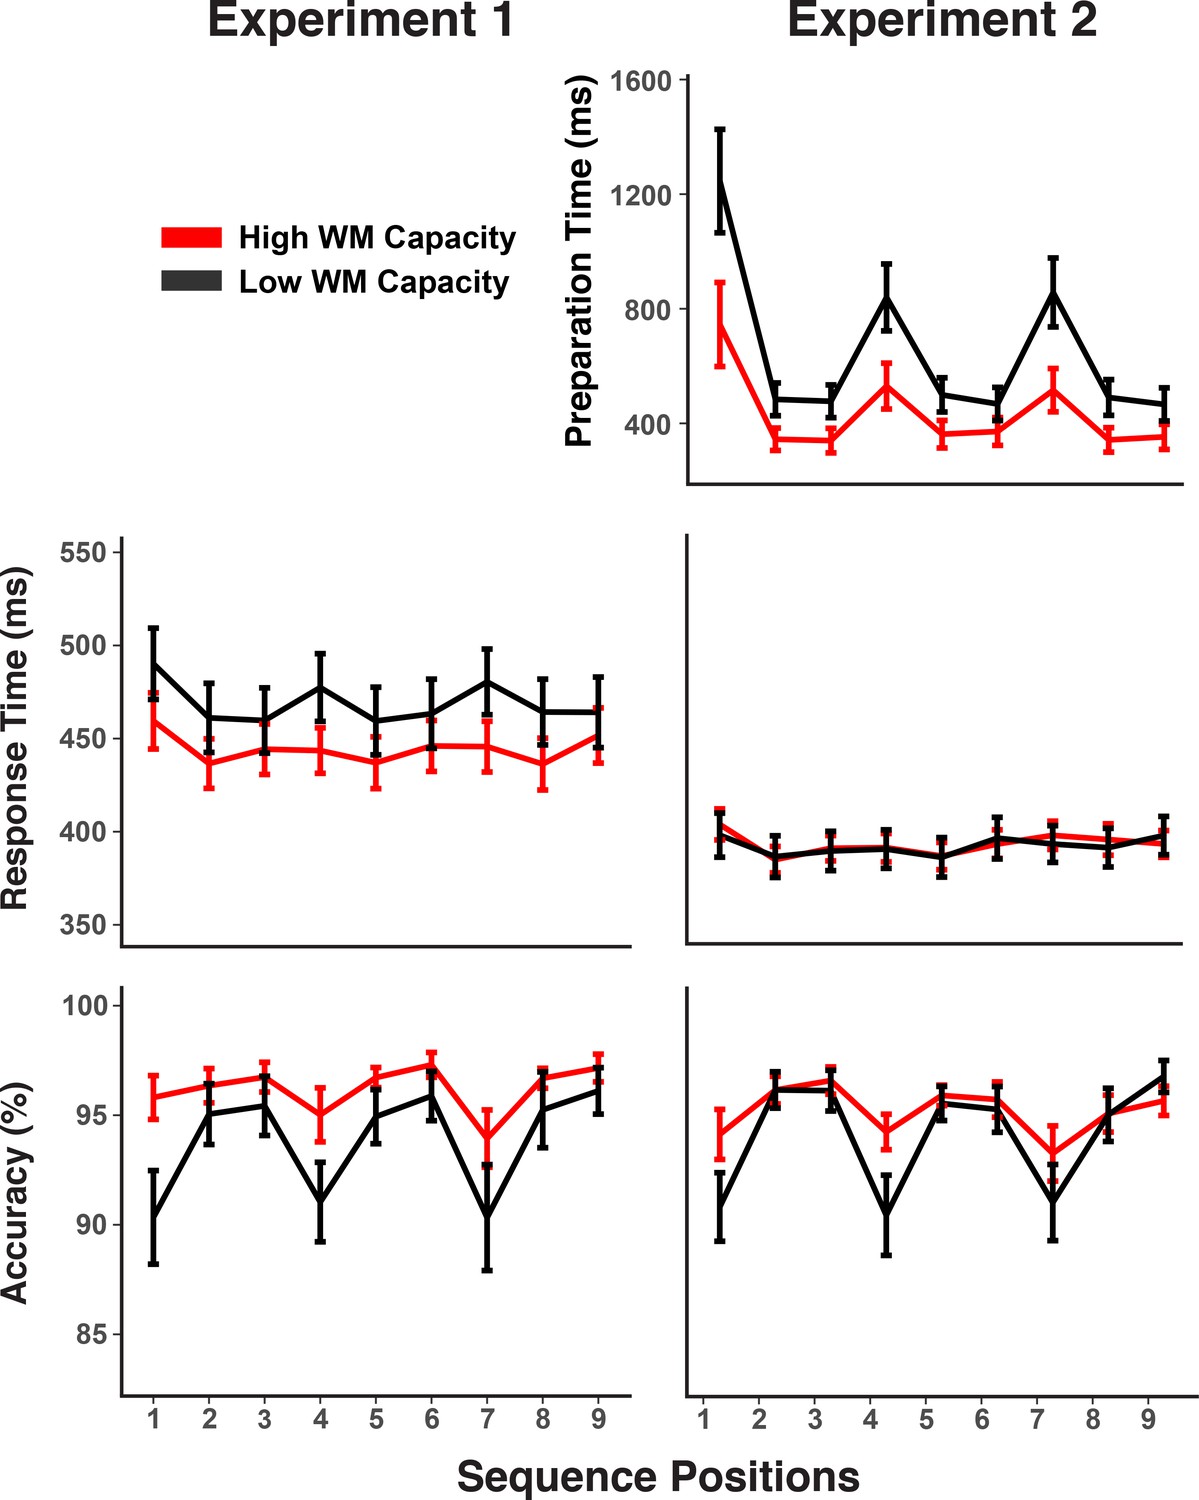
Experiments 1 and 2 behavioral results.
RTs and accuracy show marked sequence structure effects in Experiment 1. In Experiment 2, a substantial portion of the RT sequence structure effect is shifted into the self-paced retrieval period. Error bars show within-subject 95% confidence intervals.
Figure 3
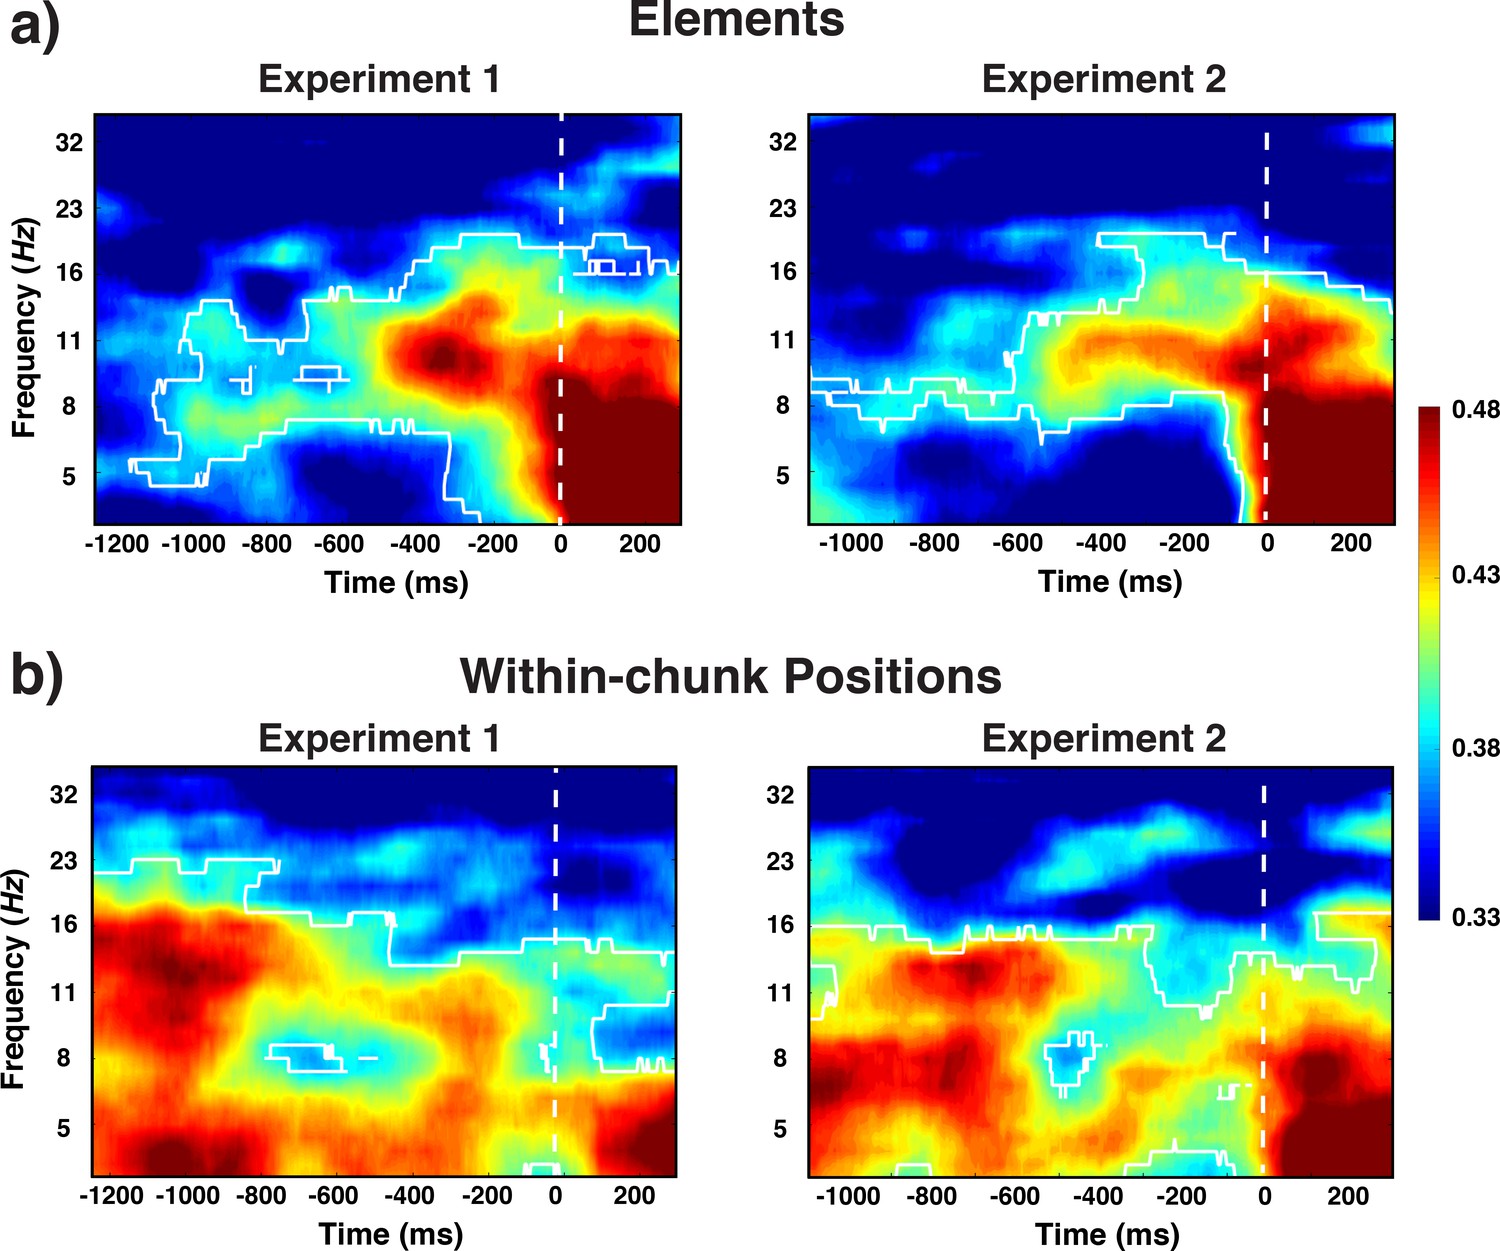
Experiment 1 and 2 decoding results as a function of frequency and time relative to probe-stimulus onset for elements/orientations.
(a) and within-chunk positions (b). The legend shows the decoding accuracy in probability. Chance level is p = 0.33. The regions enclosed by white lines show significant decoding accuracy after cluster correction.
Figure 4
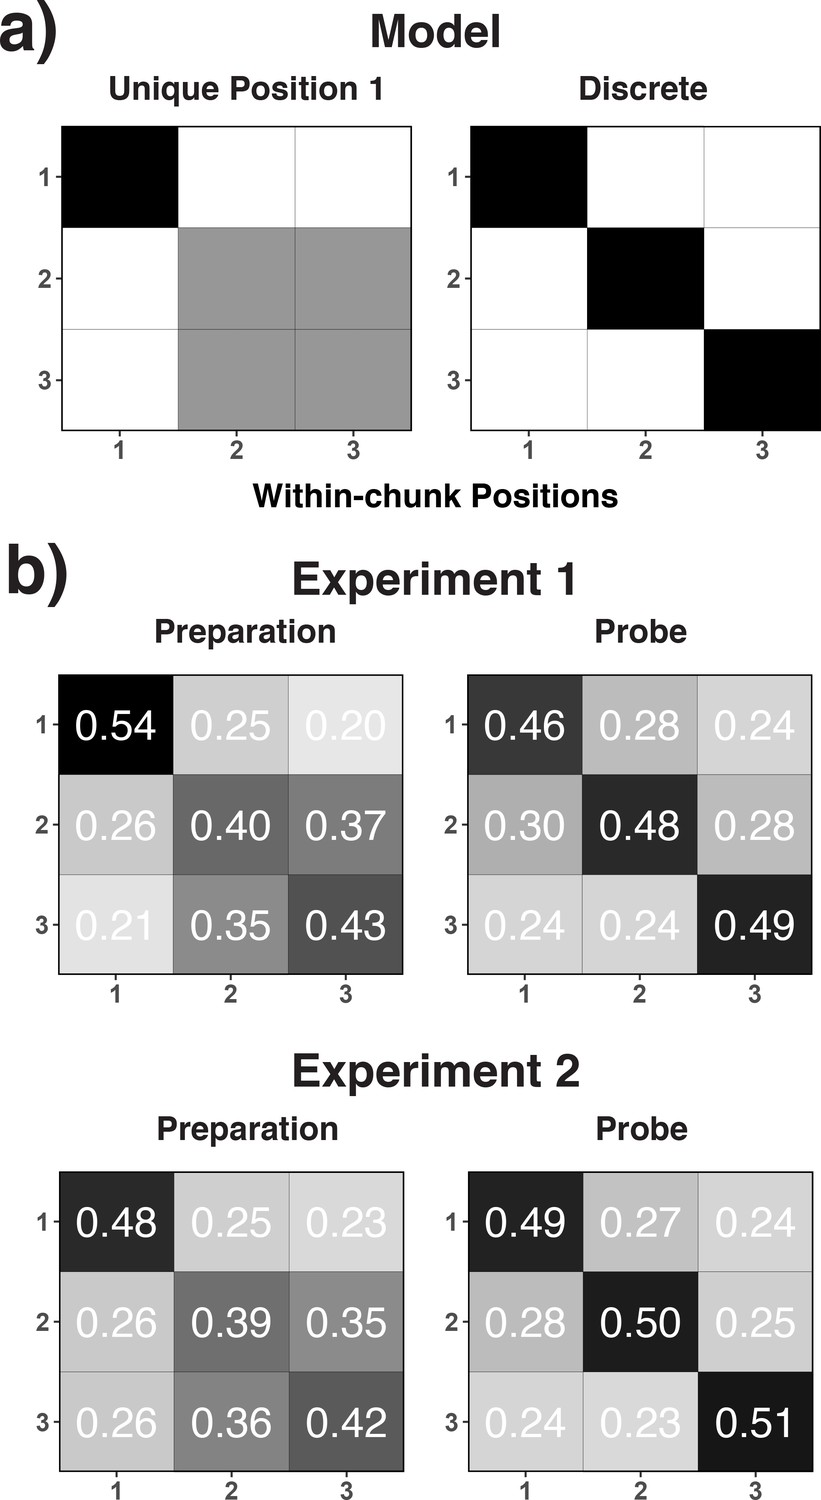
Theoretical (a) and empirical (b) confusion matrices to test the unique-position-1 model against the discrete-position coding model.
(a) RSA model matrices used to test the unique-position-1 account against the discrete-position-coding account. In all presented confusion matrices, the x-axis represents the correct code and the y-axis represents the relative frequency with which each possible code is selected for that specific correct code (i.e. columns add up to 1.0). Black cells in the model matrices represent a theoretically expected correct classification probability of p = 1.0, gray cells of p = 0.5, and white cells of p = 0. (b) Confusion matrices for position decoding results for Experiments 1 and 2 are shown separately for the preparation and the probe period.
Figure 5

Experiment 1 and 2 decoding results as a function of frequency and time for chunk identity.
The legend shows the decoding accuracy in probability. Chance level is p = 0.33. The regions enclosed by white lines show significant decoding accuracy after cluster correction.
Figure 6
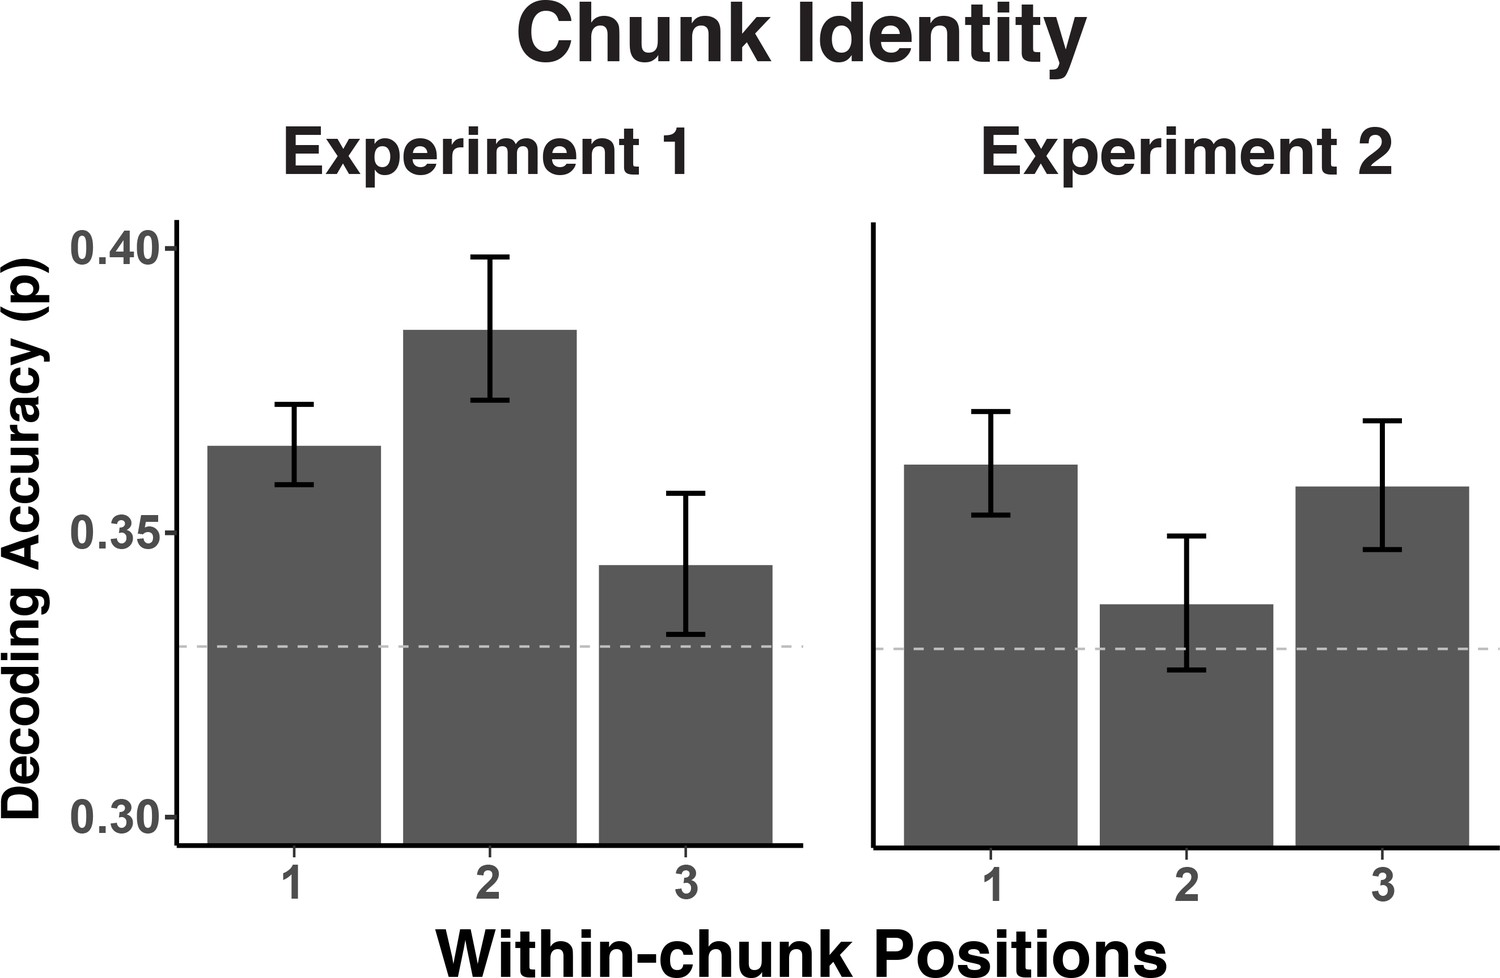
Experiment 1 and 2 decoding accuracy for chunk identity across within-chunk positions.
The error bars reflect within-subject 95% confidence intervals.
Figure 7
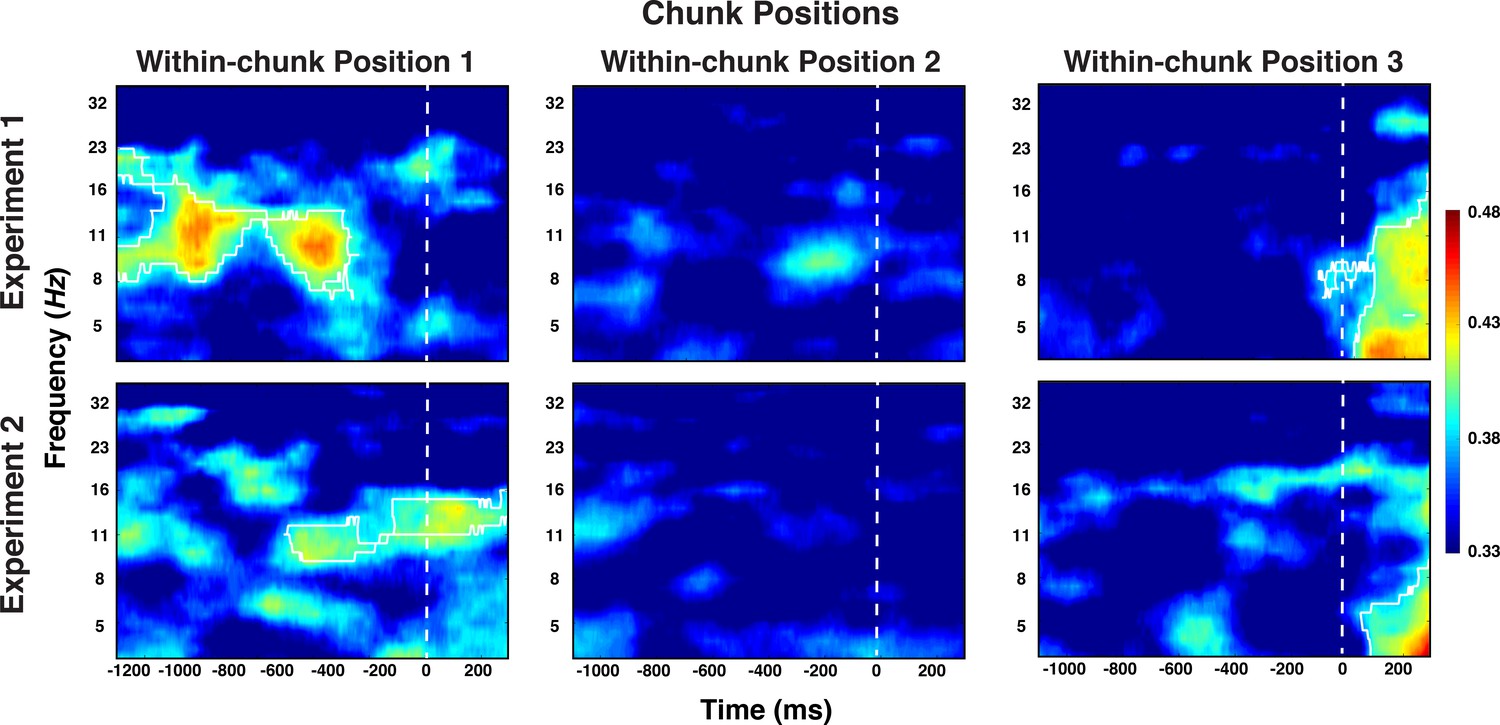
Experiment 1 and 2 decoding results as a function of frequency and time for chunk position, shown separately for the within-chunk positions 1, 2, and 3.
The legend shows the decoding accuracy in probability. Chance level is p = 0.33. The regions enclosed by white lines show significant decoding accuracy after cluster correction.
Figure 8
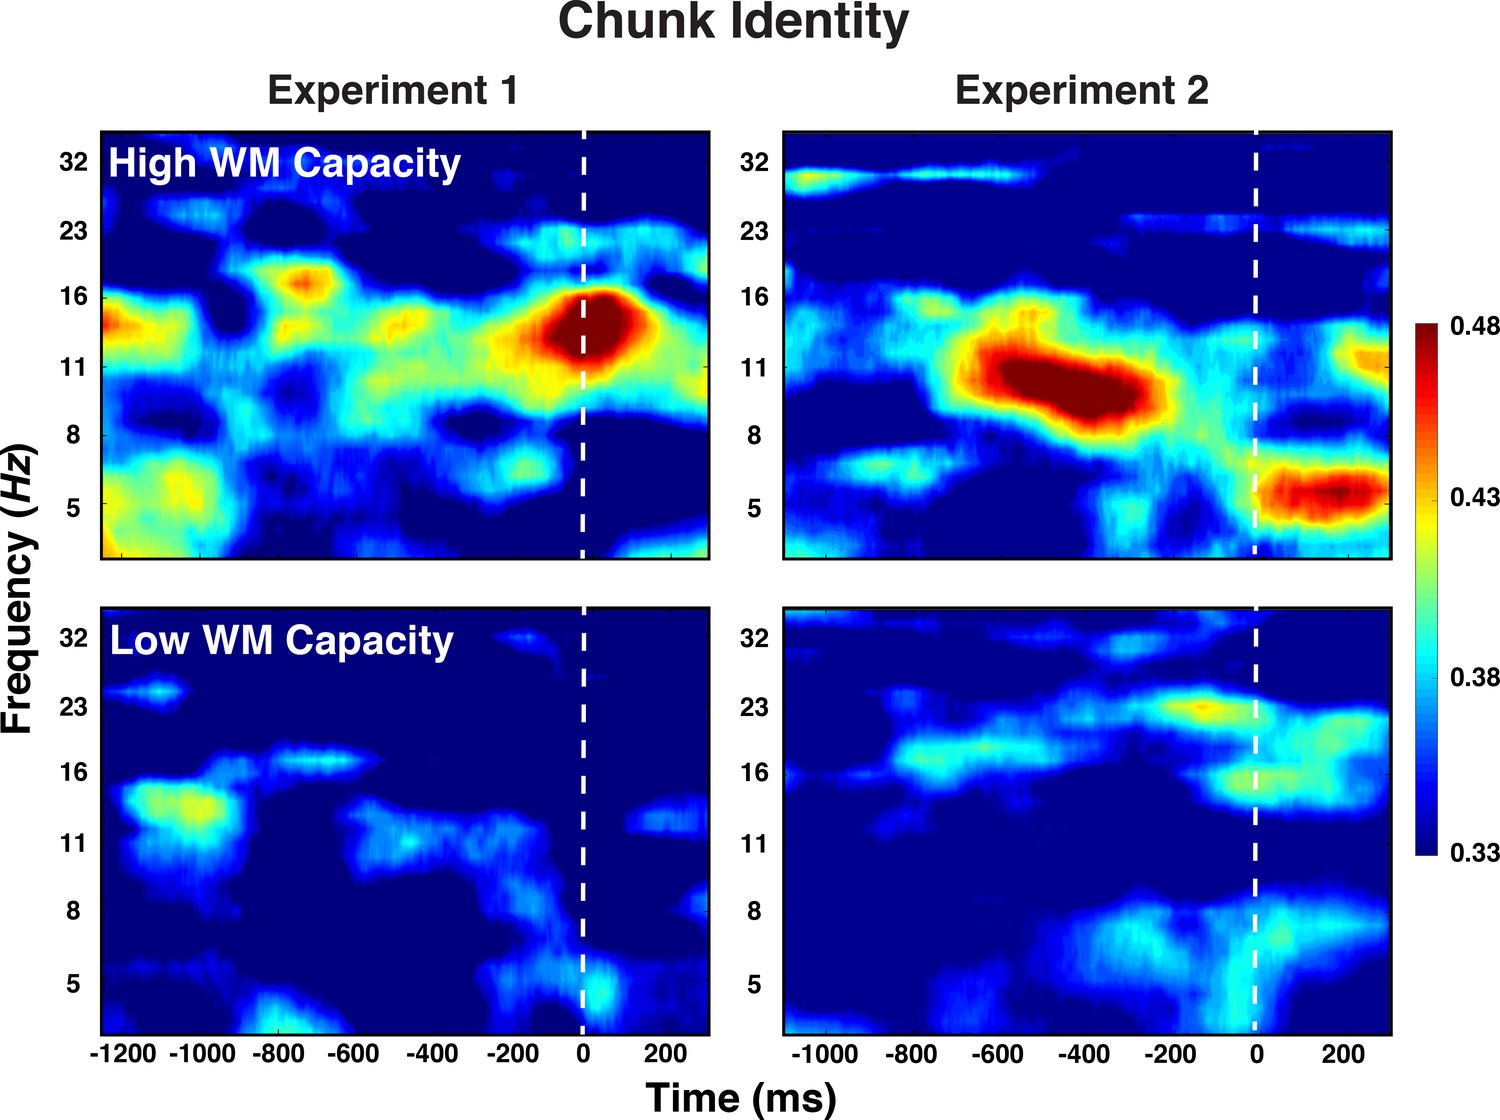
Experiment 1 and 2 decoding results as a function of frequency and time for chunk identity for individuals with low versus high WM capacity.
https://doi.org/10.7554/eLife.38550.010
Figure 9
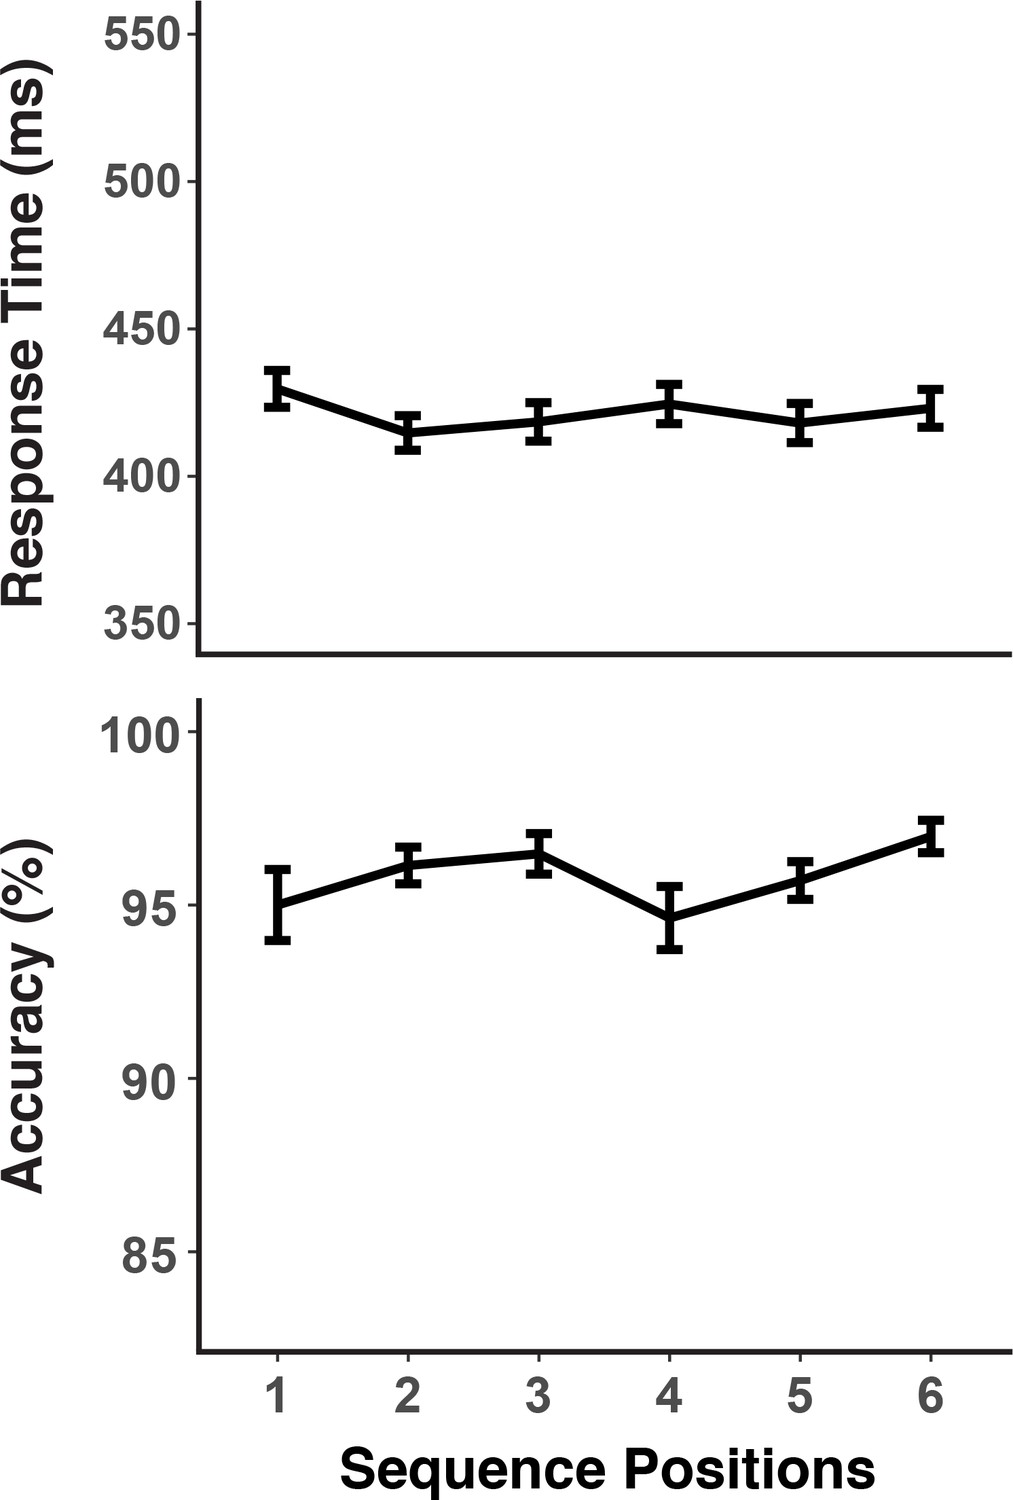
RTs and accuracies as a function of sequence positions.
Error bars show within-subject 95% confidence intervals.
Figure 10
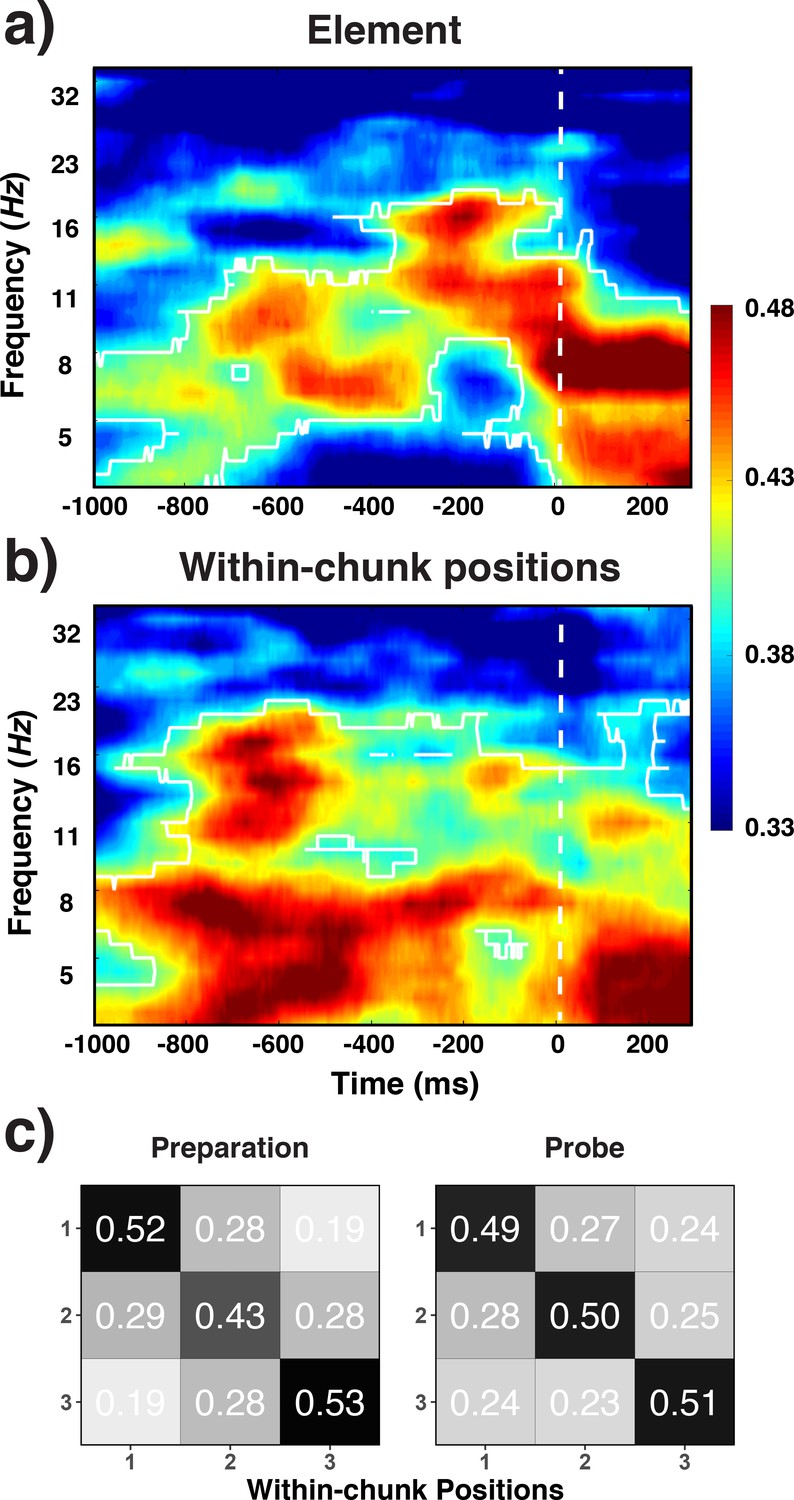
Decoding results for elements (a) within-chunk positions (b) and the confusion matrices for witin-chunk positions (c).
Experiment 3 decoding results as a function of frequency and time for element/orientation identity (a) and within-chunk position (b). The legend shows the decoding accuracy in probability. Chance level is p = 0.33. The regions enclosed by white lines show significant decoding accuracy after cluster correction. (b) Confusion matrices for position decoding results from Experiment 3, separately for the preparation and the probe period.
Figure 11
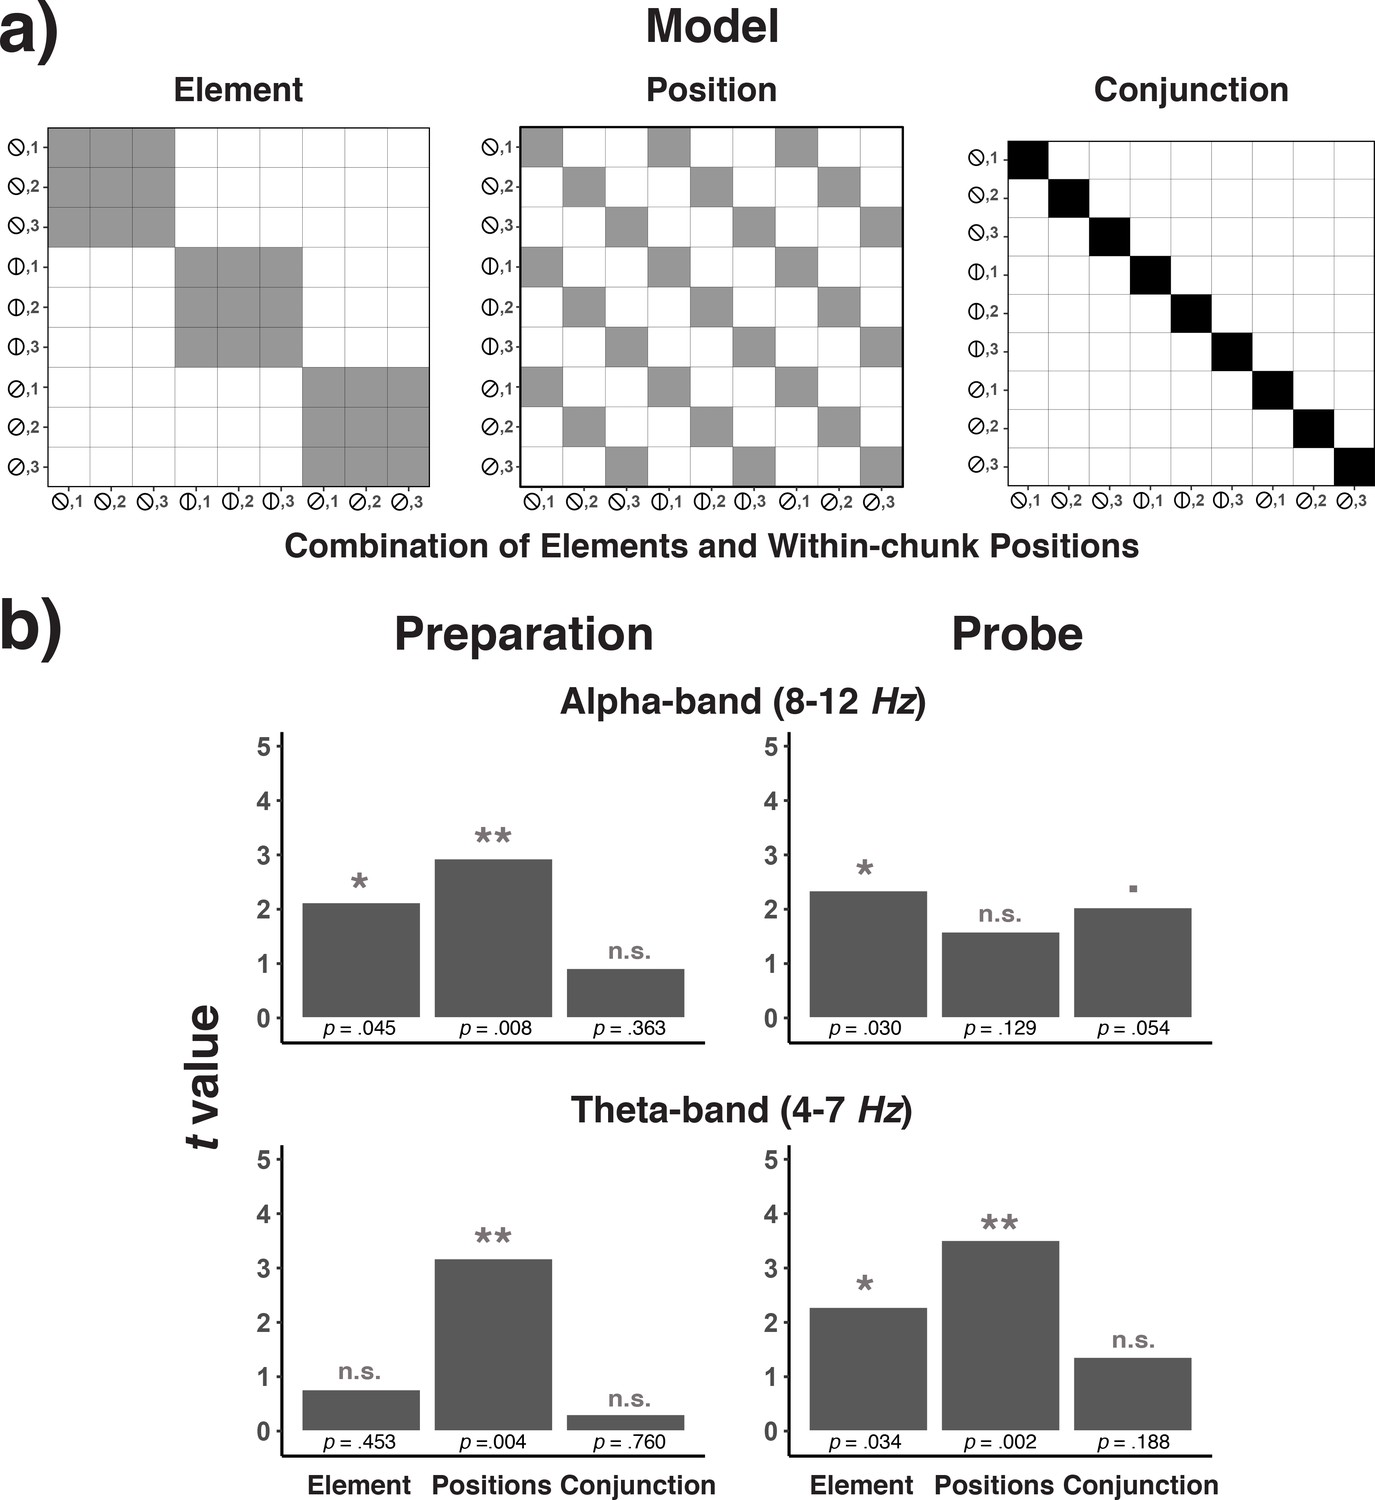
Model confusion matrices for testing element, position, and element-position conjunctions (a) and the results of testing each of these matrices across frequency bands and trial phases (b).
(a) Model matrices that describe the similarity structure by the variation in elements, positions, and conjunctions of elements and positions (see the text for details). Black cells in the model matrices represent a theoretically expected correct classification probability of p = 1.0, gray cells of p = 0.33, and white cells of p = 0. (b) T-values associated with regression coefficients for each of the three model predictors are presented separately for the preparation and the probe period and for the theta- and alpha-band.
Figure 12
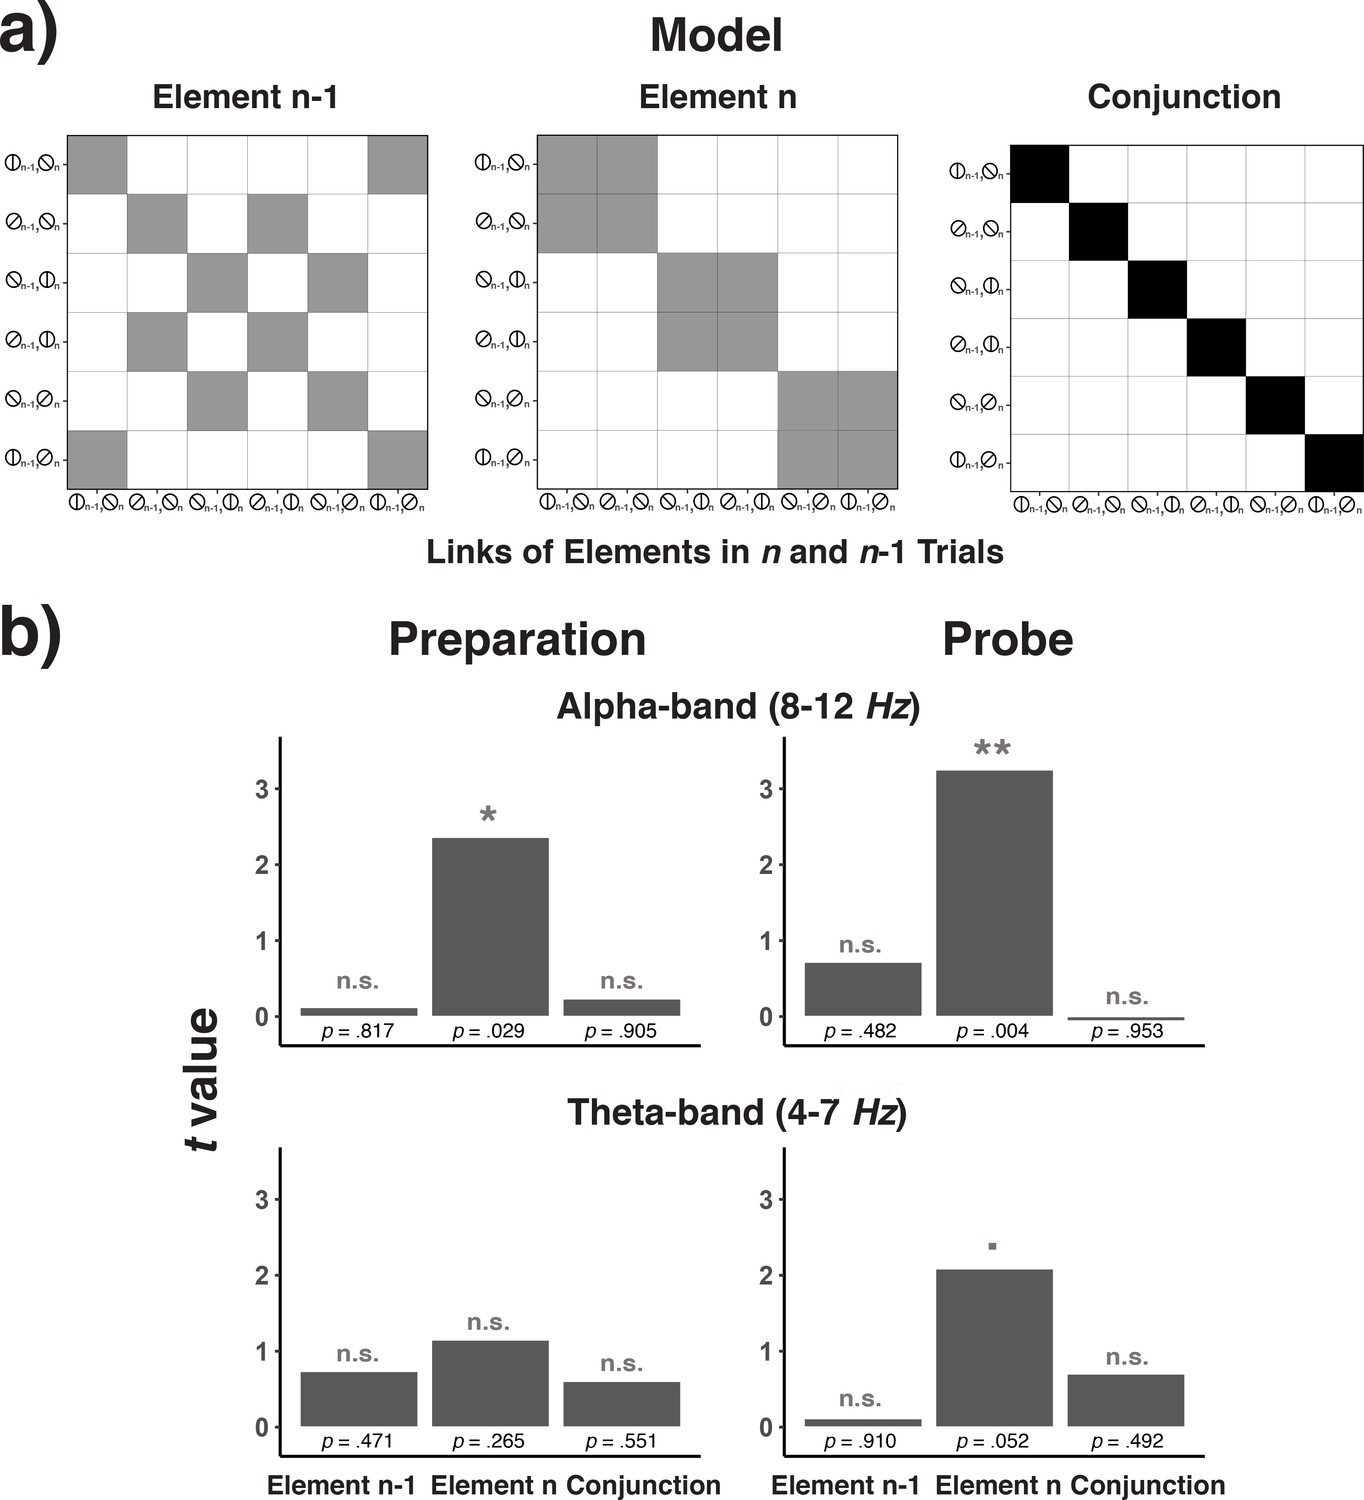
Model matrices for testing trial n-1 element codes, trial n element codes, and conjunctions between trial n-1 and trial n codes (a) and the results of testing each of these matrices across frequency bands and trial phases (b).
(a) Model matrices that describe the similarity structure by the variation in trial n-1 elements, trial n elements, or the conjunction between trial n-1 and n elements (see the text for details). Black cells in the model matrices represent a theoretically expected correct classification probability of p = 1.0, gray cells of p = 0.5, and white cells of p = 0. (b) T-values associated with regression coefficients for each of the three model predictors are shown separately for the preparation and the probe period and for the theta- and alpha-band.
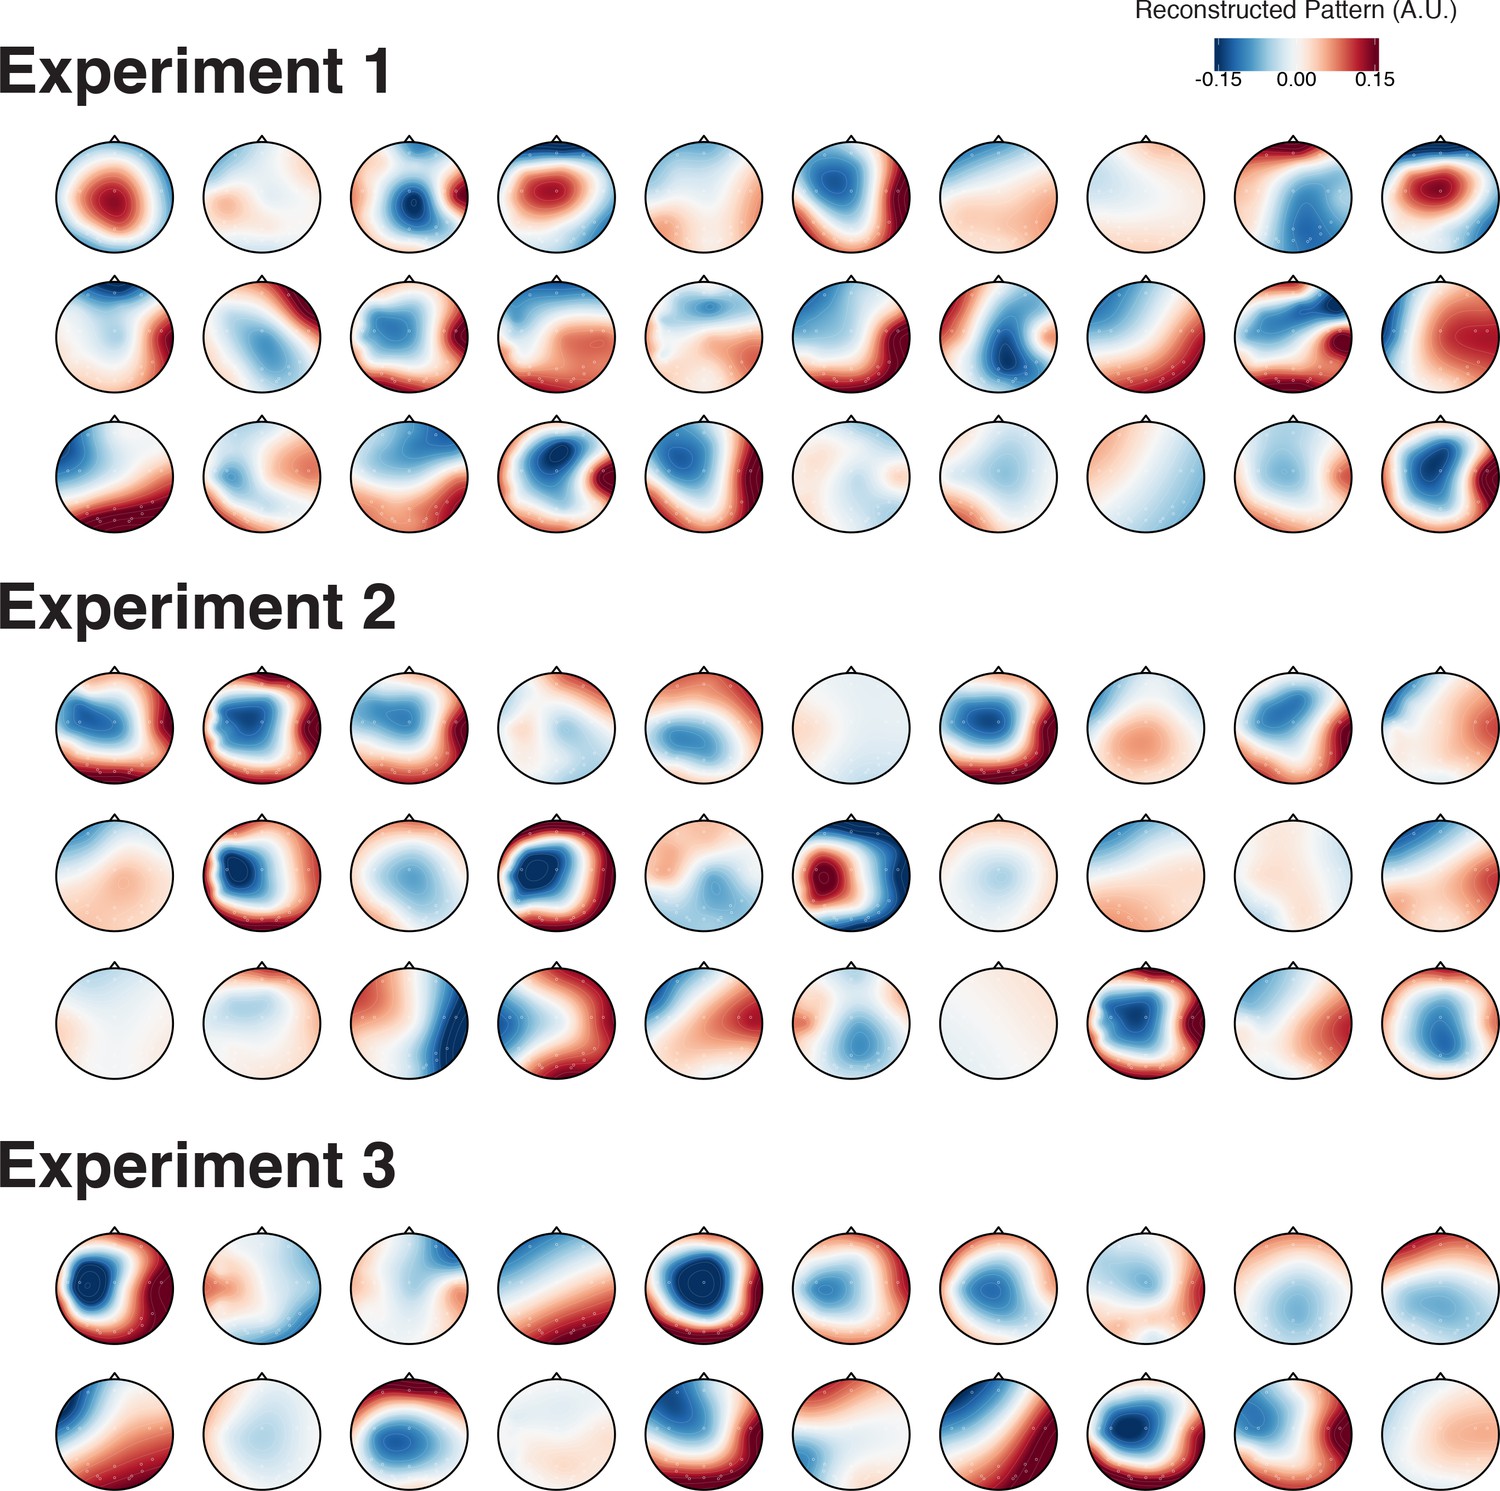
Appendix 1—figure 1

Topography of reconstructed activation patterns for element and within-chunk position codes across Experiment 1, 2 and 3.
Significant t-values indicate that the EEG activity at the given electrode contributed to the decoding results consistently among individuals.
Appendix 1—figure 2
Topography of reconstructed activation patterns within-chunk position codes in the theta-band during the preparation period of all individuals in arbitrary units (A.U.).
https://doi.org/10.7554/eLife.38550.020Tables
Table 1
Average generalization scores (SE) for the decoding of within-chunk position codes.
https://doi.org/10.7554/eLife.38550.005| Preparation | ||||
|---|---|---|---|---|
| Theta | Alpha | |||
| Generalization variable | Reference | Generalized | Reference | Generalized |
| Experiment 1 | ||||
| Elements | 0.381 (0.003) | 0.377 (0.003) | 0.378 (0.004) | 0.370 (0.004) |
| Chunk positions | 0.384 (0.004) | 0.387 (0.004) | 0.374 (0.002) | 0.375 (0.002) |
| Experiment 2 | ||||
| Elements | 0.367 (0.004) | 0.363 (0.004) | 0.369 (0.005) | 0.360 (0.005) |
| Chunk positions | 0.369 (0.003) | 0.373 (0.003) | 0.369 (0.004) | 0.362 (0.004) |
| Probe | ||||
| Theta | Alpha | |||
| Generalization variable | Reference | Generalized | Reference | Generalized |
| Experiment 1 | ||||
| Elements | 0.394 (0.005) | 0.385 (0.005) | 0.362 (0.007) | 0.364 (0.007) |
| Chunk positions | 0.388 (0.005) | 0.383 (0.005) | 0.361 (0.004) | 0.358 (0.004) |
| Experiment 2 | ||||
| Elements | 0.404 (0.003) | 0.394 (0.005) | 0.378 (0.005) | 0.378 (0.005) |
| Chunk positions | 0.397 (0.006) | 0.383 (0.006) | 0.375 (0.005) | 0.376 (0.005) |
-
Note. The table shows for each generalization variable, position-code generalization scores and corresponding reference scores (see Generalization Analysis in the Materials and methods section for details). Results were averaged for either the preparation or the probe period across time (i.e. 600–0 ms for the preparatory interval, 0–300 ms for the probe interval) and frequency values within theta (4–7 Hz) and alpha (8–12 Hz) bands.
Table 2
Average decoding accuracy (SE) for each code in individuals with high versus low working memory (WM) capacity.
https://doi.org/10.7554/eLife.38550.012| Experiment 1 | |||||
|---|---|---|---|---|---|
| Level 1 | High WM | Low WM | T | P | |
| Element | Prep | 0.425 (0.03) | 0.412 (0.02) | 0.329 | 0.744 |
| Probe | 0.427 (0.04) | 0.463 (0.02) | −0.816 | 0.421 | |
| Position | Prep | 0.443 (0.03) | 0.388 (0.03) | 1.408 | 0.170 |
| Probe | 0.477 (0.02) | 0.411 (0.03) | 1.530 | 0.137 | |
| Level2 | |||||
| Chunk | Prep | 0.380 (0.02) | 0.325 (0.01) | 2.503 | 0.018 |
| Probe | 0.368 (0.03) | 0.323 (0.04) | 0.910 | 0.370 | |
| Position 3 | Prep | 0.322 (0.02) | 0.354 (0.02) | −1.107 | 0.277 |
| Probe | 0.422 (0.04) | 0.357 (0.04) | 1.196 | 0.241 | |
| Position 1 | Prep | 0.360 (0.02) | 0.371 (0.02) | 0.380 | 0.707 |
| Probe | 0.331 (0.03) | 0.354 (0.03) | −0.597 | 0.553 | |
| Experiment 2 | |||||
| Level 1 | High WM | Low WM | t | p | |
| Element | Prep | 0.390 (0.02) | 0.407 (0.03) | −0.403 | 0.689 |
| Probe | 0.445 (0.04) | 0.435 (0.03) | 0.207 | 0.837 | |
| Position | Prep | 0.422 (0.02) | 0.433 (0.02) | −0.380 | 0.701 |
| Probe | 0.468 (0.04) | 0.479 (0.02) | −0.231 | 0.818 | |
| Level2 | |||||
| Chunk | Prep | 0.407 (0.01) | 0.326 (0.02) | 3.427 | 0.002 |
| Probe | 0.373 (0.03) | 0.337 (0.02) | 1.045 | 0.305 | |
| Position 3 | Prep | 0.349 (0.02) | 0.340 (0.01) | 0.330 | 0.744 |
| Probe | 0.384 (0.03) | 0.377 (0.03) | 0.162 | 0.872 | |
| Position 1 | Prep | 0.348 (0.02) | 0.374 (0.03) | −0.321 | 0.750 |
| Probe | 0.358 (0.03) | 0.372 (0.03) | −0.321 | 0.750 | |
-
Note. For each feature, decoding accuracy was averaged for either the preparation or the probe period across time (i.e. −600–0 ms for the preparatory interval, 0–300 ms for the probe interval) and frequency values within theta (4–7 Hz) and alpha (8–12 Hz) bands. For the Level-2, chunk position code the difference between WM groups was tested for the observed theta-band effect in the position-3 probe period (late in the transition) and for the alpha-band effect at the position-1 preparation period (early in the transition, see Figure 7).
Table 3
Average generalization scores (SE) for the decoding of within-chunk position codes.
https://doi.org/10.7554/eLife.38550.014| Preparation | ||||
|---|---|---|---|---|
| Theta | Alpha | |||
| Generalization variable | Reference | Generalized | Reference | Generalized |
| Elements | 0.374 (0.004) | 0.374 (0.004) | 0.373 (0.002) | 0.363 (0.002) |
| Chunk positions | 0.422 (0.007) | 0.415 (0.007) | 0.395 (0.007) | 0.393 (0.007) |
| Chunk identity | 0.392 (0.003) | 0.389 (0.003) | 0.381 (0.003) | 0.374 (0.003) |
| Probe | ||||
| Theta | Alpha | |||
| Generalization variable | Reference | Generalized | Reference | Generalized |
| Elements | 0.392 (0.006) | 0.383 (0.006) | 0.371 (0.007) | 0.351 (0.007) |
| Chunk positions | 0.401 (0.008) | 0.390 (0.008) | 0.378 (0.008) | 0.375 (0.008) |
| Chunk identity | 0.393 (0.003) | 0.384 (0.003) | 0.367 (0.004) | 0.353 (0.004) |
-
Note. The table shows for each generalization variable, position-code generalization scores and corresponding reference scores. Results were averaged for either the preparation or the probe period across time (i.e. −600–0 ms for the preparatory interval, 0–300 ms for the probe interval) and frequency values within theta (4–7 Hz) and alpha (8–12 Hz) bands.
Figure Captions
Additional files
-
Transparent reporting form
- https://doi.org/10.7554/eLife.38550.017
Download links
A two-part list of links to download the article, or parts of the article, in various formats.
Downloads (link to download the article as PDF)
Open citations (links to open the citations from this article in various online reference manager services)
Cite this article (links to download the citations from this article in formats compatible with various reference manager tools)
Decoding hierarchical control of sequential behavior in oscillatory EEG activity
eLife 7:e38550.
https://doi.org/10.7554/eLife.38550


