A novel enhancer near the Pitx1 gene influences development and evolution of pelvic appendages in vertebrates
- Stanford University School of Medicine, United States
- Stanford University, United States
- University of Georgia, United States
Figures
Figure 1
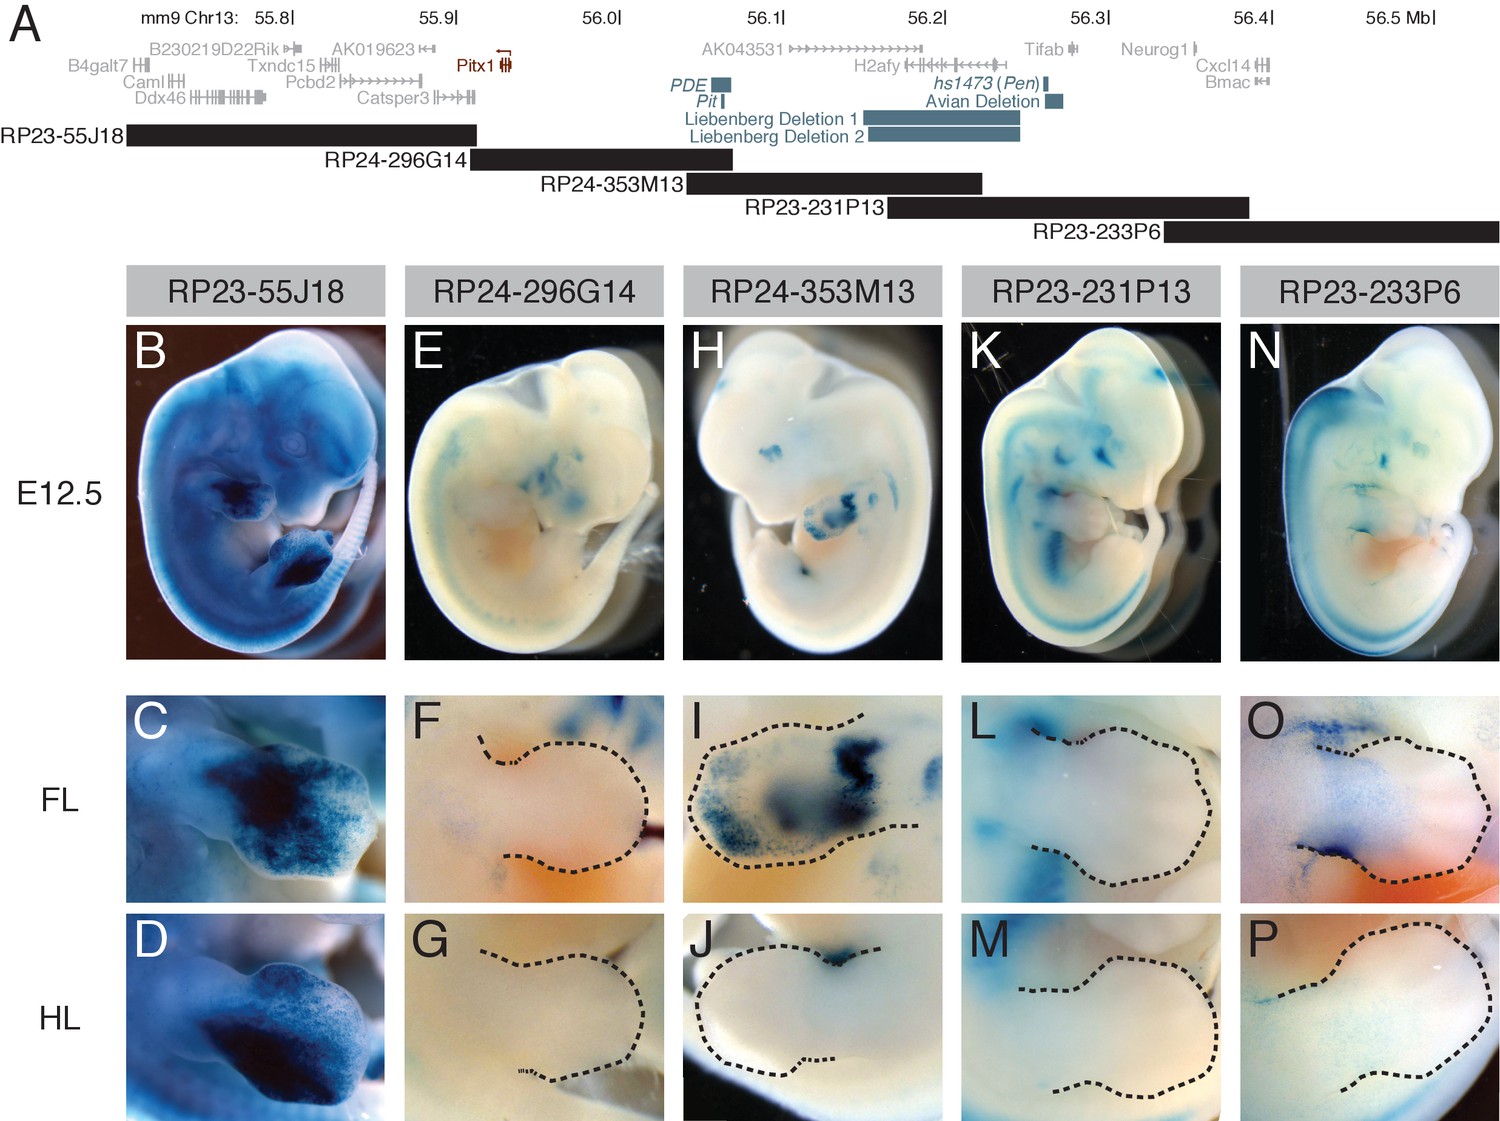
A BAC scan across the Pitx1 locus.
(A) Schematic of a genomic region surrounding Pitx1 (red). Note that the transcriptional orientation of the Pitx1 gene is from right to left in this view (arrow). Black bars show BAC locations. Gray bars denote orthologous positions of other known or suspected cis regulatory regions, including: sequences removed by the avian deletion associated with feathered feet in pigeons (Domyan et al., 2016), the PDE element (Sarro et al., 2018), the Pit enhancer (Kragesteen et al., 2018), human deletions associated with Liebenberg syndrome (Spielmann et al., 2012), and the hs1473 limb enhancer (Pennacchio et al., 2006; Spielmann et al., 2012), now also referred to as the pan-limb enhancer, or Pen (Kragesteen et al., 2018). (B-P) Whole-mount lacZ staining of transgenic embryos carrying RP23-55J18 (B-D), RP24-296G14 (E-G), RP24-353M13 (H-J, only left side of embryo showed limb staining), RP23-231P13 (K-M), or RP23-233P6 (N-P), with close ups of the forelimb (‘FL’) and hind limb (‘HL’) below. Dotted lines denote boundaries of limbs.
Figure 2 with 2 supplements
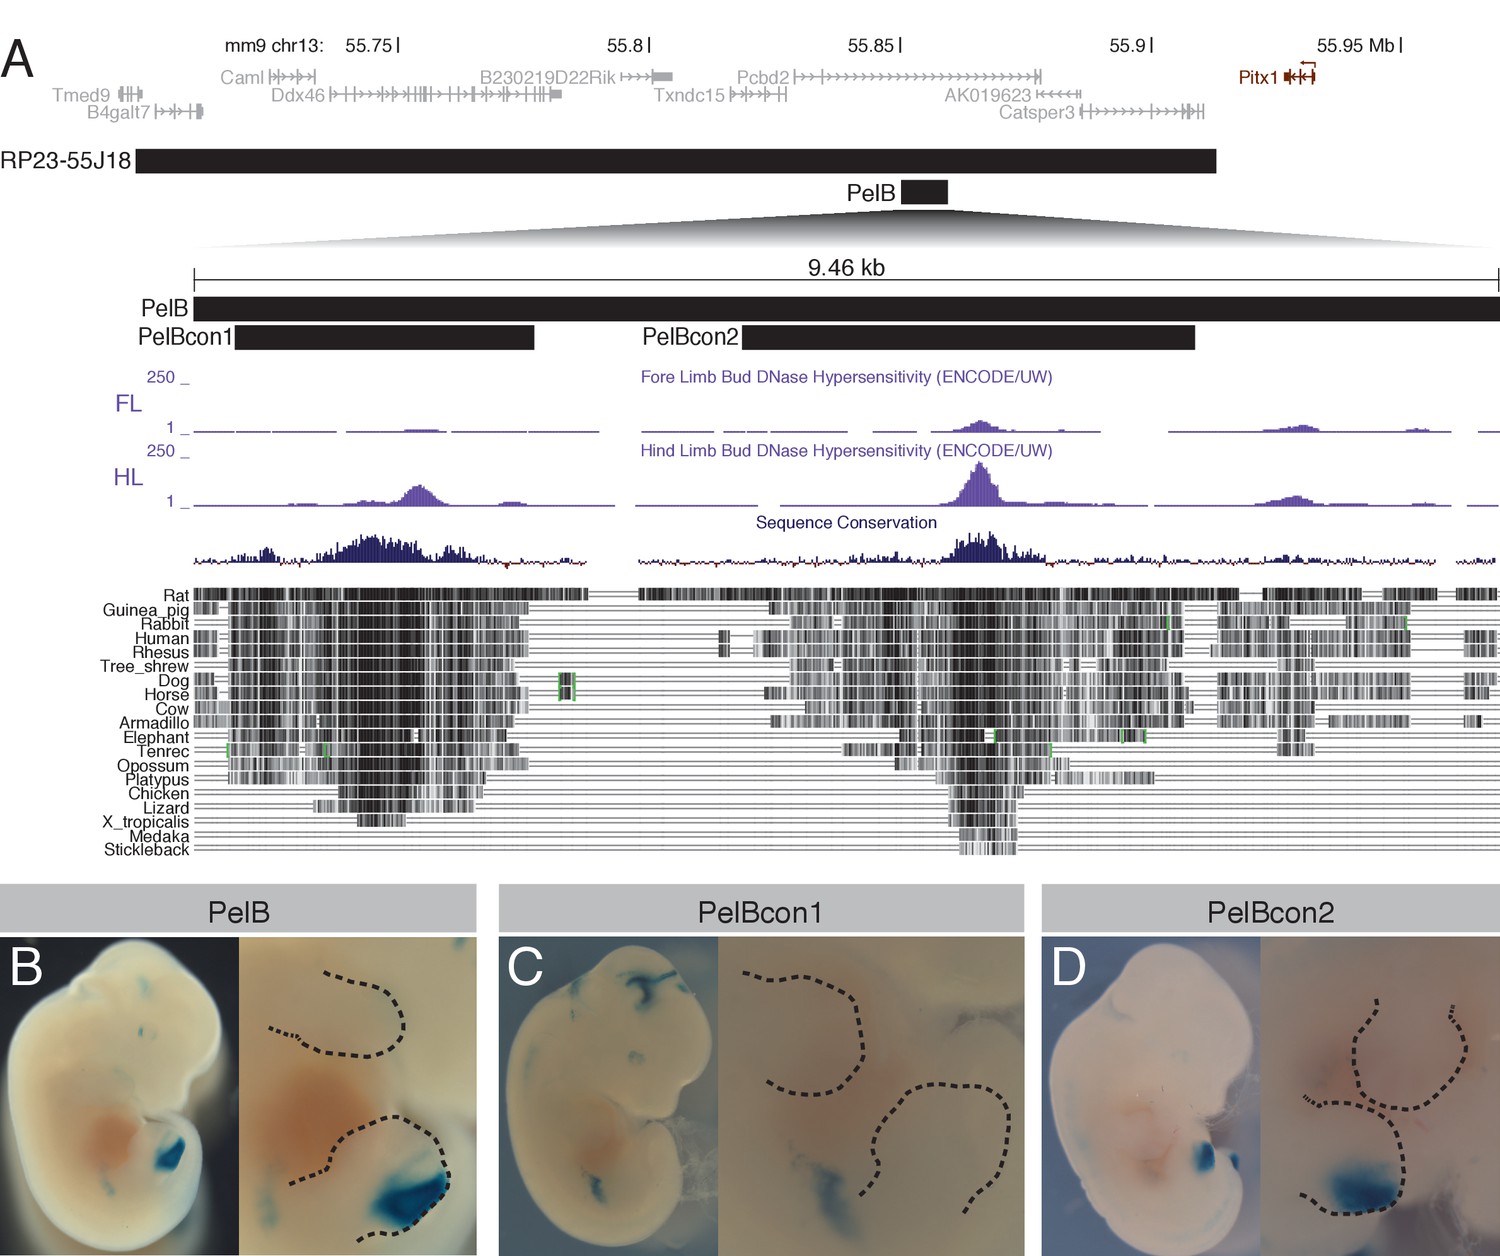
A novel pelvic enhancer downstream of Pitx1.
(A) Schematic of genomic region encompassing Pitx1 (black), with flanking genes (gray). Black bars mark the location of the BAC RP23-55J18 and smaller enhancer constructs. Forelimb (FL) and hind limb (HL) DNaseI hypersensitivity tracks from ENCODE are shown (Rosenbloom et al., 2013), along with vertebrate sequence conservation (Blanchette et al., 2004). (B-D) Whole-mount lacZ staining of transgenic embryos carrying PelB enhancer constructs, with close ups of the limbs. Dotted lines denote boundaries of limbs.
Figure 2—figure supplement 1

Comparison of Pitx1 locus H3K27ac profile in mouse and Anolis lizard embryonic forelimbs and hind limbs.
(A) H3K27ac ChIP-seq signal from E11.5 mouse forelimbs (blue) and hind limbs (red); mm9 genome coordinates: chr13:55,809,000–56,275,000. (B) H3K27ac ChIP-seq signal from stage 7 Anolis carolinensis forelimbs (blue) and hind limbs (red); AnoCar2 genome coordinates: ChrUn_GL343223:324,575–981,559. H3K27ac data are from genome-wide analysis in Infante et al. (2015), and black bars are added to show the locations of PelB sequences (this study) and the previously described PDE region (Sarro et al., 2018). Note that in the PelB region, but not the PDE region, hind limb-enriched H3K27ac signals are conserved between mice and lizards.
Figure 2—figure supplement 2

PelB conservation in vertebrates.
VISTA conservation plot (Frazer et al., 2004) of PelB enhancer sequence in vertebrates. Black bars show the relative positions of the PelB enhancer constructs that were tested in mice. Alignments were made with Shuffle-LAGAN relative to the mouse sequence. Note that PelB sequences are largely intact in two different mammalian lineages that show morphological hind limb reduction (manatees and dolphins). The PelBcon1 region is poorly conserved in several snake genome assemblies, except for pythons and boas. Pythons and boas are related snake species that retain small external pelvic appendages (Cohn and Tickle, 1999).
Figure 3
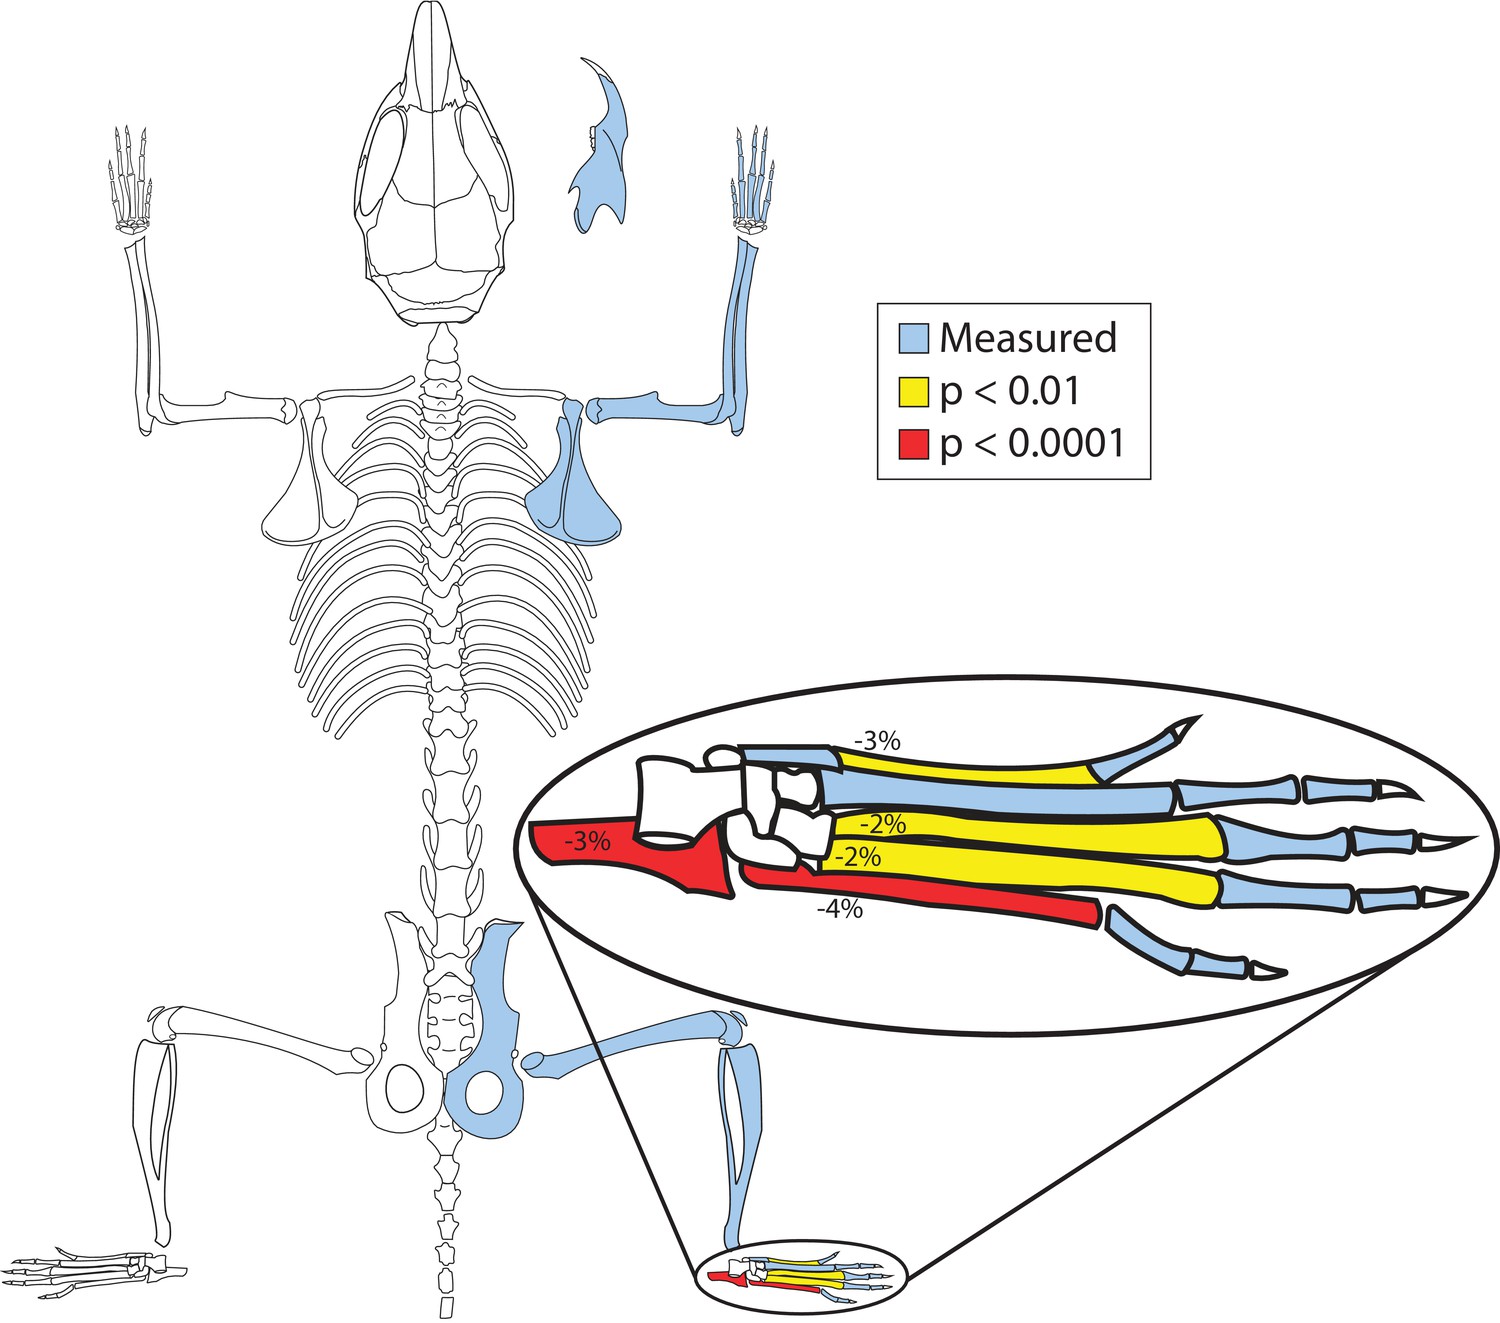
PelB deletion mice have smaller hind feet.
Bones with significant length changes between control (Pitx1+/+) and enhancer knockout (Pitx1PelB-/PelB-) mice are highlighted (Blue = measured, Yellow = p < 0.01, Red = p < 0.0001). Numbers indicate percent change in mean length. (Pitx1+/+ n=21, Pitx1PelB-/PelB- n = 20).
Figure 4
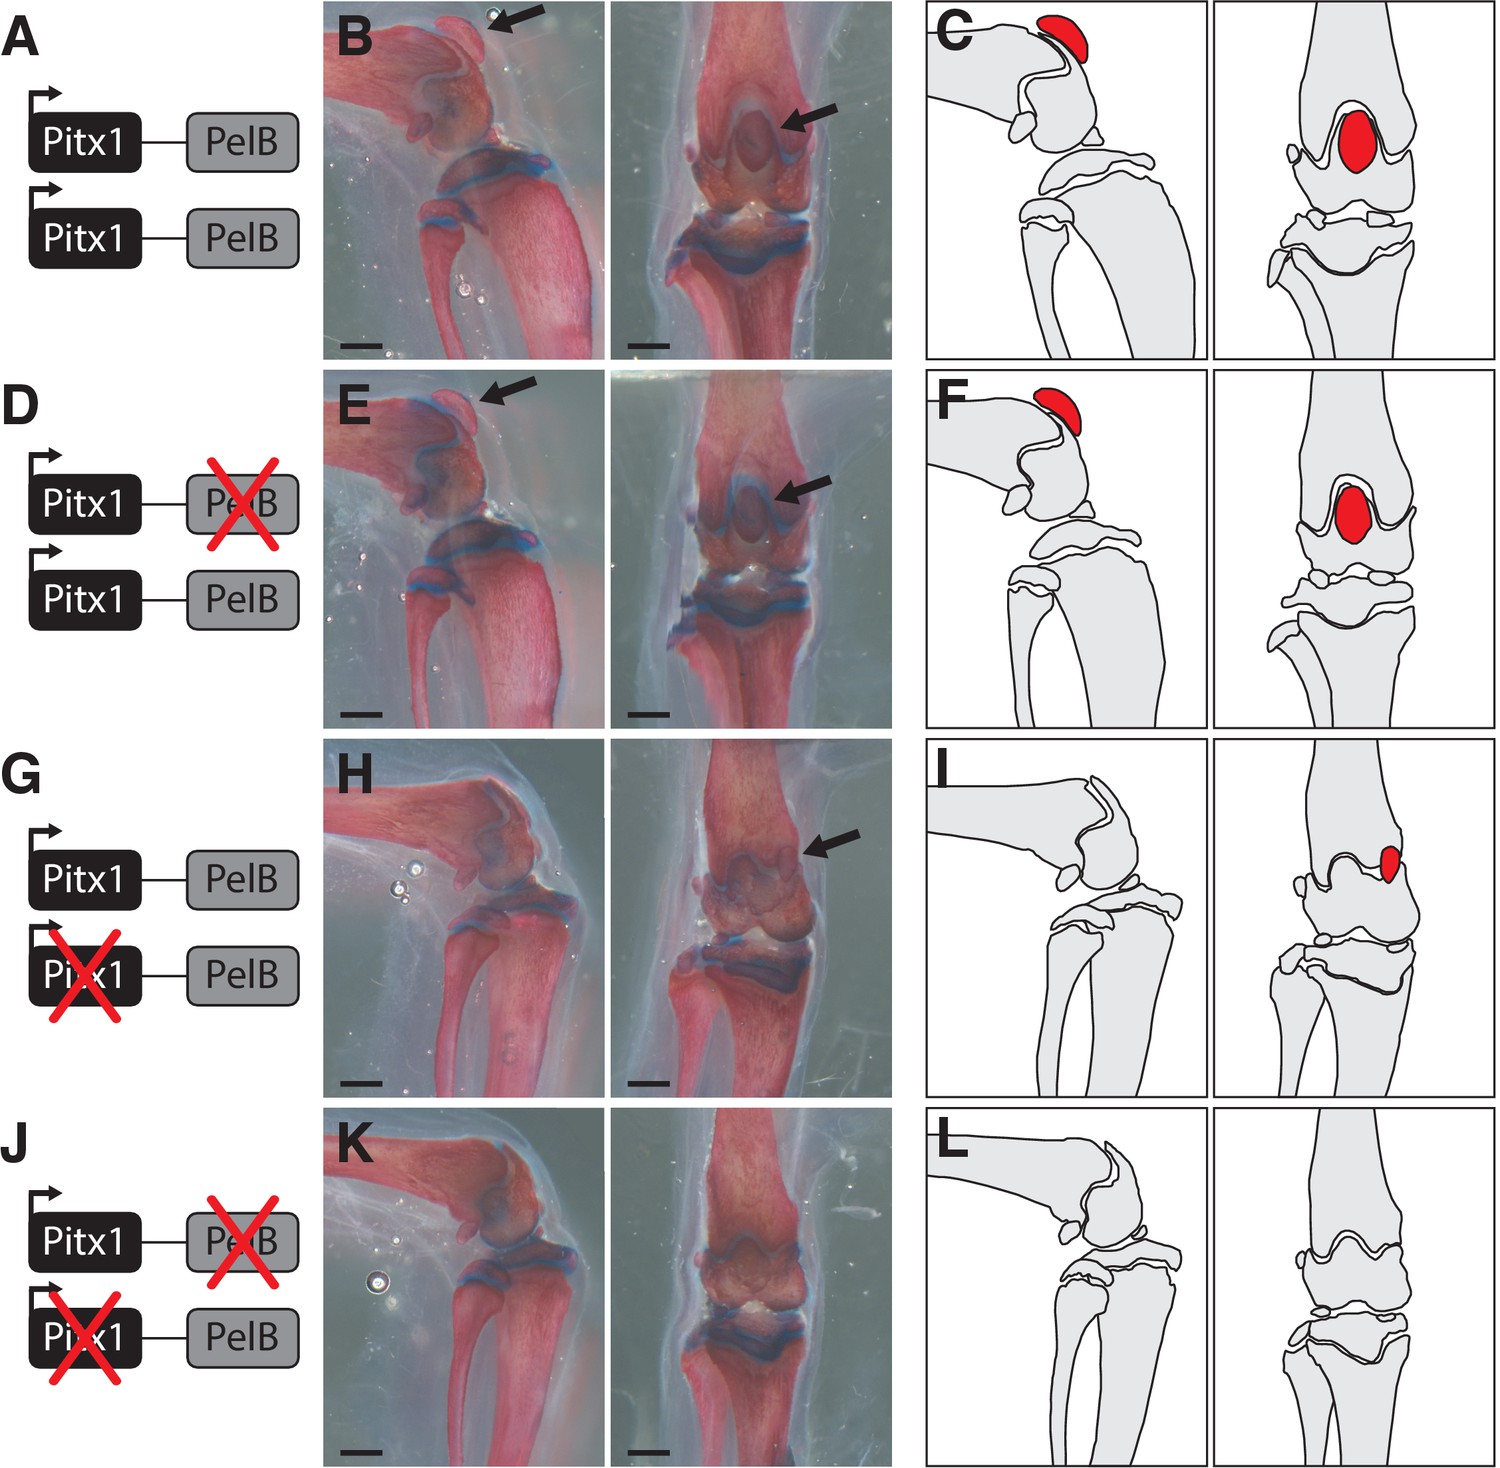
Loss of patellae in mice missing the PelB enhancer and one functional copy of Pitx1.
(A,D,G,J) Gene diagrams showing the status of the PelB enhancer and Pitx1 coding region produced by crossing PelB knockout and Pitx1 null mutant lines. (B,E,H,K) Mouse knee joint, with patellae indicated with a black arrow. Scale bars = 1 mm. (C,F,I,L) Outlines of bones, with patellae highlighted in red.
Figure 5 with 4 supplements
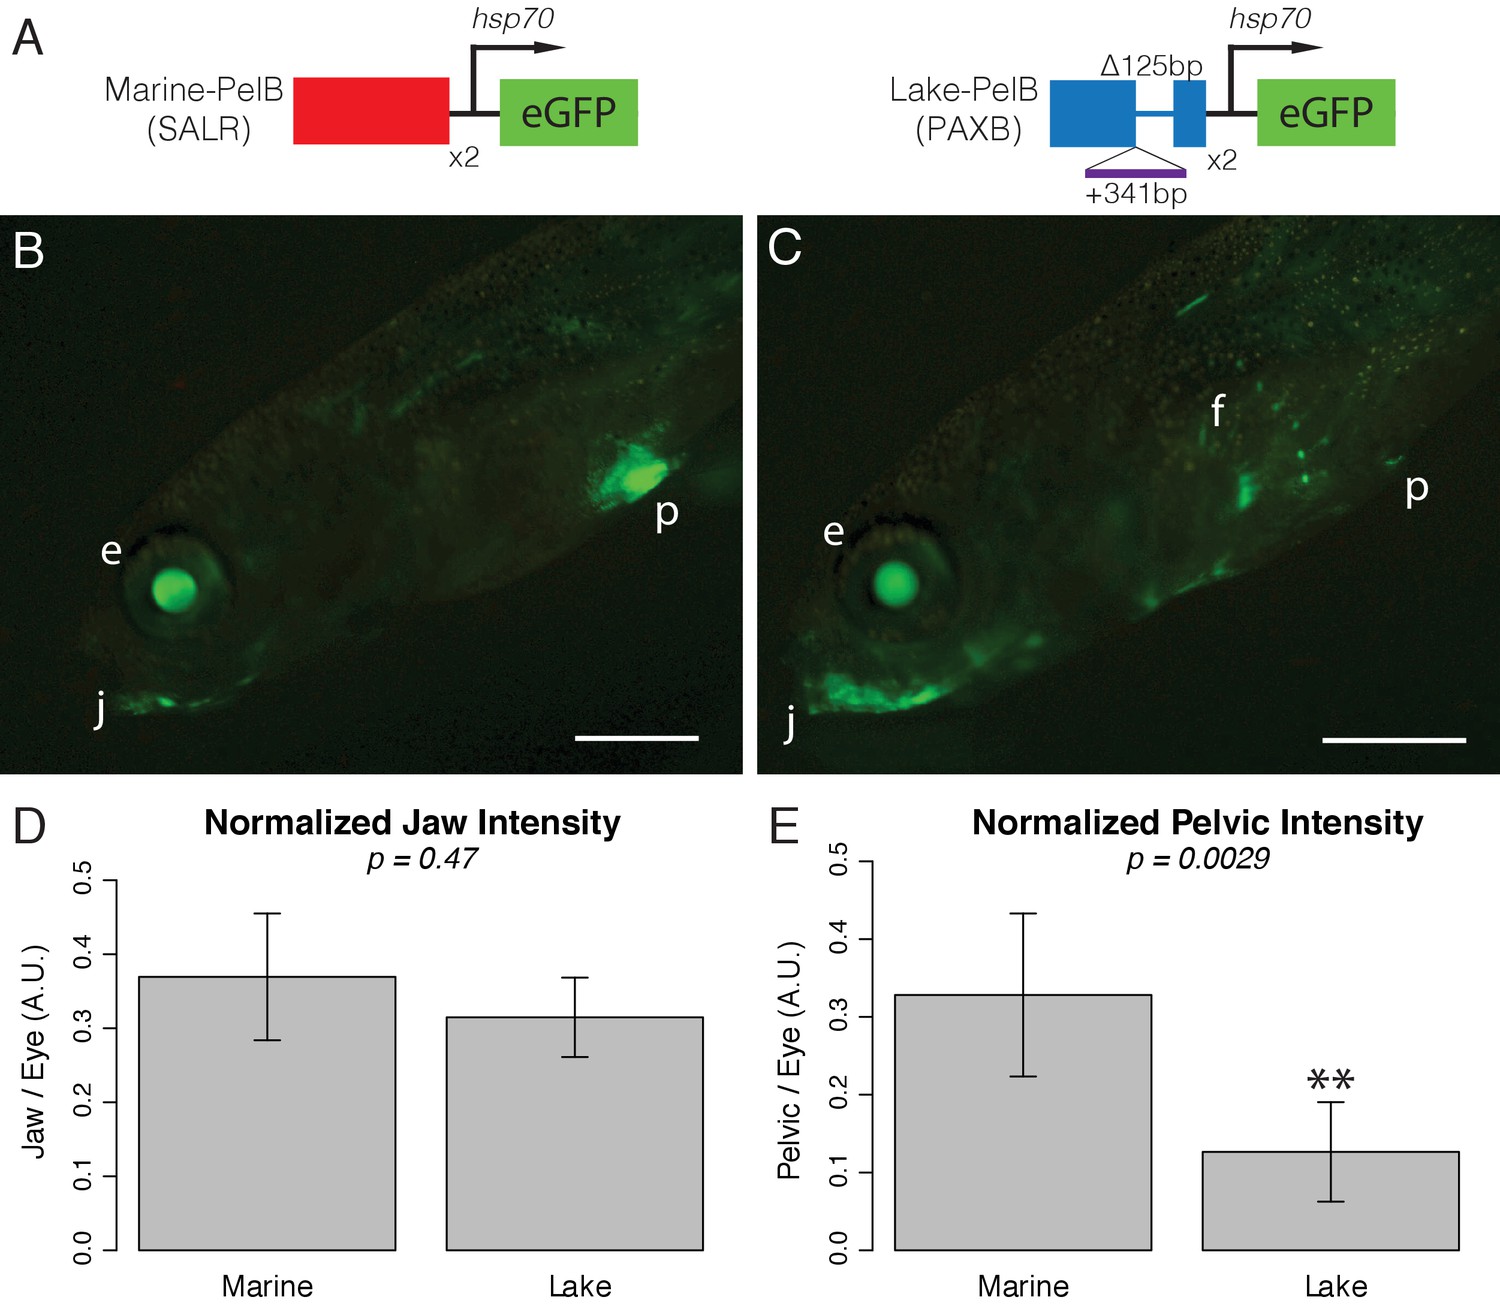
PelB enhancer function is conserved to fish.
(A) Schematic of enhancer constructs tested in stickleback fish. Each enhancer was cloned as a 2x concatemer upstream of an hsp70 promoter and eGFP. The marine sequence is from the Salmon River (SALR) population, and the lake sequence is from Paxton benthic (PAXB). (B-C) GFP fluorescence in live sticklebacks. GFP expression in the lens of the eye (e) is driven by the hsp70 promoter itself, allowing easy identification of transgenic fish. (B) The marine PelB enhancer drives expression in the jaw (j) and pelvis (p). (C) The lake PelB enhancer drives similar expression in the jaw (j), but significantly less expression in the pelvis (p), as well as a novel expression in the fin rays (f). (D-E) Quantified fluorescence in GFP-positive fish that show pelvic expression, normalized to intensity in the lens of the eye to control for copy number and integration site. SALR n = 24, PAXB n = 18. Scale bars = 1 mm.
Figure 5—figure supplement 1
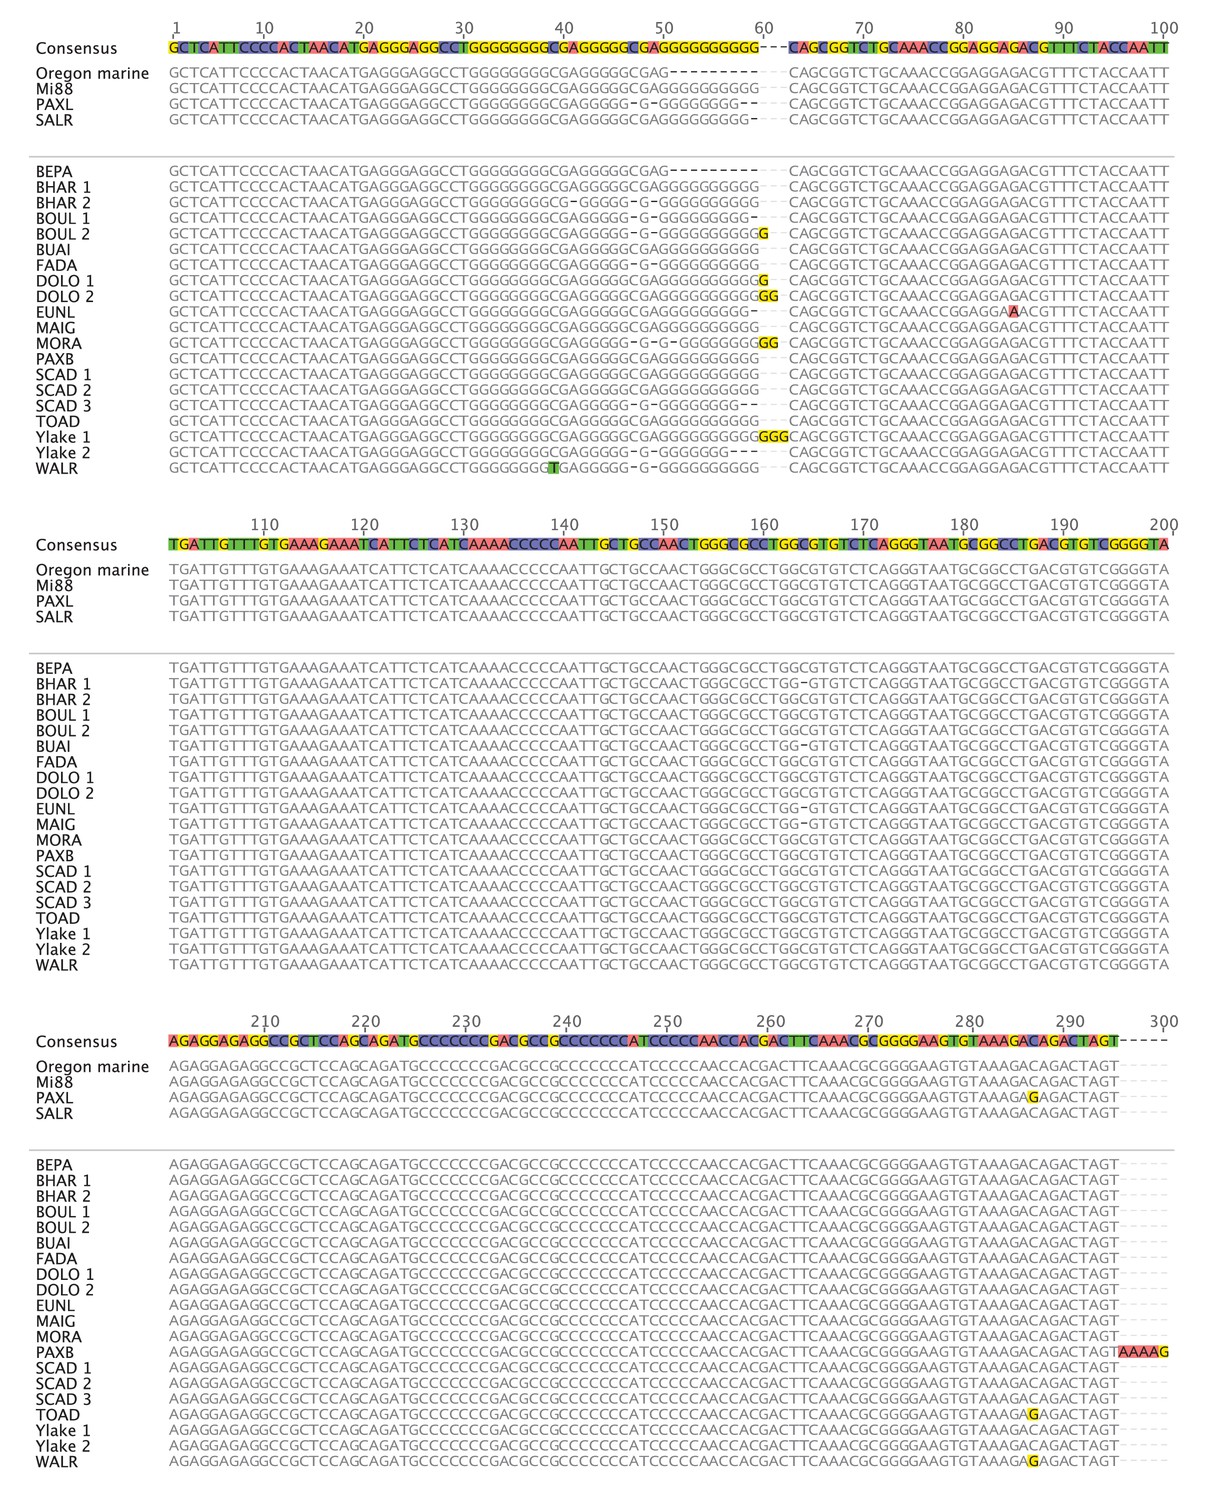
PelB sequence variation in stickleback fish (1-300).
Sequence alignment of PelB in different stickleback populations. Matches to consensus are in grey and mismatches are highlighted (A = red, T = green, G = yellow, C = blue, gaps = black dash). Pelvic-complete populations are listed in alphabetical order above the space and divider line, and pelvic-reduced populations are listed in alphabetical order below the space and divider line. Populations with more than one allele sequenced are numbered. Putative Pitx1 binding site is labeled in purple below the consensus sequence. Alignment generated in Geneious10 (Kearse et al., 2012).
Figure 5—figure supplement 2

PelB sequence variation in stickleback fish (301-600).
Sequence alignment of PelB in different stickleback populations. Matches to consensus are in grey and mismatches are highlighted (A = red, T = green, G = yellow, C = blue, gaps = black dash). Pelvic-complete populations are listed in alphabetical order above the space and divider line, and pelvic-reduced populations are listed in alphabetical order below the space and divider line. Populations with more than one allele sequenced are numbered. Putative Pitx1 binding site is labeled in purple below the consensus sequence. Alignment generated in Geneious10 (Kearse et al., 2012).
Figure 5—figure supplement 3
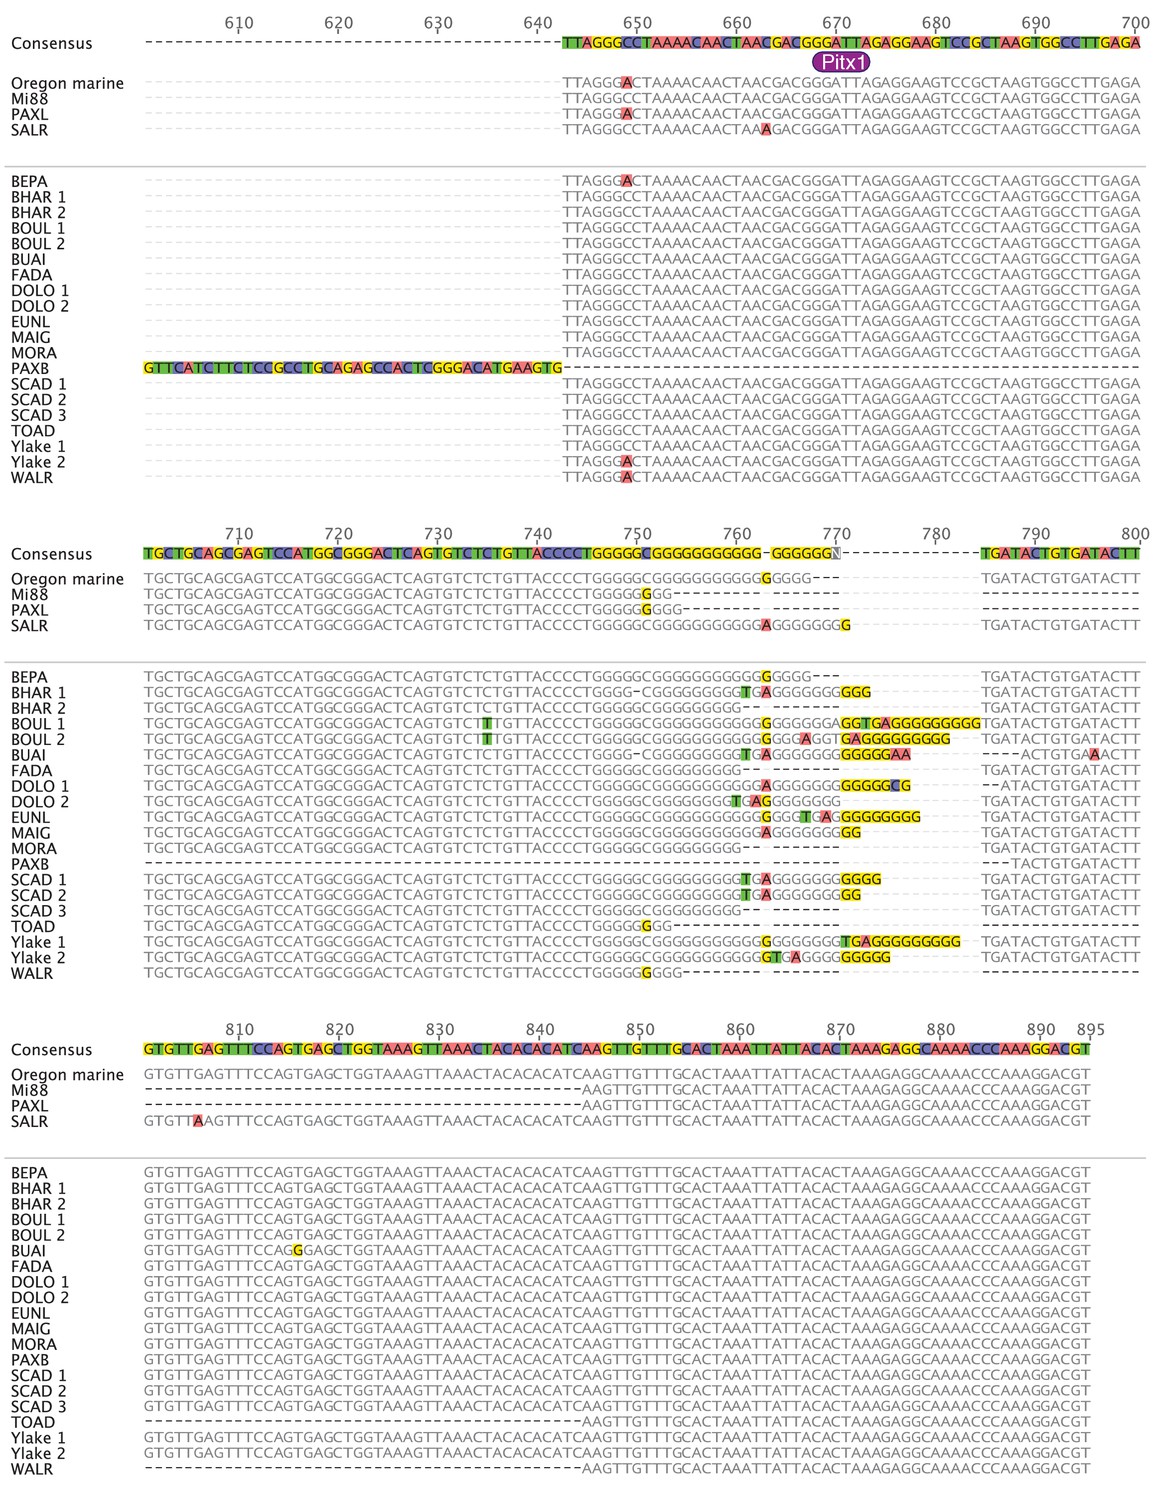
PelB sequence variation in stickleback fish (601-895).
Sequence alignment of PelB in different stickleback populations. Matches to consensus are in grey and mismatches are highlighted (A = red, T = green, G = yellow, C = blue, gaps = black dash). Pelvic-complete populations are listed in alphabetical order above the space and divider line, and pelvic-reduced populations are listed in alphabetical order below the space and divider line. Populations with more than one allele sequenced are numbered. Putative Pitx1 binding site is labeled in purple below the consensus sequence. Alignment generated in Geneious10 (Kearse et al., 2012).
Figure 5—figure supplement 4

Quantified PelB enhancer activity in stickleback fish.
Quantified fluorescence in GFP-positive fish that show pelvic expression. (A) GFP intensity of the lens of the eye. This is a constitutive pattern driven by the hsp70 promoter, which allows easy identification of transgenic animals. (B) Standard length of measured fish, in mm. (C, E) GFP intensity. (D, F) GFP intensity normalized to eye intensity to control for copy number and integration site. SALR n = 24, PAXB n = 18.
Tables
Key resources table
| Reagent type (species) or resource | Designation | Source or reference | Identifiers | Additional information |
|---|---|---|---|---|
| Gene (Mus musculus) | Pitx1 | NA | RefSeq: NM_011097.2 | |
| Gene (Mus musculus) | Pcdb2 | NA | RefSeq: NM_028281.1 | |
| Gene (Gasterosteus aculeatus) | Pitx1 | NA | NCBI GU130437.1, GU130434.1 | |
| Strain, strain background (G. aculeatus) | Salmon River marine population | DOI: 10.1126/ science.1182213 | SALR, GU130434.1 | Migratory marine fish with complete pelvis |
| Strain, strain background (G. aculeatus) | Paxton Lake benthic freshwater population | DOI: 10.1126/ science.1182213 | PAXB, GU130437.1 | Lake-resident fish with no pelvis |
| Strain, strain background (G. aculeatus) | Matadero Creek freshwater population | DOI: 10.1126/ science.1182213 | MATA | Stream-resident fish with complete pelvis |
| Genetic reagent (M. musculus) | Pitx1 coding region mutation | DOI: 10.1101/ gad.13.4.484. | Pitx1null | Knock out generated in M. Rosenfeld lab; transferred to C. Gurnett, then D. Menke, Kingsley lab. |
| Genetic reagent (M. musculus) | Pitx1 PelB deletion mutation | this paper | Pitx1PelB- | |
| Transfected construct (M. musculus) | RP23-55J18 BAC clone | bacpacresources.org/ femmouse23.htm | ||
| Transfected construct (M. musculus) | RP24-296J14 BAC clone | bacpacresources.org/ mmouse24.htm | ||
| Transfected construct (M. musculus) | RP24-353M13 BAC clone | bacpacresources.org/ mmouse24.htm | ||
| Transfected construct (M. musculus) | RP23-231P13 BAC clone | bacpacresources.org/ femmouse23.htm | ||
| Transfected construct (M. musculus) | RP23-233P6 BAC clone | bacpacresources.org/ femmouse23.htm | ||
| Transfected construct (M. musculus) | PelB-lacZ | this paper | pTCPcbd2-1 | |
| Transfected construct (M. musculus) | PelBcon1-lacZ | this paper | pTCPcbd2-4 | |
| Transfected construct (M. musculus) | PelBcon2-lacZ | this paper | pTCPcbd2-2 | |
| Transfected construct (G. aculeatus) | SALR-PelB-GFP | this paper | SALR-PelB | |
| Transfected construct (G. aculeatus) | PAXB-PelB-GFP | this paper | PAXB-PelB | |
| Recombinant DNA reagent | basal promoter lacZ vector | DOI: 10.1073/ pnas.97.4.1612 | hspLacZ | |
| Recombinant DNA reagent | basal promoter GFP vector | DOI: 10.1186/ gb-2007–8 s1-s7 | pT2HE | |
| Sequence-based reagent (M. musculus) | ENCODE DNaseI hypersensitivity peaks in developing forelimbs and hind limbs | DOI: 10.1093/ nar/gks1172 | ||
| Sequence-based reagent (M. musculus) | Pitx1 promoter-interacting regions with histone marks of enhancers | DOI: 10.1101/ gr.213066.116 | ||
| Sequence-based reagent (M. musculus) | H3K27ac peaks in developing forelimbs and hind limbs | DOI: 10.1016/ j.devcel.2015.09.003 | ||
| Sequence-based reagent (Anolis carolinensis) | H3K27ac peaks in developing forelimbs and hind limbs | DOI: 10.1016/ j.devcel.2015.09.003 |
Additional files
-
Supplementary file 1
Excel file with Supplementary Tables A though G.
(A) LacZ expression patterns in transgenic embryos carrying BAC sequences. Because only a relatively small number of embryos were obtained in injections with large BAC clones, positive patterns of expression should still be confirmed by additional studies of particular genomic regions, as done in this study for the PelB region. (B) Putative enhancer regions interacting with the Pitx1 promoter during mouse development. Andrey et. al used Capture-C methods and histone modification patterns to study chromatin interactions surrounding 446 genes during forelimb and hind limb development at three stages of mouse embryonic development, and in midbrain (Andrey et al., 2017). This table summarizes predicted enhancer regions that interact with the Pitx1 promoter, and how these regions overlap with various genomic sequences that have now been tested for functional activity using transgenic reporter constructs or knockout mice. The nomenclature used for different functionally tested regions in the current and previous studies, and the corresponding mouse genomic coordinates (mm9) and references are listed at the bottom of the table. (C) Comparison of Pitx1 and Pcdb2 expression in Pitx1+/+ and Pitx1PelB-/PelB- E12.5 hind limbs. Summary of four qRT-PCR assays showing the average relative level of Pitx1 and Pcdb2 gene expression in Pitx1+/+ (n = 7) and Pitx1PelB-/PelB- (n = 8) hind limbs following normalization to the reference gene Pgk1. The analysis was carried out with two independent sets of PCR primers for each target gene (Supplementary file 1G), and each primer set was used for replicate assays on the fifteen wild type and mutant RNA samples. SD, standard deviation; SEM, standard error of the mean. Only Pitx1 expression was significantly reduced in PelB mutant limbs, *p<0.05. (D) Pitx1+/+ vs. Pitx1PelB-/PelB- mice. Pitx1+/+ n=21, Pitx1PelB-/PelB- n = 20. Yellow = p < 0.01, Orange = p < 0.001, Red = p < 0.0001. (E) Pitx1+/+ vs. Pitx1null/+ mice. Pitx1+/+ n=20, Pitx1null/+ n=22. Yellow = p < 0.01, Orange = p < 0.001, Red = p < 0.0001. (F) Pitx1null/+ vs. Pitx1null/PelB- mice. Pitx1null/+ n=22, Pitx1null/PelB-n = 22. Yellow = p < 0.01, Orange = p < 0.001, Red = p < 0.0001. (G) Primers used in this study.
- https://doi.org/10.7554/eLife.38555.013
-
Transparent reporting form
- https://doi.org/10.7554/eLife.38555.014
Download links
A two-part list of links to download the article, or parts of the article, in various formats.
Downloads (link to download the article as PDF)
Open citations (links to open the citations from this article in various online reference manager services)
Cite this article (links to download the citations from this article in formats compatible with various reference manager tools)
A novel enhancer near the Pitx1 gene influences development and evolution of pelvic appendages in vertebrates
eLife 7:e38555.
https://doi.org/10.7554/eLife.38555


