Inhibition enhances spatially-specific calcium encoding of synaptic input patterns in a biologically constrained model
- George Mason University, United States
- Krasnow Institute for Advanced Study, George Mason University, United States
Figures
Figure 1 with 2 supplements

Spiny Projection Neuron model reproduces electrophysiology and calcium imaging data.
(A) Model schematic of morphology (left) and calcium dynamics in spine and dendrite (right). Characteristic morphology with dendritic spines is based on estimated values from morphological reconstructions, including tapered dendrites. The model contains ionic and synaptic channels (not depicted). Right: a single spine and parent dendritic compartment showing axial diffusion layers in the spine head and neck and radial diffusion shells in the dendrite. The model includes sophisticated Ca dynamics (red circles indicate calcium ions): diffusion (green arrows), buffers (blue squares - calmodulin, calbindin, fixed buffer; reversible reaction with calcium indicated by black reaction arrows), pump extrusion (purple arrows), and influx via voltage-gated calcium channels (VGCCs; orange arrows) and synaptic (NMDA/AMPA) channels (blue arrows). (B) Model exhibits similar response to electrophysiological current injection steps, including characteristic sag following hyperpolarizing current, latency to first action potential, firing rate, and AHP shape (Nisenbaum and Wilson, 1995). (C) Model calcium dynamics (red) are consistent with experiments (blue) for dendritic calcium (left) vs. distance from soma in response to a back-propagating action potential (bAP) and for spine calcium (right) in response to a bAP or synaptic stimulation (EPSP). Legend entries refer to published experimental calcium imaging data; D1 or D2 refers to dopamine receptor expression of identified SPNs: (Day et al., 2008; Kerr and Plenz, 2002; Shindou et al., 2011). Figure 1—figure supplement 1 shows peak spine calcium sensitivity to parameter variations; Figure 1—figure supplement 2 shows the fate of calcium entering a spine during an EPSP.
Figure 1—figure supplement 1
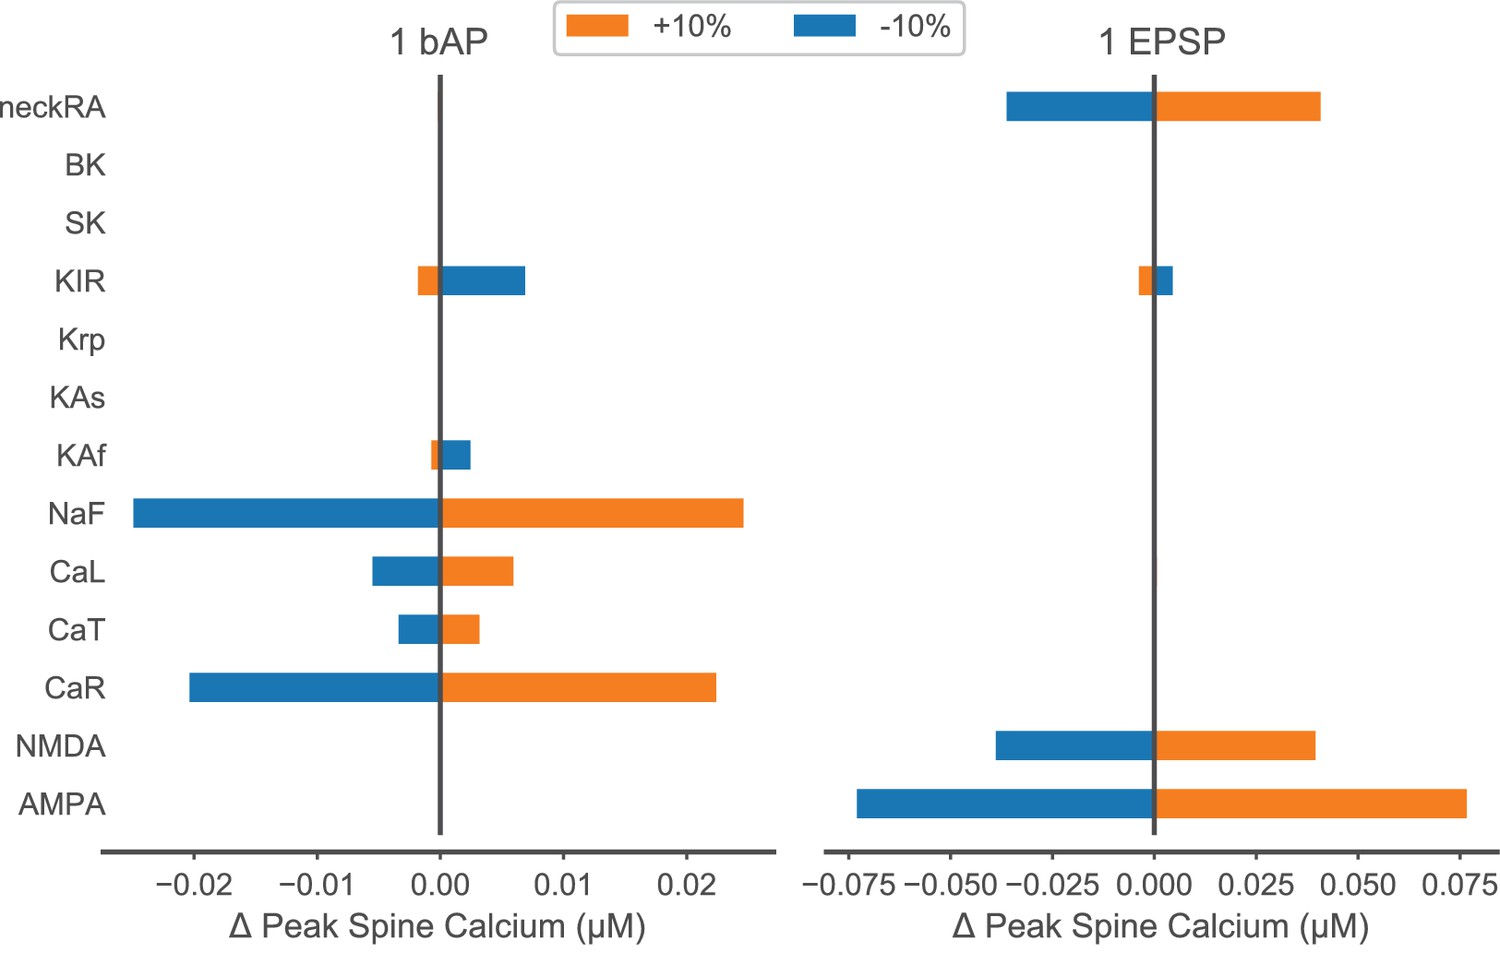
Parameter sensitivity for peak spine calcium concentration in response to a single bAP or EPSP.
Model parameters listed in the left column were varied by ±10% during simulation of one back-propagating action potential (bAP – left) or synaptic stimulation of one spine (one EPSP – right). The amount that each parameter variation changed peak spine calcium concentration is plotted on the x axis with respect to the control (zero change) peak spine calcium. For a bAP, a 20 nM change is 10% of the control, and for an EPSP, a 75 nM change is 30% of control; these values fall within the reported experimental variance (Shindou et al., 2011). Parameters are ordered by type of mechanism: ligand-gated channels; inward currents through voltage-gated calcium or sodium channels; outward currents through potassium channels; calcium dynamics; and spine neck resistance (neckRA).
Figure 1—figure supplement 2

Fate of calcium entering a spine during an EPSP.
The quantity of free calcium, buffer bound calcium, calcium extruded by pumps, and calcium that diffuses out of a dendritic spine head is shown for the first 100 ms following synaptic stimulation, to facilitate comparison with Bartol et al.(2015).
Figure 2
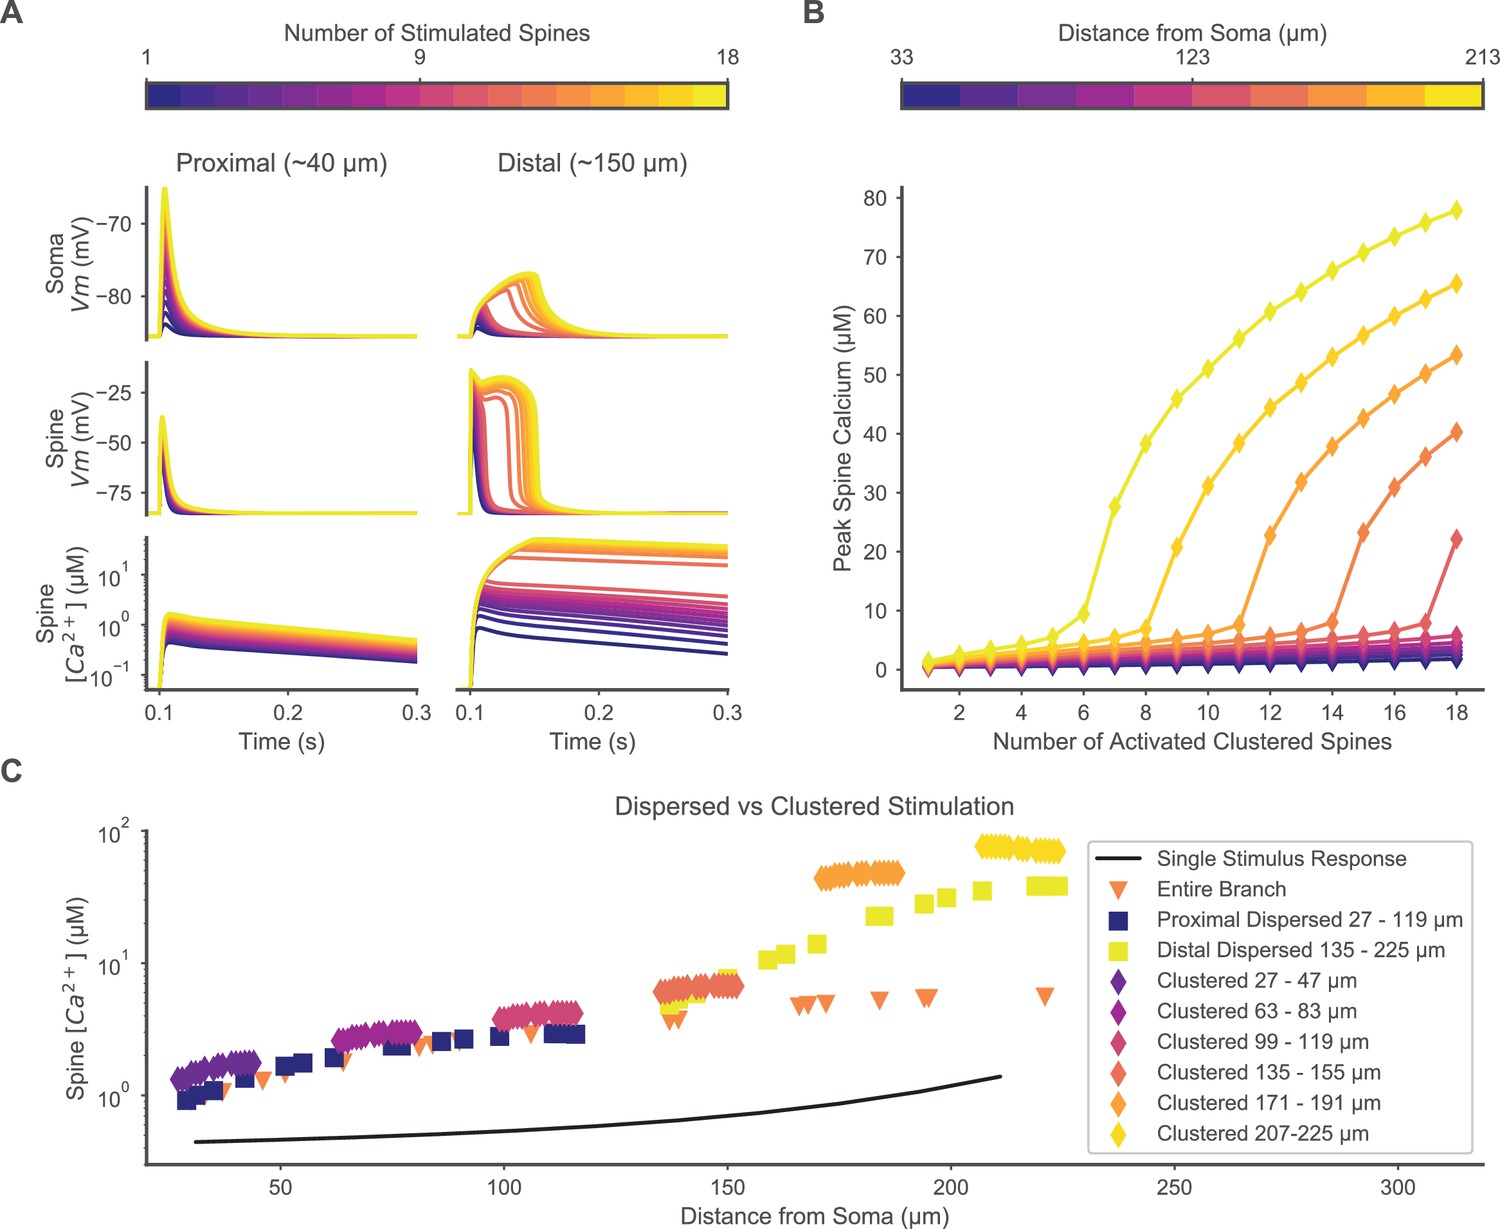
Clustered or dispersed distal synaptic inputs produce supralinear spine calcium elevation.
(A) Synchronous stimulation of 1 – 18 clustered spines located distally (right) but not proximally (left) produces supralinear duration of depolarization at the soma (top) and stimulated spine (middle), and supralinear spine calcium elevation (bottom) for 12 or more spines. Spine membrane potential and calcium concentration traces are shown for only one spine per simulation. (B) Varying the location of 1 – 18 clustered synaptic inputs along the dendrite shows a distance-dependent threshold for supralinear spine calcium elevation, with fewer spines required at increasing distances from the soma. (C) Distal dispersed synaptic inputs also evoke supralinear calcium elevation. Peak spine calcium on a log scale is shown for each synaptically stimulated spine, for various spatial distributions of synaptic inputs, vs. the distance of each stimulated spine from the soma. Clustered diamonds indicate clustered stimulation of 16 spines with increasing distance from the soma, showing supralinear calcium distally. Spatially distributing 16 inputs distally (yellow squares) or proximally (dark blue squares) shows that distally located spatially dispersed synaptic inputs still produce supralinear spine calcium elevation. Distributing 20 inputs over the entire branch (orange triangles) fails to evoke supralinear calcium elevation. Synaptic inputs spatially dispersed over the proximal half of the branch reduce spine calcium elevation compared to the proximally clustered inputs, indicating that a small level of cooperativity can occur among proximal synaptic inputs despite the absence of a plateau potential. The unitary peak spine calcium for stimulation of only one spine at various distances from the soma is shown (black line) for reference.
Figure 3
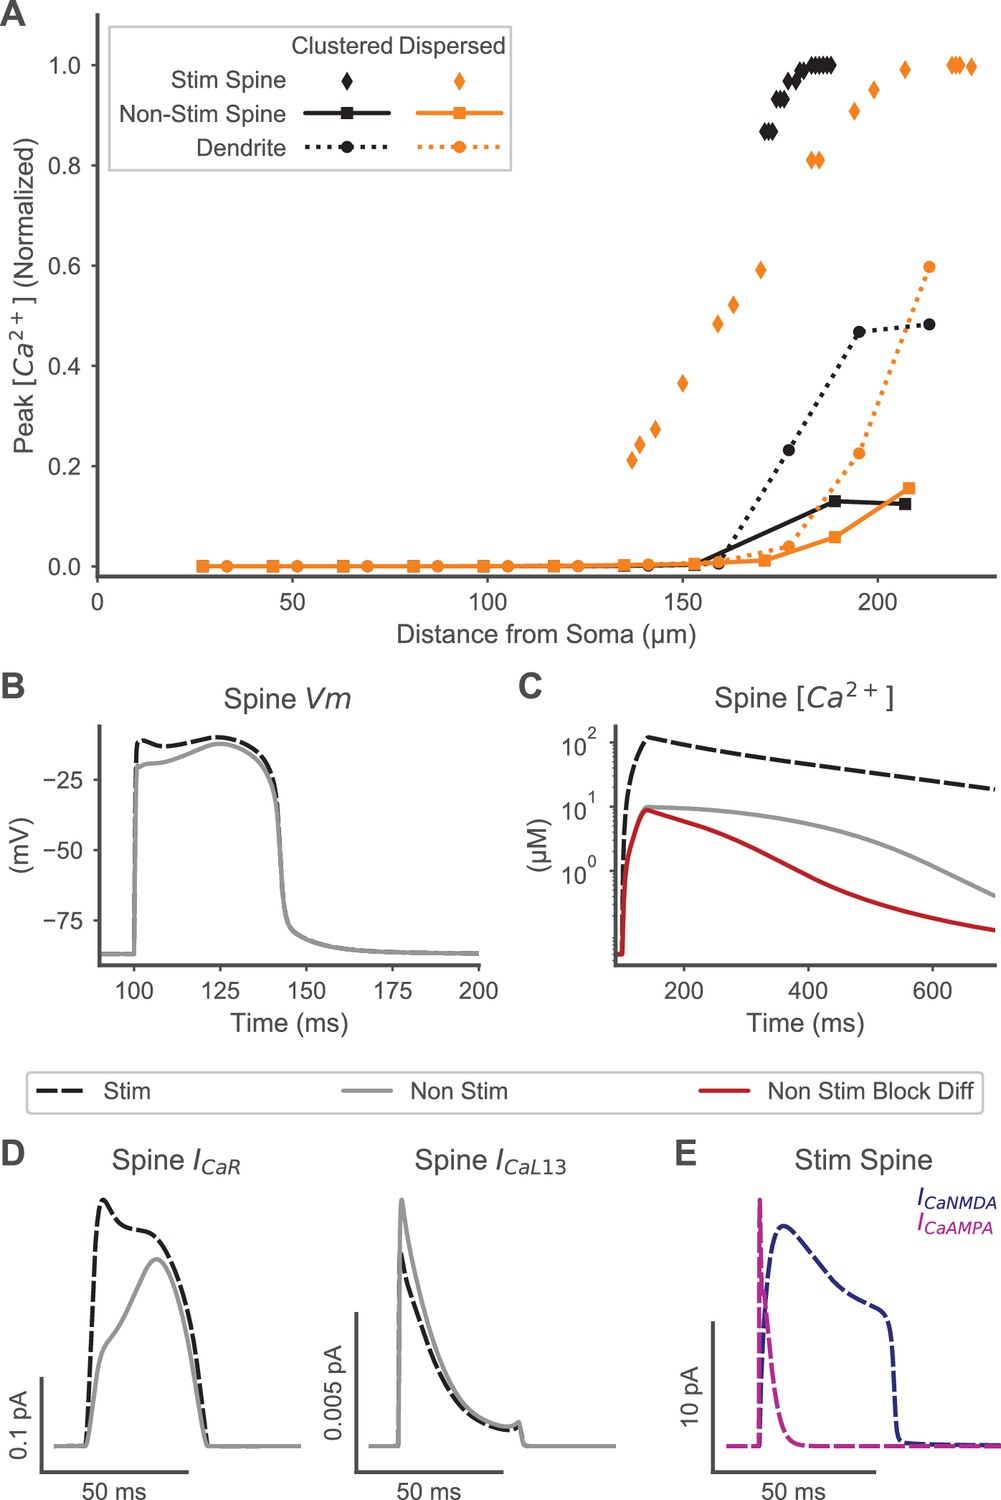
Spine calcium elevation exhibits spatial specificity for both clustered and distributed synaptic inputs.
(A) Supralinear calcium elevation is limited to stimulated spines (diamonds) with neighboring non-stimulated spines (squares) exhibiting an order of magnitude lower peak calcium for both clustered (orange) and dispersed (black) inputs. Calcium elevation in the dendrite (circles) and non-stimulated spines also exhibits spatial specificity, with smaller calcium elevations limited to the distal dendrite near the site of stimulation and negligible calcium elevations observed proximally. (B) Spine membrane potential (Vm) is similar for a stimulated (black dashed) or non-stimulated neighboring (gray line) spine during clustered stimulation (as in (A)). (C) Spine calcium concentration (corresponding to Vm in (B)) is an order of magnitude higher in a stimulated spine than a non-stimulated neighboring spine. When diffusion is blocked (red trace) between non-stimulated spines and the dendritic shaft, VGCC contributions to non-stimulated spine calcium elevation are isolated, revealing that VGCCs contribute to the peak calcium, but diffusion contributes to the later phase of calcium elevation in non-stimulated neighboring spines. (D) VGCC currents in a stimulated and neighboring non-stimulated spine (as in (B-C)) are shown for a high voltage activated (CaR, left) and low voltage activated (CaL1.3, right) channel, indicating that VGCCs contribute to calcium elevation in both spines. Note that (B-D) share a common legend. (E) Synaptic calcium currents are shown for the stimulated spine, indicating that NMDAR and Ca-permeable AMPAR channels underlie the stimulus-specific spine calcium elevation.
Figure 4
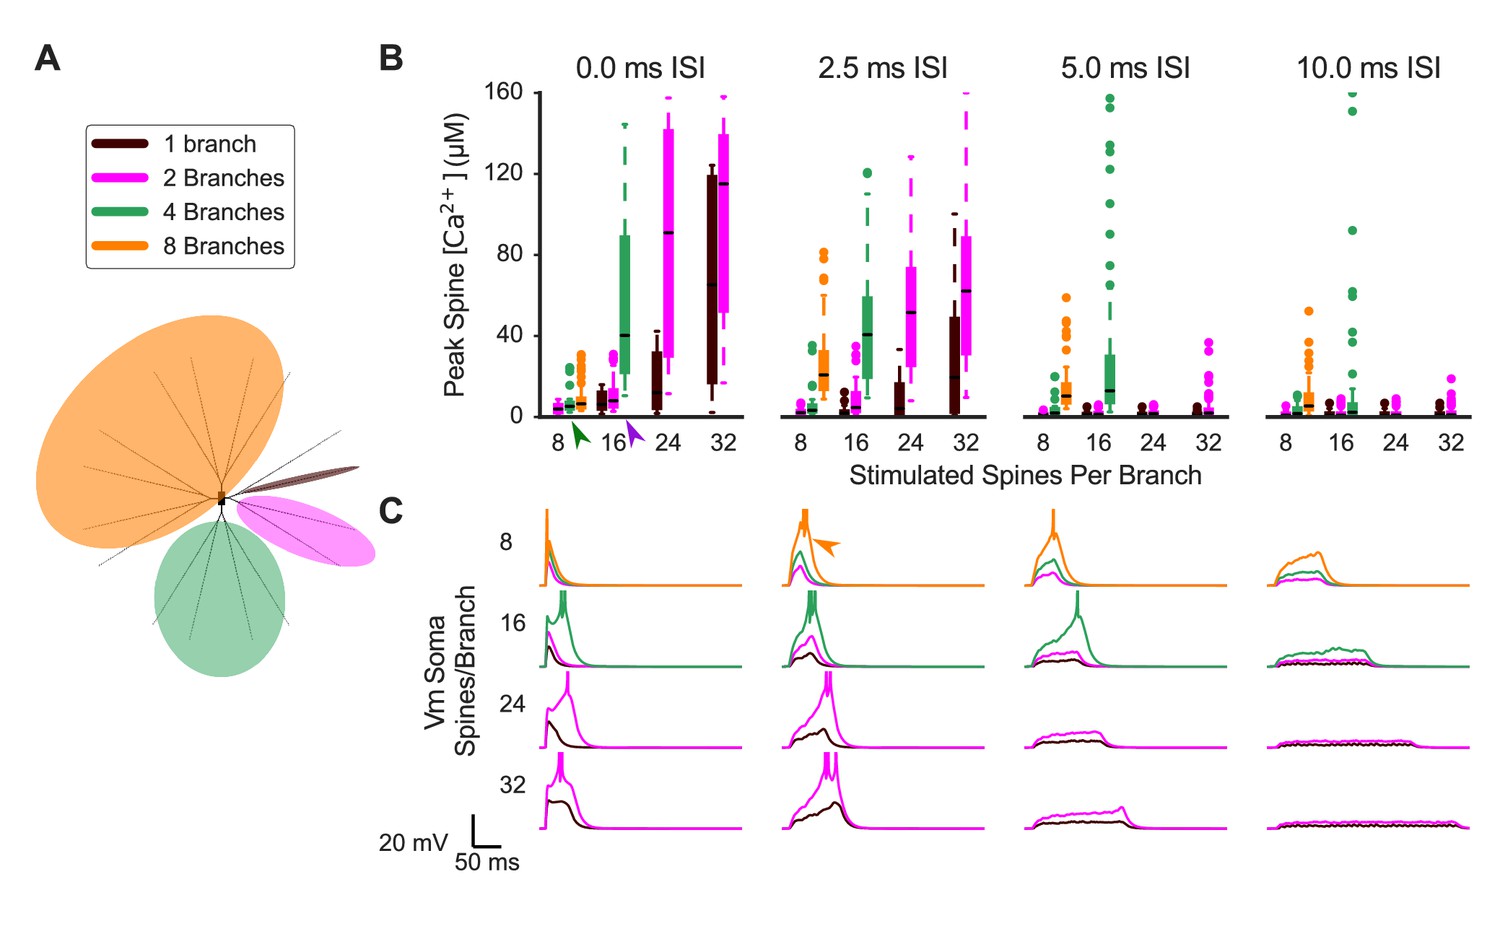
Synaptic cooperativity is strongest for synaptic inputs located on the same dendritic branch.
(A) Schematic indicates spatiotemporally distributed inputs to one, two, four, or eight dendritic branches (legend colors also correspond to (B) and (C). (B) Peak spine calcium for all stimulated spines is shown as a box and whisker plot with outliers for various patterns of spatiotemporally distributed inputs. Eight, 16, 24, or 32 spines per branch are stimulated with one, two, four, or eight total branches being stimulated for 0, 2.5, 5, or 10 ms mean interstimulus interval per branch (panels left to right). Stimulating multiple branches with the same number of spines/branch does not strongly affect spine calcium elevation (e.g. green arrowhead, eight spines per branch on two to eight branches with 0.0 ISI), indicating branch independence. However, near threshold (e.g. purple arrowhead, 16 spines/branch on two versus four branches for 0.0 ms ISI), stimulating multiple branches enhances spine calcium elevation, indicating small branch interactions whereby inputs to other branches can reduce the threshold of required inputs on a branch for supralinear spine calcium elevation. Spine calcium elevation decreases with increasing ISI (i.e. decreased peak calcium in panels from left to right), indicating that cooperation among synaptic inputs is limited to a temporal window of 10 s of ms. Note that for temporally distributed simulations, the ISIs are exponentially distributed with the average value indicated. The average ISI per branch means (for example) that an average ISI of 10 ms per branch corresponds to a total average ISI of 5 ms for all inputs when two branches are stimulated, and 2.5 ms for all inputs when four total branches are stimulated. The order of inputs was randomly applied and followed no spatial pattern. (C) Soma membrane potential corresponding to spine calcium concentration measures in (B). Plateau potential duration corresponds to spine calcium supralinearity. Action potentials are clipped in voltage traces. In some cases (e.g. orange arrowhead), increasing ISI from 0 to 2.5 ms enhances cooperativity among synaptic inputs, as it prolongs the duration of the plateau potential.
Figure 5
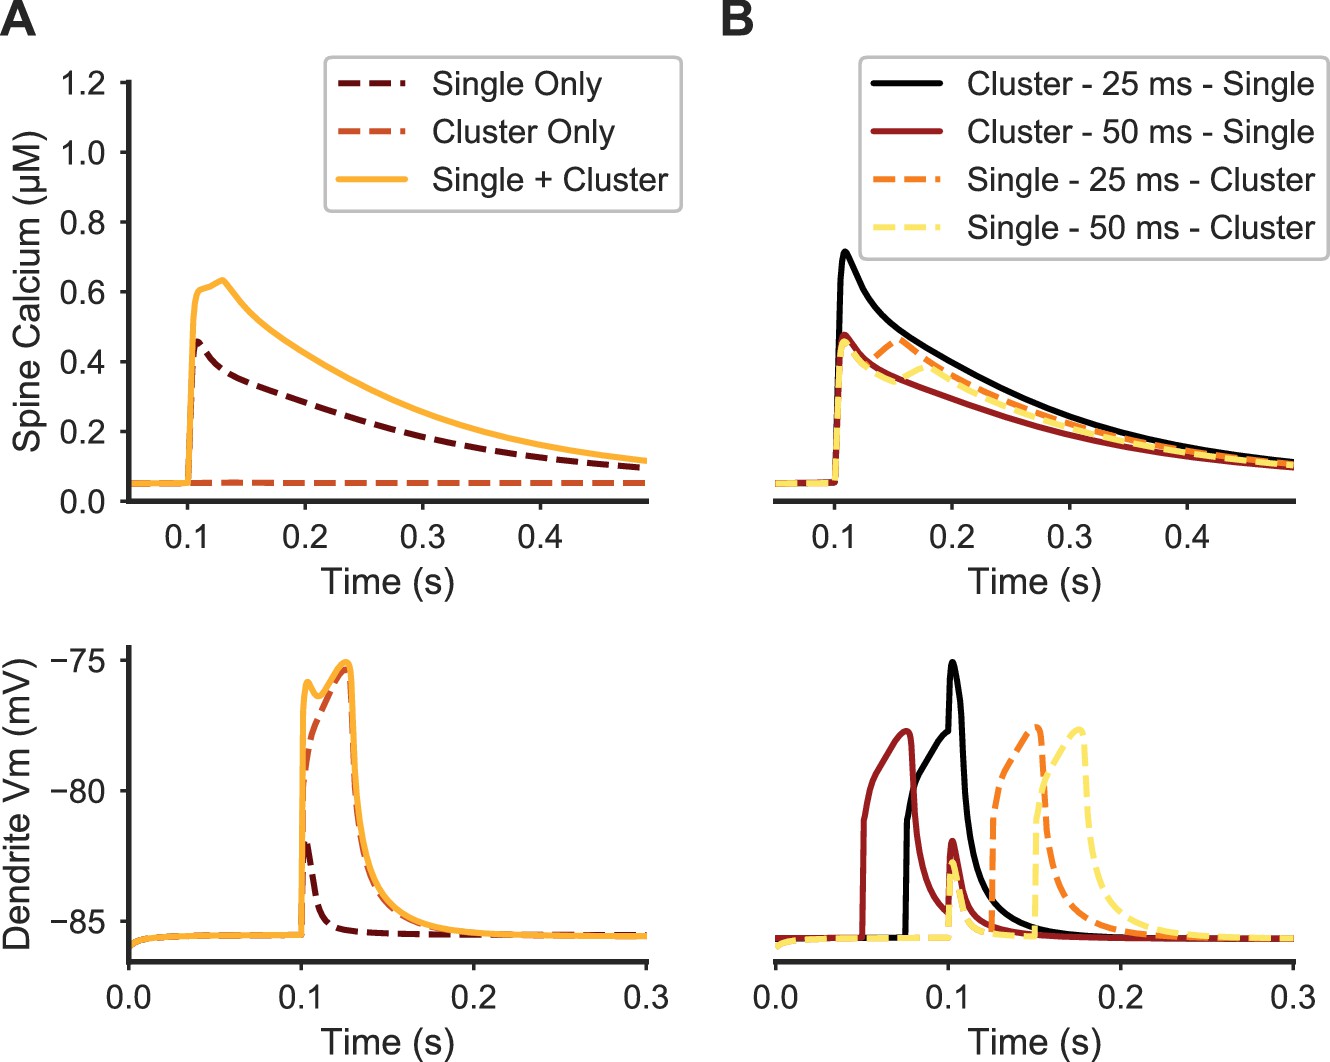
Paired stimulation of clustered distal spines and a single proximal spine produces elevated calcium in the proximal spine.
(A) Spine calcium traces (top) are shown for a single proximal spine, either when synaptically stimulated alone (dark dashed line); unstimulated during synaptic stimulation of clustered distal spines (light dashed line); or stimulated simultaneously with clustered distal stimulation (solid yellow line). Proximal spine calcium elevation is higher when stimulated with clustered distal stimulation than the sum of the proximal spine calcium responses to only distal cluster stimulation and only proximal spine stimulation. Corresponding membrane potential at the dendritic shaft is shown below. (B) Temporal dependence governing the interaction between proximal synaptic stimulation (same y axis as (A)) and synaptic stimulation of a distal cluster of spines. Traces are temporally aligned to the onset of stimulation of the proximal spine synapse, while paired with distal clustered spine stimulation at varying temporal intervals. When the distal cluster stimulation precedes the single proximal synaptic input by 25 ms (black trace), elevated calcium is produced in the proximal spine, but not for a longer delay (50 ms) or when the single proximal stimulus precedes the distal clustered stimulation. Dendritic membrane potential traces (bottom) show the temporal dependence of peak calcium facilitation on depolarization in the proximal dendritic shaft; in each trace, the proximal stimulus occurs at 0.1 ms on the x axis.
Figure 6 with 1 supplement
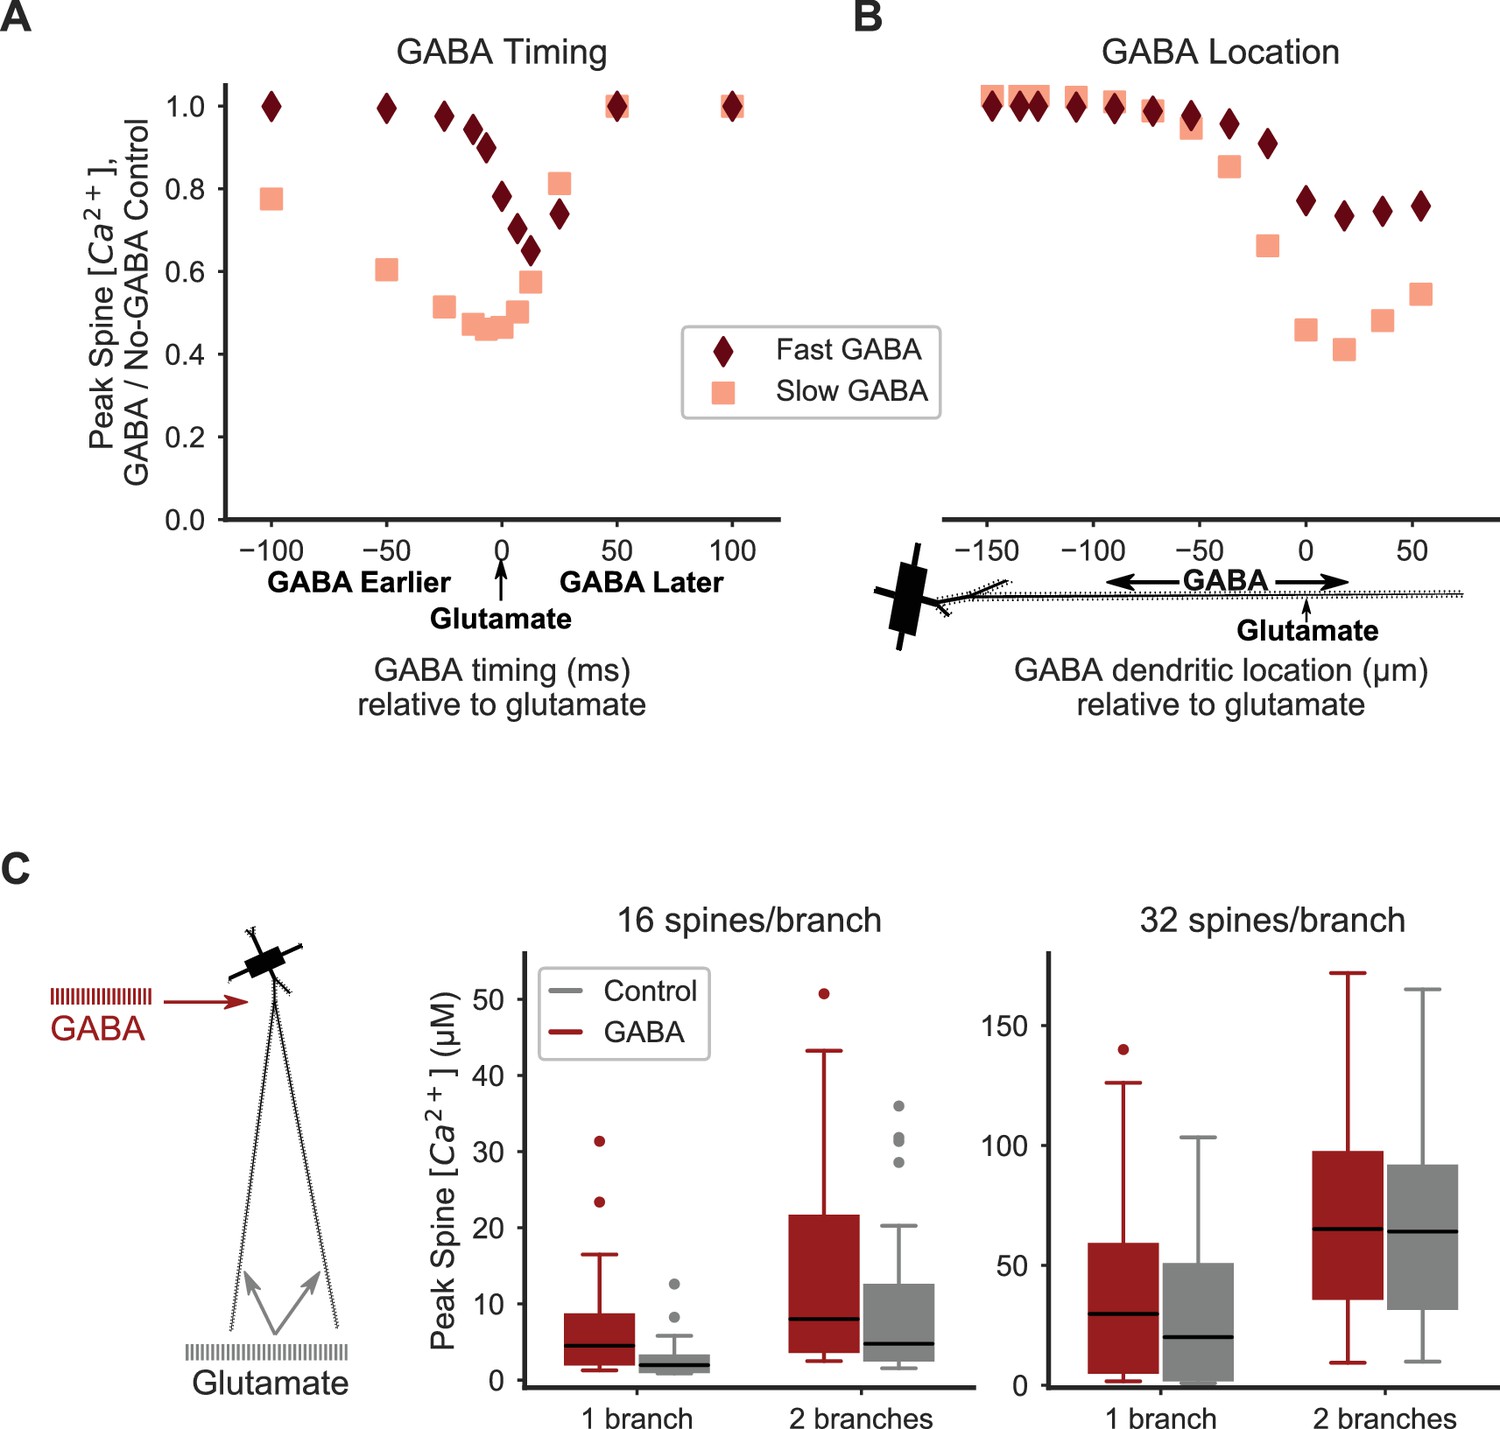
Distal inhibition attenuates synaptic cooperativity while proximal inhibition enhances synaptic cooperativity.
(A) Attenuation of spine calcium elevation by inhibition is timing-dependent. GABAergic stimulation attenuates the spine calcium elevation evoked by coordinated glutamatergic stimulation when GABAergic stimulation occurs between 25 ms before to 50 ms after glutamateric stimulation for fast GABAA kinetics, or 100 ms before to 50 ms after glutamatergic stimulation for slow GABAA kinetics. The GABAergic synapse was located on the dendritic shaft at the same location as clustered glutamatergic stimulation of 16 distally located neighboring spines. (B) Attenuation of spine calcium elevation by inhibition is location-dependent. GABAergic stimulation simultaneous with glutamatergic stimulation (of 16 distal, neighboring spines) attenuates supralinear spine calcium elevation when the GABAergic stimulation is located distally, near the clustered glutamatergic stimulation, whereas single proximal GABAergic synaptic inputs have little effect. For both A-B, peak spine calcium is normalized to the no-GABA control, and fast (diamonds) or slow (squares) GABAA kinetics correspond to GABAA synapses from SPNs, LTSIs, FSIs (fast), or NGFs (slow). (C) Strong proximal inhibitory input, corresponding to FSIs, enhances supralinear spine calcium elevation for sub- or near-threshold stimulations (16 spines per branch on one or two branches). The peak calcium elevation in all stimulated spines is shown as box-and-whisker plots. The effect of inhibition (GABA; red bars) on peak spine calcium in stimulated spines is higher than control (gray bars) for 16 spines per branch (left) but not 32 spines per branch (right). Both excitatory and inhibitory synapses were stimulated during the same time frame in these simulations. Figure 6—figure supplement 1 shows the peak spine calcium vs. dendritic location for each stimulated spine.
Figure 6—figure supplement 1
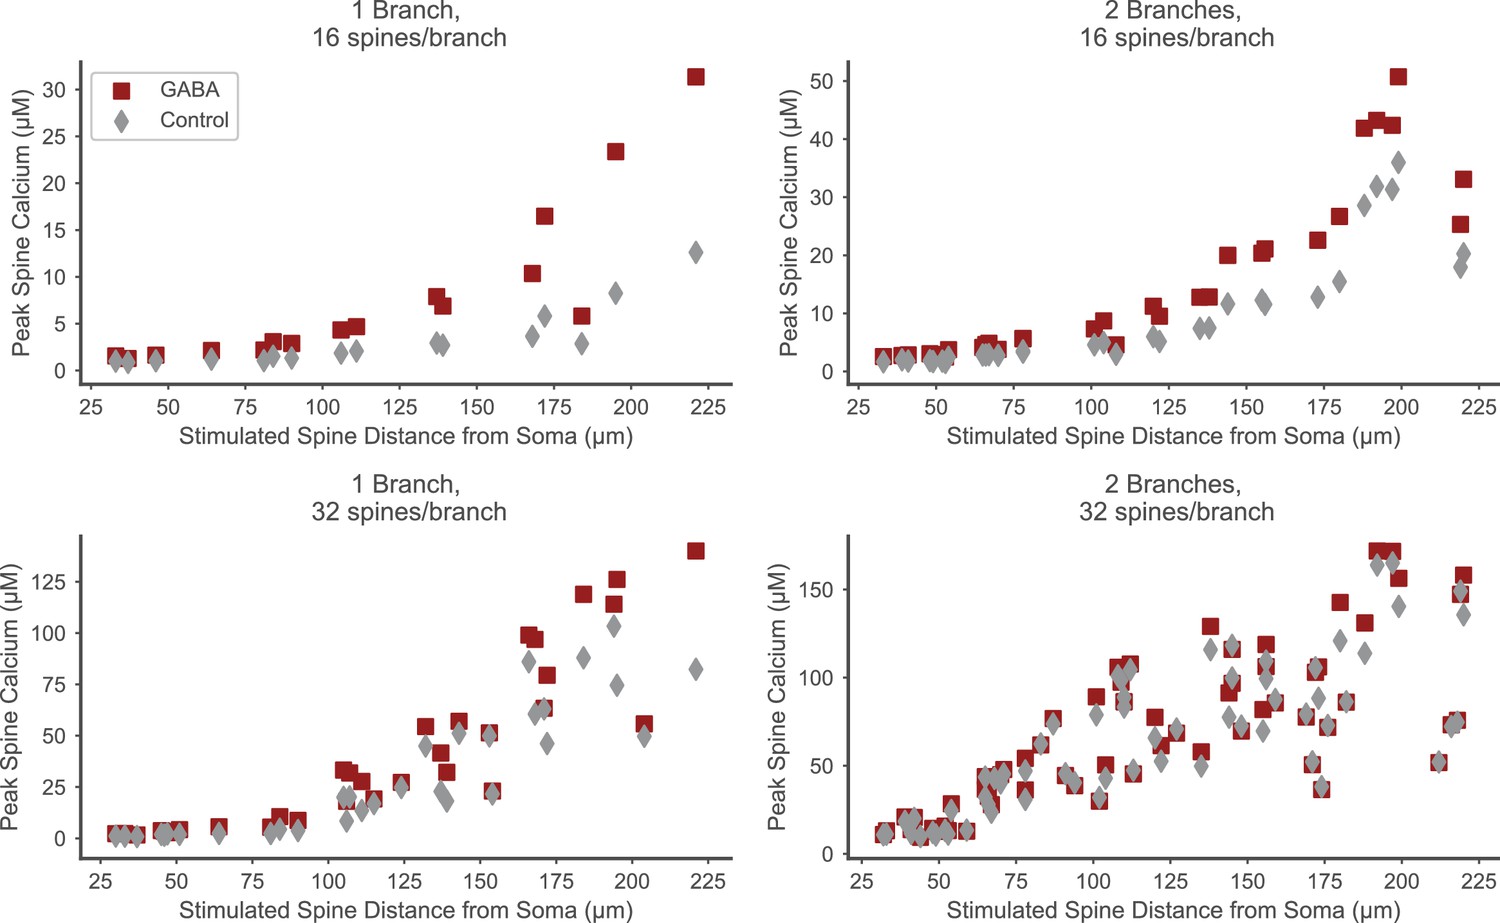
Distal spines exhibit elevated calcium in the presence of strong proximal inhibition.
The facilitating effect of proximal GABAergic input trains on spine calcium elevation is seen in distal, but not proximal spines, and is stronger for lower excitatory input levels (e.g. upper left panel, 16 stimulated spines on one branch). Peak spine calcium values in stimulated spines (y axes) are plotted versus the location (distance from soma) of each stimulated spine (x axes) in the presence of strong proximal inhibition (red squares) or in the control condition without inhibition (gray diamonds). Each panel corresponds to the number of stimulated spines per branch and the total number of stimulated branches as in Figure 6C.
Figure 7 with 2 supplements
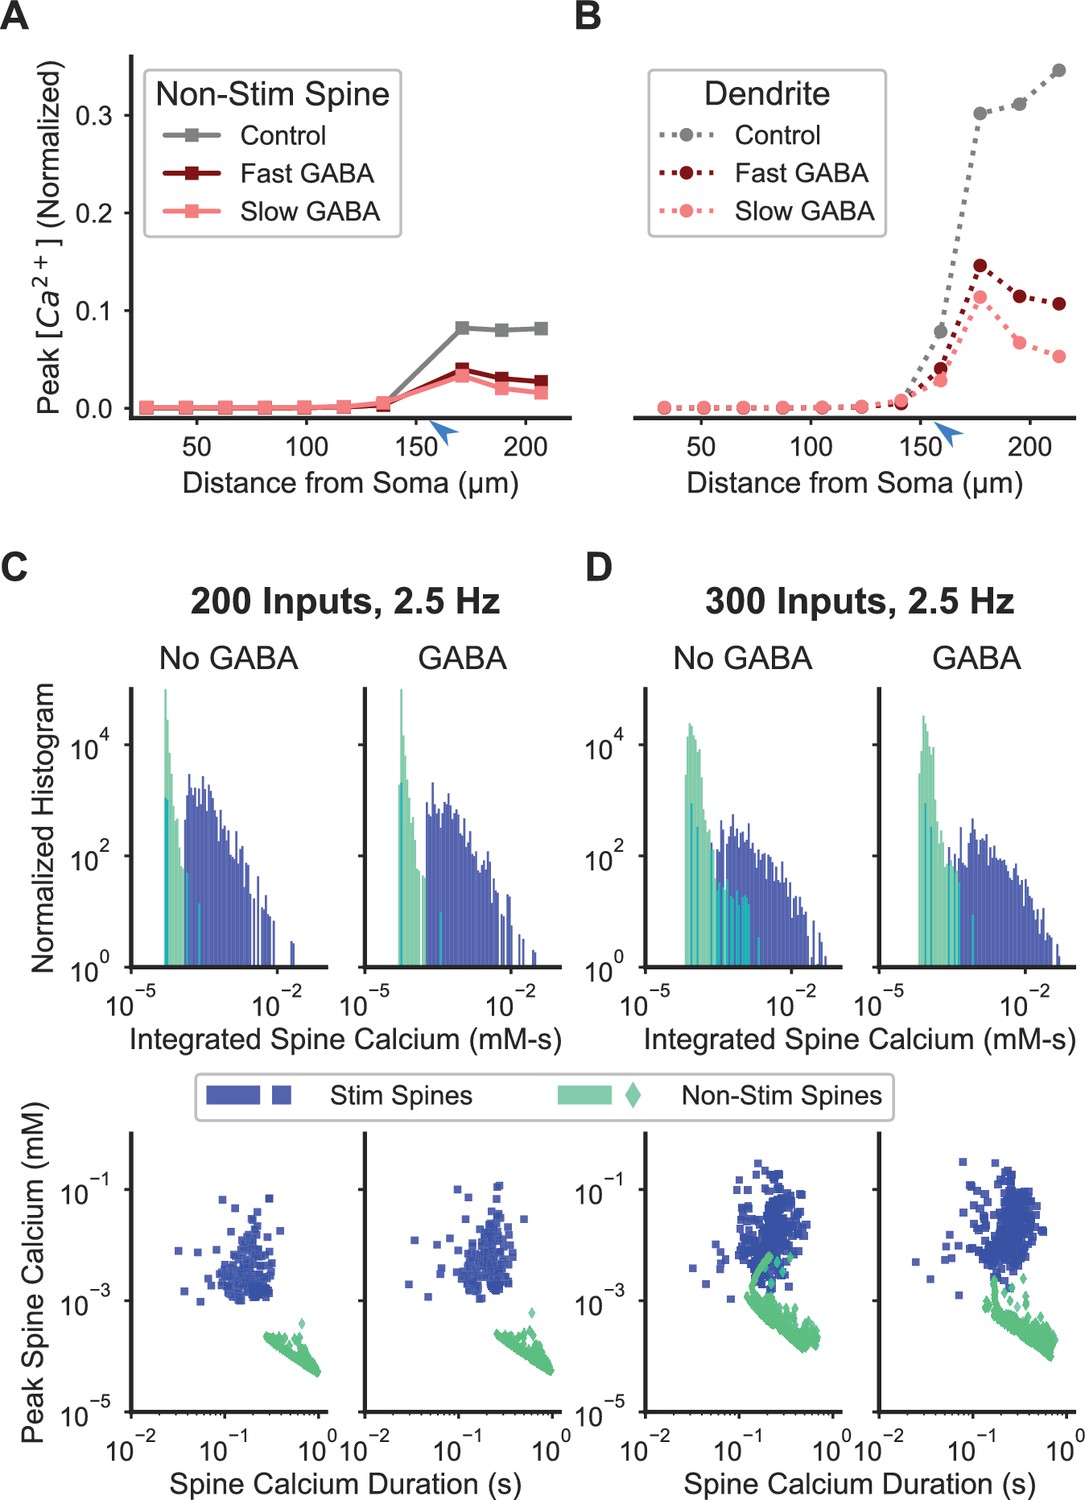
Inhibition enhances spatial specificity of spine calcium elevation.
(A–B) Stimulation of a single GABAergic synapse on the distal dendrite reduces the ratio of peak calcium in nonstimulated spines (A) and dendritic shaft (B) relative to the peak in synaptically stimulated spines for fast or slow GABAA kinetics. For both fast and slow GABAA kinetics, the GABAergic synapse is on the dendritic shaft, co-located with and synchronously stimulated with glutamatergic stimulation of a cluster of 16 distal dendritic spines (location of synaptic input indicated by blue arrowhead). Figure 7—figure supplement 1 shows the sensitivity of the effect of inhibition on spatial specificity to parameter variations. Figure 7—figure supplement 2 shows the robustness of this main finding to model assumptions. (C–D) Inhibition enhances synapse-specificity during stimulation of randomly distributed excitatory synaptic inputs. Distributions of integrated spine calcium concentration for stimulated (blue) and non-stimulated (green) spines are shown for randomly distributed excitatory Poisson input trains (2.5 Hz) for lower (C; n = 200) or higher (D; n = 300) numbers of independent excitatory synaptic inputs, either with (right columns) or without (left columns) 50 GABAergic Poisson input trains (2.5 Hz). Top row shows the log-scale distribution of integrated spine calcium elevation over the 1 s duration inputs; bottom row shows log-scale scatter plots of peak calcium (y axis) versus normalized calcium duration (i.e. integrated calcium/peak calcium) (x axis).
Figure 7—figure supplement 1
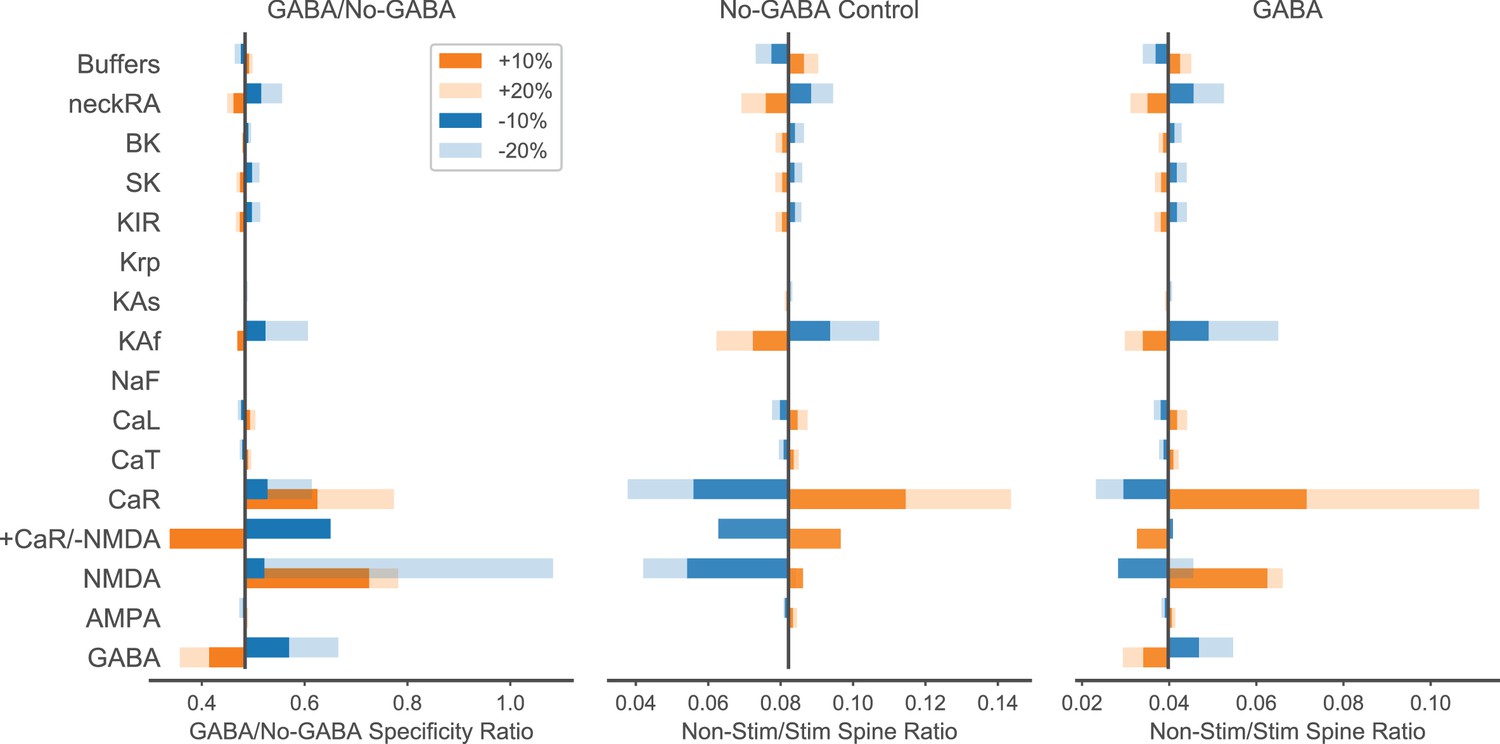
Parameter sensitivity analysis for enhancement of spatial specificity by inhibition.
Parameters listed on the left (ordered by type of mechanism: ligand-gated channels; inward currents through voltage-gated calcium or sodium channels; outward currents through potassium channels; calcium dynamics; spine neck resistance) were individually varied ±10 or 20% to evaluate sensitivity of the GABA/No-GABA specificity ratio (the ratio of the non-stim/stim spine ratio with GABAergic inhibition from the right panel to the non-stim/stim spine ratio without GABAergic inhibition from the middle panel; right and middle panels show peak calcium in non-stimulated spine/peak calcium in stimulated spine). The black vertical bars indicate the original values (i.e. with no varied parameters) for the GABA/No-GABA specificity ratio (left), or the non-stim/stim spine peak calcium ratio in the absence (middle) or presence (right) of inhibition. A GABA/No-GABA specificity ratio of 1 would indicate no effect of inhibition on the specificity ratio, whereas a value <1 indicates that inhibition enhances specificity, with smaller values corresponding to greater enhancement. For ion channel parameters, maximum conductance was varied; for buffers, the quantities were varied. NeckRA refers to the spine neck axial resistance. CaR and NMDAR were covaried (last row) with opposite sign (orange bar is +CaR/-NMDA; blue bar is -CaR/+NMDA).
Figure 7—figure supplement 2
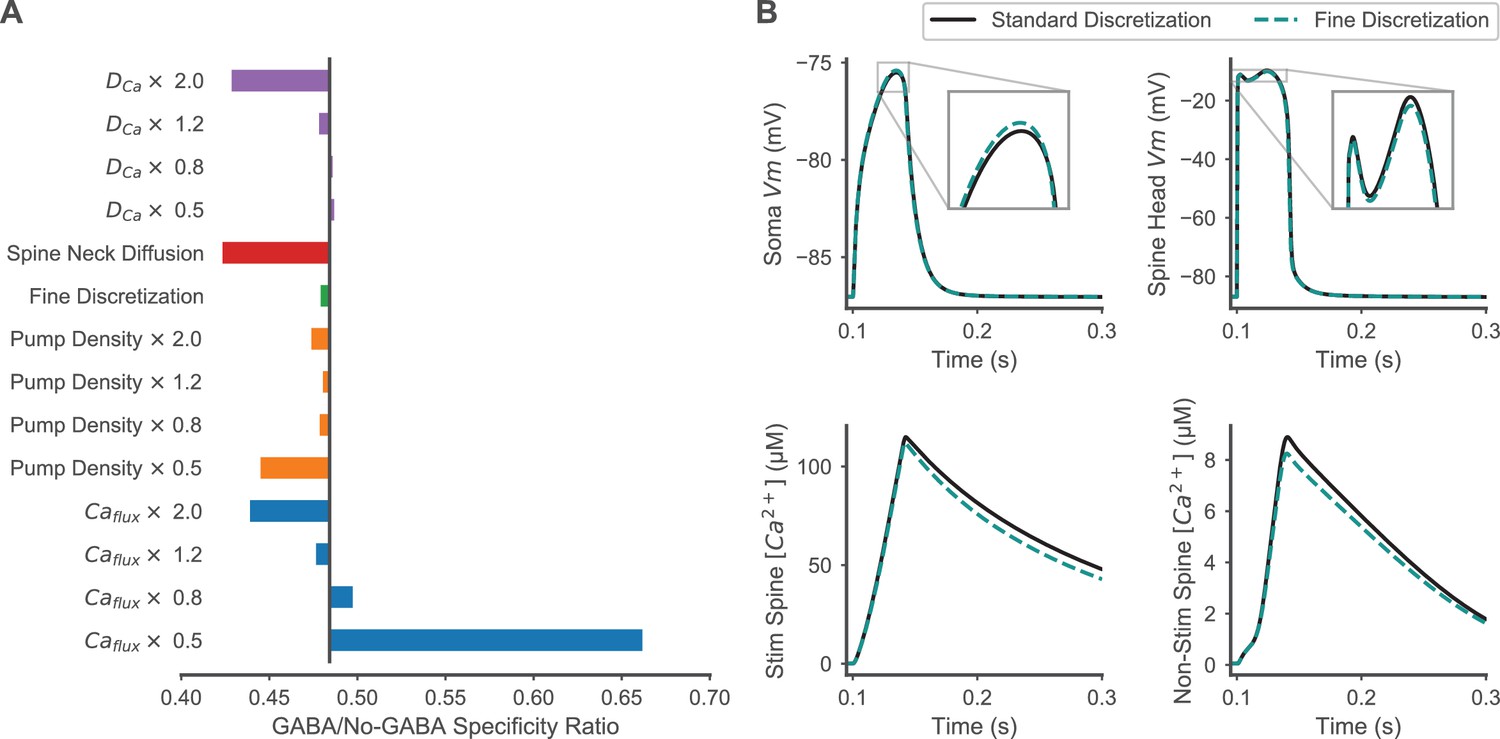
Robustness of model assumptions for enhancement of spatial specificity by inhibition.
(A) The effects of varying calcium diffusion rate, pump density, and calcium flux through calcium permeable channels on the GABA/No-GABA specificity ratio are shown to evaluate model robustness to assumptions that may affect calcium dynamics. As in Figure 7—figure supplement 1, the black vertical bar indicates the original effect of inhibition with unvaried parameters; values <1 mean that inhibition enhances specificity, and smaller values correspond to greater enhancement. The response to fine discretization (timestep of 1 µs, voltage compartment length of 1 micron, six axial calcium diffusion slabs in each spine head and spine neck, and increased radial calcium diffusion shells in the dendritic shaft) is shown to confirm that finer discretization did not change the main result. Facilitated diffusion between spine neck and spine head or dendritic shaft using the geometric-mean method for computing the shared surface area between neck and shaft (Holmes and Poznanski, 2005) rather than the default smaller of the two surfaces areas, is also shown. Calcium fluxes refer to calcium influx through all calcium permeable channels, and these values were modulated independently of the contribution of these channels to membrane depolarization, to isolate effects mediated by calcium dynamics versus effects mediated by depolarization. (B) Comparisons of finer discretization to standard discretization are shown for membrane potential transients in the soma (top left) and a stimulated spine (top right), and spine calcium concentration transients in a stimulated spine (bottom left) and non-stimulated spine (bottom right) during synaptic stimulation of clustered, distal spines.
Tables
Table 1
Voltage-gated ion channel maximal conductances and permeabilities.
https://doi.org/10.7554/eLife.38588.015| Gbar (S/m2) | Soma | Prox dend | Mid dend | Dist dend | Spine |
|---|---|---|---|---|---|
| NaF | 45,000 | 4420 | 4420 | 0 | 0 |
| Kir | 11.9 | 5.95 | 5.95 | 5.95 | 0 |
| KaF | 500 | 500 | 72 | 72 | 0 |
| KaS | 70 | 3 | 3 | 3 | 0 |
| Krp | 10 | 1 | 1 | 1 | 0 |
| SK | 3 | 0.5 | 0.5 | 0.5 | 0.5 |
| BK | 5 | 2 | 2 | 2 | 0 |
| Pbar (cm/s) | |||||
| CaL1.2 | 1.5e-7 | 1.5e-7 | 1.5e-7 | 1.5e-7 | 0.915e-7 |
| CaL1.3 | 0.5e-7 | 0.25e-7 | 0.25e-7 | 0.25e-7 | 0.1525e-7 |
| CaN | 15e-7 | 0 | 0 | 0 | 0 |
| CaR | 3e-7 | 30e-7 | 30e-7 | 30e-7 | 18.67e-8 |
| CaT (3.2) | 0 | 1.2e-7 | 2e-7 | 2e-7 | 1.22e-7 |
| CaT (3.3) | 0 | 0 | 5e-10 | 5e-10 | 3.42e-10 |
-
Gbar = maximal conductance (S/m2); Pbar = maximal calcium permeability. Prox dend = proximal dendrites (0 to 42 μm from soma); mid dend = middle dendrites (42–60 μm from soma); dist dend = distal dendrites (60–224 μm from soma).
Table 2
Calcium dynamics parameters
https://doi.org/10.7554/eLife.38588.016| Pumps | Km (mM) | Kcat Soma (pmol/cm2/s) | Kcat Dend (pmol/cm2/s) | Kcat Spine (pmol/cm2/s) |
|---|---|---|---|---|
| PMCA | 0.3e-3 | 85 | 10 | 0.6 |
| NCX | 1e-3 | - | - | 10 |
| Buffers | Kd (µM) | Kf (/s/µM) | Quantity (µM) | Diff (m2/s) |
| Calbindin | 0.7e-3 | 28 | 80 | 66e-12 |
| CaMN | 0.01 | 100 | 15 | 66e-12 |
| CaMC | 1.5e-3 | 6 | 15 | 66e-12 |
| Fixed | 100 | 400 | 2500 | 0 |
| Fluo-5F | 2.3 | 236 | 300 | 60e-12 |
| Fluo-4F | 9.7 | 80 | 200 | 60e-12 |
| Fura-2 | 0.185 | 1000 | 100 | 60e-12 |
-
PMCA = plasma membrane Ca2+ ATPase; NCX = sodium calcium exchanger; Fixed = endogenous immobilized buffer; CaMN = calmodulin N terminal binding site; CaMC = calmodulin C terminal binding site. Exogenous buffers were only present when tuning to calcium imaging experiments, in which case mobile endogenous buffers were removed.
Additional files
-
Transparent reporting form
- https://doi.org/10.7554/eLife.38588.017
Download links
A two-part list of links to download the article, or parts of the article, in various formats.
Downloads (link to download the article as PDF)
Open citations (links to open the citations from this article in various online reference manager services)
Cite this article (links to download the citations from this article in formats compatible with various reference manager tools)
Inhibition enhances spatially-specific calcium encoding of synaptic input patterns in a biologically constrained model
eLife 7:e38588.
https://doi.org/10.7554/eLife.38588


