PIP2 depletion promotes TRPV4 channel activity in mouse brain capillary endothelial cells
- University of Vermont, United States
- Institute of Cardiovascular Sciences, United Kingdom
Figures
Figure 1 with 3 supplements
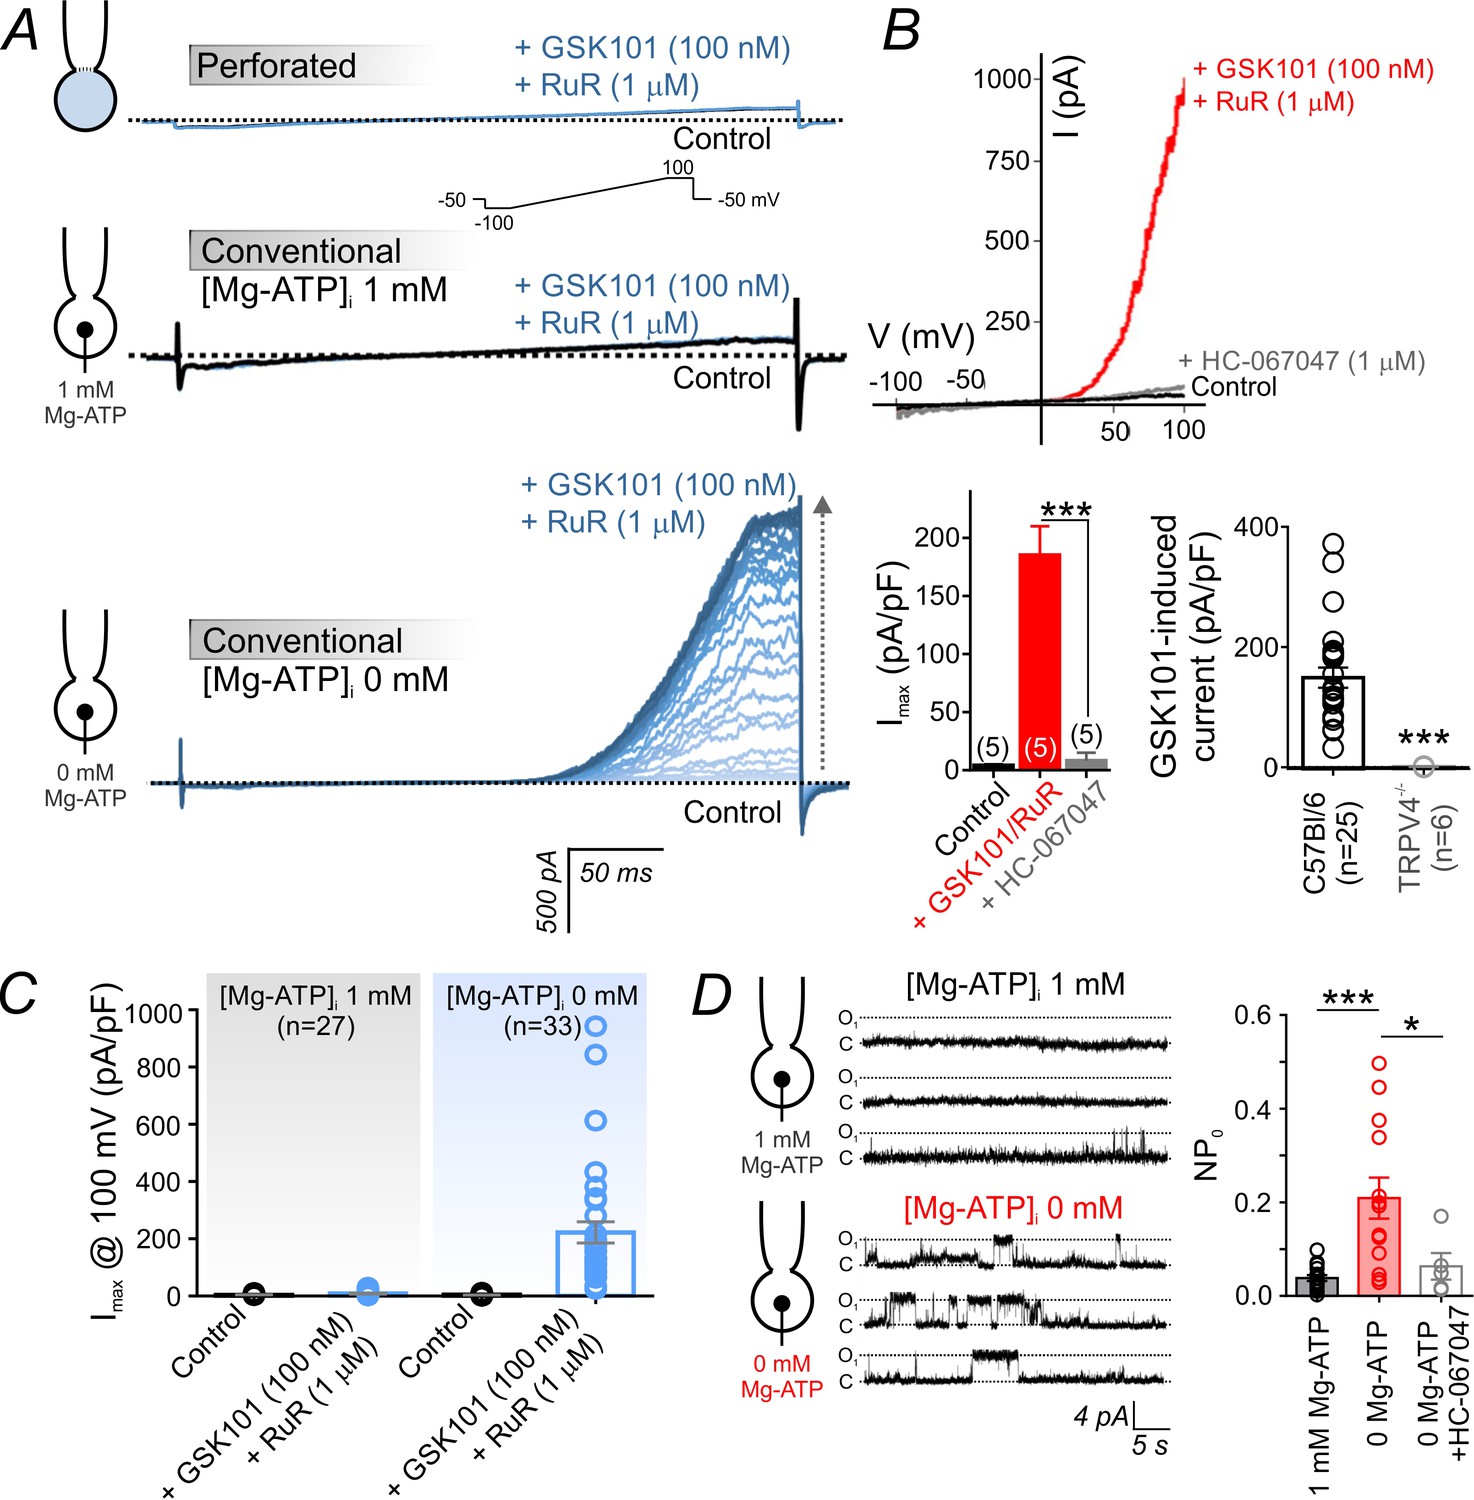
Intracellular ATP suppresses TRPV4 currents in cECs.
(A) Representative traces of TRPV4 currents recorded from freshly isolated cECs using voltage ramps (−100 to 100 mV, from a holding potential −50 mV; inset) and different patch-clamp configurations before (black) and after (blue) the application of 100 nM GSK101 and 1 µM RuR. Top: Currents recorded in the perforated whole-cell configuration. Middle: Currents recorded in the conventional whole-cell configuration (dialyzed cytoplasm, 1 mM Mg-ATP in the pipette solution). Bottom: Currents recorded in the conventional whole-cell configuration (0 mM Mg-ATP in the pipette solution) developed gradually over ~4 min. (B) Current-voltage relationship (top) and summary data (bottom left) of currents recorded before (control) and after the cumulative application of GSK101 (100 nM)+RuR (1 µM) followed by HC-067047 (1 µM) (means ± SEM, ***p<0.001, unpaired Student’s t-test; n = 5 each). Bottom right: Individual-value plot of peak outward GSK101 (100 nM)-induced currents in cECs isolated from brains of C57Bl/6 (n = 25) or TRPV4-/- (n = 6) mice. A minimum duration of ~5 min after the application of GSK101 was allowed for outward TRPV4 current to develop in each cEC. Data are presented as means ± SEM (***p<0.001, unpaired Student’s t-test). (C) Individual-value plot of peak outward currents recorded at 100 mV before and after the application of GSK101 (100 nM) onto cECs dialyzed with 0 or 1 mM Mg-ATP in the pipette solution. Individual data points are shown together with means (column bars) and SEM (error bars). (D) Representative traces (left) and summary individual-value plot (right) of TRPV4 single-channel activity. Single-channel openings of TRPV4 channels were recorded as outward quantal K+ currents from cECs in the absence of GSK101 (conventional whole-cell configuration; holding potential, +50 mV; sampling rate, 20 kHz; low-pass filter frequency, 1 kHz; average recording time for each data point, 6 min). cECs were dialyzed with 0 mM (n = 13) or 1 mM (n = 16) Mg-ATP. One group of cECs dialyzed with 0 mM Mg-ATP was treated with 1 µM HC-067047 (n = 5). Data are presented as means (column bars) ± SEM (error bars; *p<0.05, ***p<0.001, one-way ANOVA followed by Tukey’s multiple comparisons test).
-
Figure 1—source data 1
Numerical data that were used to generate the chart in Figure 1B.
- https://doi.org/10.7554/eLife.38689.007
-
Figure 1—source data 2
Numerical data that were used to generate the chart in Figure 1C.
- https://doi.org/10.7554/eLife.38689.008
-
Figure 1—source data 3
Numerical data that were used to generate the chart in Figure 1D.
- https://doi.org/10.7554/eLife.38689.009
Figure 1—figure supplement 1
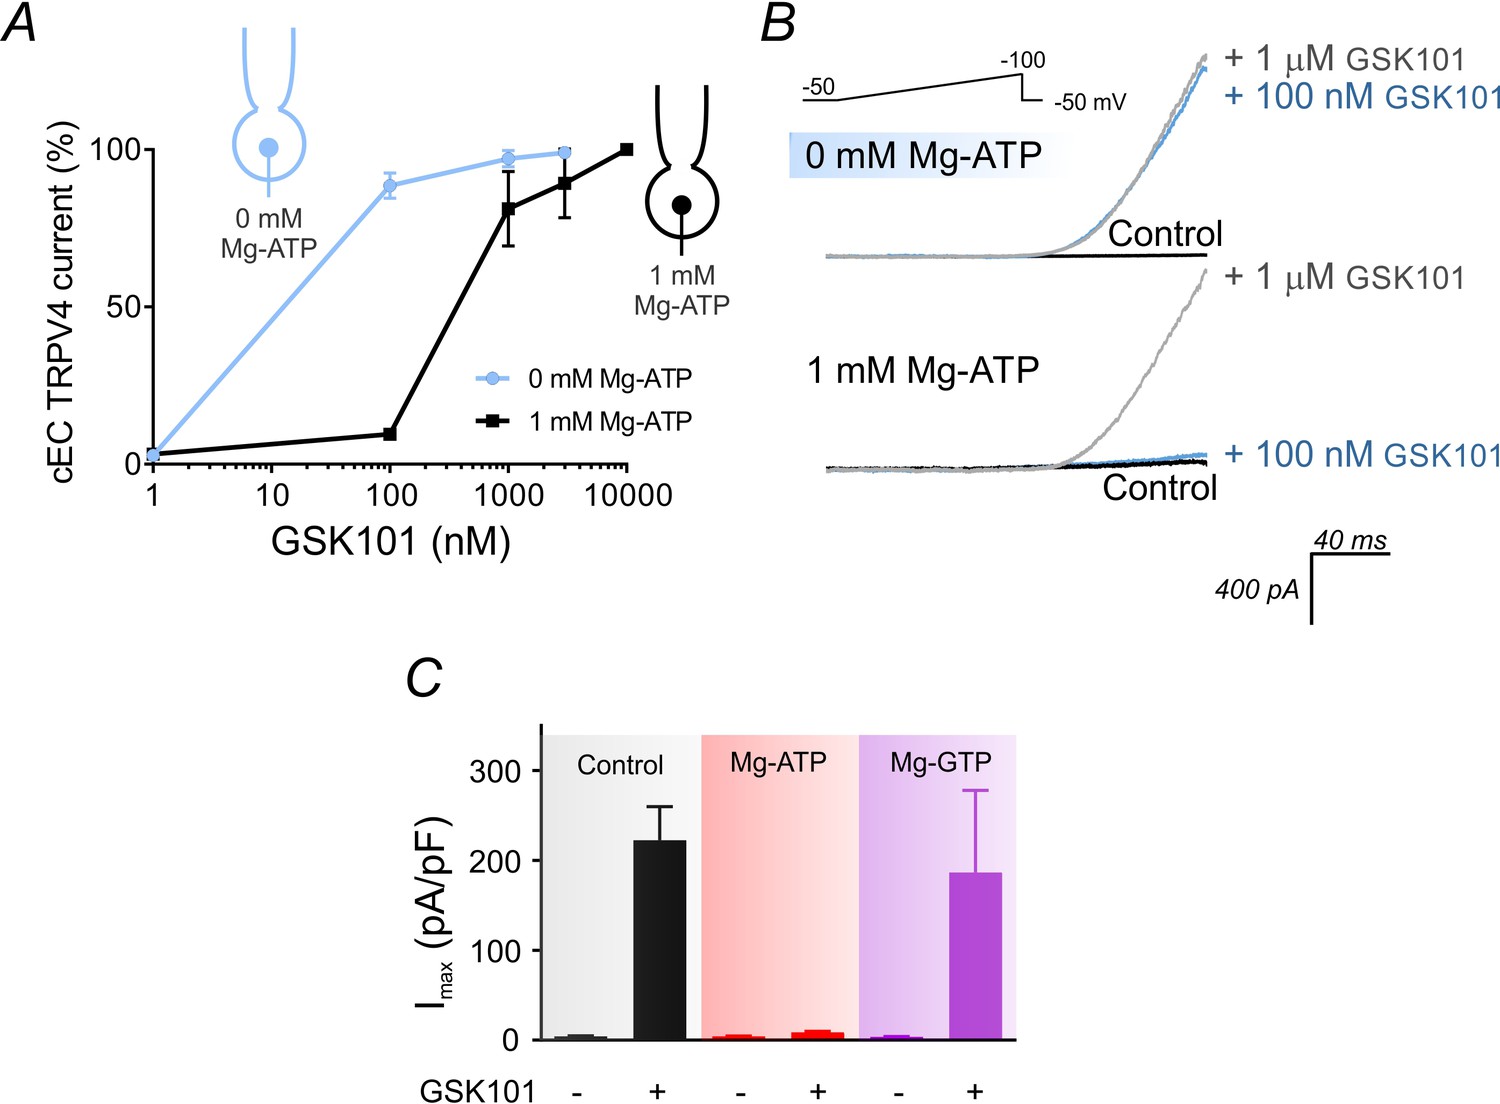
Intracellular ATP suppresses TRPV4 activity in cECs.
(A) GSK101 concentration-response curve. Currents were measured at 100 mV using the conventional whole-cell configuration in cECs in the presence of 1 µM RuR. cECs were dialyzed with 0 or 1 mM Mg-ATP in the pipette solution and GSK101-evoked currents developed over ~5 min. TRPV4 current densities with 100 nM GSK101 were 192 ± 30 pA/pF (0 mM Mg-ATP) and 13 ± 2 pA/pF (1 mM Mg-ATP). Data are presented as means ± SEM (0–1000 nM GSK101, n = 9 cECs; 3–10 µM GSK101, n = 2–3 cECs). (B) Representative traces from two cECs dialyzed with 0 mM Mg-ATP (upper) or 1 mM Mg-ATP (lower). Currents were recorded using voltage ramps (−50 to 100 mV) before and after the application of 100 nM and then 1 µM GSK101. (C) Summary data showing outward currents at 100 mV, before and after 100 nM GSK101, recorded in dialyzed cECs using different intracellular nucleotide compositions: no nucleotides (control), 1 mM Mg-ATP, or 1 mM Mg-GTP (n = 7–25). For each cEC, a minimum of 5 min was allowed for outward TRPV4 current to develop after the application of GSK101.
Figure 1—figure supplement 2
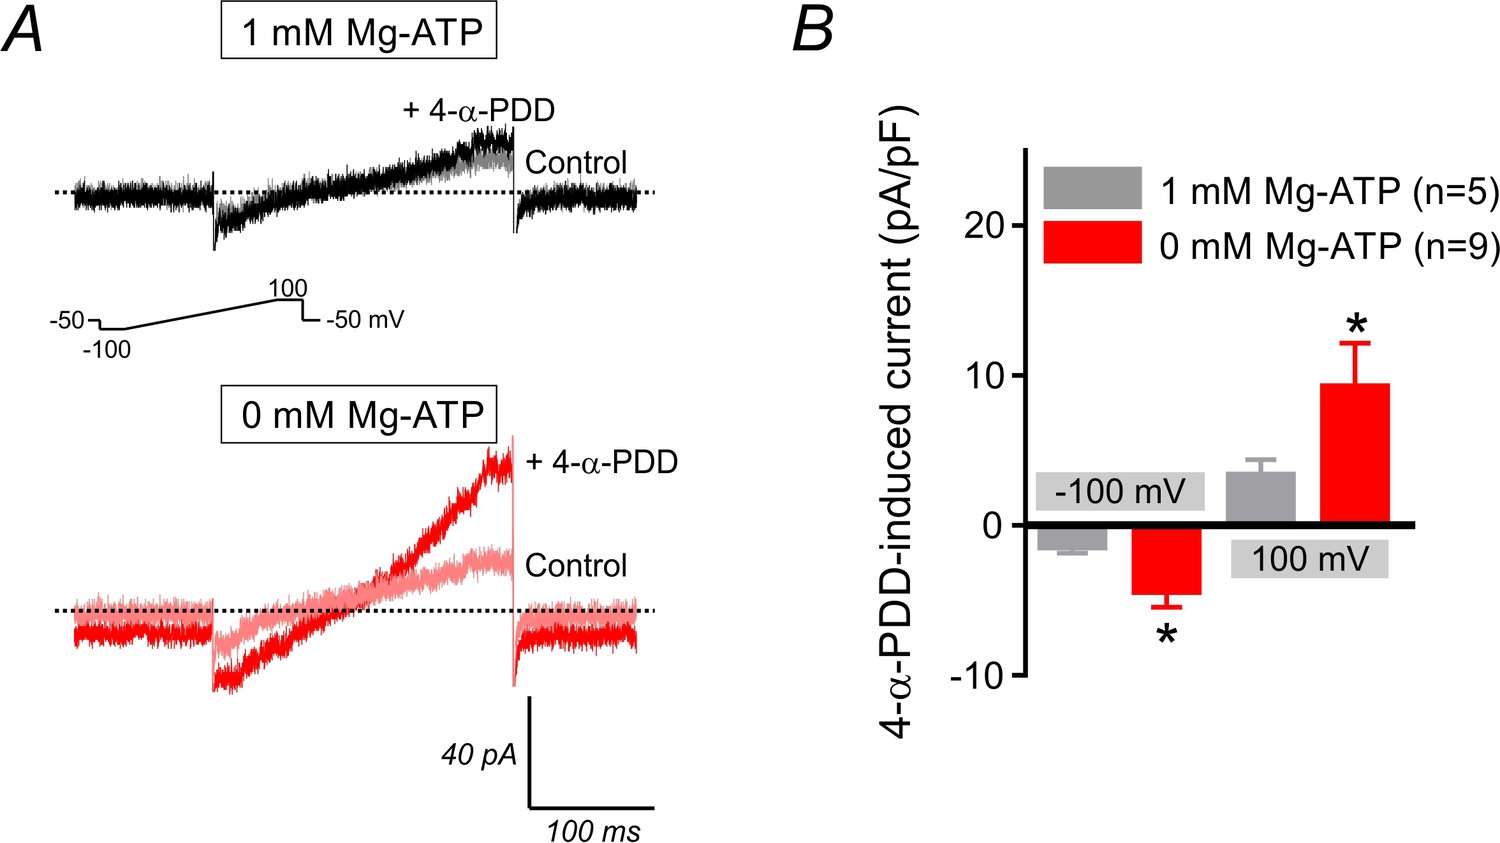
4-α-PDD-induced current in cECs.
(A) Representative traces recorded from two cECs dialyzed with 1 mM (upper) and 0 mM Mg-ATP (lower), before and after the application of 4-α-PDD (5 µM), using 300 ms voltage ramps (−100 to 100 mV, inset). Ruthenium red was not used in this experiment. (B) Summary data represent 4-α-PDD (5 µM)-induced inward (at −100 mV) and outward (at 100 mV) currents in cECs dialyzed with 0 or 1 mM Mg-ATP. Data represent means ± SEM (*p<0.05 unpaired Student’s t-test vs. the 1 mM Mg-ATP condition, n = 5–9 cECs per condition).
Figure 1—figure supplement 3
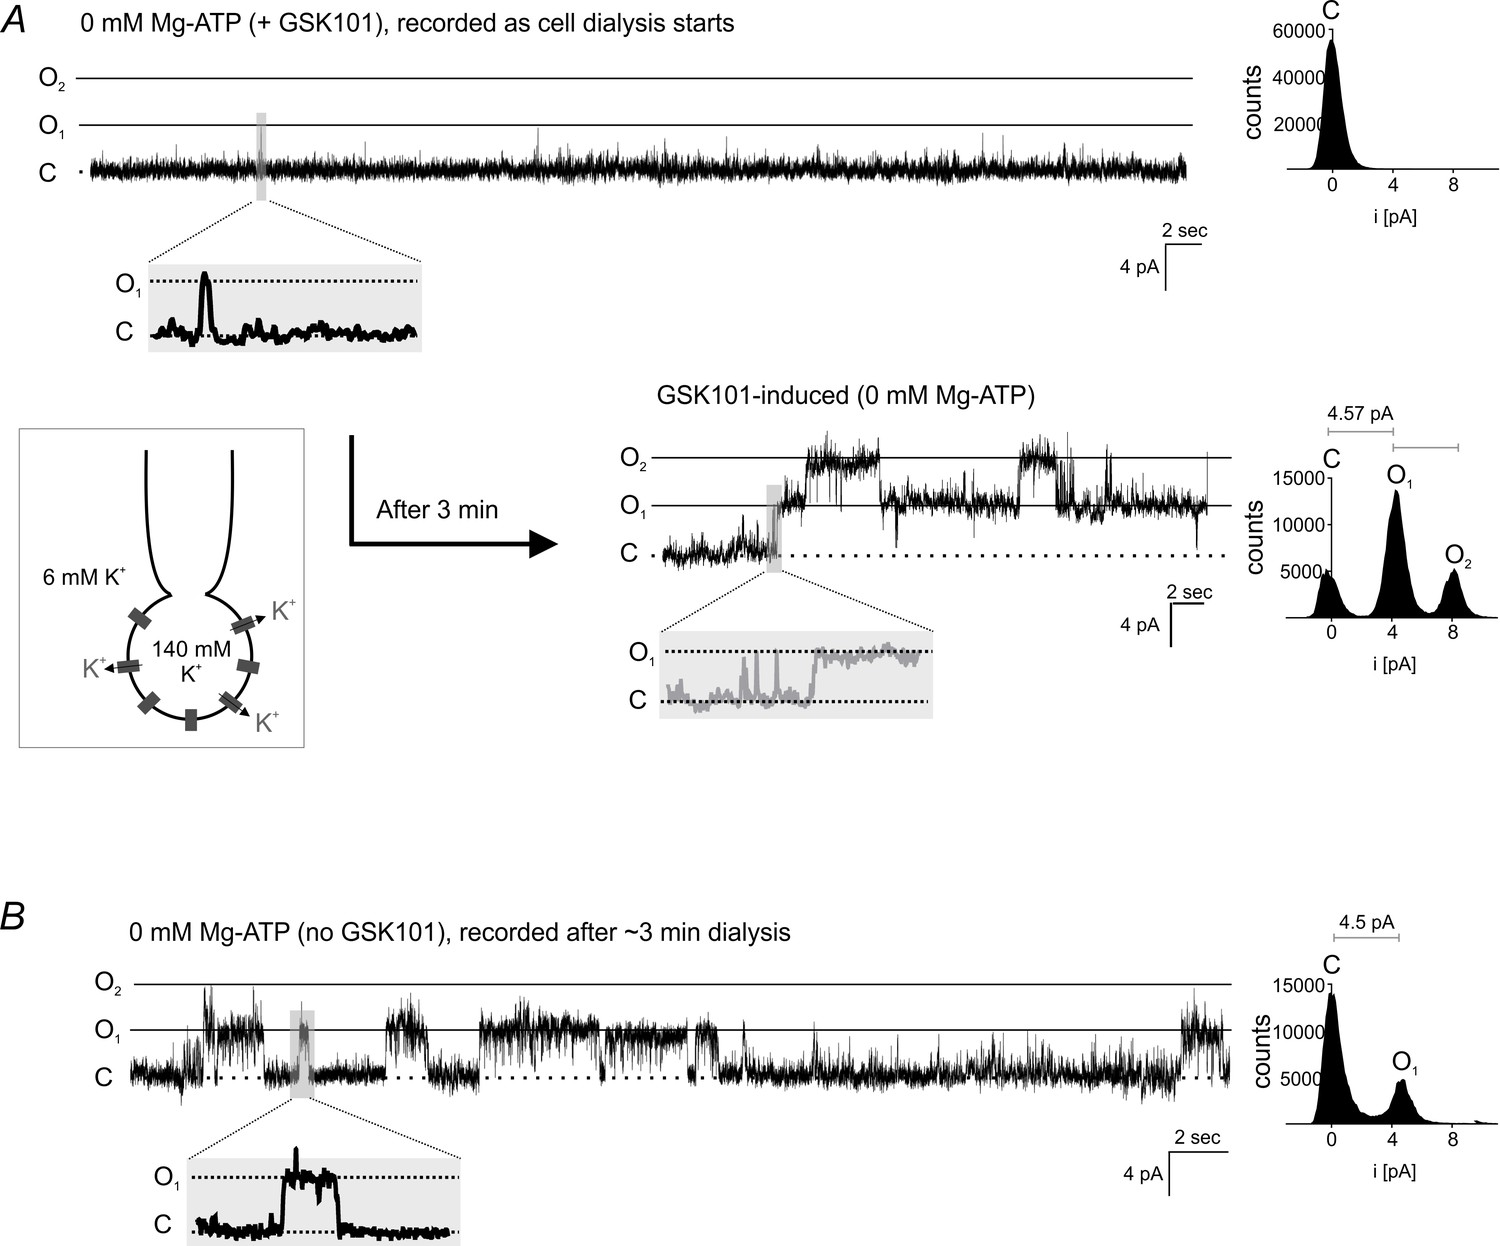
Single-channel TRPV4 currents in cECs.
(A) Agonist-induced single-cell TRPV4 currents in a cEC. Top: Representative trace (left) and corresponding histogram (right) of single-channel activity in a cEC dialyzed with 0 mM Mg-ATP. Currents were recorded in the conventional whole-cell configuration in the presence of 100 nM GSK101 immediately after gaining electrical access to the cell (holding potential, +50 mV; sampling rate, 20 kHz; low-pass filter frequency, 1 kHz). Bottom: Trace and histogram for the same cEC recorded ~3 min after initiating dialysis when the effect of GSK101 commenced. The amplitude histogram revealed a unitary TRPV4 current amplitude (i) of 4.57 pA. (B) Single-cell TRPV4 currents in the absence of GSK101. Traces and corresponding histogram of single TRPV4 channel currents in a cEC dialyzed with 0 mM Mg-ATP (conventional whole-cell configuration) in the absence of an agonist. The cEC was held at +50 mV, and currents were recorded after dialyzing for ~3 min. The unitary current amplitude was 4.5 pA.
Figure 2
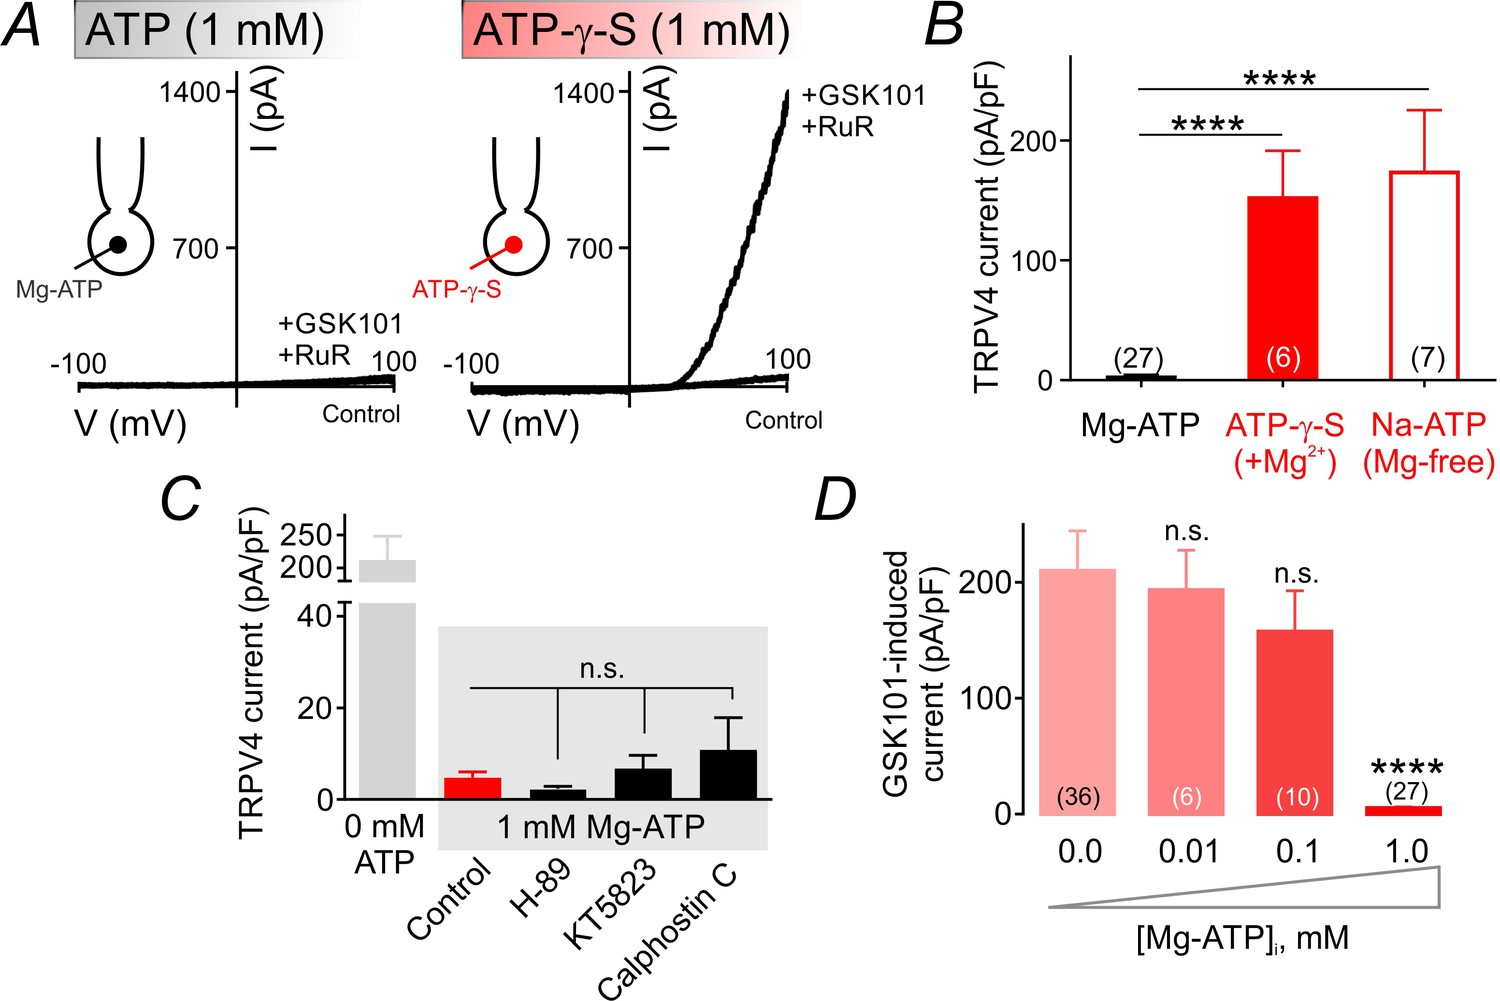
ATP hydrolysis is required for ATP-mediated suppression of TRPV4 channel activity.
(A) Representative traces of current-voltage relationships in cECs recorded using voltage ramps (−100 to 100 mV) before and after the application of 100 nM GSK101 and 1 µM RuR. cECs were dialyzed with 1 mM Mg-ATP (left) or 1 mM Mg-ATP-γ-S (right). (B) Summary data showing GSK101 (100 nM)-induced outward currents at 100 mV in cECs dialyzed with Mg-ATP (1 mM), Mg-ATP-γ-S (1 mM) or Na-ATP (1 mM, in Mg2+ free solution). A minimum duration of 5 min after the application of GSK101 was allowed for outward TRPV4 current to develop in each cEC. Data are presented as means ± SEM (****p<0.0001 vs. Mg-ATP, one-way ANOVA followed by Dunnett’s multiple comparisons test). (C) TRPV4 outward currents induced by 100 nM GSK101 at 100 mV, recorded from dialyzed cECs (0 and 1 mM Mg-ATP). Mg-ATP–dialyzed cECs (gray shadow) were pre-treated with inhibitors of PKA (H-89, 1 µM), PKG (KT5823, 1 µM) or PKC (calphostin C, 0.5 µM) for ~10–15 min prior to GSK101 application, or left untreated (control). Data are presented as means ± SEM (n.s. denotes not significant vs. control Mg-ATP, one-way ANOVA, Dunnett’s multiple comparisons test, n = 6–24). (D) Summary data showing the effect of raising intracellular Mg-ATP concentration on GSK101-induced TRPV4 currents. Data are means ± SEM (****p<0.0001, one-way ANOVA followed by Dunnett’s multiple comparisons test).
-
Figure 2—source data 1
Numerical data that were used to generate the chart in Figure 2B.
- https://doi.org/10.7554/eLife.38689.011
-
Figure 2—source data 2
Numerical data that were used to generate the chart in Figure 2C.
- https://doi.org/10.7554/eLife.38689.012
-
Figure 2—source data 3
Numerical data that were used to generate the chart in Figure 2D.
- https://doi.org/10.7554/eLife.38689.013
Figure 3 with 2 supplements
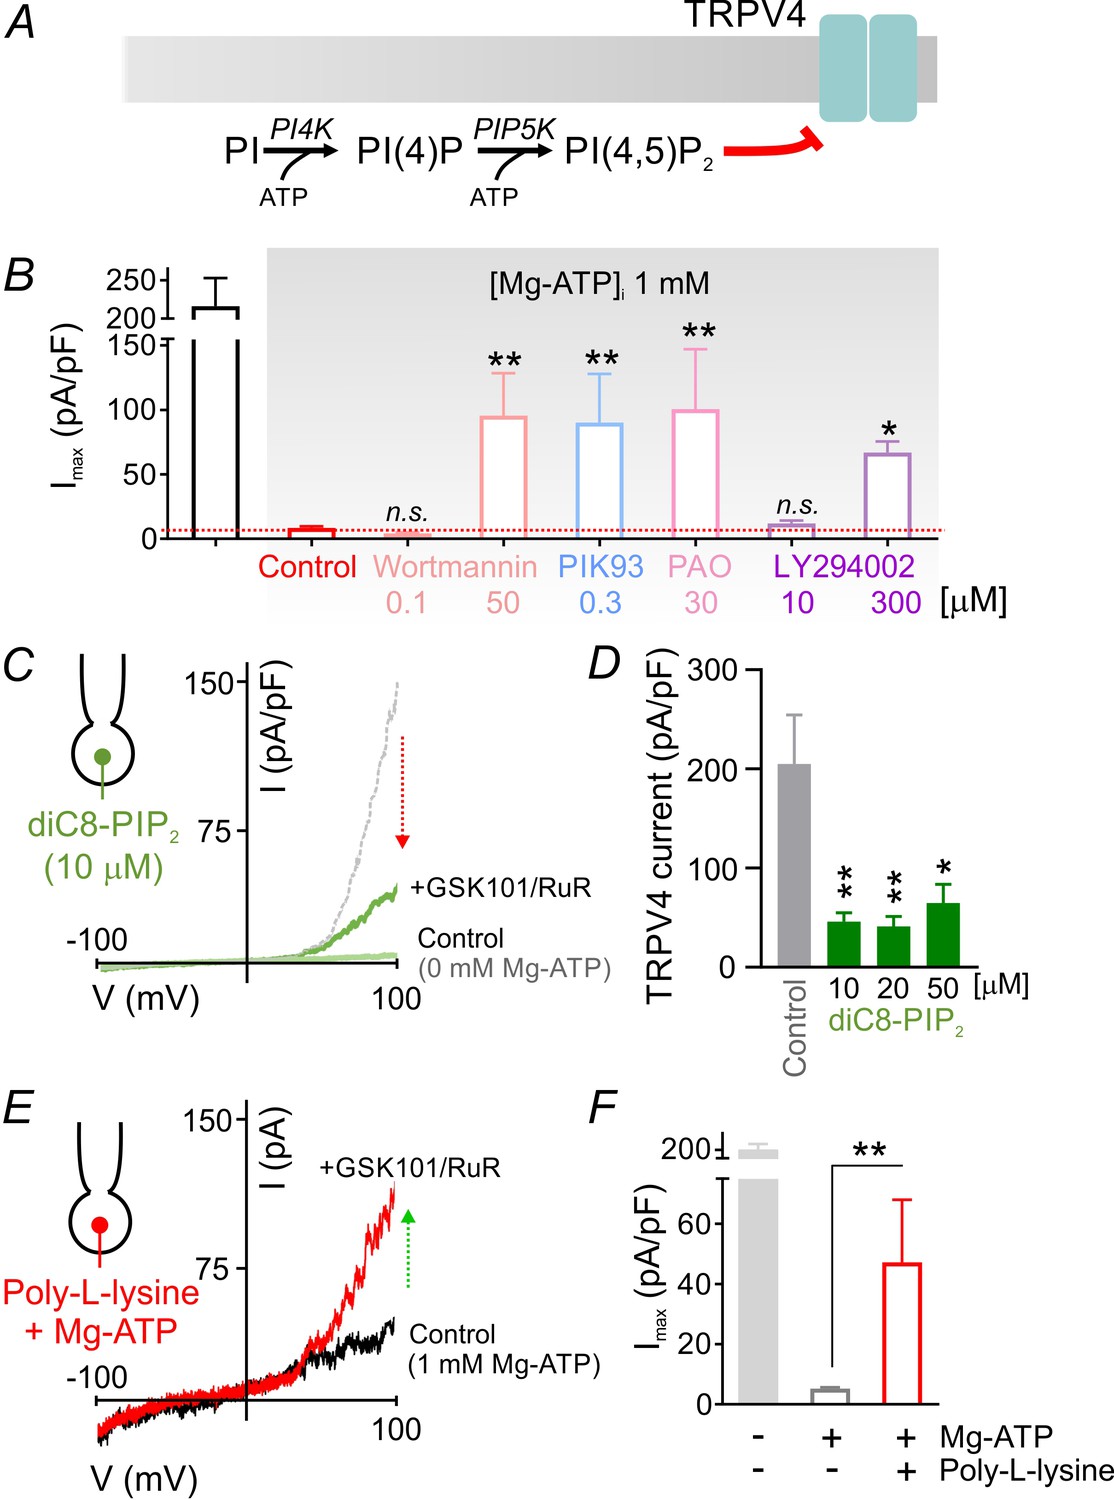
PIP2 mediates tonic inhibition of capillary TRPV4 channels.
(A) Schematic diagram showing the ATP-dependent synthesis steps leading to the production of PIP2. (B) Average maximum outward TRPV4 current induced by 100 nM GSK101, recorded in cECs at 100 mV using the conventional whole-cell configuration. cECs dialyzed with 1 mM Mg-ATP were treated for ~10 min with wortmannin (0.1, 50 µM), PIK93 (0.3 µM), PAO (30 µM) or LY294002 (10, 300 µM), or were left untreated (control). A minimum duration of 10–15 min after the application of GSK101 was allowed for outward TRPV4 current to develop in each cEC. Data are means ± SEM (**p<0.01, *p<0.05 vs. control Mg-ATP, one-way ANOVA followed by Dunnett’s multiple comparisons test; n = 6–27). (C) Traces of current-voltage relationship obtained from a cEC dialyzed with 10 µM diC8-PIP2 and 0 mM Mg-ATP using a voltage ramp (−100 to 100 mV) before and after (green) the application of GSK101 (100 nM) and RuR (1 µM). The dotted gray trace is a representative GSK101-induced current recorded from a control cEC dialyzed with 0 µM diC8-PIP2 and 0 mM Mg-ATP. (D) Summary data showing GSK101 (100 nM)-induced currents at 100 mV in cECs dialyzed with different concentrations of diC8-PIP2 (10, 20, 50 µM) or 0 µM phosphoinositide (control). The pipette solution lacked Mg-ATP in all groups. GSK101-evoked outward currents developed over ~5 min. Data are presented as means ± SEM (*p<0.05, **P<0.01, one-way ANOVA followed by Dunnett’s multiple comparisons test; n = 10–18). (E, F) Representative trace (E) and summary data showing GSK101-induced currents in cECs dialyzed with 1 mM Mg-ATP and poly-L-lysine (3 µg/ml). A duration of 10 min was allowed after the application of GSK101 for outward TRPV4 current to develop in each cEC. Data in F are presented as means ± SEM (**p<0.01, unpaired Student’s t-test; n = 8–18).
-
Figure 3—source data 1
Numerical data that were used to generate the chart in Figure 3B.
- https://doi.org/10.7554/eLife.38689.017
-
Figure 3—source data 2
Numerical data that were used to generate the chart in Figure 3D.
- https://doi.org/10.7554/eLife.38689.018
-
Figure 3—source data 3
Numerical data that were used to generate the chart in Figure 3F.
- https://doi.org/10.7554/eLife.38689.019
Figure 3—figure supplement 1
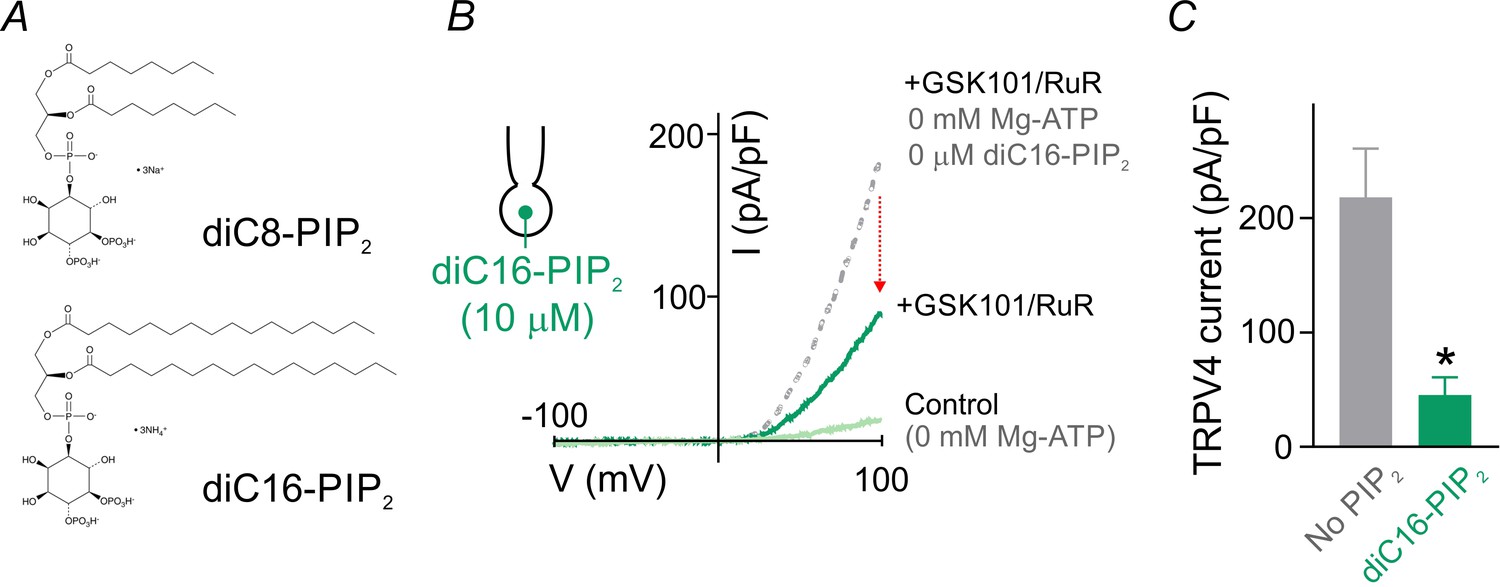
The long-acyl chain PIP2, diC16-PIP2, suppresses TRPV4 currents.
(A) Chemical structures of short (dioctanoyl, diC8-PIP2) and long (dipalmitoyl, diC16-PIP2) acyl chain PIP2 salts used in this study. (B) Current-voltage relationship represents currents obtained from a cEC dialyzed with 10 µM diC16-PIP2 and 0 mM Mg-ATP before (light green) and after (dark green) the application of GSK101 (100 nM) and RuR (1 µM), recorded using a voltage ramp (−100 to 100 mV). Outward current developed over 5 min. The dotted gray trace is a representative GSK101-induced current recorded from a control cECs dialyzed with 0 mM diC16-PIP2 and 0 mM Mg-ATP. (C) Summary data showing GSK101 (100 nM)-induced currents at 100 mV in cECs dialyzed with diC16-PIP2 (10 µM) or 0 µM phosphoinositide (control). The pipette solution lacked Mg-ATP in both groups. Data are presented as means ± SEM (*p<0.05, unpaired Student’s t-test; n = 3–4 cECs).
Figure 3—figure supplement 2
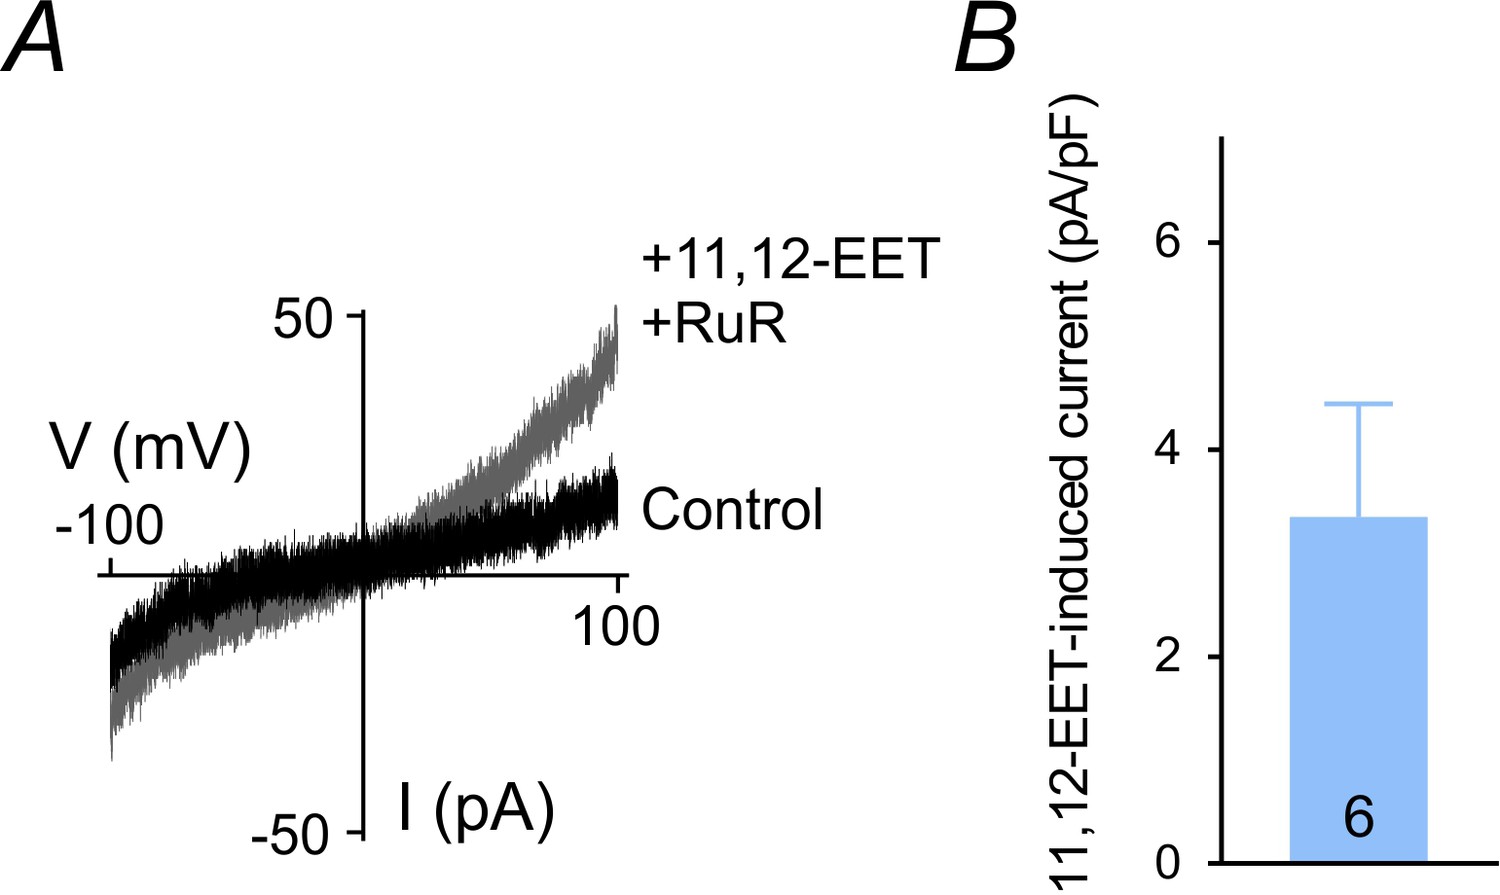
11,12-EET-induced currents in cECs.
(A) Current-voltage relationship represent currents obtained from a cEC dialyzed with 0 µM diC8-PIP2 and 0 mM Mg-ATP before (control) and after the application of 11,12-EET (1 µM) and RuR (1 µM), recorded using 300 ms voltage ramps (−100 to 100 mV). (B) Summary data showing 11,12-EET-induced outward currents at 100 mV in dialyzed cECs based on experiments in A (n = 6 cECs).
Figure 4

PGE2 enhances TRPV4 channel activity.
(A) Top: Representative conventional whole-cell recordings from a cEC dialyzed with 1 mM Mg-ATP in the absence of GSK101 and held at a membrane potential of +50 mV. Quantal outward K+ currents (unitary current, 4.6 pA; sampling rate, 20 kHz; lowpass filter frequency, 1 kHz), reflecting single-channel openings, were recorded before (baseline) and after the consecutive application of PGE2 (2 µM) and HC-067047 (1 µM). Bottom: Corresponding amplitude histograms and open probability (NPO) values. (B, C) Representative trace (B) and individual-value plot (C) of TRPV4 NPO in cECs (dialyzed with 1 mM Mg-ATP, held at +50 mV) in the absence (control; n = 16) and presence (n = 12) of 2 µM PGE2. Data in C are means (column bars) ± SEM (error bars, ***p<0.001, unpaired Student’s t-test). Each data point represents a recording from a cEC; the average duration of each recording was 5 min.
-
Figure 4—source data 1
Numerical data that were used to generate the chart in Figure 4C.
- https://doi.org/10.7554/eLife.38689.021
Figure 5 with 2 supplements
PGE2 relieves PIP2-mediated TRPV4 channel suppression.
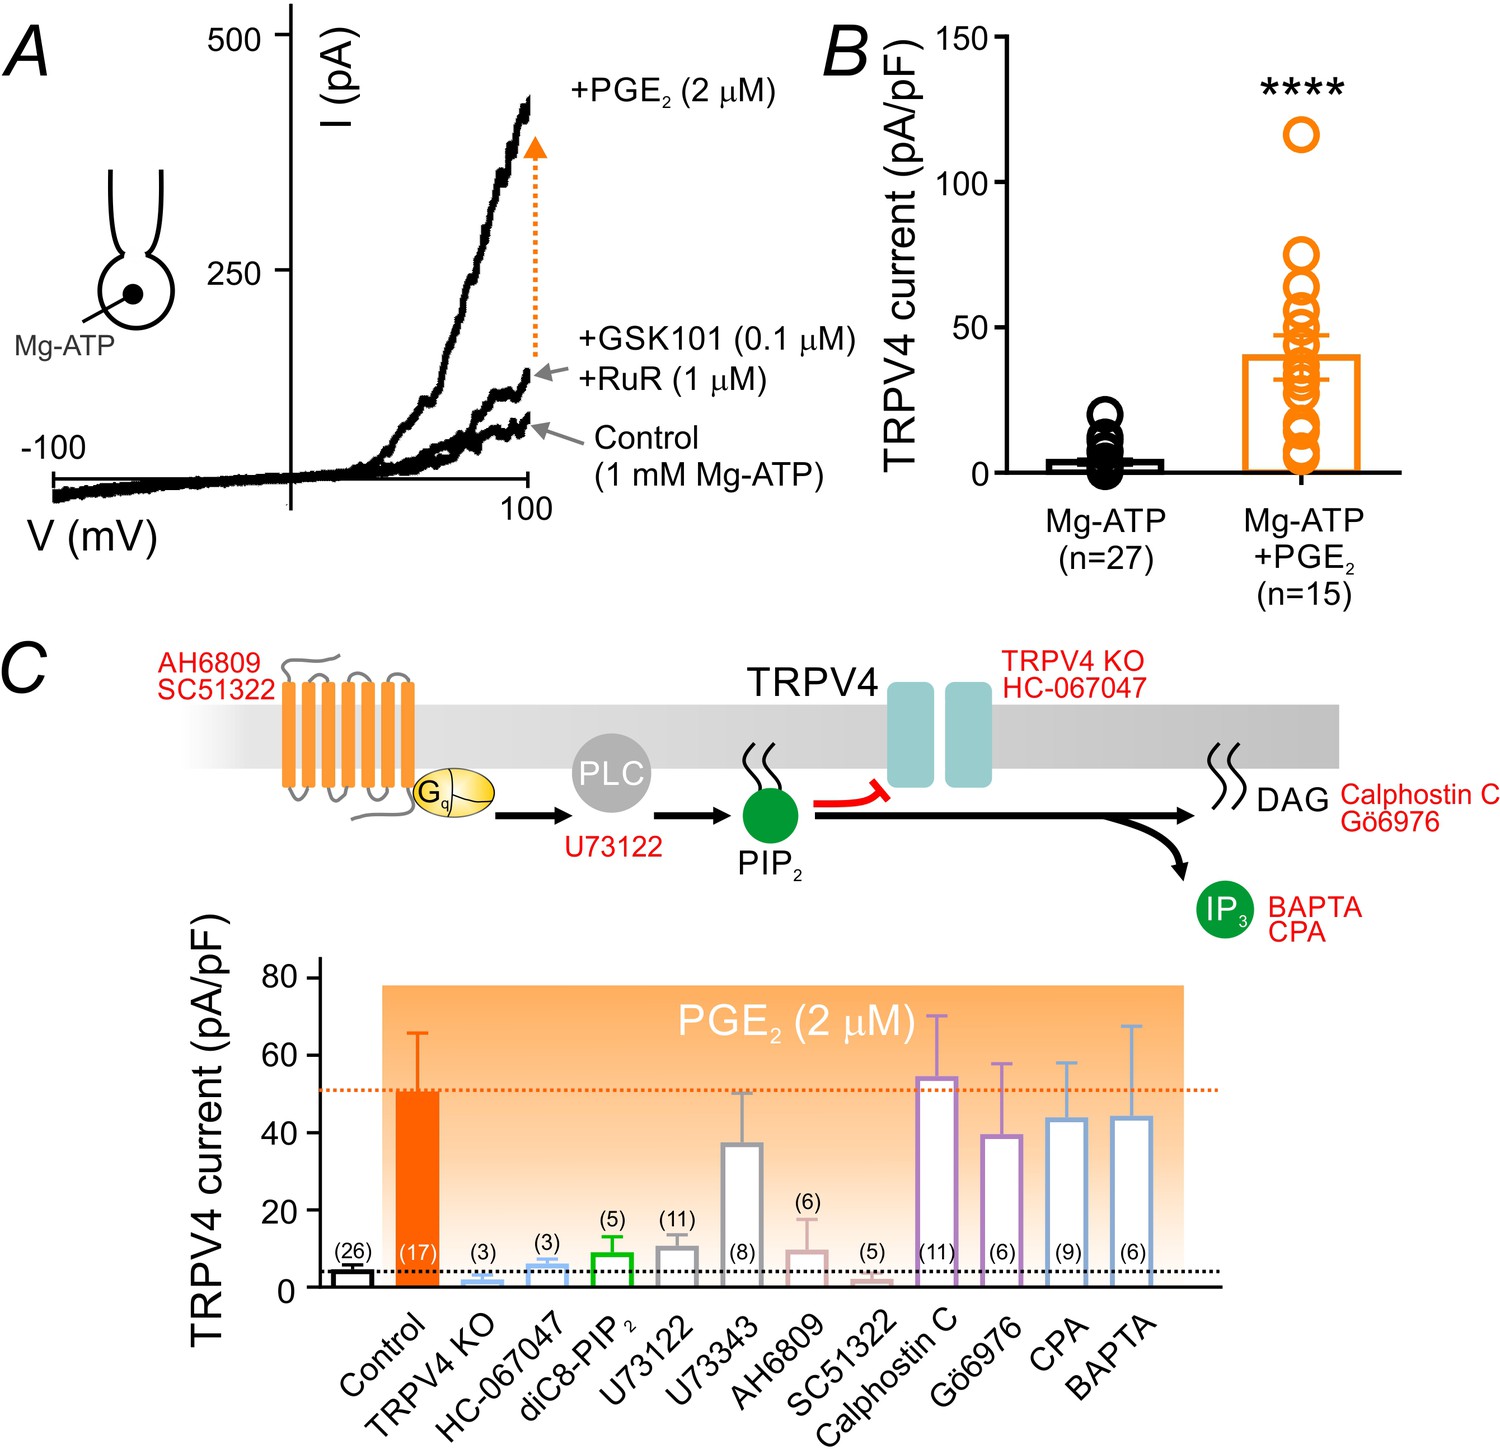
(A) Representative current-voltage plots obtained from a cEC dialyzed with 1 mM Mg-ATP and treated consecutively with GSK101 (100 nM) and RuR (1 µM) followed by 2 µM PGE2. (B) Summary individual-value plot of GSK101-induced TRPV4 currents at 100 mV in cECs dialyzed with 1 mM Mg-ATP in the absence (black; n = 27) and presence (orange; n = 15) of 2 µM PGE2. Incubation of cECs with PGE2 lasted ~15 min. Data in B are means (column bars) ± SEM (error bars, ****p<0.0001, unpaired Student’s t-test). (C) Top: Schematic diagram showing the GqPCR-dependent hydrolysis of PIP2 and the interventions used to test different components of the proposed pathway. Bottom: Summary data showing GSK101 (100 nM)-induced currents recorded at 100 mV in cECs dialyzed with 1 mM Mg-ATP. Currents were recorded in the absence and presence of 2 µM PGE2 (orange shading), with or without (control) the indicated interventions. Concentrations (and application method): HC-067047, 1 µM (bath); diC8-PIP2, 10 µM (pipette), U73122, 10 µM (bath); U73343, 10 µM (bath); AH6809, 10 µM (bath); SC51322, 1 µM (bath); calphostin C, 0.5 µM (bath); Gö6976, 1 µM (bath); CPA, 30 µM (bath); BAPTA, 5.4 mM (pipette). For bath application, pharmacological agents were added 10–15 min before PGE2 application.
-
Figure 5—source data 1
Numerical data that were used to generate the chart in Figure 5B.
- https://doi.org/10.7554/eLife.38689.025
-
Figure 5—source data 2
Numerical data that were used to generate the chart in Figure 5C.
- https://doi.org/10.7554/eLife.38689.026
Figure 5—figure supplement 1
PGE2 relieves TRPV4 current inhibition.
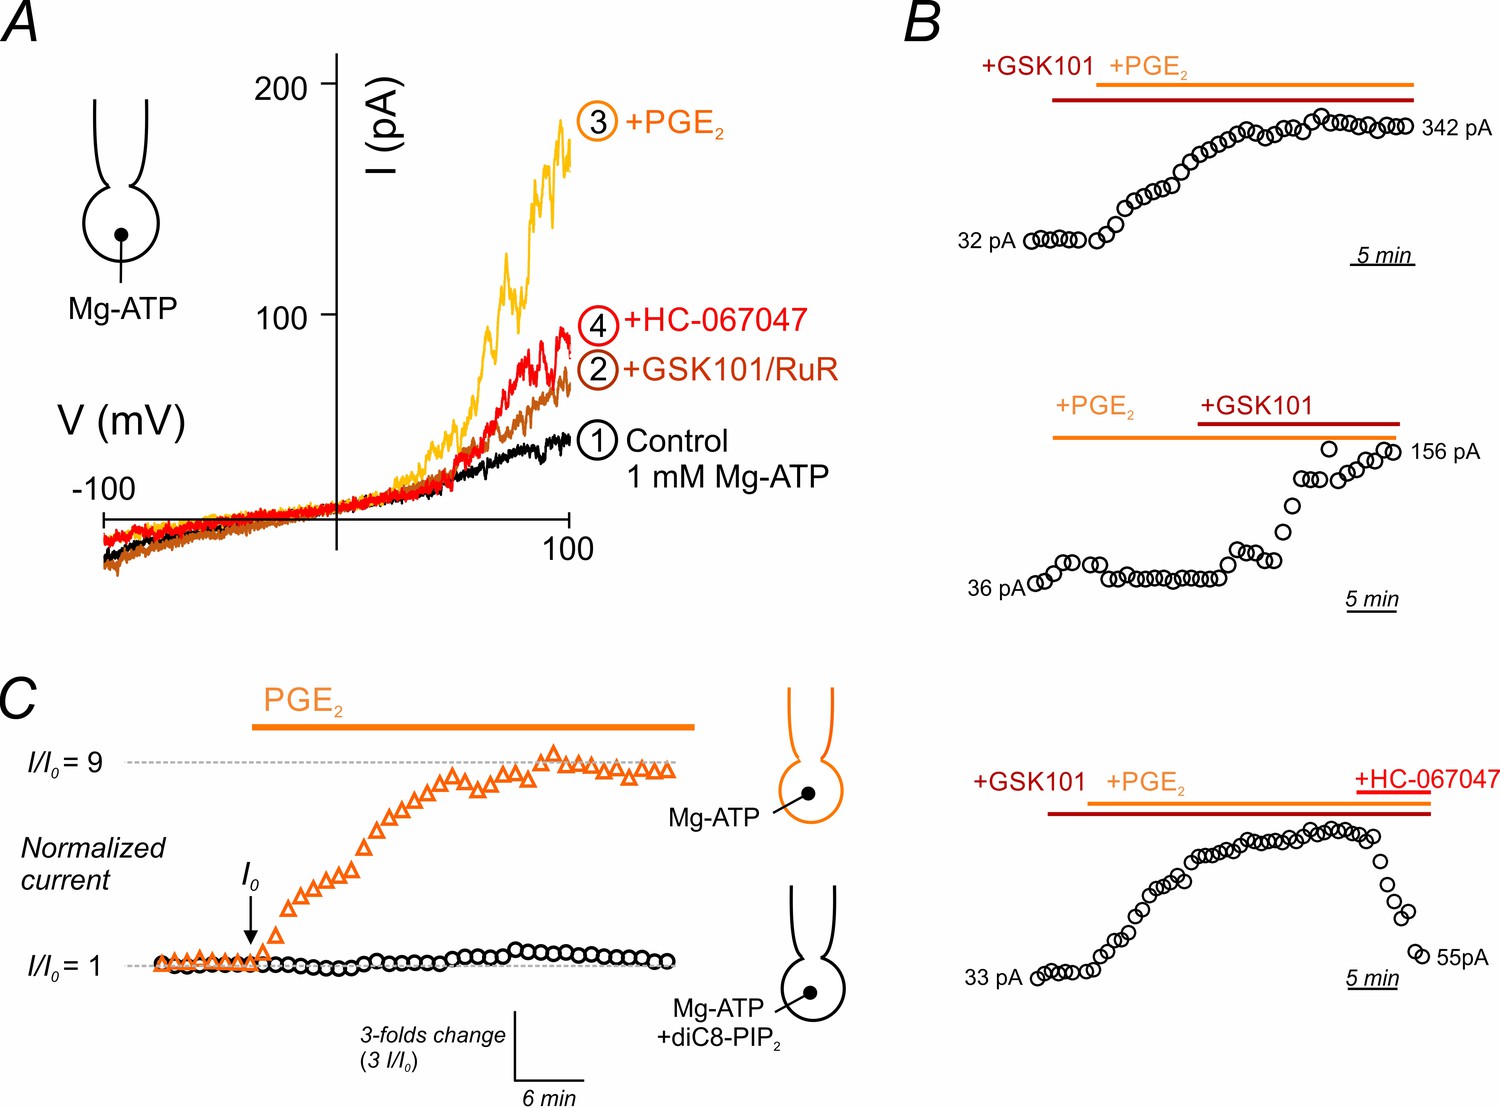
(A) Current-voltage relationship recorded in a cEC dialyzed with 1 mM Mg-ATP using voltage ramps (−100 to 100 mV). The circled numbers indicated the sequential and cumulative application of GSK101 (100 nM)+RuR (1 µM) followed by 2 µM PGE2 and lastly, the TRPV4 blocker HC-067047 (1 µM). (B) Representative scatter plots of peak current amplitudes (at 100 mV) in three cECs dialyzed with 1 mM Mg-ATP and treated with 100 nM GSK101 followed by 2 µM PGE2 (or PGE2 first followed by GSK101). Note that PGE2-induced activation of TRPV4 current plateaued after ~13–15 min. (C) Scatter plots of normalized GSK101-induced outward currents (at 100 mV), normalized to the current at zero time, I0 (when 2 µM PGE2 was applied), in two cECs, one dialyzed with 1 mM Mg-ATP (orange symbols) and the other dialyzed with 1 mM Mg-ATP +10 µM diC8-PIP2 (black symbols). Currents normalized to I0 are presented before and after the application of PGE2 for 35 min.
Figure 5—figure supplement 2
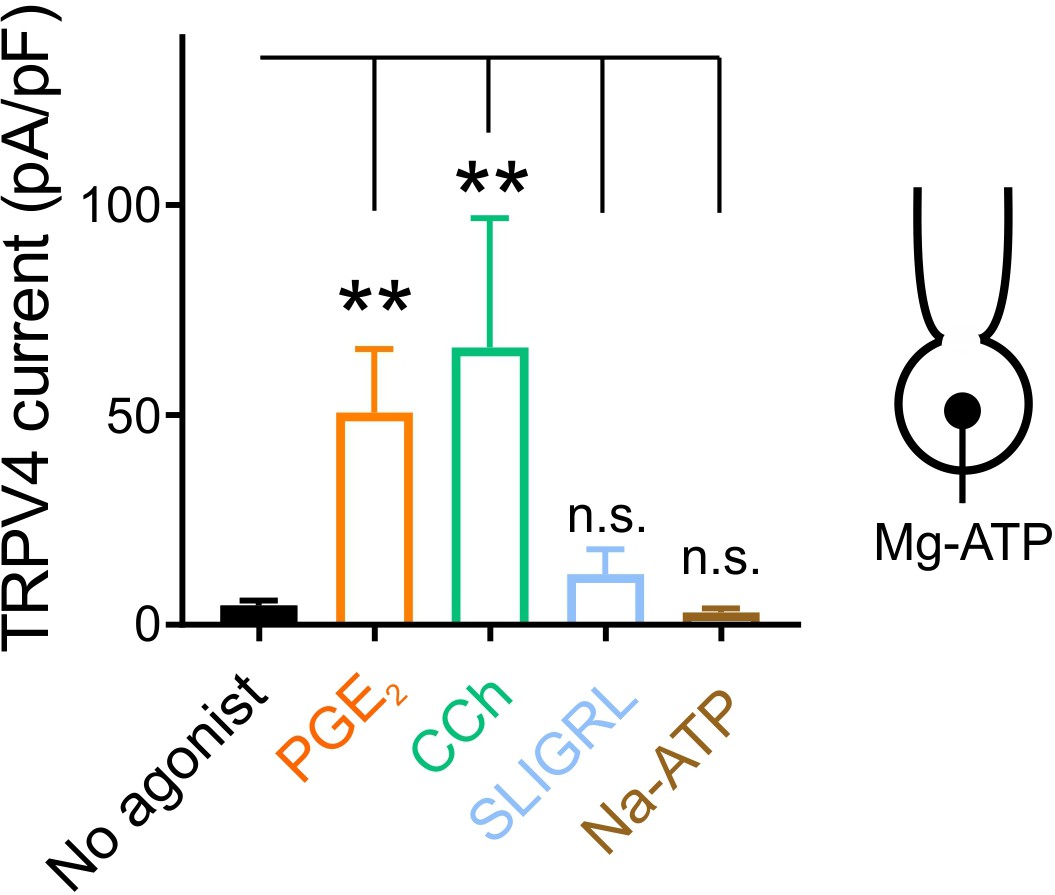
Different GqPCR agonists differentially regulate TRPV4 activity.
Summary data showing TRPV4 currents evoked by 100 nM GSK101 at 100 mV in Mg-ATP (1 mM)-dialyzed cECs. Cells were treated with GSK101 alone (no agonist) or together with the GqPCR agonist PGE2 (2 µM), carbachol (CCh; 10 µM), SLIGRL (5 µM), or Na-ATP (50 µM). cECs were incubated with different agonists for 15 min while TRPV4 current development was monitored. Data are presented as means ± SEM (**p<0.01, one-way ANOVA followed by Dunnett’s multiple comparisons test; n = 11–17 cECs).
Figure 6 with 3 supplements
PGE2 simultaneously and reciprocally regulates TRPV4 and Kir2.1 channel activities.
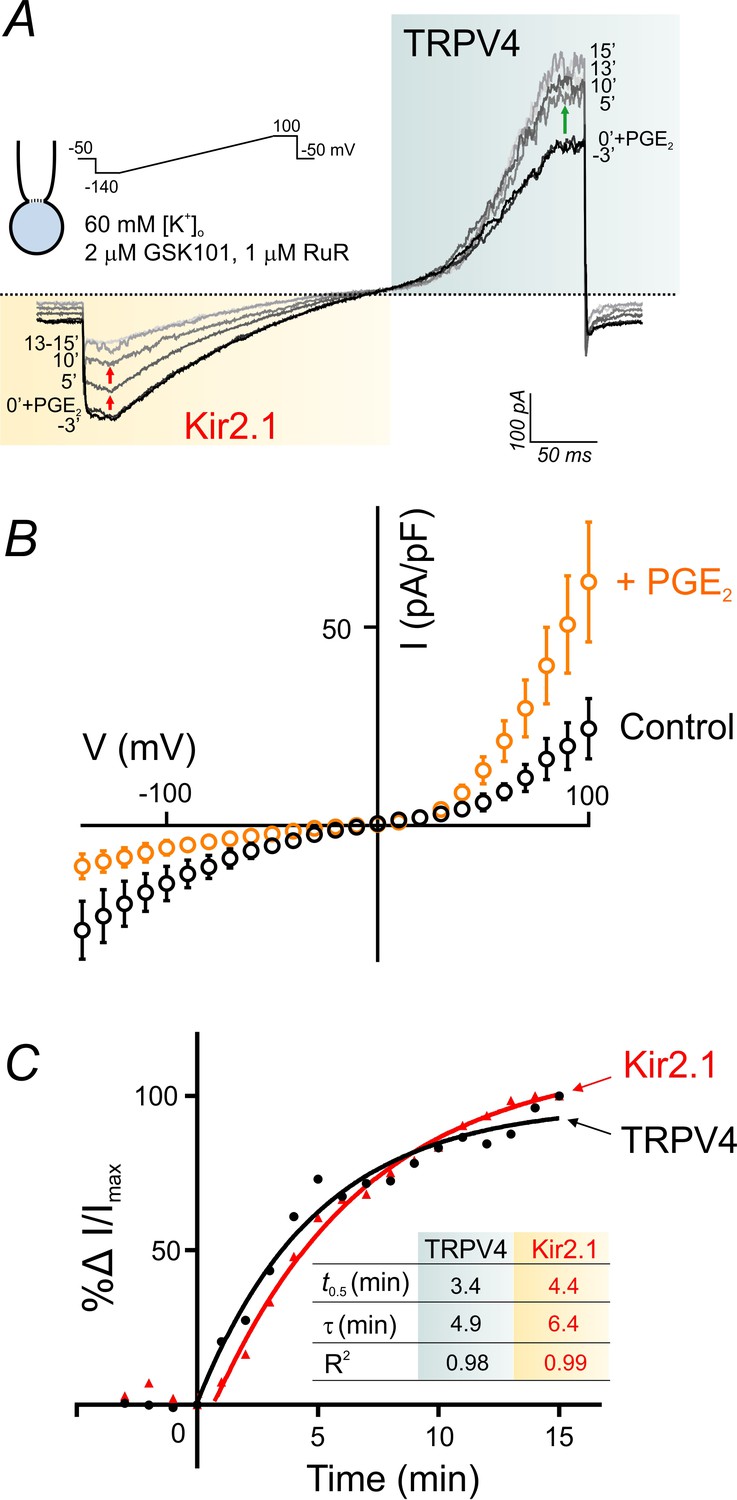
(A) Representative traces illustrate simultaneous recordings of Kir2.1 (inward) and TRPV4 (outward) currents in a cEC obtained using the perforated whole-cell configuration. Voltage ramps (300 ms, −140 to 100 mV) were used and the cEC was bathed in a 60 mM [K+]o solution supplemented with 2 µM GSK101 and 1 µM RuR. Traces represent currents before and for a duration of 15 min after the application of 2 µM PGE2. (B) Averaged current-voltage relationship (n = 5 cECs) corresponding to the experiment in A, before (control) and after (maximum changes at 15 min) application of PGE2. (C) Summary data showing the kinetics of TRPV4 current enhancement (black) and Kir2.1 current decline (red) following application of 2 µM PGE2 onto cECs (as in A) at room temperature. Points are average percentage change in normalized currents before and over 15 min after PGE2 application (n = 5). Curves are best fits of exponential change (rise: TRPV4; decay: Kir2.1). Inset table: kinetic parameters based on the two curve fits. Changes in currents plateaued ~13 min after the application of PGE2.
-
Figure 6—source data 1
Numerical data that were used to generate the chart in Figure 6B.
- https://doi.org/10.7554/eLife.38689.031
-
Figure 6—source data 2
Numerical data that were used to generate the chart in Figure 6C.
- https://doi.org/10.7554/eLife.38689.032
Figure 6—figure supplement 1
TRPV4 and Kir2.1 currents are preserved in cytoplasm-intact cECs.
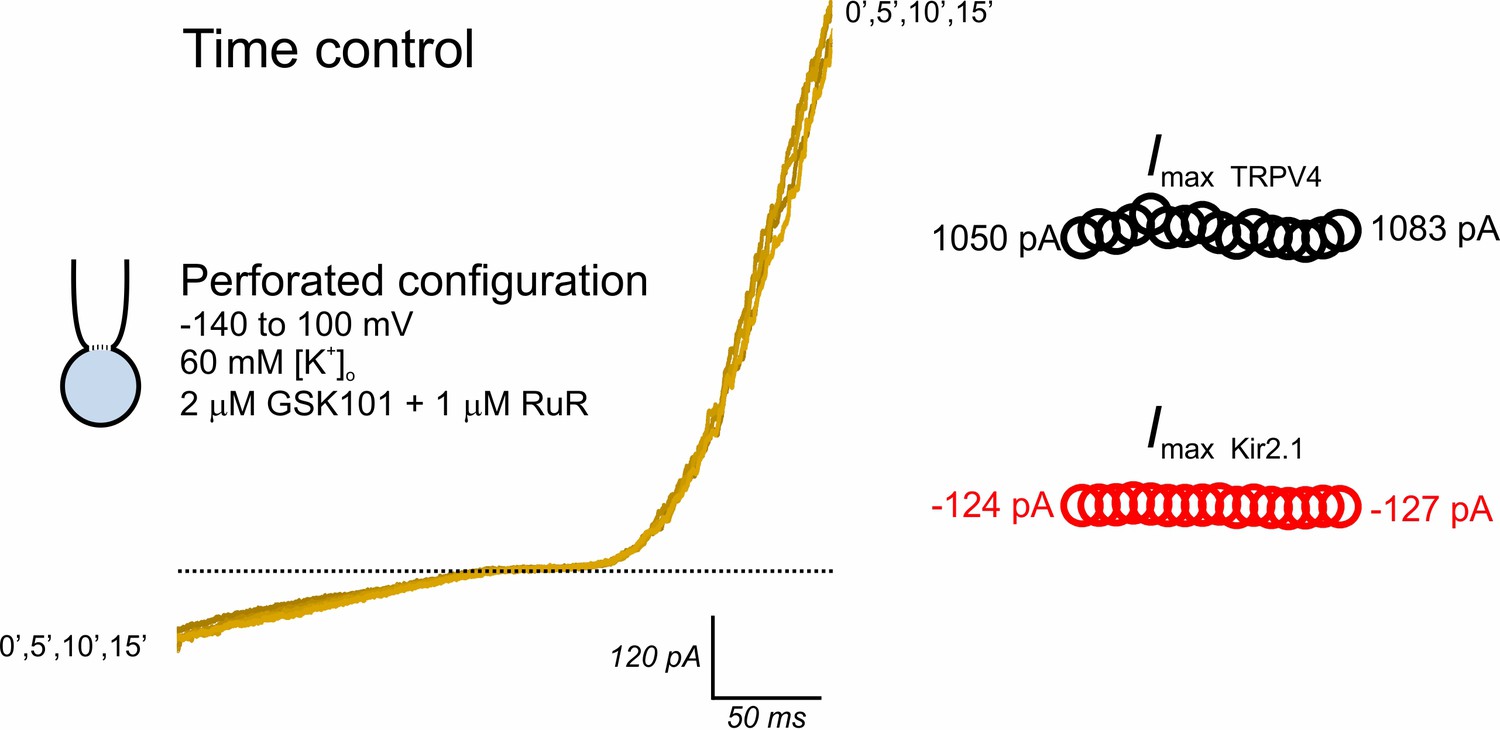
Representative traces obtained from a cEC using the same experimental protocol used in Figure 6 (perforated whole-cell configuration, 60 mM [K+]o, bath application of 2 µM GSK101 +1 µM RuR). Inward current reflects Kir2.1 activity, and outward current reflects TRPV4 activity. Traces (left) and scatter plots (right) track inward and outward currents over a duration of 15 min.
Figure 6—figure supplement 2
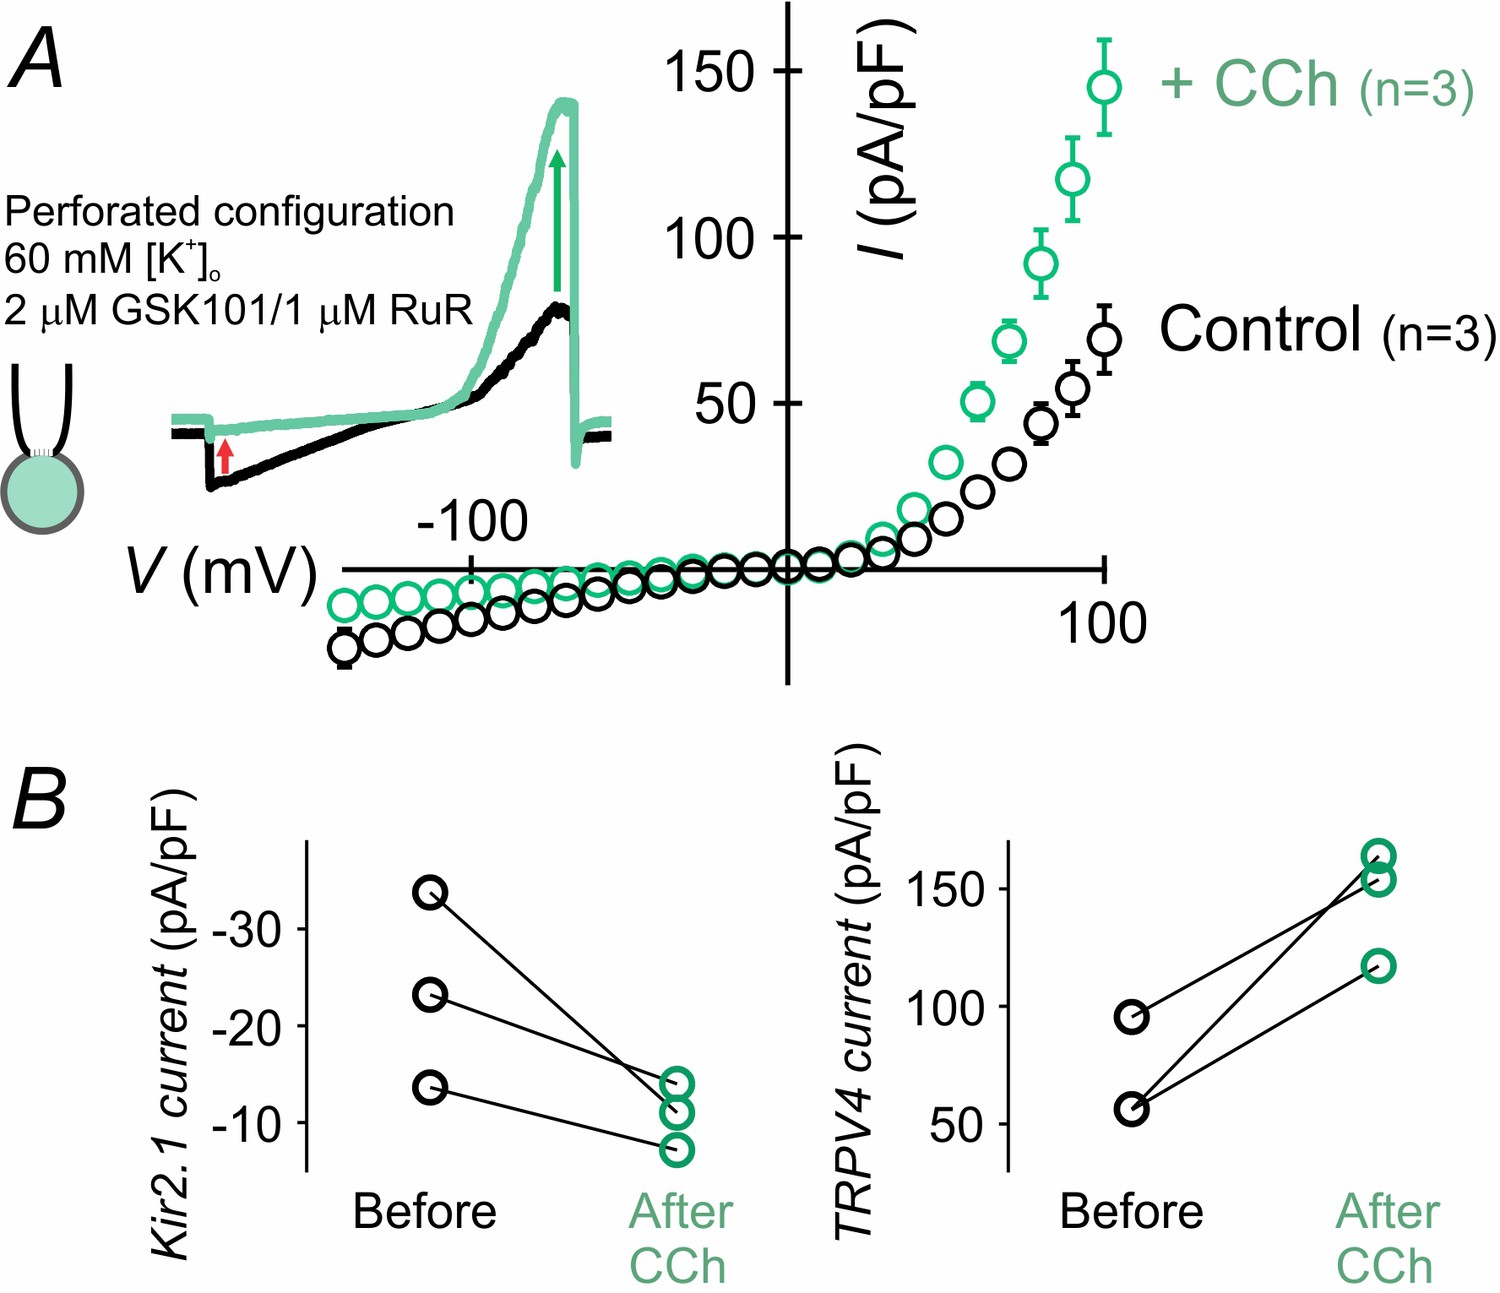
The muscarinic receptor agonist carbachol activates TRPV4 currents and inhibits Kir2.1 currents.
(A) Representative traces and averaged current-voltage relationship for Kir2.1 (inward) and TRPV4 (outward) currents, simultaneously recorded in cECs using the perforated whole-cell configuration. The cEC was bathed in 60 mM [K+]o solution supplemented with 2 µM GSK101 and 1 µM RuR, and currents were recorded using voltage ramps (300 ms, −140 to 100 mV). Traces and curves represent current values before and 15 min after the application of carbachol (CCh; 10 µM). (B) Paired scatter plots show maximum Kir2.1 (inward at −140 mV) and TRPV4 (outward at 100 mV) current densities before and 15 min after CCh (n = 3 each).
Figure 6—figure supplement 3
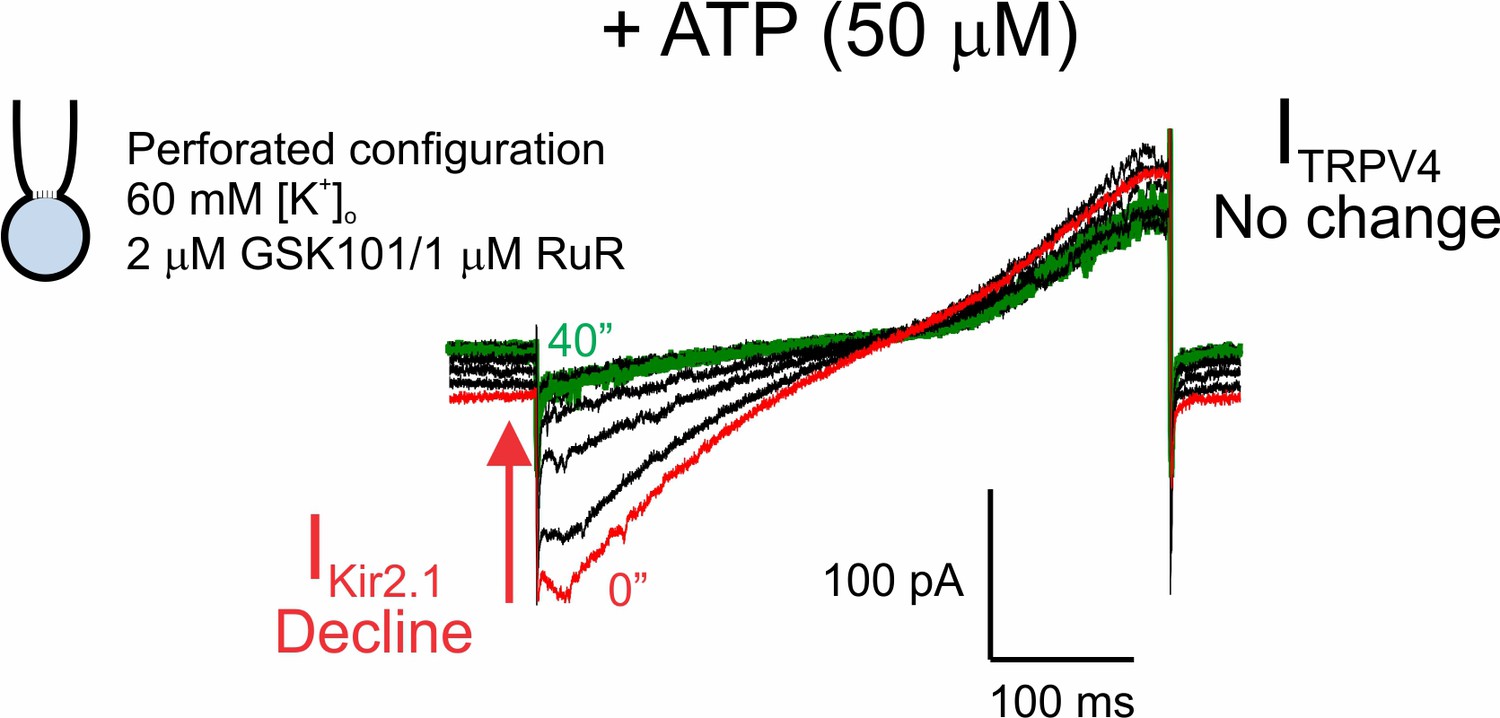
Purinergic receptor activation affects Kir2.1 channels but not TRPV4 channels.
Representative traces of Kir2.1 (inward) and TRPV4 (outward) currents in a cEC, simultaneously recorded using the perforated whole-cell configuration. The cEC was bathed in 60 mM [K+]o solution supplemented with 2 µM GSK101 and 1 µM RuR, and currents were recorded using voltage ramps (300 ms, −140 to 100 mV). Traces represent current values before and at various times up to 40 min after the bath-application of 50 µM Na-ATP.
Figure 7
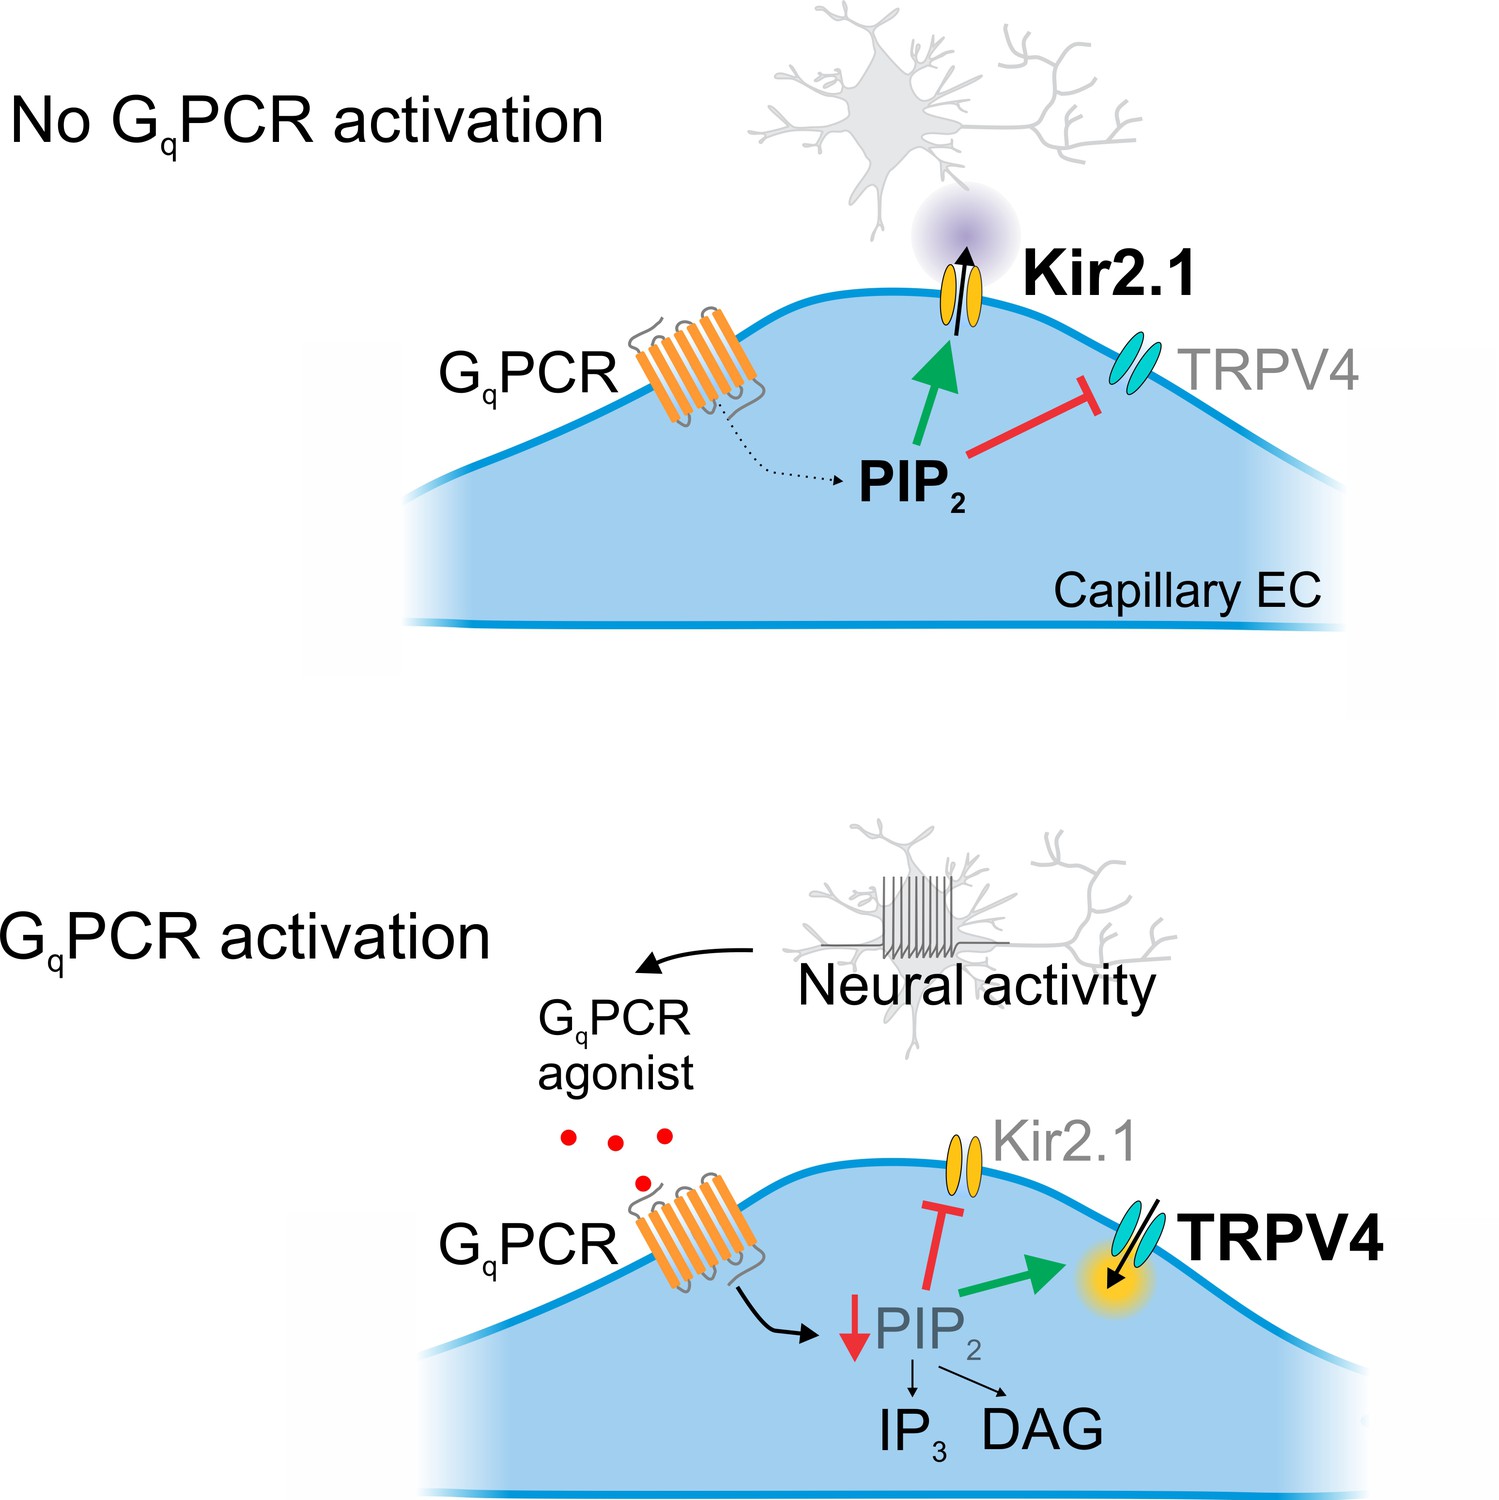
Cartoon representation of GqPCR-mediated reciprocal effects on capillary ion channel activity.
Schematic diagram summarizing the proposed mechanism. Top: In the absence of GqPCR stimulation, endogenous PIP2 levels are sufficient to tonically inhibit TRPV4 channels and maintain Kir2.1 channel activity. Bottom: GqPCR activation with an agonist stimulates PIP2 hydrolysis, resulting in the loss of PIP2-mediated maintenance of Kir2.1 activity and inhibition of TRPV4 activity.
Tables
Key resources table
| Reagent type (species) or resource | Designation | Source or reference | Identifiers | Additional information |
|---|---|---|---|---|
| Strain, strain background (Mus musculus, males) | TRPV4 Knockout (TRPV4-/-) mice, C57BL/6J background | Thorneloe et al. (2008) | PMID: 18499743 | |
| Strain, strain background (Mus musculus, males) | C57BL/6J | The Jackson Laboratory | RRID:IMSR_JAX:000664 | |
| Chemical compound, drug | GSK1016790A (GSK101) | Sigma | Cat#: G0798 | |
| Chemical compound, drug | Ruthenium red (RuR) | Sigma | Cat#: R2751 | |
| Chemical compound, drug | Adenosine 5′-triphosphate magnesium salt (Mg-ATP) | Sigma | Cat#: A9187 | |
| Chemical compound, drug | Adenosine 5′-triphosphate sodium salt | Sigma | Cat#: A2383 | |
| Chemical compound, drug | HC-067047 | Sigma | Cat#: SML0143 | |
| Chemical compound, drug | KT5823 | Sigma | Cat#: K1388 | |
| Chemical compound, drug | PIK93 | Tocris | Cat#: 6440 | |
| Chemical compound, drug | Phenylarsine oxide (PAO) | Sigma | Cat# P3075 | |
| Chemical compound, drug | H-89 dihydrochloride | Tocris | Cat# 2910 | |
| Chemical compound, drug | Calphostin C | Tocris | Cat#: 1626 | |
| Chemical compound, drug | LY294002 hydrochloride | Tocris | Cat#: 1130 | |
| Chemical compound, drug | AH6809 | Tocris | Cat#: 0671 | |
| Chemical compound, drug | SC51322 | Tocris | Cat#: 2791 | |
| Chemical compound, drug | U-73122 | Sigma | Cat#: U6756 | |
| Chemical compound, drug | U-73343 | Sigma | Cat#: U6881 | |
| Chemical compound, drug | Poly-L-lysine hydrochloride | Sigma | Cat# 2658 | |
| Chemical compound, drug | Gö6976 | Calbiochem | Cat#: 365250 | |
| Chemical compound, drug | Wortmannin | Sigma | Cat#: W1628 | |
| Chemical compound, drug | PI(4,5)P2 (1,2-dioctanoyl) (sodium salt) | Cayman | Cat#: 64910 | |
| Chemical compound, drug | PI(4,5)P2 (1,2-dipalmitoyl) (sodium salt) | Cayman | Cat#: 10008115 | |
| Chemical compound, drug | Prostaglandin E2 | Sigma | Cat#: 5640 | |
| Chemical compound, drug | SLIGRL-NH2 | Tocris | Cat#: 1468 | |
| Chemical compound, drug | Carbachol | Sigma | Cat#: C4382 | |
| Chemical compound, drug | Cyclopiazonic acid from Penicillium cyclopium (CPA) | Sigma | Cat#: C1530 | |
| Chemical compound, drug | Guanosine 5′-triphosphate sodium salt (GTP) | Sigma | Cat#: G8877 | |
| Chemical compound, drug | Adenosine 5′-[γ-thio]triphosphate tetralithium salt | Sigma | Cat#: A1388 | |
| Chemical compound, drug | 11,12-Epoxyeico satrienoic acid (11,12-EET) | Sigma | Cat#: E5641 | |
| Chemical compound, drug | 4α-Phorbol 12,13- didecanoate (4α-PDD) | Sigma | Cat#: P8014 | |
| Chemical compound, drug | 1,2-Bis (2-aminophenoxy) ethane-N,N,N′,N′- tetraacetic acid tetrapotassium salt (BAPTA) | Sigma | Cat#: A9801 | |
| Software, algorithm | Prism | GraphPad | RRID:SCR_002798 https://www.graphpad.com/ scientific-software/prism/ | |
| Software, algorithm | Clampfit 10.7 | Axon Instruments | RRID:SCR_011323 https://www.moleculardevices.com/products/axon-patch-clamp-system |
Additional files
-
Transparent reporting form
- https://doi.org/10.7554/eLife.38689.034
Download links
A two-part list of links to download the article, or parts of the article, in various formats.
Downloads (link to download the article as PDF)
Open citations (links to open the citations from this article in various online reference manager services)
Cite this article (links to download the citations from this article in formats compatible with various reference manager tools)
PIP2 depletion promotes TRPV4 channel activity in mouse brain capillary endothelial cells
eLife 7:e38689.
https://doi.org/10.7554/eLife.38689


