Insulin regulates POMC neuronal plasticity to control glucose metabolism
- Monash University, Australia
- The University of Melbourne, Australia
- University of Warwick, United Kingdom
- Max Planck Institute for Metabolism Research, Germany
- University Hospital Cologne, Germany
- University of Cologne, Germany
- National Center for Diabetes Research, Germany
- Purdue University, United States
- Yale University School of Medicine, United States
- University of Veterinary Medicine, Europe
Figures
Figure 1 with 2 supplements

POMC neurons display differential responses to insulin dependent on TCPTP.
Whole-cell patch clamp recording of hypothalamic POMC neurons in response to insulin (100 nM) in Pomc-eGFP mice. (a) Representative traces of individual POMC neurons displaying either excitation (depolarisation) or inhibition (hyperpolarisation) or POMC neurons that are non-responsive to insulin. (b) Grouped POMC population insulin responses, (c) membrane potential change and firing frequencies recorded from the entire rostral-caudal extent of the hypothalamic POMC neuronal population. Electrophysiological responses were measured in n = 53 independent neurons across 8–10 mice and analysed using a two-tailed t-test. (d) Camera lucida image depicting topographical localisation of insulin-responsive POMC neuronal subtypes. During recordings, patch clamped POMC neurons were filled with biocytin and post-recording ex vivo sections were incubated in paraformalydhyde and processed for biocytin, GFP and TCPTP immunohistochemistry. (e) Representative micrographs depicting TCPTP positive and negative patch-clamped POMC neurons and (f) insulin responsiveness and TCPTP expression correlation. To determine the functional role of TCPTP in POMC neuronal insulin sensitivity, whole-cell patch clamp recording of POMC neurons in response to insulin (100 nM) were performed in (g-h) Pomc-Cre;Ptpn2fl/fl (POMC-TC) mice on the on the Z/EG reporter background or (i-j) in Pomc-eGFP mice pre-treated with vehicle or TCPTP inhibitor (compound 8, 20 nM). (g, i) Grouped POMC population insulin responses, (h, j) membrane potential change and firing frequencies recorded from the entire rostral-caudal extent of the hypothalamic POMC neuronal population. (k–l) Whole-cell patch clamp recording of POMC neurons from 8 to 10 week high fat fed Pomc-eGFP mice pre-treated with vehicle or TCPTP inhibitor (compound 8, 20 nM) in response to insulin (100 nM). (k) Grouped POMC population insulin responses, (l) membrane potential change and firing frequencies recorded from the entire rostral-caudal extent of the hypothalamic POMC neuronal population. Results shown are means ±SEM for the indicated number of cells in pie charts. Electrophysiological responses were measured in (g-h) 33, (i–j) 58 and k-l) 34 (vehicle) and 35 (TCPTP inhibitor) independent neurons across 8–10 mice and analysed using a two-tailed t-test. (m) 8–10 week-old POMC-TC or Ptpn2fl/fl overnight fasted male mice were administered (intraperitoneal) saline or 0.85 mU/g insulin and 90 min later brains fixed with paraformaldehyde and processed for paraventricular hypothalamus (PVH) c-Fos immunoreactivity. Data was analysed using a two-way ANOVA followed by Tukey multiple comparison test. Representative images and quantified (means ± SEM) results are shown for the indicated number of cells/mice. (b, g, I, k) date rounded up to the nearest integer.
Figure 1—figure supplement 1

Diet-induced obesity promotes TCPTP expression in POMC neurons.
Pomc-eGFP (C57BL/6) mice were chow-fed or high fat fed for 8 weeks. (a) Hypothalami were collected in the fed state (4 hr from start of dark cycle; Figure 2b) and either (b) mediobasal hypothalami (MBH) from satiated mice were microdissected for immunoblotting, or (c) whole-brains from satiated mice were paraformaldehyde-fixed and processed for GFP/TCPTP dual immunohistochemistry. Representative images and quantified (means ±SEM) results are shown and significance determined using a two-tailed t-test. (d) 8–10 week-old POMC-TC or Ptpn2fl/fl overnight fasted mice were administered (intraperitoneal) saline or 5 mU/g insulin for 15 min and paraformaldehyde-fixed brains processed for immunofluorescence microscopy monitoring for p-AKT ARC immunoreactivity. Representative images and quantified (means ±SEM) results are shown and significance determined using a two-way ANOVA followed by Sidak multiple comparison test.
Figure 1—figure supplement 2
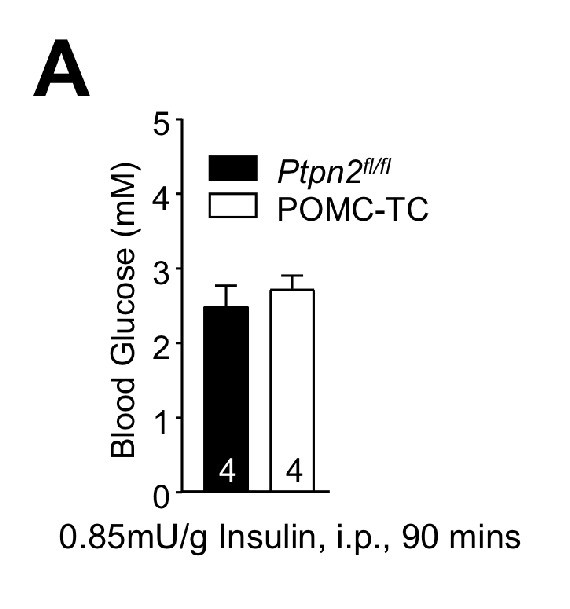
Intraperitoneal insulin-induced hypoglycaemia is not altered in POMC-TC mice.
(a) 8–10 week-old Ptpn2fl/fl or POMC-TC male mice were fasted overnight and administered 0.85 mU/g insulin intraperitoneally and blood glucose levels determined after 90 min. Quantified (means ± SEM) results are shown for the indicated number of mice.
Figure 2 with 2 supplements
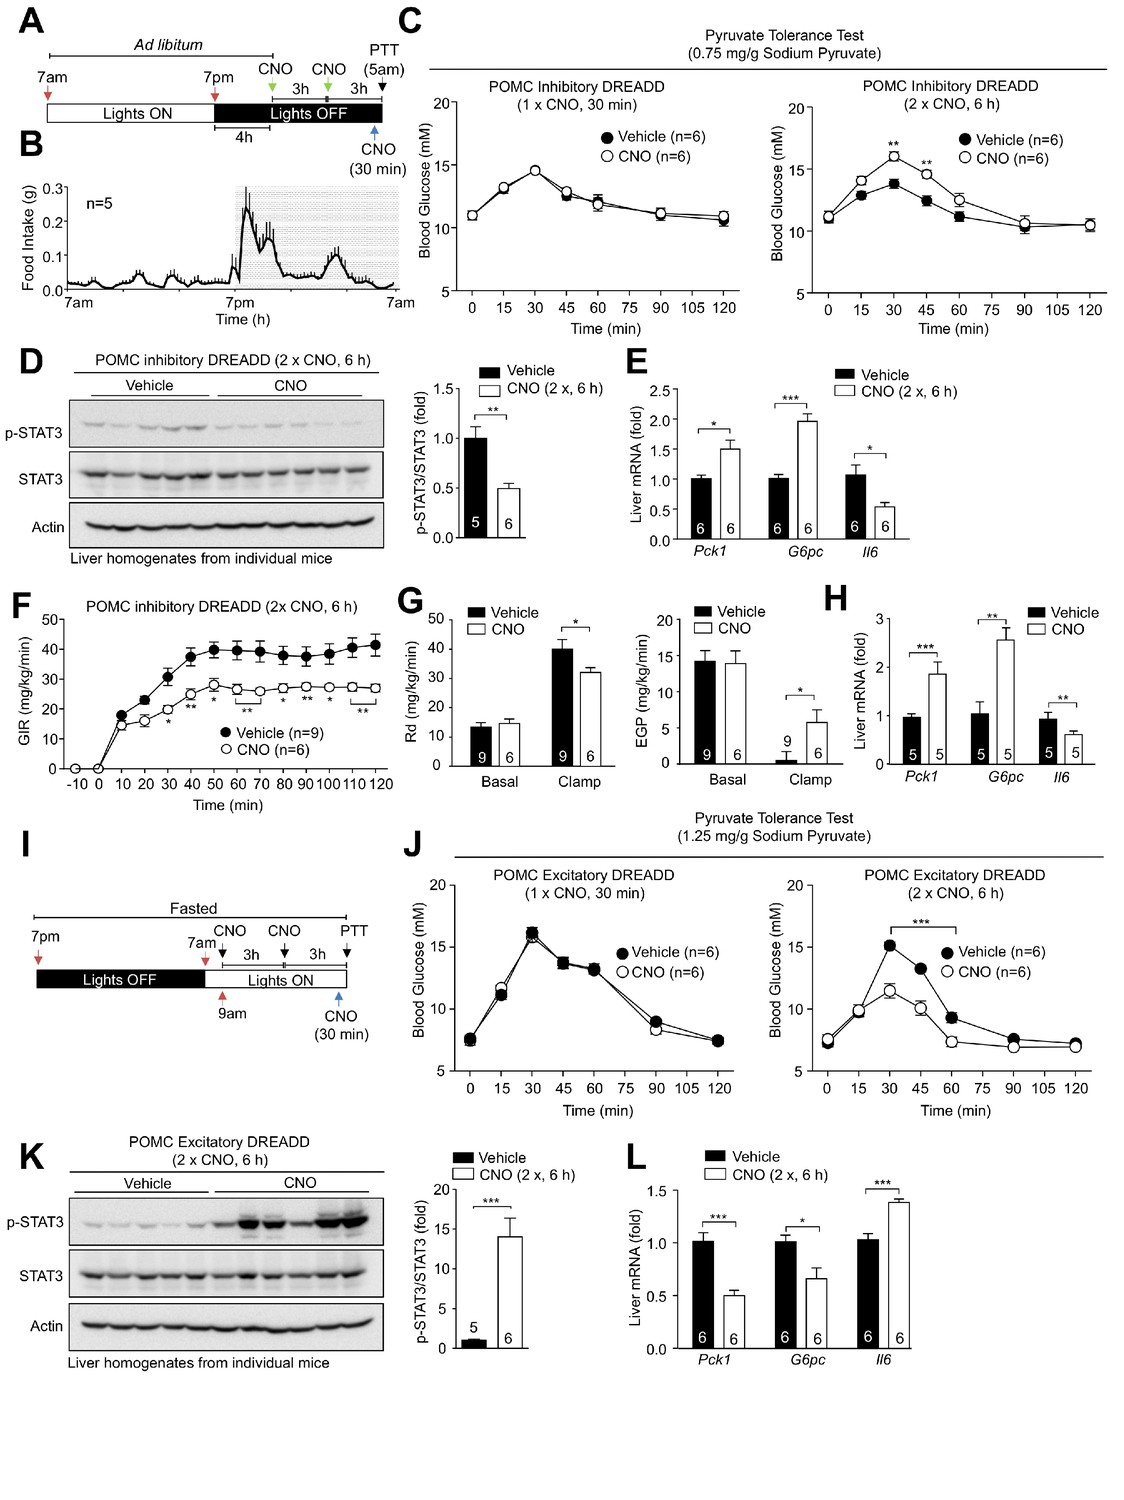
Pharmacogenetic stimulation or inhibition of hypothalamic POMC neurons modulates hepatic glucose metabolism.
8-week-old Pomc-Cre mice (on the Pomc-eGFP reporter background) were bilaterally injected with rAAV-hSyn-DIO-hM4D(Gi)-mCherry into the ARC. (a) Inhibitory DREADD experimental paradigm schematic and (b) C57BL/6 feeding profile. (c–e) Two weeks post-AAV injection mice were administered vehicle or clozapine-N-oxide (CNO; 0.3 mg/kg, intraperitoneal) as indicated for either 30 min (one injection) or 6 hr (two injections 3 hr apart) prior to being processed for (c) pyruvate tolerance tests (0.75 mg/g; statistical differences were determined using a two-way ANOVA with repeated measures followed by Sidak multiple comparison test. In separate experiments mice were administered vehicle or CNO (0.3 mg/kg, intraperitoneal) over 6 hr (two injections 3 hr apart) and livers extracted for (d) immunoblotting (data was analysed using a two-tailed t-test) and (e) quantitative PCR, (data was analysed using a two-tailed t-test) or (f-h) mice were subjected to hyperinsulinemic-euglycemic conscious clamps (data was analysed using a two-way ANOVA with repeated measures followed by Sidak multiple comparison test). (f) Glucose infusion rates (GIR), (g) glucose disappearance rates (Rd) and basal and clamped endogenous glucose production (EGP; glucose appearance rate minus GIR) were determined and (h) livers extracted for quantitative PCR (data was analysed using a two-tailed t-test). (i–l) 8-week-old Pomc-Cre mice were bilaterally injected with rAAV-hSyn-DIO-hM3D(Gq)-mCherry into the ARC. (i) Excitatory DREADD experimental paradigm schematic. Two weeks post AAV injection mice were fasted overnight and administered vehicle or CNO (0.3 mg/kg, intraperitoneal) either 30 min (one injection) or 6 hr (two injections 3 hr apart) prior to being processed for (j) pyruvate tolerance tests (1.25 mg/g); significance was assessed using a two-way ANOVA with repeated measures followed by Sidak multiple comparison test. In a separate experiment, mice were fasted overnight and administered vehicle or CNO (0.3 mg/kg, intraperitoneal) as indicated over 6 hr (two injections 3 hr apart) and livers extracted for (k) immunoblotting and (l) quantitative PCR with significance being assessed using a two-tailed t-test in each case. Representative and quantified results are shown (means ± SEM) for the indicated number of mice.
Figure 2—figure supplement 1
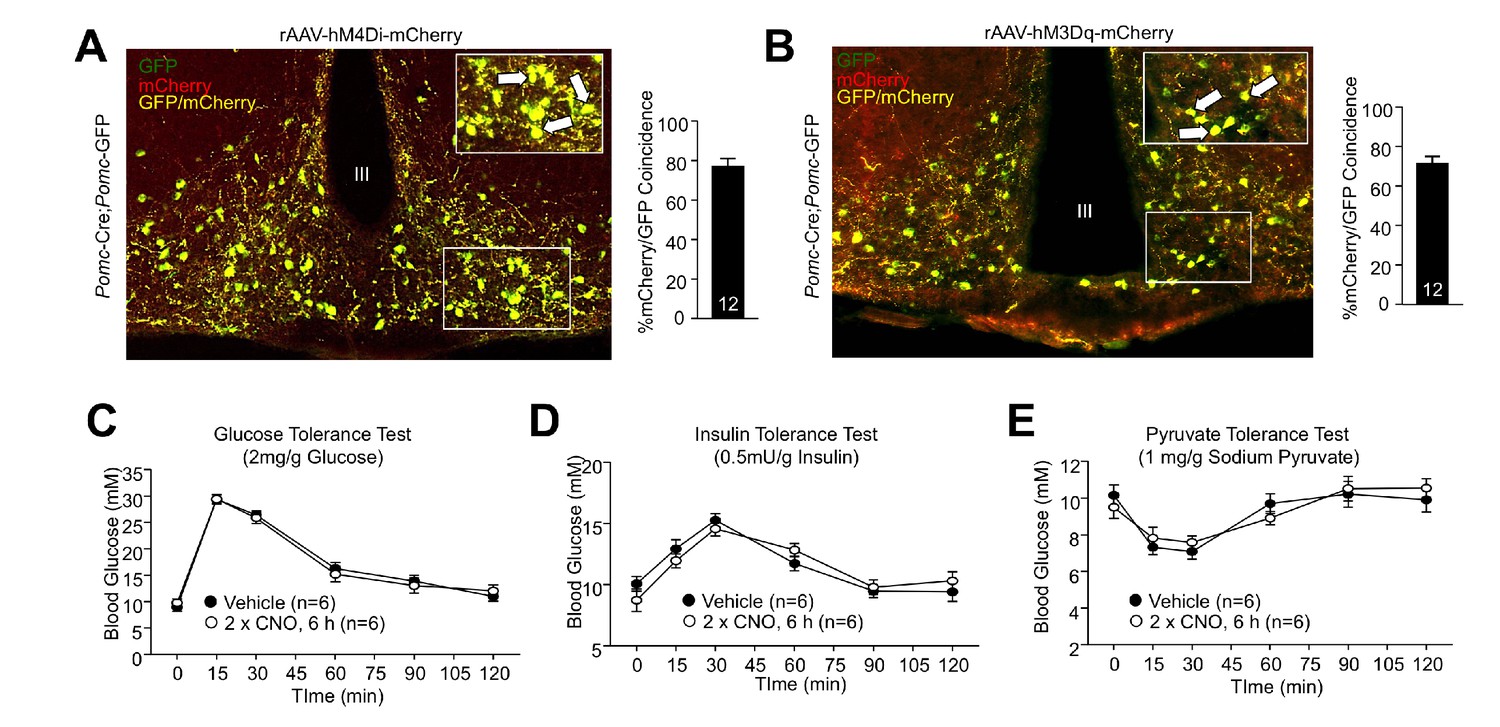
DREADDs in ARC POMC neurons.
8-week-old Pomc-Cre (on the Pomc-eGFP reporter background) mice were bilaterally injected with (a) rAAV-hSyn-DIO-hM4D(Gi)-mCherry or (b) rAAV-hSyn-DIO-hM3D(Gq)-mCherry into the ARC. Mice were perfused with paraformaldehyde and processed for hypothalamic mCherry/POMC immunohistochemistry. Representative micrographs depicting hypothalamic mCherry/POMC co-localisation. 8-week-old male Pomc-Cre mice were administered vehicle or CNO (0.3 mg/kg, intraperitoneal) over 6 hr (two injections 3 hr apart) and subjected to (c) glucose (2 mg/g), (d) insulin (0.5 mU/g), or (e) pyruvate tolerance tests (1 mg/g). Representative and quantified results are shown (means ± SEM) for the indicated number of mice.
Figure 2—figure supplement 2
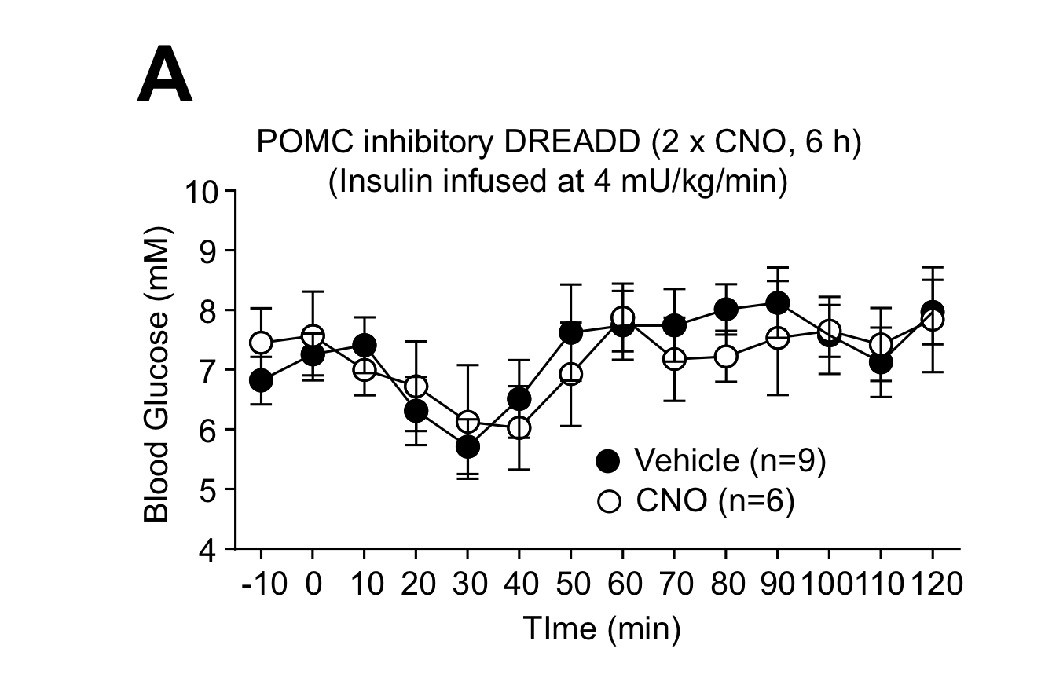
Clamped blood glucose levels in CNO-treated mice expressing inhibitory DREADDs in POMC neurons.
8-week-old Pomc-Cre mice were bilaterally injected with rAAV-hSyn-DIO-hM4D(Gi)-mCherry. Two weeks post injection mice were ad libitum fed and administered vehicle or clorazapine-N-oxide (CNO; 0.3 mg/kg, intraperitoneal) over 6 hr (two injections 3 hr apart) and subjected to hyperinsulinemic-euglycemic conscious clamps and blood glucose assessed for the duration of the clamps. Representative and quantified results are shown (means ± SEM) for the indicated number of mice.
Figure 3 with 1 supplement
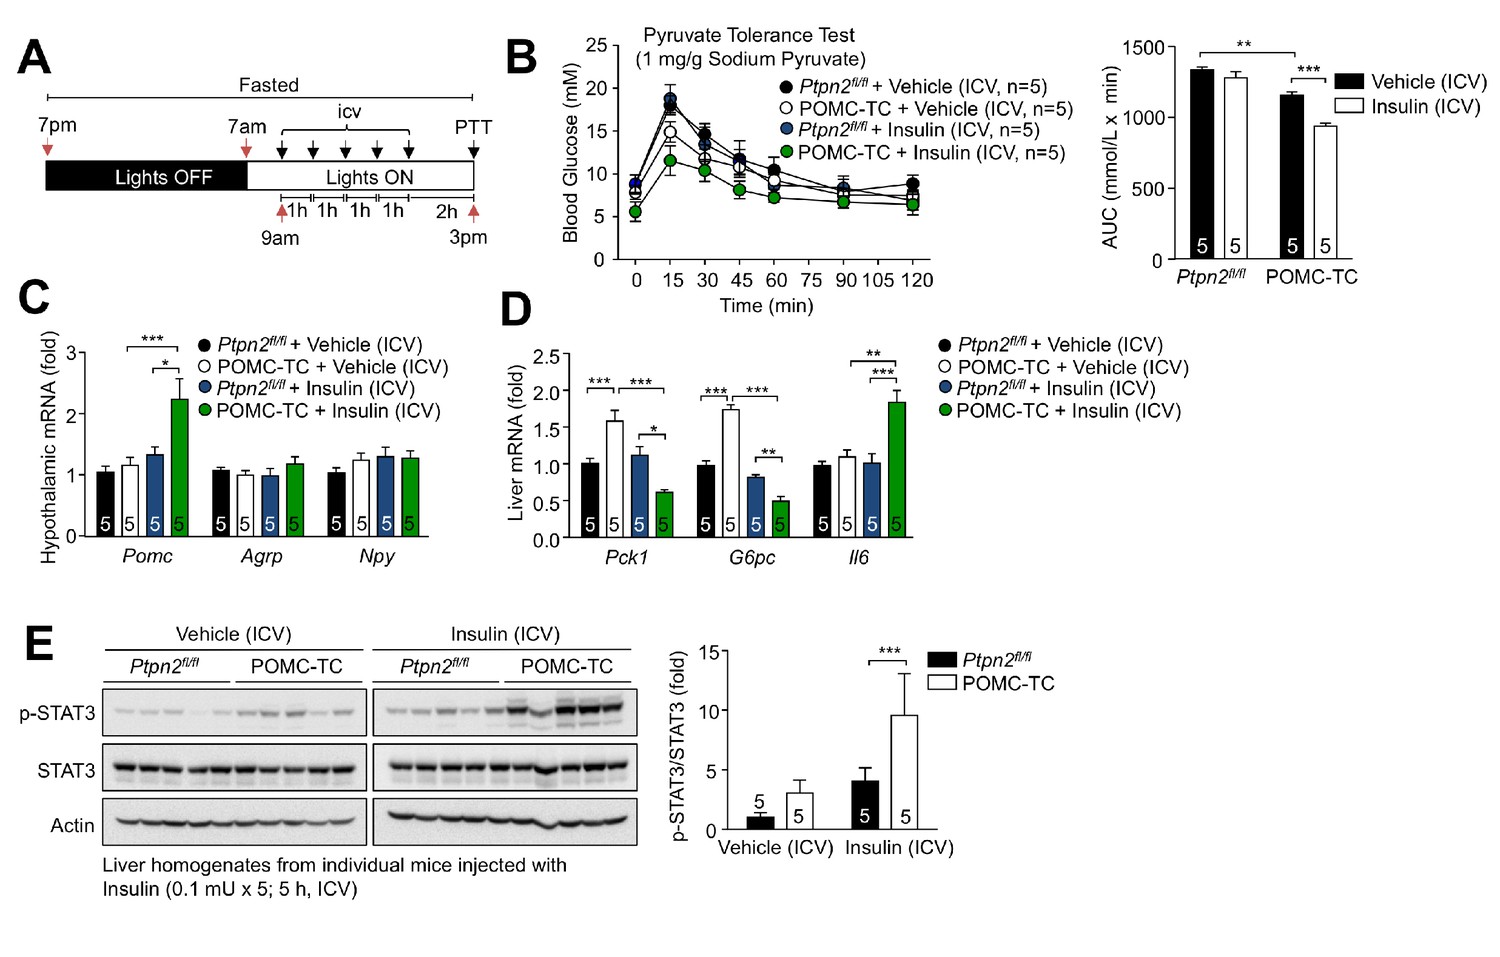
Deletion of TCPTP in POMC neurons enhances the insulin-induced and POMC-mediated repression of hepatic gluconeogenesis.
(a) Experimental paradigm schematic. 8–10 week-old POMC-TC or Ptpn2fl/fl overnight fasted male mice were administered intracerebroventricularly (ICV) saline or insulin (0.1 mU/animal, 5 injections over 5 hr) as indicated and subjected 1 hr later to either (b) pyruvate tolerance tests (1 mg/g; areas under curves were determined and statistical significance assessed using a two-way ANOVA followed by Sidak multiple comparison test) or hypothalami and livers were extracted for (c-d) quantitative PCR (significance assessed using a one-way ANOVA followed by Tukey multiple comparison test) and (e) immunoblotting (significance assessed using a two-way ANOVA followed by Sidak multiple comparison test). Representative and quantified results are shown (means ± SEM) for the indicated number of mice.
Figure 3—figure supplement 1
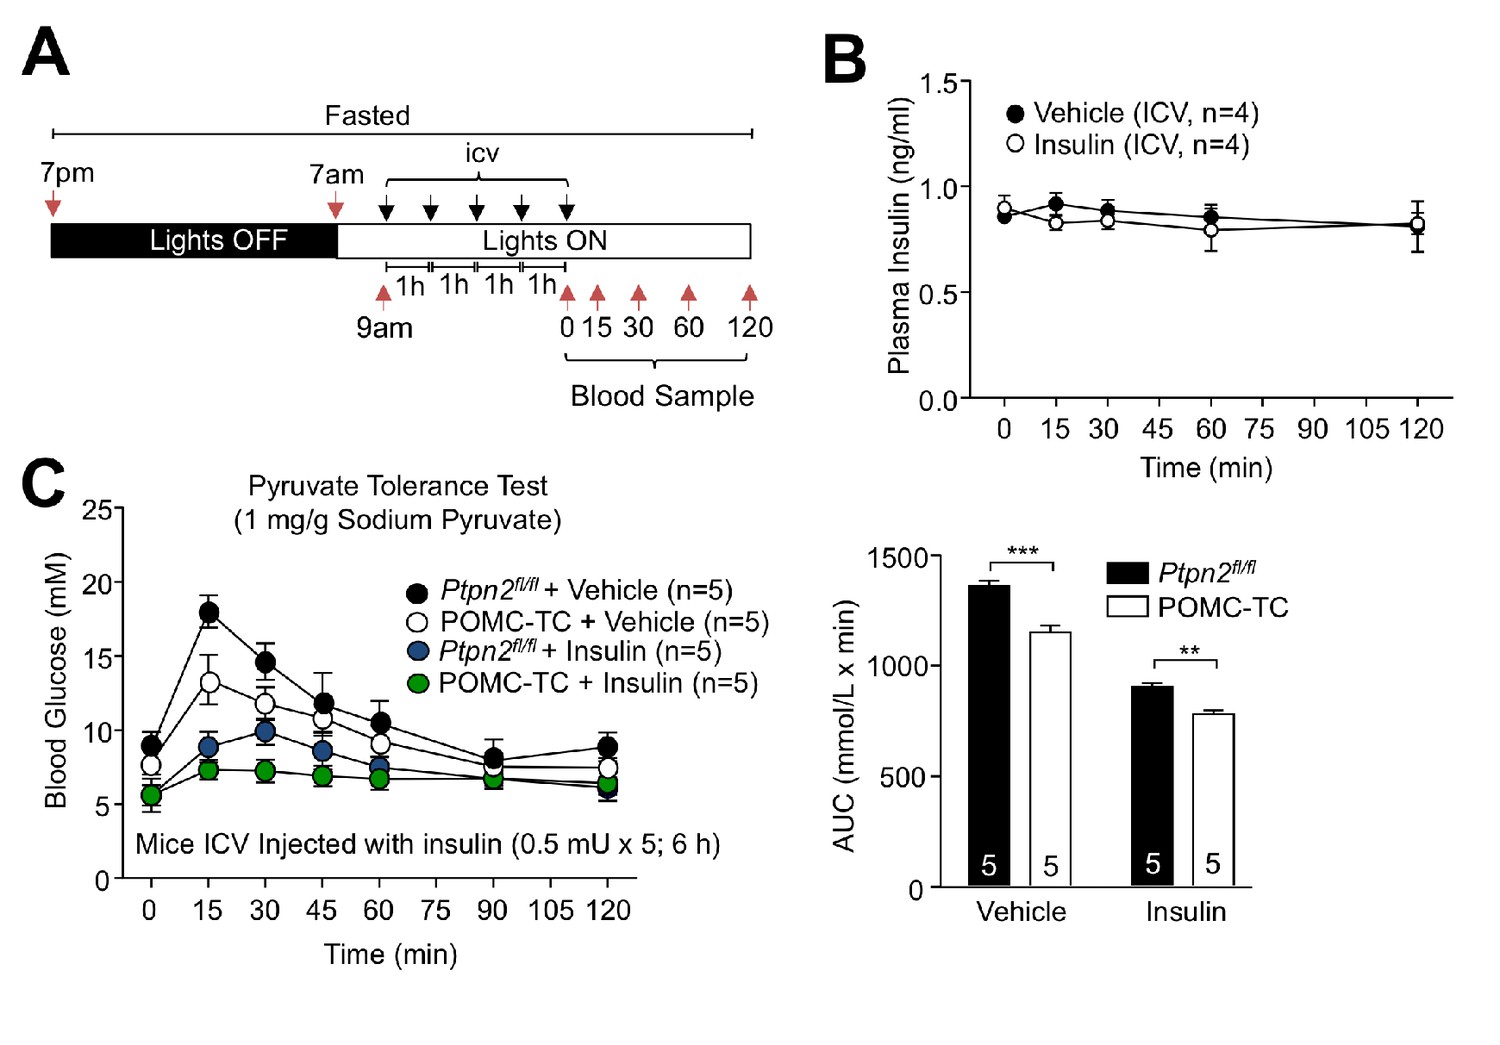
Effects of central insulin administration in POMC-TC mice on glucose metabolism.
(a–b) 8-week-old male C57BL/6J mice were fasted overnight and administered ICV saline or insulin (0.1 mU/animal, 5 injections over 5 hr) as indicated in (a) the schematic and (B) blood sampled at 0, 15, 30, 60 and 120 min post-injection and plasma insulin levels determined. (c) 8–10 week-old Ptpn2fl/fl or POMC-TC overnight fasted male mice were ICV administered saline or insulin (0.5 mU/animal, 5 injections over 5 hr) and subjected 1 hr later to pyruvate tolerance tests (1 mg/g); areas under curves were determined and significance was determined using a two-way ANOVA followed by Sidak multiple comparison test.
Figure 4 with 1 supplement

Deletion of TCPTP in POMC neurons improves whole-body glucose homeostasis and represses HGP.
Fed and fasted (a) blood glucose and (b) plasma insulin from 12-week-old POMC-TC or Ptpn2fl/fl male mice; significance was assessed using a two-way ANOVA followed by Tukey multiple comparison test. (c) 10–12 week-old male POMC-TC or Ptpn2fl/fl mice were subjected to (c) insulin (0.5 mU/g), (d) glucose (2 mg/g) or (e) pyruvate tolerance tests (1 mg/g); areas under curves were determined and statistical significance assessed using a two-tailed t-test. (f–g) Hyperinsulinemic-euglycemic clamps in 8–10 week-old POMC-TC or Ptpn2fl/fl fasted (4 hr) unconscious mice. GIR, Rd and basal and clamped EGP were determined, and statistical significance assessed using a two-tailed t-test. (g) Livers were extracted from clamped mice and processed for (g) quantitative PCR and statistical significance assessed using a two-tailed t-test. (h) 10-week-old POMC-TC or Ptpn2fl/fl male mice were fasted 4 hr and injected with saline or insulin (0.3 mU/g, intraperitoneal) and livers extracted after 15 min for immunoblotting and significance determined using a two-way ANOVA followed by Sidak multiple comparison test. Representative and quantified results are shown (means ± SEM) for the indicated number of mice.
Figure 4—figure supplement 1
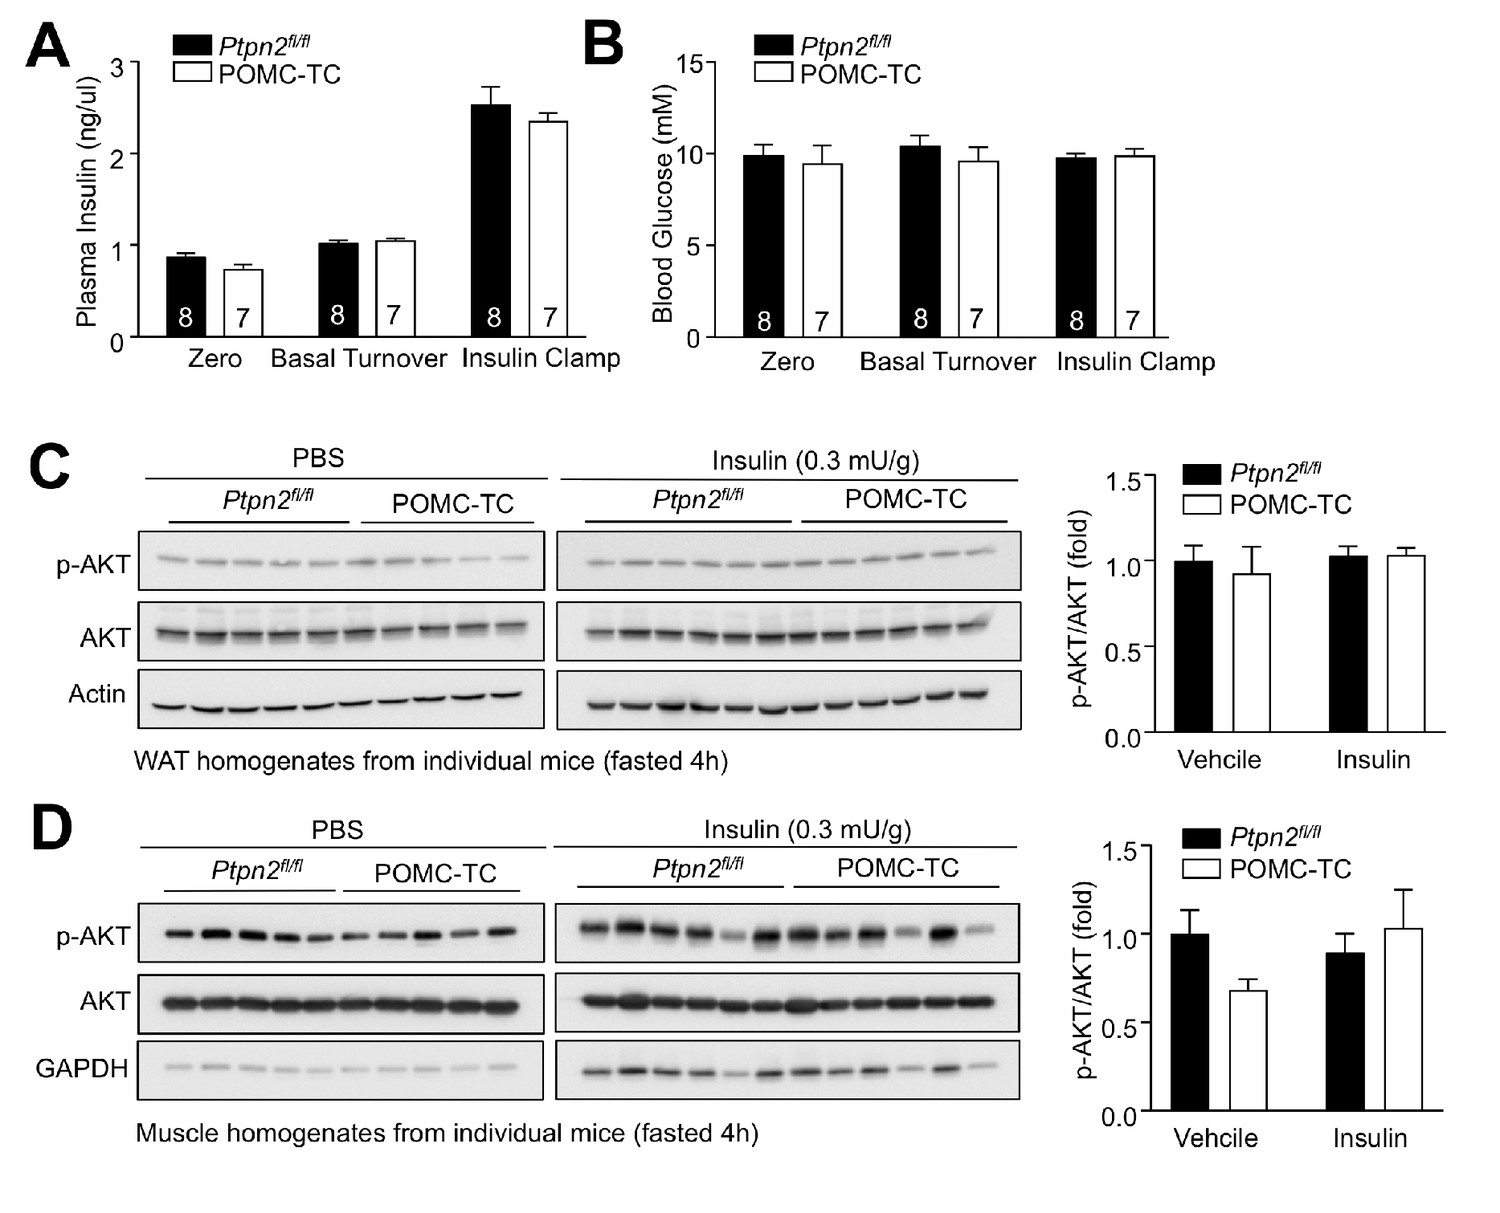
Glucose metabolism in POMC-TC mice.
(a–b) Hyperinsulinaemic-euglycemic clamps in 8–10 week-old Ptpn2fl/fl and POMC-TC fasted (4 hr) mice. Plasma insulin and blood glucose levels were measured. (c–d) 10-week-old Ptpn2fl/fl and POMC-TC male mice were fasted 4 hr and injected with saline or insulin (0.3 mU/g, intraperitoneal) and (c) epididymal white adipose tissue (WAT) and (d) gastrocnemius muscle extracted after 15 min for immunoblotting. Representative and quantified results are shown (means ± SEM) for the indicated number of mice.
Figure 5
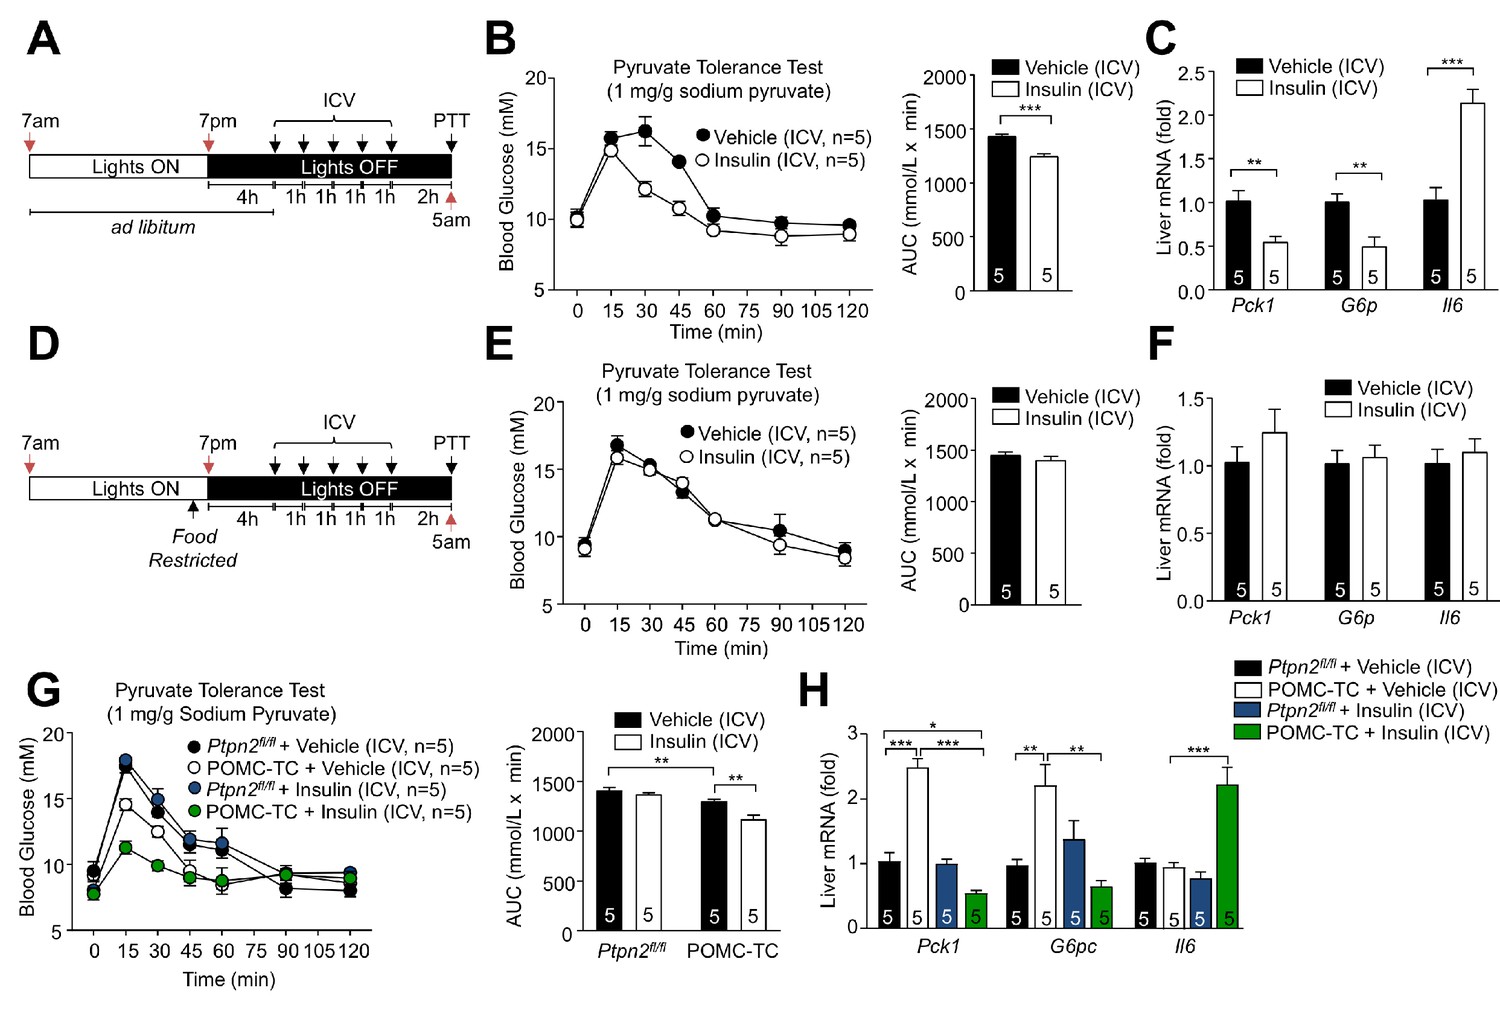
Feeding-induced repression of TCPTP in POMC neurons promotes the ICV insulin-induced repression of hepatic gluconeogenesis.
(a, d) Experimental paradigm schematics. 8–9 week-old male C57BL/6 mice were ad libitum fed till satiated or food-restricted (just prior to lights out, 6:30pm) and administered ICV saline or insulin (0.1 mU/animal, 5 injections over 5 hr) as indicated and subjected 1 hr later to either (b, e) pyruvate tolerance tests (1 mg/g; areas under curves were determined and significance determined using a two-tailed t-test) or livers were extracted for (c, f) quantitative PCR and significance determined using a two-tailed t-test. 8–10 week-old POMC-TC or Ptpn2fl/fl male mice were food-restricted and administered insulin or vehicle ICV as indicated above and subjected to either (g) pyruvate tolerance tests (1 mg/g; areas under curves were determined and significance determined using a two-tailed t-test) or livers were extracted for (h) quantitative PCR and significance determined using a one-way ANOVA. Representative and quantified results are shown (means ± SEM) for the indicated number of mice.
Figure 6 with 3 supplements
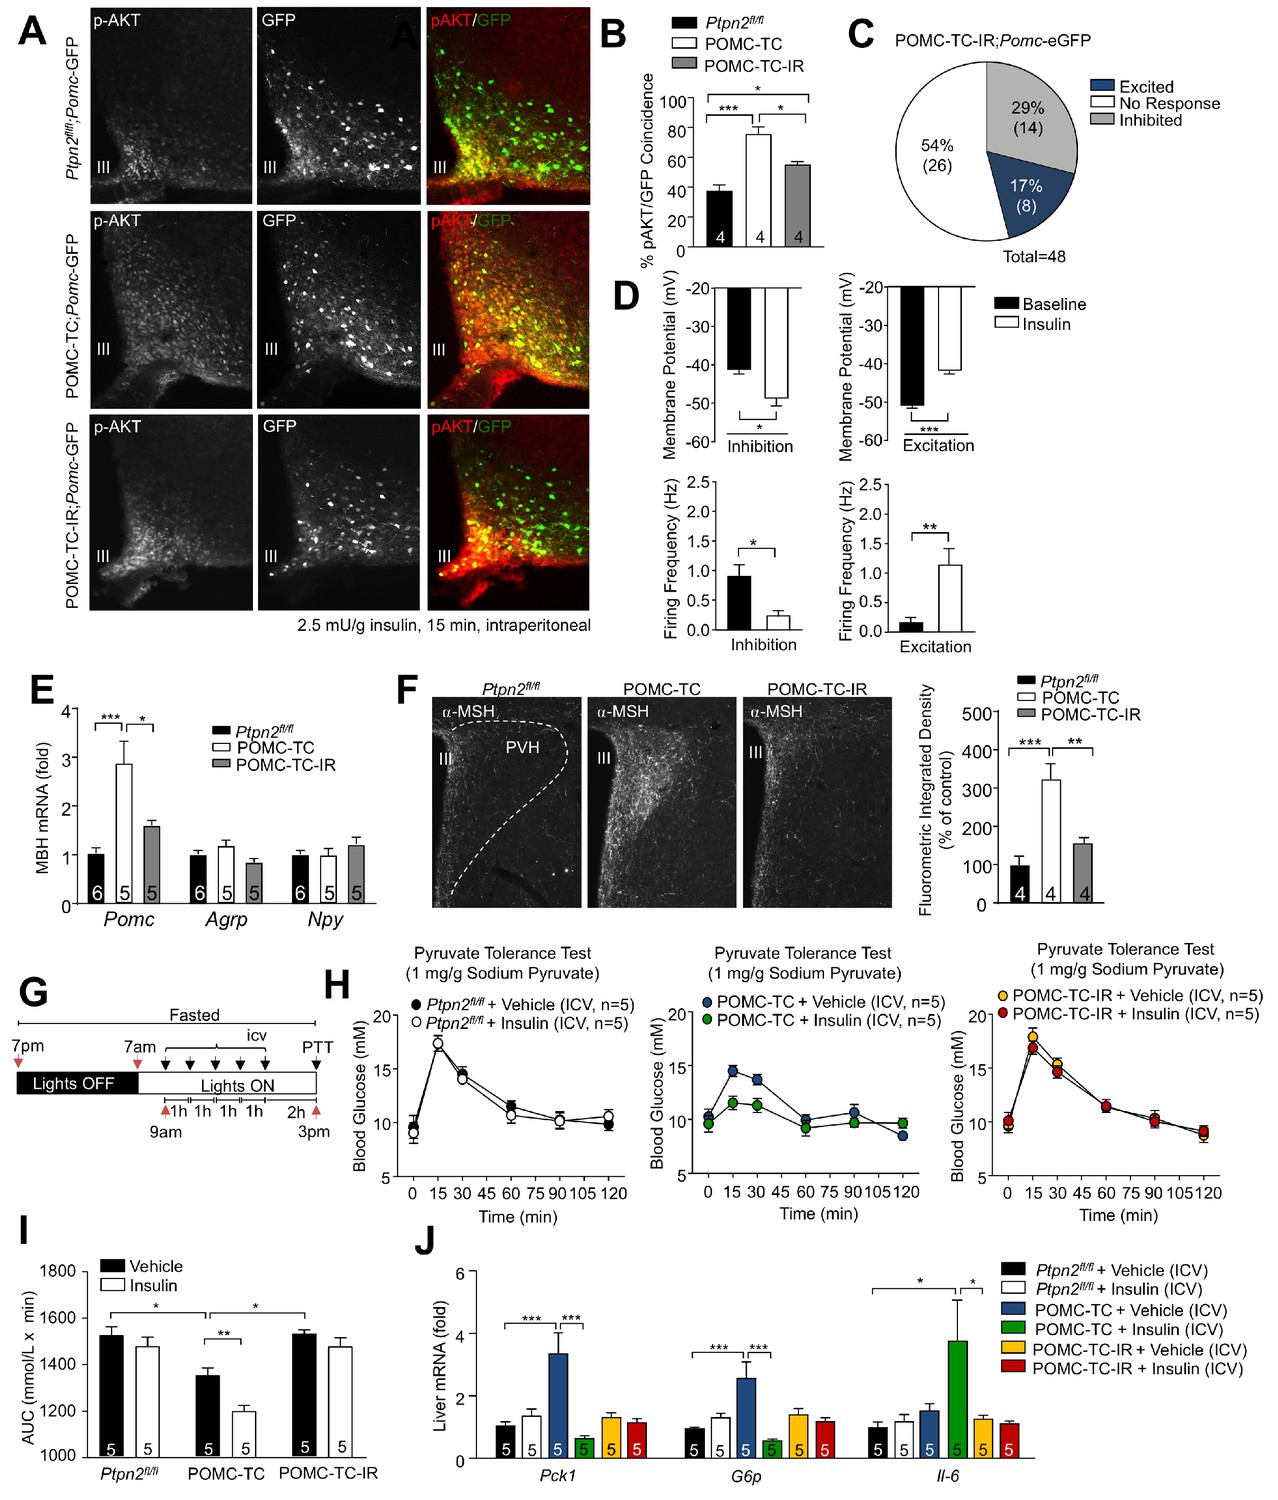
TCPTP regulation of insulin signaling alters POMC neuronal activation and the control of hepatic glucose metabolism.
(a–b) 8–10 week-old male Ptpn2fl/fl, POMC-TC or Pomc-Cre;Ptpn2fl/fl;Insrfl/+ (POMC-TC-IR) male mice on the Pomc-eGFP background were fasted overnight and intraperitoneally administered insulin (2.5 mU/g, 15 min) and brains extracted for ARC p-AKT immunohistochemistry and pAKT positive POMC neurons quantified across the rostral-caudal extent of the hypothalamus and significance determined using a one-way ANOVA followed by Tukey multiple comparison test. (c–d) Whole-cell patch clamp recordings of POMC neurons from Ptpn2fl/fl, POMC-TC or POMC-TC-IR mice on the Pomc-eGFP background in response to insulin (100 nM). (c) Grouped POMC population insulin responses, (d) membrane potential change and firing frequencies recorded from the entire rostral-caudal extent of the hypothalamic POMC neuronal population. Results shown are means ± SEM for the indicated number of cells in pie charts. Electrophysiological responses in n = 48 independent neurons were assessed across 8–10 mice and significance determined using a two-tailed t-test. 10–12 week-old male Ptpn2fl/fl, POMC-TC or POMC-TC-IR mice were fasted overnight and brains either (e) microdissected and MBH processed for quantitative PCR, or (f) paraformaldehyde-fixed and processed for immunofluorescence microscopy monitoring for α-MSH in the PVH; the fluorometric integrated density of α-MSH staining in the PVH was quantified and significance determined using a one-way ANOVA followed by Tukey multiple comparison test. 8–10 week-old Ptpn2fl/fl, POMC-TC or POMC-TC-IR overnight fasted male mice were administered ICV saline or insulin (0.1 mU/animal, 5 injections over 5 hr) and subjected 1 hr later to either (g-i) pyruvate tolerance tests (1 mg/g; areas under curves determined and statistical significance assessed using a two-way ANOVA followed by Tukey multiple comparison test) or livers were extracted for (j) quantitative PCR (significance assessed using a one-way ANOVA followed by Tukey multiple comparison test). In (c) values rounded up to the nearest integer. Representative and quantified results are shown (means ± SEM) for the indicated number of mice.
Figure 6—figure supplement 1
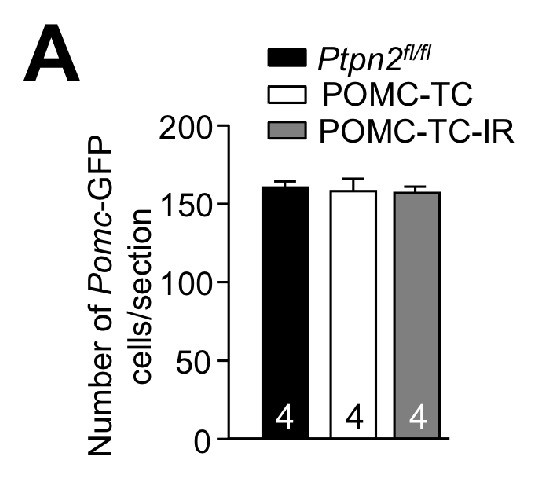
ARC POMC neurons in Ptpn2fl/fl, POMC-TC and POMC-TC-IR mice.
(a) Paraformaldehyde fixed brains from 8 to 10 week-old male Ptpn2fl/fl, POMC-TC and POMC-TC-IR male mice on the Pomc-eGFP background were processed for immunofluorescence microscopy monitoring for the expression of GFP. Quantified (means ± SEM) results are shown for the indicated number of mice.
Figure 6—figure supplement 2
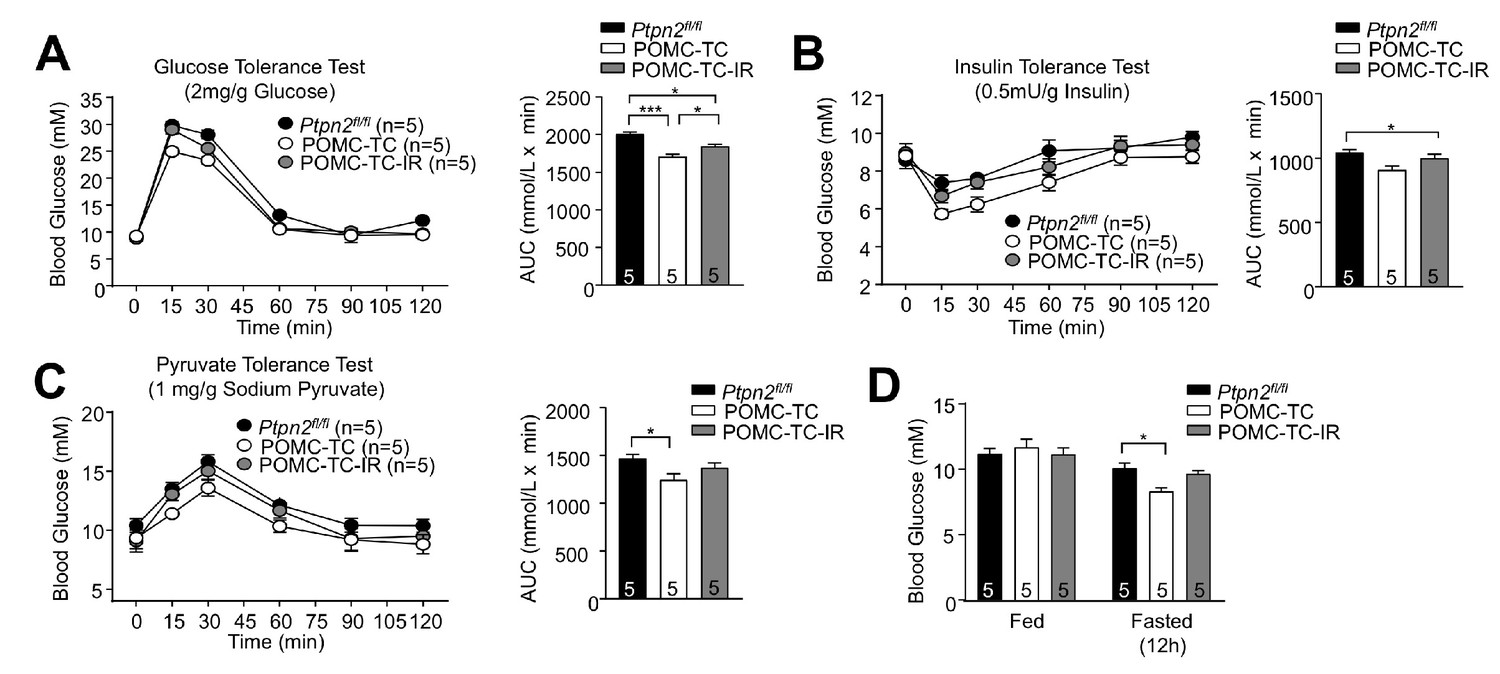
TCPTP regulation of insulin signaling alters the POMC neuronal control of glucose metabolism.
(a) Glucose (2 mg/g), (b) insulin (0.5 mU/g), and (c) pyruvate (1 mg/g) tolerance tests in 8–12 week-old male Ptpn2fl/fl, POMC-TC or POMC-TC-IR mice; areas under curves were determined and significance was determined using a one-way ANOVA followed by Tukey multiple comparison test. (d) Fed and fasted blood glucose levels in 10–12 week-old male Ptpn2fl/fl, POMC-TC or POMC-TC-IR mice; significance determined using a two-way ANOVA followed by Sidak multiple comparison test. Quantified (means ±SEM) results are shown for the indicated number of mice.
Figure 6—figure supplement 3
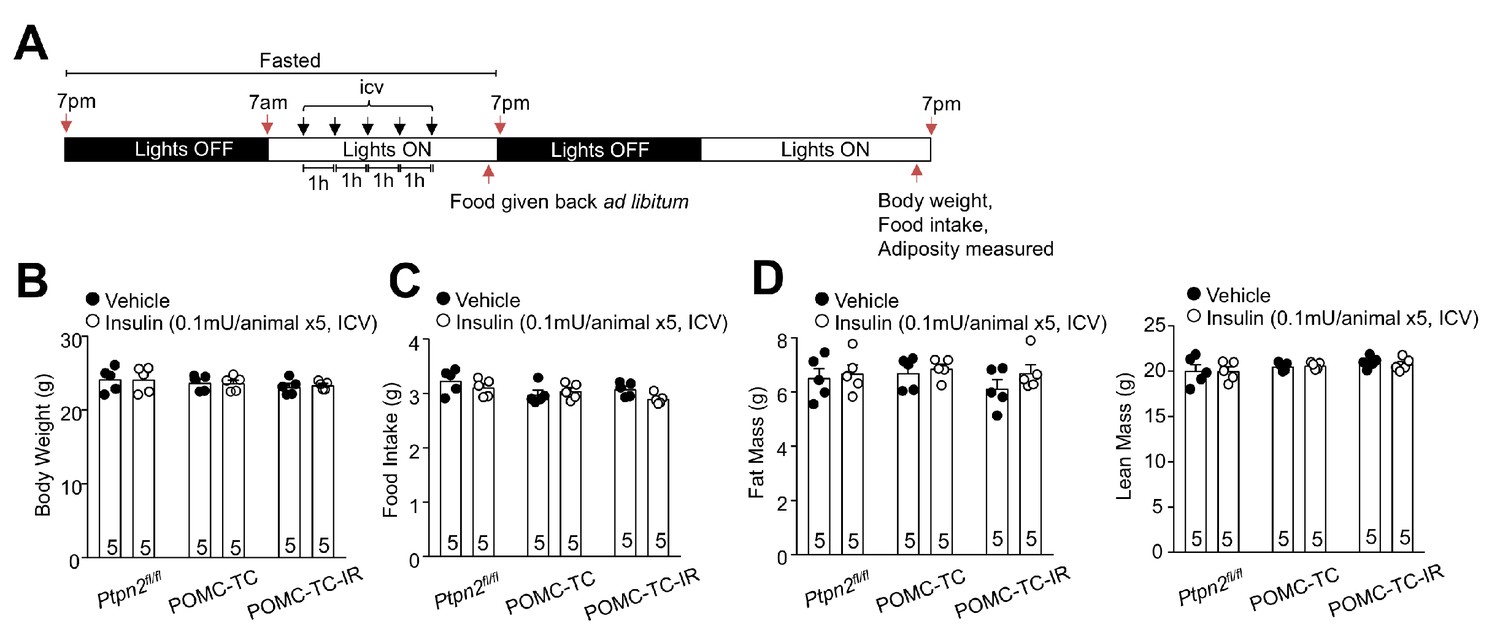
Intracerebroventricularly (ICV) administered insulin does not alter body weight, adiposity and food intake.
(a) Experimental paradigm schematic. 8-week-old male Ptpn2fl/fl, POMC-TC or POMC-TC-IR overnight fasted mice were administered ICV saline or insulin (0.1 mU/animal, 5 injections over 5 hr) as indicated and effects on (b) body weight, (c) 24 hr food intake and (d) body composition (Echo MRI) assessed 24 hr post injection. Quantified (means ±SEM) results are shown for the indicated number of mice.
Figure 7 with 1 supplement

Elevated TCPTP in POMC neurons in obesity promotes HGP and systemic insulin resistance.
(a) Experimental paradigm schematic. (b) Ptpn2fl/fl or POMC-TC male mice were high fat fed (HFF) for 12 weeks and after an overnight fast ICV administered saline or 0.1 mU/animal (5 x injections over 5 hr) and subjected 1 hr later to either (b) a pyruvate tolerance test (1.5 mg/g) or livers extracted for (c) quantitative PCR or (d) immunoblotting; areas under curves were determined and significance determined using a one-way ANOVA followed by Tukey multiple comparison test, or a two-way ANOVA followed by Sidak multiple comparison test. Ptpn2fl/fl or POMC-TC male mice were HFF for 12 weeks and fed and fasted (e) blood glucose and (f) plasma insulin levels were assessed; significance was determined using a two-way ANOVA followed by Sidak multiple comparison test. Ptpn2fl/fl or POMC-TC male mice were HFF for 12–14 weeks and subjected to hyperinsulinemic-euglycemic conscious clamps. (g) Glucose infusion rates (GIR; analysed by two-way ANOVA with repeated measures followed by Sidak multiple comparison test), (h) glucose disappearance rates (Rd) and (i) basal and clamped endogenous glucose production (EGP; glucose appearance rate minus GIR) were determined and (j) livers extracted for quantitative PCR (analysed using a two-tailed t-test or a two-way ANOVA followed by Sidak multiple comparison test). Representative and quantified results are shown (means ± SEM) for the indicated number of mice.
Figure 7—figure supplement 1
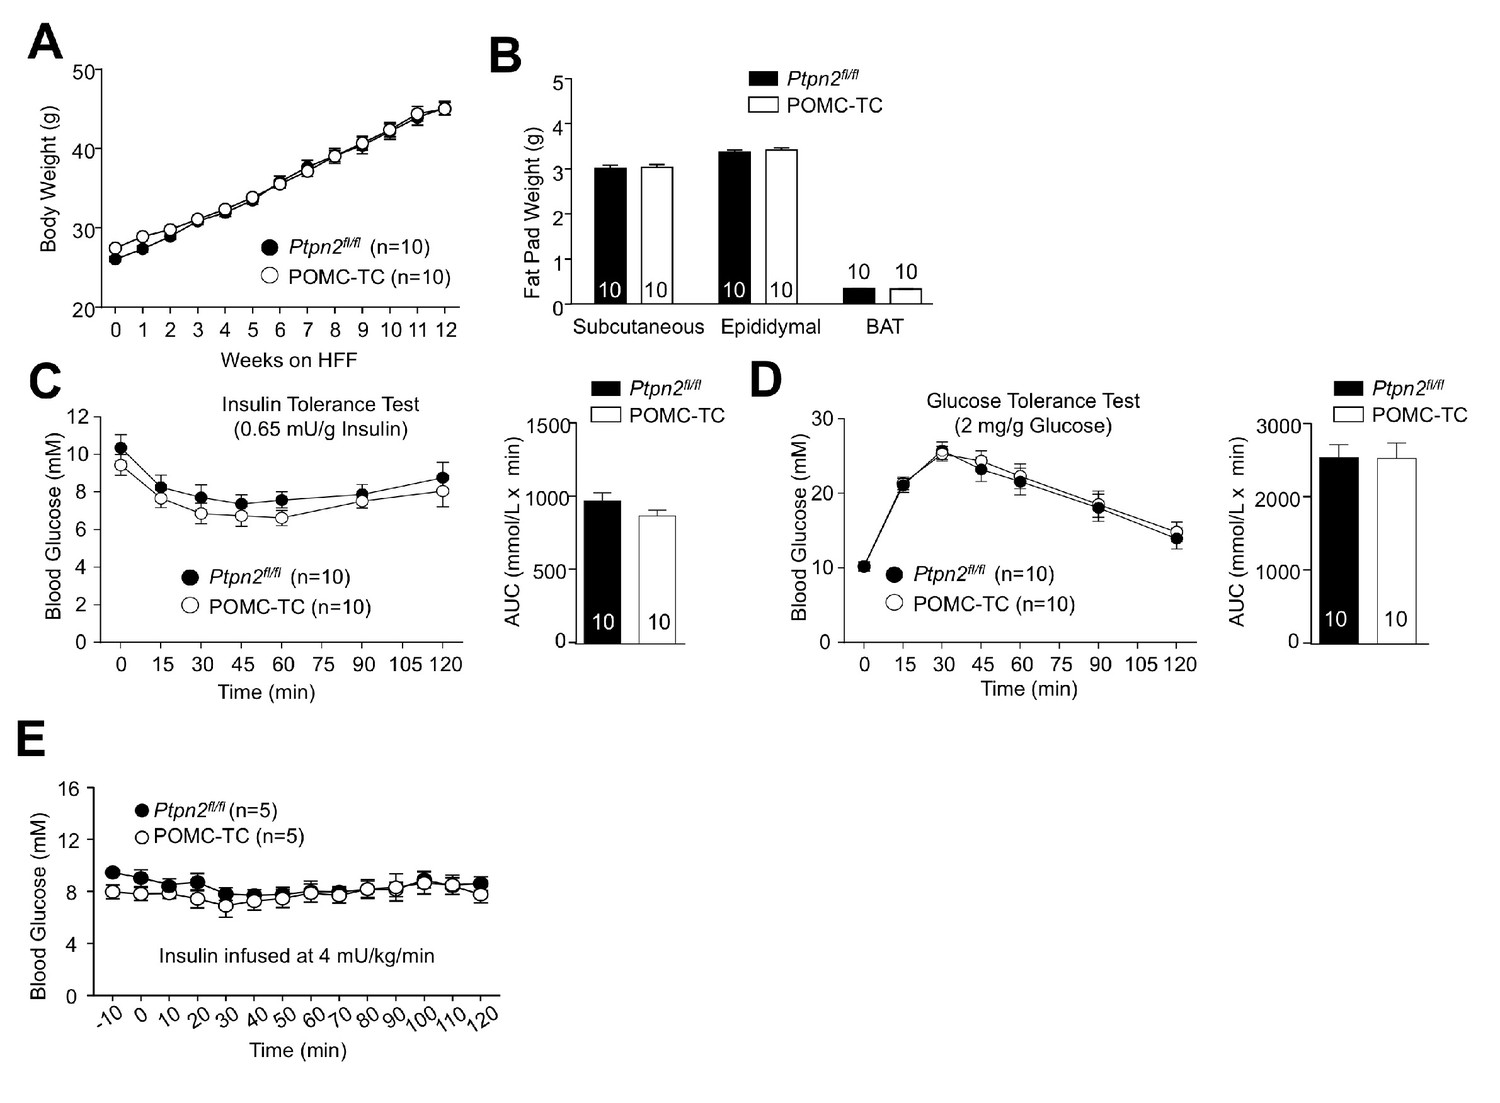
TCPTP deletion in POMC neurons in obesity represses HGP and improves whole-body glucose homeostasis.
Male Ptpn2fl/fl or POMC-TC mice were high fat fed (HFF) for 12–14 weeks. (a) Body weights and (b) fat pad weights were determined. Mice were subjected to (c) insulin and (d) glucose tolerance tests; areas under curves were determined. (e) Hyperinsulinemic-euglycemic conscious clamps were performed and blood glucose assessed for the duration of the clamps. Representative and quantified results are shown (means ± SEM) for the indicated number of mice.
Author response image 1
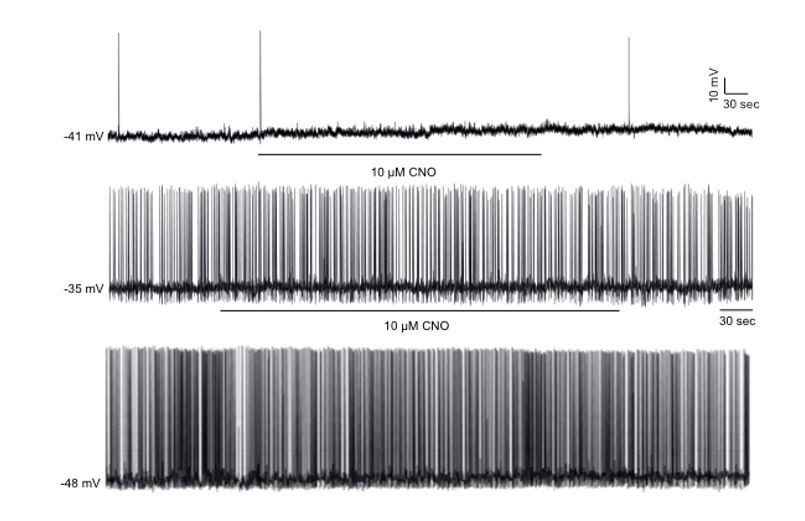
CNO has no effect of firing frequency and membrane potential in non-DREADD-expressing POMC neurons.
Representative traces of whole-cell patch clamp recordings of individual hypothalamic non-DREADD expressing GFP positive POMC neurons in response to CNO (10 µM) in Pomc-Cre;Pomc-eGFP mice. CNO had no effects in all (11 cells, n=4) non-DREADD POMC neurons recorded.
Tables
Key resources table
| Reagent type (species) or resource | Designation | Source or reference | Identifiers | Additional information |
|---|---|---|---|---|
| Strain, strain background (Mouse, Pomc-Cre, C57BL/6J background) | B6.FVB-Tg(Pomc-cre) 1Lowl/J, C57BL/6J | PMID: 17556551 | RRID:IMSR_JAX:010714 | |
| Strain, strain background (Mouse, Insrfl/fl, C57BL/6J background) | B6.129S4)-Insrtm1Khn/J, C57BL/6J | PMID: 9844629 | RRID:IMSR_JAX:006955 | |
| Strain, strain background (Mouse, Pomc-eGFP, C57BL/6J background) | C57BL/6J-Tg (Pomc-EGFP)1Low/J, C57BL/6J () | PMID: 11373681 | RRID:IMSR_JAX:009593 | |
| Strain, strain background (Mouse, Z/EG, C57BL/6J background) | Tg(CAG-Bgeo/GFP) 21Lbe/J | PMID: 11105057 | RRID:IMSR_JAX:003920 | |
| Strain, strain background (Mouse, Ptpn2lox/lox, C57BL/6J background) | Mouse (Ptpn2fl/fl) | PMID: 22590589 | N/A | |
| Antibody (4970) | Rabbit monoclonal anti β-Actin | Cell Signaling Technology | RRID:AB_2223172 | (1:2000) |
| Antibody (AM1403031) | Mouse polyclonal anti Gapdh | Ambiom | AM1403031 | (1:50000) |
| Antibody (9145) | Rabbit monoclonal anti-p-STAT3 (Y705) | Cell Signaling Technology | RRID: AB_10694804 | (1:1000) |
| Antibody (9139) | Mouse monoclonal anti STAT3 | Cell Signaling Technology | RRID:AB_331757 | (1:1000) |
| Antibody (4060) | Rabbit monoclonal anti-p-AKT (Ser-473) | Cell Signaling Technology | RRID:AB_2315049 | (1:2000 (WB), 1:300 (IHC)) |
| Antibody (MM0019p) | Mouse monoclonal anti TCPTP | Medimabs | MM0019p | (1:1000 (WB), 1:200 (IHC)) |
| Antibody (ab13970) | Chicken polyclonal anti GFP | abcam | RRID:AB_300798 | (1:1000) |
| Antibody (PHH02930) | Rabbit polyclonal anti POMC | Phoenix Pharmaceuticals | RRID:AB_2307442 | (1:1000) |
| Antibody (SC-711) | Rabbit polyclonal anti IR | Santa Cruz | RRID:AB_631835 | (1:2000) |
| Antibody (44–804G) | Rabbit polyclonal anti p-IR (Tyr-1162, 1163) | ThermoScientific | RRID:AB_2533762 | (1:2000) |
| Antibody (sc-52) | Rabbit polyclonal anti c-Fos | Santa Cruz | RRID:AB_2106783 | (1:4000) |
| Antibody (632496) | Rabbit polyclonal anti dsRed | Clontech | RRID:AB_10013483 | (1:2500) |
| Antibody (AS597) | guinea pig anti-alpha-MSH | Antibody Australia | AS597 | (1:1000) |
| Antibody (9272) | Rabbit polyclonal anti Akt | Cell Signaling Technology | RRID:AB_329827 | (1:5000) |
| Commercial assay or kit (RI-13k) | Rat Insulin radioimmunoassay | Millipore | RI-13k | |
| Chemical compound, drug (3435) | Insulin (human) recombinant | Tocris Bioscience | 3435 | |
| Chemical compound, drug (C0832) | Clozapine N-oxide | Sigma-Aldrich | C0832 | |
| Chemical compound, drug (169625) | Actrapid (human, Insulin) | Novo Nordisk Pharmaceuticals | 169625 | |
| Sequence-based reagent (Mm00435874_m1) | Pomc TaqMan Gene Expression Assay | ThermoFisher | Mm00435874_m1 | |
| Sequence-based reagent (Mm03048253_m1) | Npy TaqMan Gene Expression Assay | ThermoFisher | Mm03048253_m1 | |
| Sequence-based reagent (Mm00475829_g1) | Agrp TaqMan Gene Expression Assay | ThermoFisher | Mm00475829_g1 | |
| Sequence-based reagent (Mm99999915_g1) | Gapdh TaqMan Gene Expression Assay | ThermoFisher | Mm99999915_g1 | |
| Sequence-based reagent (Mm01247058_m1) | Pck1 TaqMan Gene Expression Assay | ThermoFisher | Mm01247058_m1 | |
| Sequence-based reagent (Mm00839363_m1) | G6p TaqMan Gene Expression Assay | ThermoFisher | Mm00839363_m1 | |
| Sequence-based reagent (Mm00446190_m1) | Il6 TaqMan Gene Expression Assay | ThermoFisher | Mm00446190_m1 |
Additional files
-
Supplementary file 1
Statistical analysis of POMC neuronal electrophysiological responses to insulin.
Statistical significance and P values (Yate’s continuity corrected Chi-squared test) comparing populations of POMC neurons that are activated, inhibited or unresponsive to insulin in Ptpn2fl/fl, POMC-TC and POMC-TC-IR mice.
- https://doi.org/10.7554/eLife.38704.019
-
Supplementary file 2
Statistical analysis of POMC neuronal electrophysiological responses to insulin after the inhibition of TCPTP.
Statistical significance and P values (Yate’s continuity corrected Chi-squared test) comparing populations of POMC neurons from chow or high fat fed (HFF) mice that are activated, inhibited or unresponsive to insulin after administration of vehicle or TCPTP inhibitor (compound 8, 20 nM).
- https://doi.org/10.7554/eLife.38704.020
-
Transparent reporting form
- https://doi.org/10.7554/eLife.38704.021
Download links
A two-part list of links to download the article, or parts of the article, in various formats.
Downloads (link to download the article as PDF)
Open citations (links to open the citations from this article in various online reference manager services)
Cite this article (links to download the citations from this article in formats compatible with various reference manager tools)
Insulin regulates POMC neuronal plasticity to control glucose metabolism
eLife 7:e38704.
https://doi.org/10.7554/eLife.38704


