PARP1-dependent recruitment of the FBXL10-RNF68-RNF2 ubiquitin ligase to sites of DNA damage controls H2A.Z loading
- New York University School of Medicine, United States
- Hungarian Academy of Sciences, Hungary
- Howard Hughes Medical Institute, New York University School of Medicine, United States
Figures
Figure 1 with 3 supplements
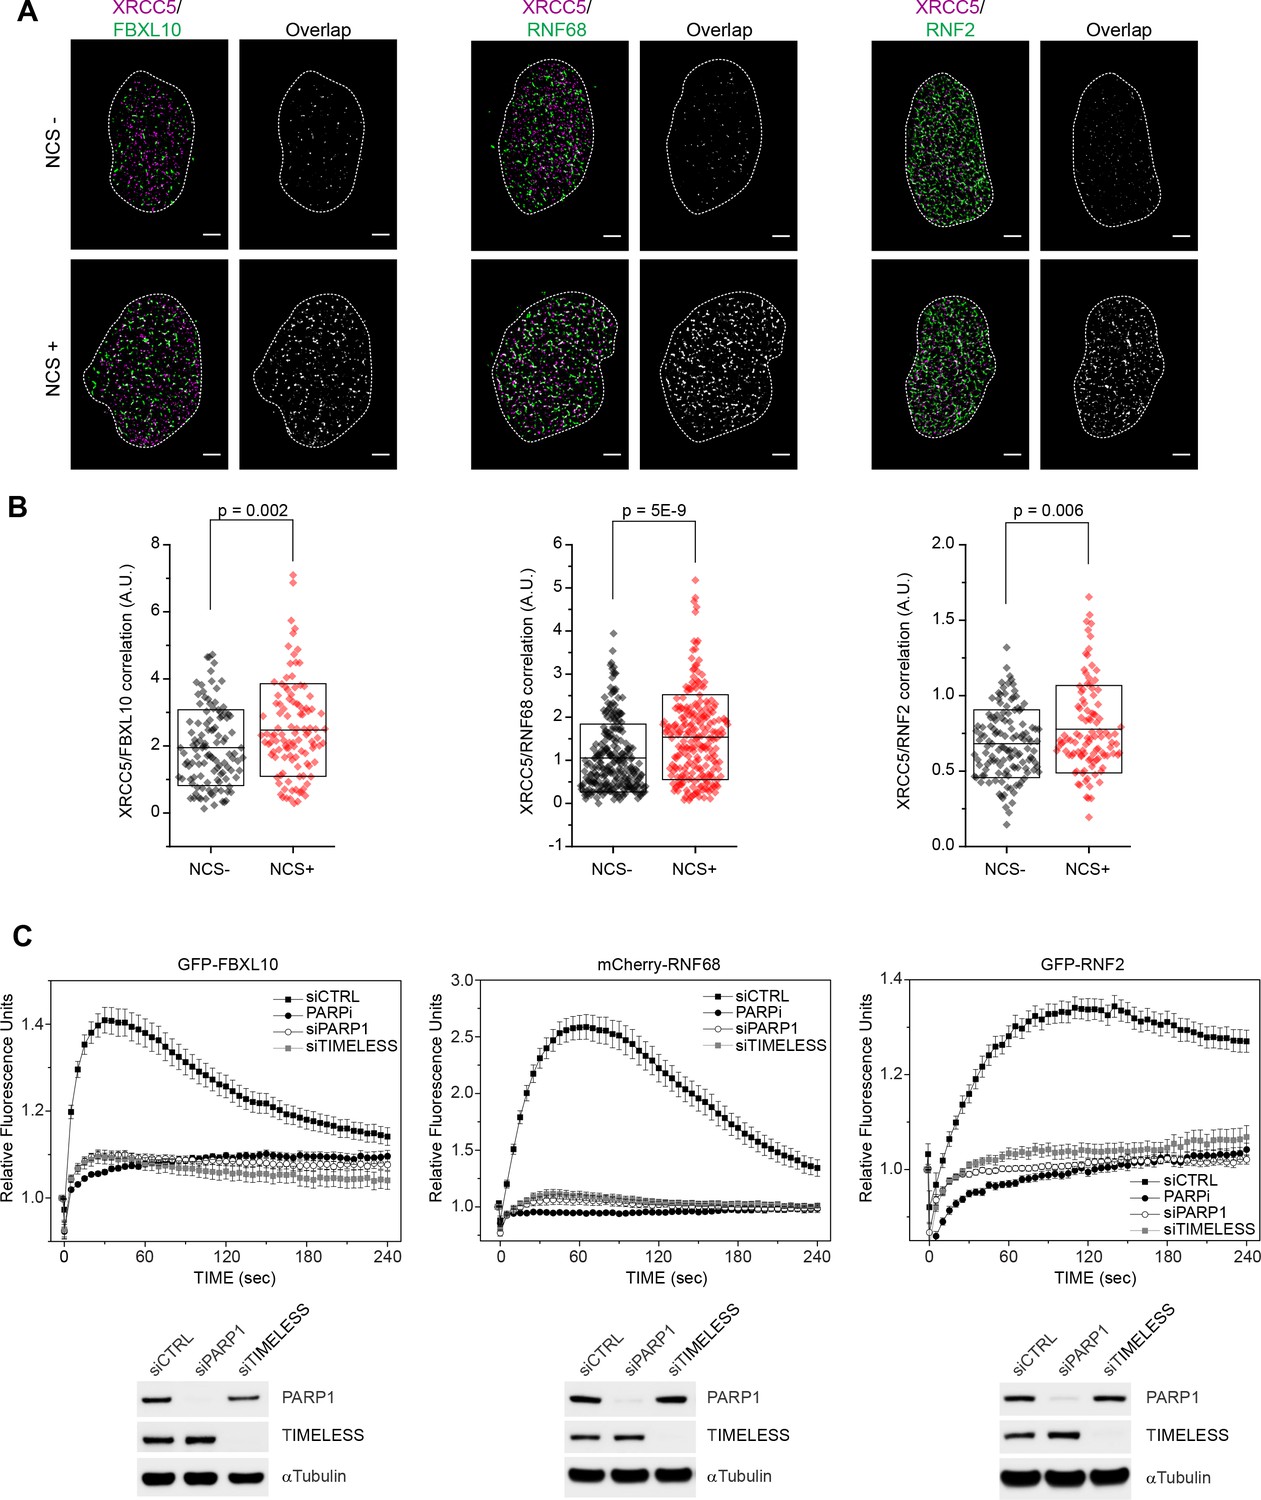
FBXL10, RNF68, and RNF2 are recruited to sites of DNA damage in a PARP1- and TIMELESS- dependent manner.
(A) Super-resolution imaging was performed in U-2OS cells to analyze the colocalization between XRCC5 (magenta) and FBXL10, RNF68 and RNF2 (green), with or without 20 min of NCS treatment. Representative nuclei are shown. A white dash line denotes the border of each nucleus. Scale bar represents 2.5 μm. The signal overlap (white) demonstrates the colocalization between XRCC5 and FBXL10, RNF68 or RNF2. (B) The graphs display the correlation between XRCC5 and FBXL10 (NCS-, n = 113; NCS+, n = 109), RNF68 (NCS-, n = 254; NCS+, n = 232) or RNF2 (NCS-, n = 128; NCS+, n = 105) in individual nuclei, respectively. Each plot is the correlation amplitude between XRCC5 and FBXL10/RNF68/RNF2 within one nucleus. The n value representing the total number of analyzed nuclei is pooled from the three or four independent experiments. A.U., arbitrary units. Whisker box shows mean and S.D. values. P values were calculated using two-sample t-test between NCS - and NCS + samples. (C) U-2OS cells stably expressing GFP-FBXL10 (left), mCherry-RNF68 (middle) or GFP-RNF2 (right) were transfected with siRNAs targeting PARP1, TIMELESS, or a non-targeting control (CTRL). Cells were pre-sensitized with BrdU (10 μM) for 36 hr and subjected to 405 nm laser induced damage. Where indicated, cells were pretreated with 1 μM PARP inhibitor (Olaparib) for 1 hr. DNA damage recruitment dynamics were captured by live cell imaging. Relative fluorescence values and images were acquired every 5 s for 4 min. For each condition, ≥25 cells were evaluated from 2 or three independent experiments. Mean relative fluorescence values and standard errors were plotted against time. Representative images are shown in Figure 1—figure supplement 2A. Times are indicated in seconds. The efficiency of PARP1 and TIMELESS depletion is shown using immunoblotting.
Figure 1—figure supplement 1
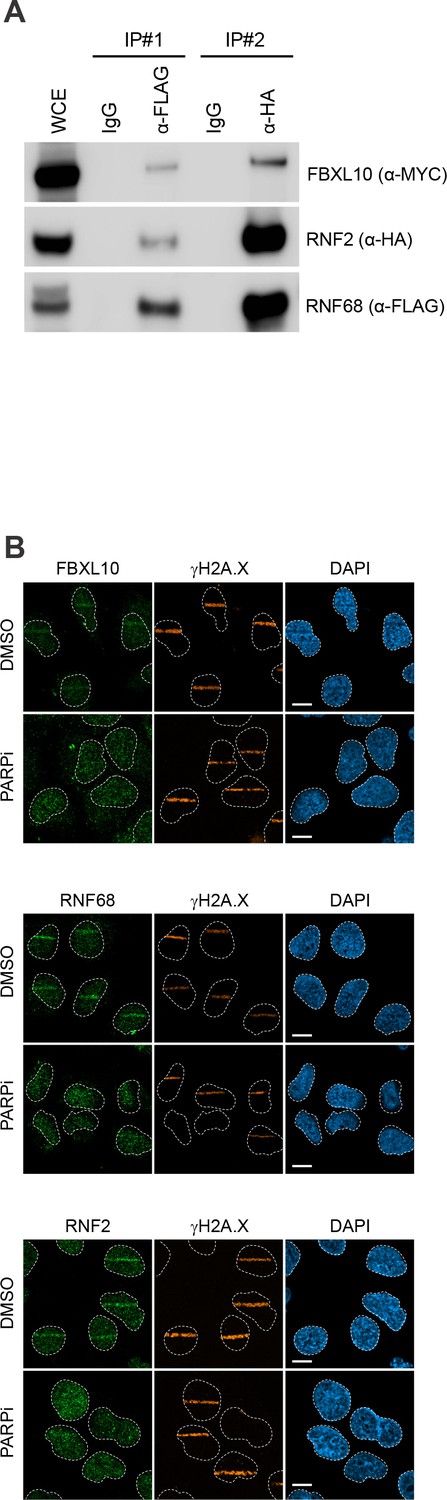
The trimeric FRUCC recruits to sites of DNA damage.
(A) HEK293T cells were transfected with FLAG-RNF68, HA-RNF2, and Myc-FBXL10. Cell lysates were immunoprecipitated with an anti-FLAG resin, followed by elution using 3x FLAG peptide. The eluate was subsequently subjected to immunoprecipitation using anti-HA antibody. Immunoprecipitates were probed with indicated antibodies. (B) Confocal images of U-2OS cells fixed 1 min after laser micro-irradiation in the presence or absence of PARP inhibitor (Olaparib), and stained for either FBXL10, RN68 or RNF2 (green) and the DNA damage marker γH2A.X (orange). Scale bar represents 10 μm. A white dash line denotes the border of each nucleus.
Figure 1—figure supplement 2
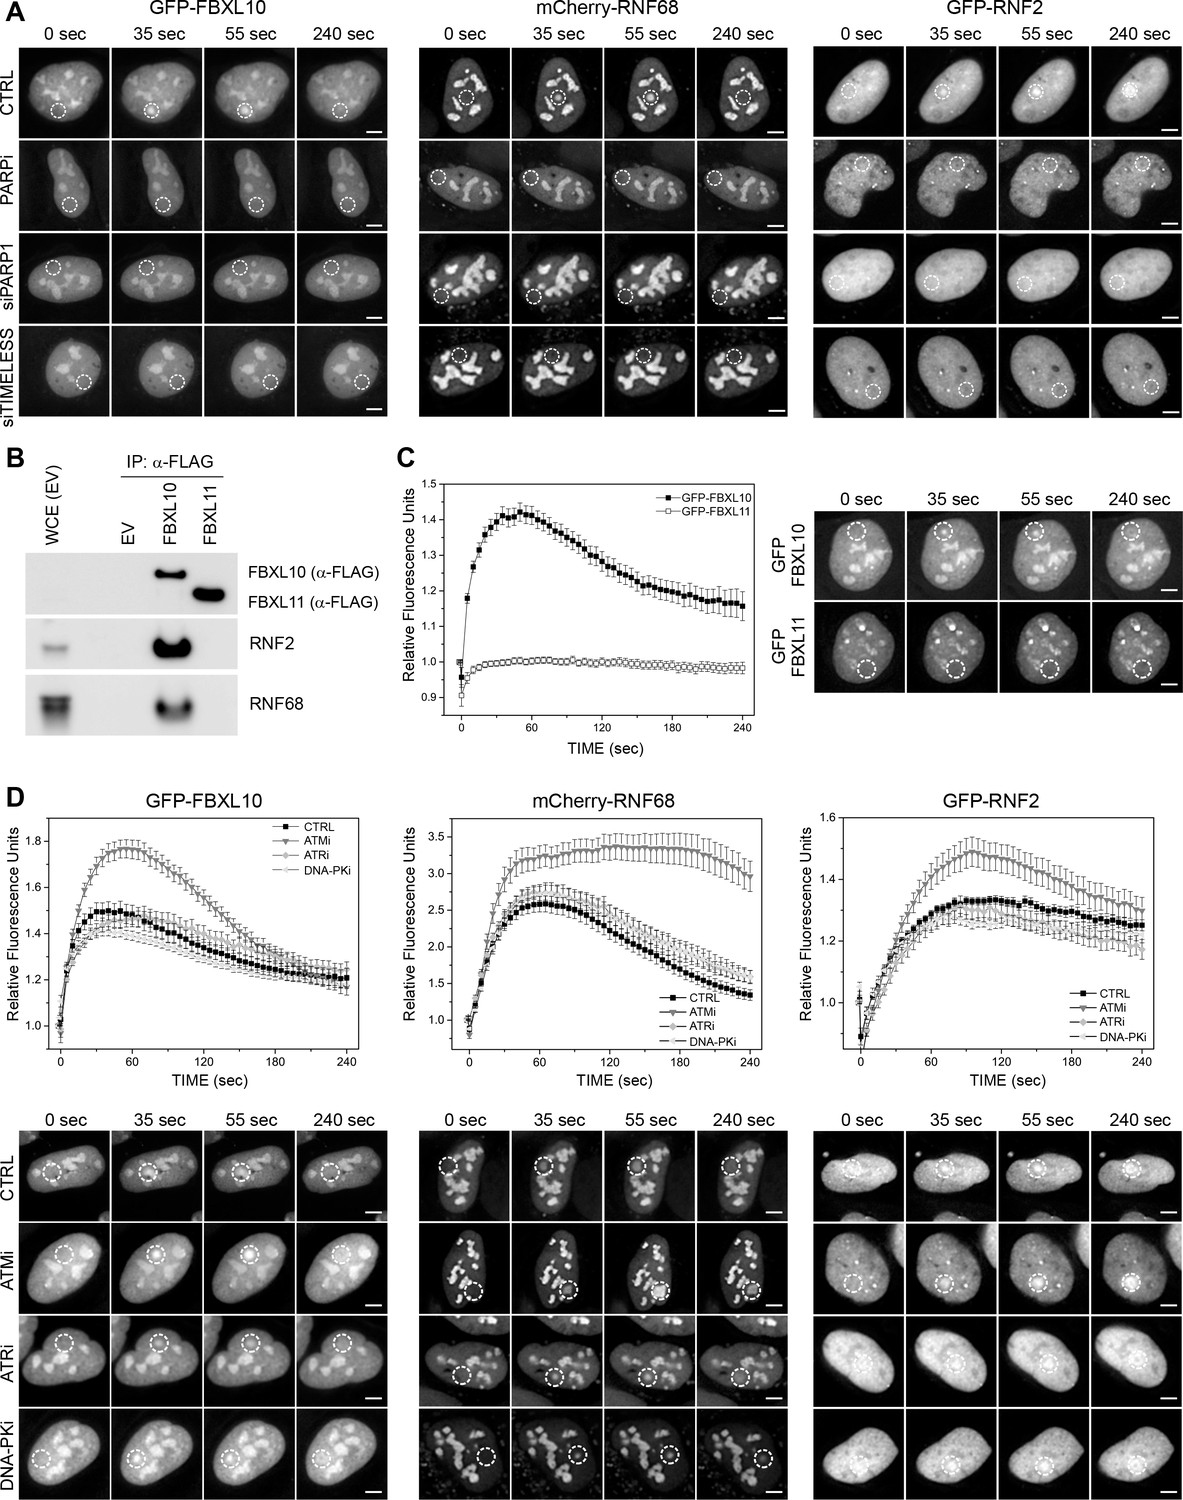
Recruitment of the FRUCC to DNA damage sites.
(A) Representative images of the kinetic plots showed in Figure 1C. U-2OS cells stably expressing either GFP-FBXL10, mCherry-RNF68 and GFP-RNF2 and transfected with the indicated siRNAs, were pre-sensitized with BrdU (10 μM) for 36 hr and subjected to 405 nm laser induced damage. DNA damage recruitment dynamics were captured by live cell imaging. White, dotted circles denote the site of laser damage. Scale bar represents 5 μm. (B) HEK293T cells were transfected with an empty vector (EV), FLAG-tagged FBXL10, or FLAG-tagged FBXL11. Cell lysates were immunoprecipitated with an anti-FLAG resin, and immunoprecipitates were probed with indicated antibodies. (C) U-2OS cells stably expressing either GFP-FBXL10 or GFP-FBXL11 were pre-sensitized with BrdU (10 μM) for 36 hr and subjected to 405 nm laser induced damage. DNA damage recruitment dynamics were captured by live cell imaging. Relative fluorescence values and images were acquired every 5 s for 4 min. For each condition, ≥20 cells were evaluated from two independent experiments. Mean relative fluorescence values and standard errors were plotted against time. Representative images are next to the kinetic plots. Times are indicated in seconds. White, dotted circles denote the site of laser damage. Scale bar represents 5 μm. (D) U-2OS cells stably expressing GFP-FBXL10, mCherry-RNF68 or GFP-RNF2 were treated for 1 hr with inhibitors to ATM, ATR, and DNA-PK prior to laser micro-irradiation. For each condition,≥20 cells were evaluated from 2 to 3 independent experiments. Mean relative fluorescence values and standard errors were plotted against time. Representative images are shown below the kinetic plots. Times are indicated in seconds. White, dotted circles denote the site of laser damage. Scale bar represents 5 μm.
Figure 1—figure supplement 3

Extended kinetics of FBXL10 recruitment, and TIMELESS-independent recruitment of XRCC1 and Ligase 3.
(A) U-2OS cells stably expressing either GFP-FBXL10 were pre-sensitized with BrdU (10 μM) for 36 hr and subjected to 405 nm laser induced damage. DNA damage recruitment dynamics were captured by live cell imaging. Relative fluorescence values and images were acquired every 30 s for 30 min. Where indicated, cells were pretreated with 1 μM PARP inhibitor (Olaparib) for 1 hr. For each condition, ≥20 cells were evaluated from two independent experiments. Mean relative fluorescence values and standard errors were plotted against time. Right panels show representative images. Times are indicated in seconds. White, dotted circles denote the site of laser damage. Scale bar represents 5 μm. (B) U-2 OS cells stably expressing mCherry-XRCC1 or mCherry-Ligase three were transfected with siRNAs targeting TIMELESS or non-targeting control (siCTRL). Cells were pre-sensitized with BrdU (10 μM) for 36 hr and subjected to 405 nm laser induced damage. DNA damage recruitment dynamics were captured by live cell imaging. Relative fluorescence values and images were acquired every 5 s for 4 min. For each condition, ≥20 cells were evaluated from 2 or three independent experiments. Mean relative fluorescence values and standard errors were plotted against time. Representative images are shown beneath the kinetic plots. Times are indicated in seconds. White, dotted circles denote the site of laser damage. Scale bar represents 5 μm. The efficiency of TIMELESS depletion is shown using immunoblotting.
Figure 2 with 2 supplements
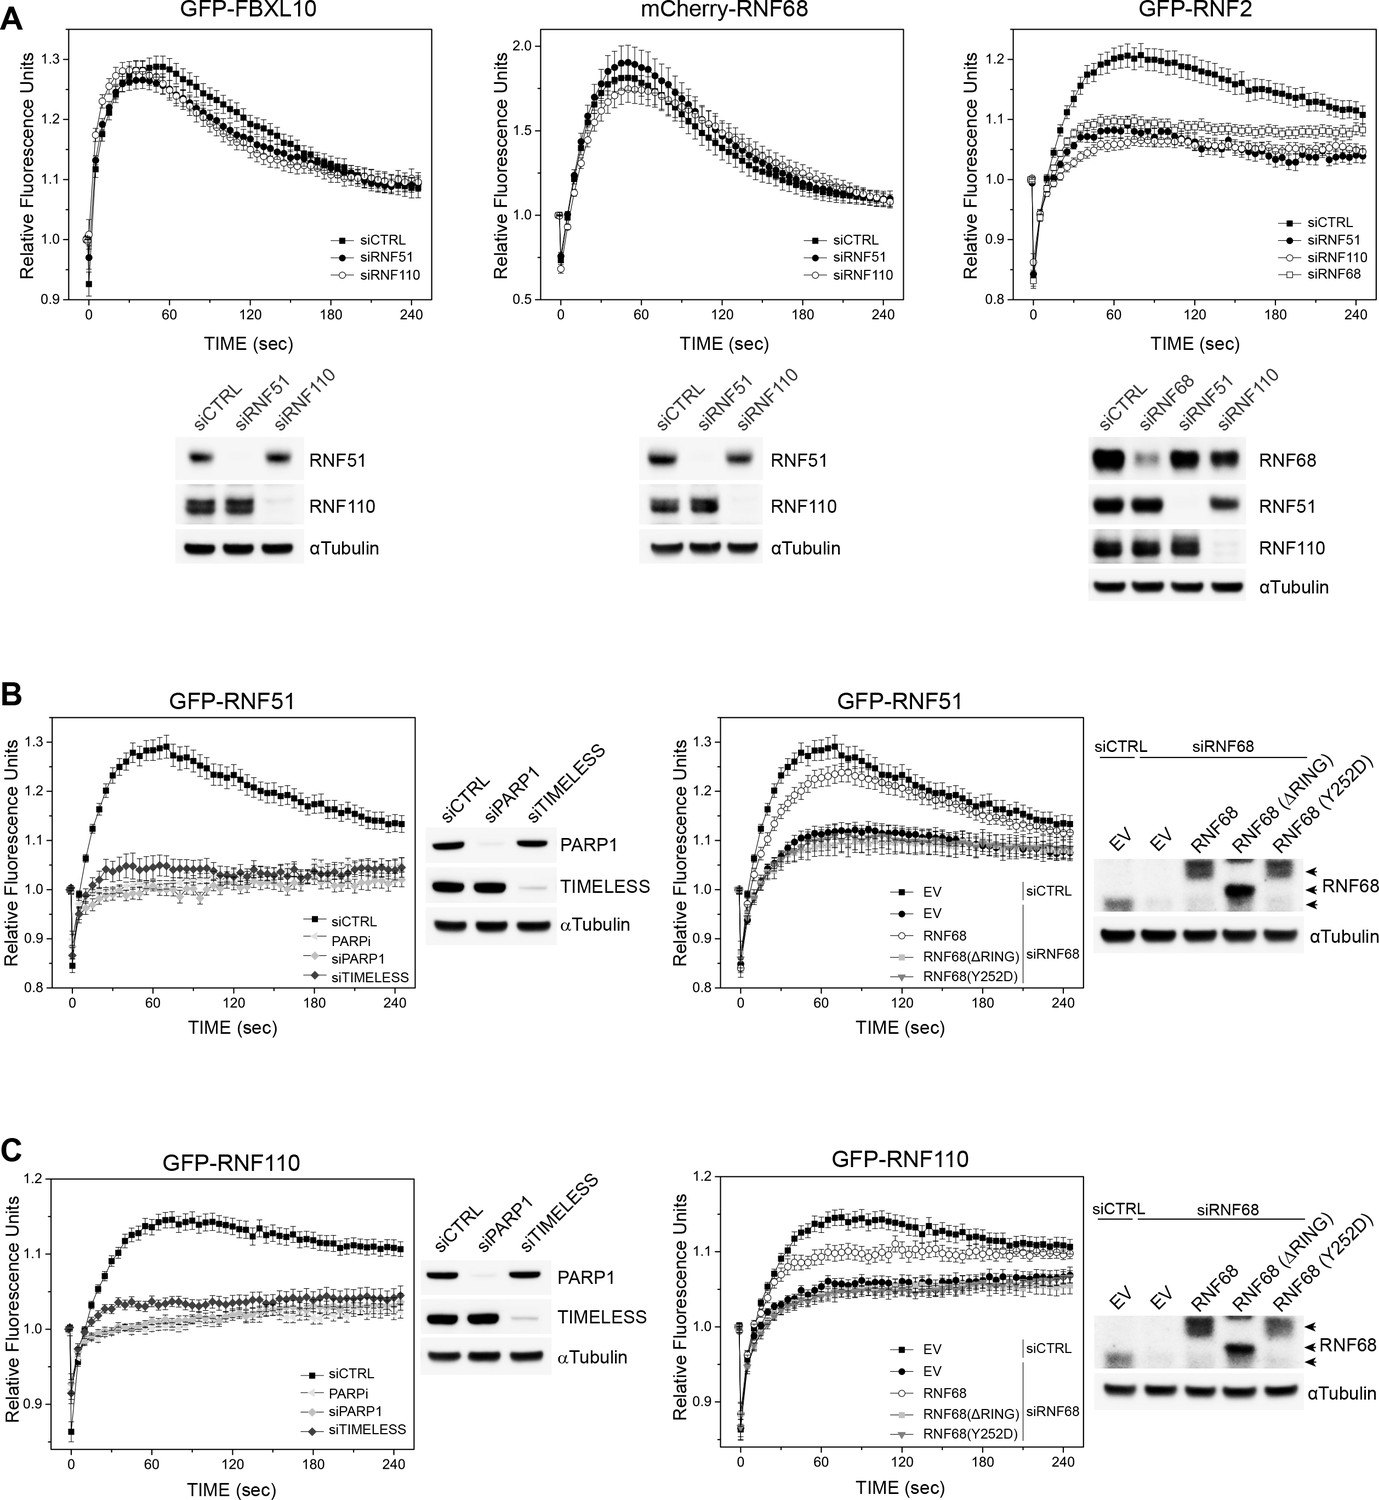
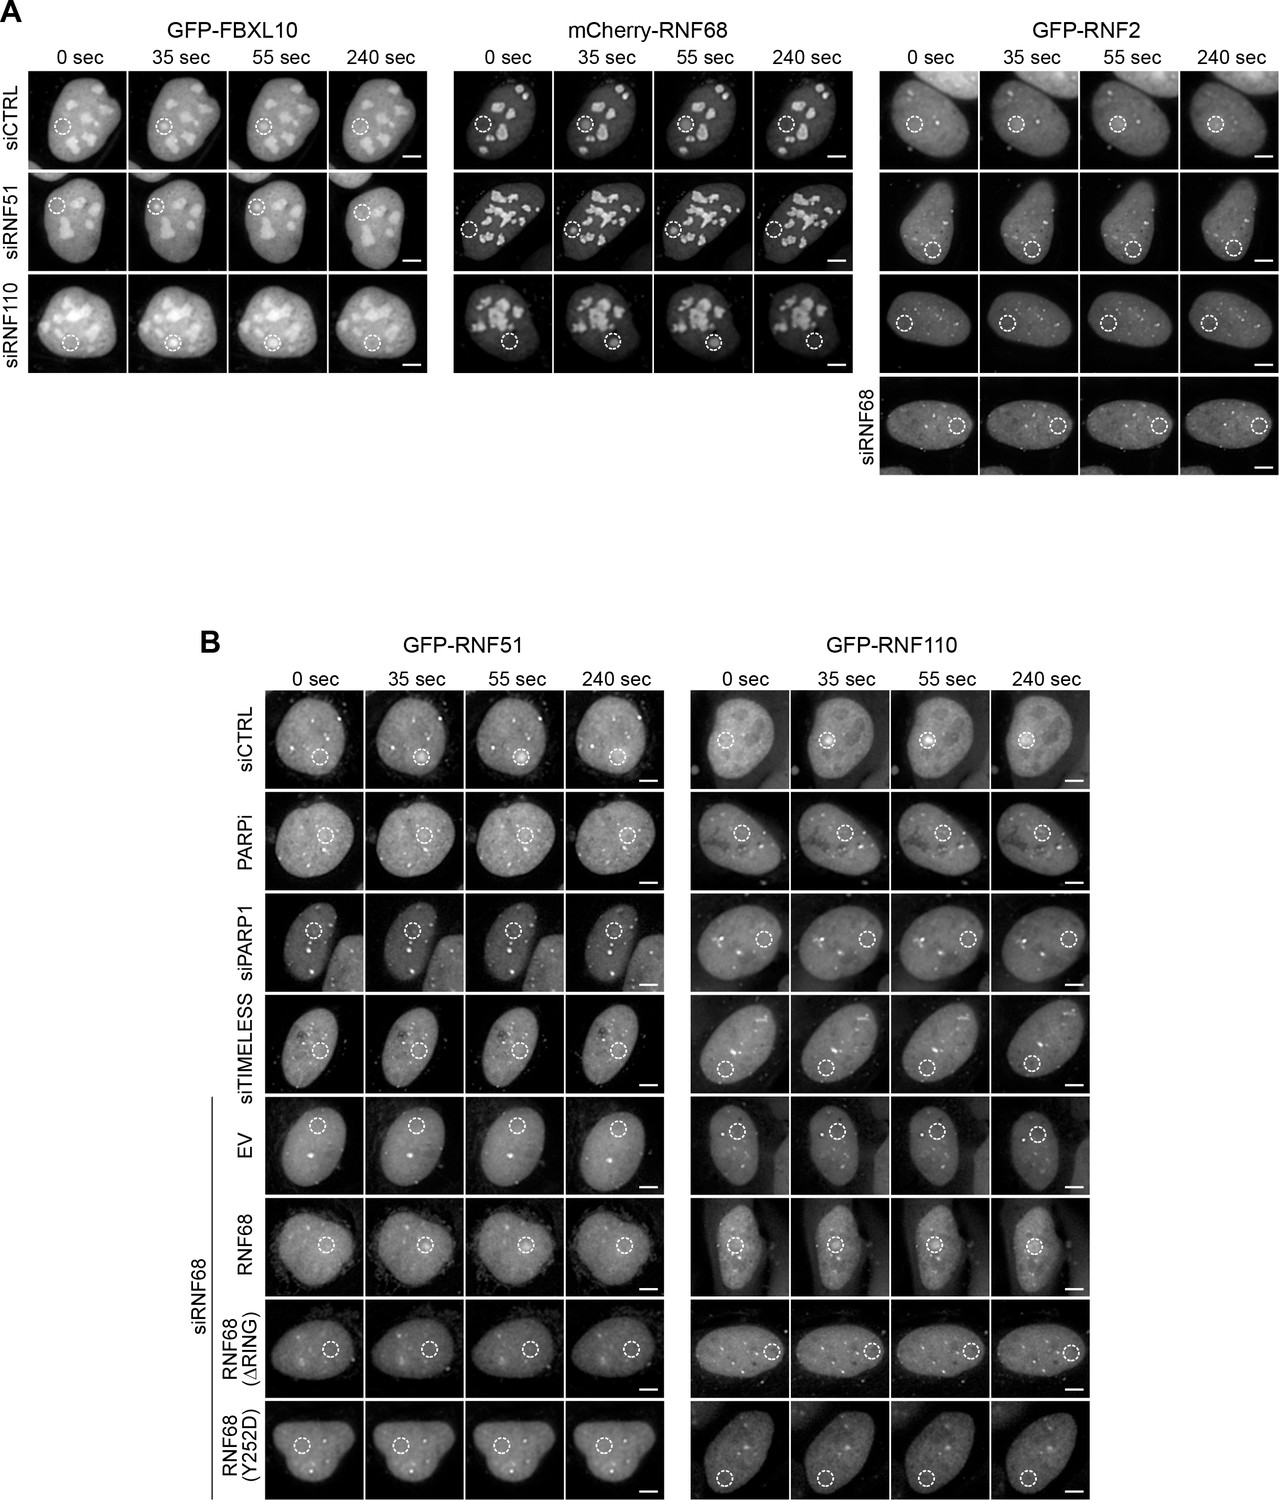
PARP1-, TIMELESS-, and RNF68-dependent recruitment of the cPRC1 subunits, RNF51 and RNF110.
(A) U-2OS cells stably expressing GFP-FBXL10 (left), mCherry-RNF68 (middle) or GFP-RNF2 (right) were transfected with siRNAs targeting RNF51, RNF110 or a non-targeting control (CTRL). Cells were pre-sensitized with BrdU (10 μM) for 36 hr and subjected to 405 nm laser induced damage. DNA damage recruitment dynamics were captured by live cell imaging. Relative fluorescence values and images were acquired every 5 s for 4 min. For each condition,≥35 cells were evaluated from 2 or three independent experiments. Mean relative fluorescence values and standard errors were plotted against time. Representative images are shown in Figure 2—figure supplement 1A. Times are indicated in seconds. The efficiency of RNF51, RNF110 and RNF68 depletion is shown using immunoblotting. (B) Left: U-2OS cells stably expressing GFP-RNF51 were transfected with siRNAs targeting PARP1, TIMELESS or a non-targeting control (CTRL). Right: U-2OS cells engineered to express FLAG-HA-tagged RNF68, RNF68(ΔRING) or RNF68(Y252D) in combination with GFP-RNF51 were transfected with siRNAs targeting the 3’ UTR of RNF68 (siRNF68 seq2). Cells were pre-sensitized with BrdU (10 μM) for 36 hr and subjected to 405 nm laser induced damage. Where indicated, cells were pretreated with 1 μM PARP inhibitor (Olaparib) for 1 hr. DNA damage recruitment dynamics were captured by live cell imaging. Relative fluorescence values and images were acquired every 5 s for 4 min. For each condition, ≥35 cells were evaluated from 2 or three independent experiments. Mean relative fluorescence values and standard errors were plotted against time. CTRL sample set is the same on both graphs. Representative images are shown in Figure 2—figure supplement 1B. Times are indicated in seconds. The efficiency of PARP1, TIMELESS and RNF68 depletion and over-expression of the FLAG-HA-tagged RNF68 rescue constructs is shown using immunoblotting. Upper arrow indicates FLAG-HA-tagged RNF68 and RNF68(Y252D), middle arrow indicates RNF68(ΔRING) while lower arrow corresponds to endogenous RNF68. (C) Same as in (B) but using U-2OS cells stably expressing GFP-RNF110.
Figure 2—figure supplement 1
Representative images for Figure 2.
(A) Representative images of the kinetic plots showed in Figure 2A. U-2OS cells stably expressing either GFP-FBXL10, mCherry-RNF68 and GFP-RNF2 and transfected with the indicated siRNAs, were pre-sensitized with BrdU (10 μM) for 36 hr and subjected to 405 nm laser induced damage. DNA damage recruitment dynamics were captured by live cell imaging. White, dotted circles denote the site of laser damage. Scale bar represents 5 μm. (B) Representative images of the kinetic plots showed in Figure 2B–C. U-2OS cells engineered to express FLAG-HA-tagged RNF68, RNF68(ΔRING), RNF68(Y252D) or an EV in combination with GFP-RNF51 and GFP-RNF110, were transfected with the indicated siRNAs, were pre-sensitized with BrdU (10 μM) for 36 hr and subjected to 405 nm laser induced damage. DNA damage recruitment dynamics were captured by live cell imaging. White, dotted circles denote the site of laser damage. Scale bar represents 5 μm.
Figure 2—figure supplement 2
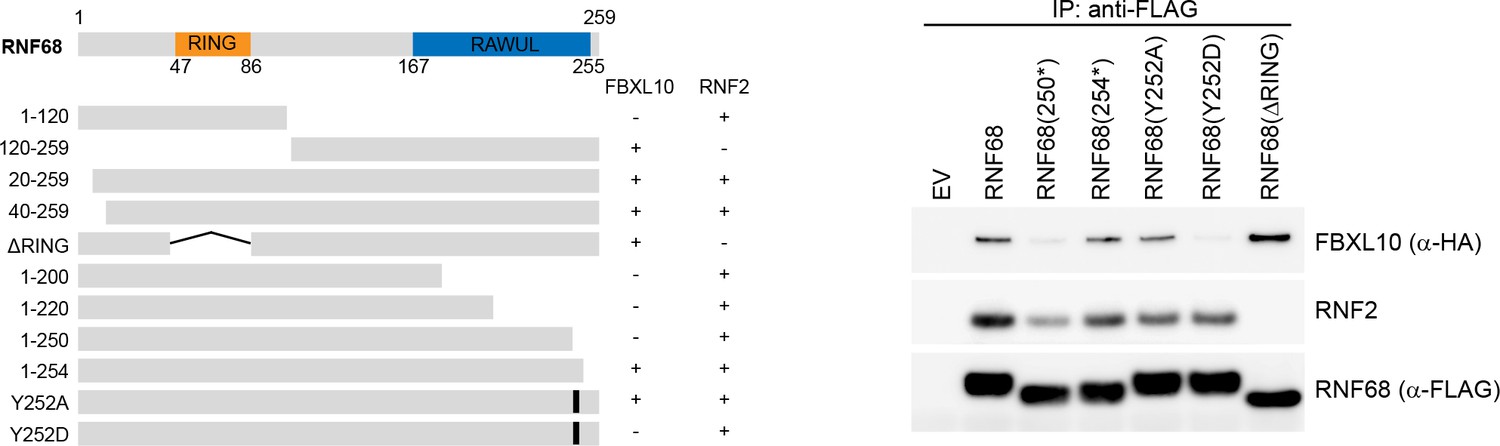
Mapping of FBXL10 and RNF2 binding domains in RNF68.
Left, Schematic representation of RNF68 mutants used in mapping experiments. RNF68 mutants found to interact with FBXL10 or RNF2 are indicated by the symbol (+). Right, HEK293T cells were transfected with empty vector (EV), FLAG-tagged RNF68, or the indicated FLAG-tagged RNF68 constructs. Whole cell extracts were immunoprecipitated with an anti-FLAG resin, and immunoprecipitates were immunoblotted with the indicated antibodies.
Figure 3 with 1 supplement
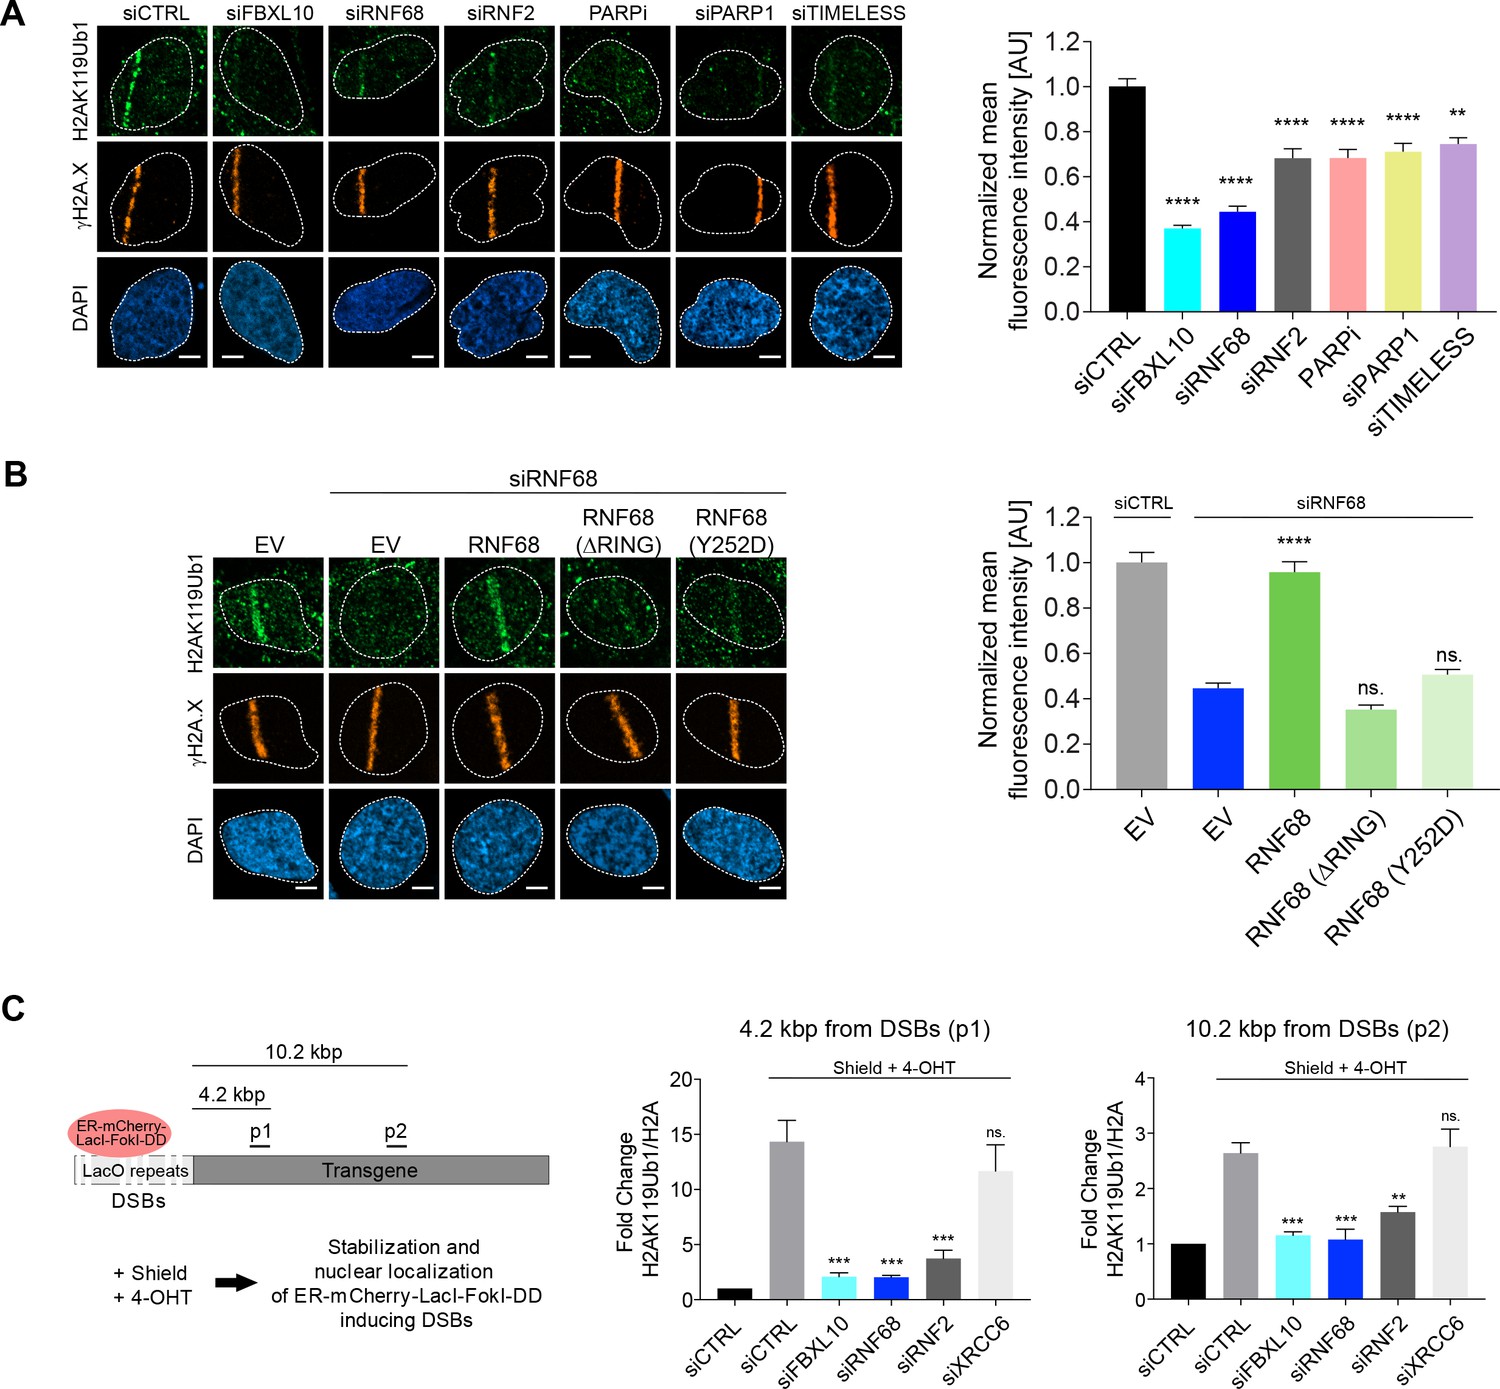
The FRRUC is required for H2A-ubiquitylation at sites of DNA damage.
(A) U-2OS cells were transfected with the indicated siRNAs. Cells were fixed 30 min after laser microirradiation and stained with antibodies to γH2A.X (orange) and H2AK119Ub1 (green). Scale bar represents 5 μm. The graph represents the mean intensity of the H2AK119Ub1 signal on the γH2A.X track, normalized to the mean values of the siCTRL sample. At least 28 laser stripes were analyzed per condition from 2 or three independent experiments. A white dash line denotes the border of each nucleus. Error bars represent S.E.M. Differences relative to siCTRL were calculated using one-way ANOVA. ****p≤0.0001, ***p≤0.001, **p≤0.01, *p≤0.05, ns = not significant. (B) U-2OS cells engineered to express FLAG-HA-tagged RNF68, RNF68(ΔRING) or RNF68(Y252D) were transfected with siRNAs targeting the 3’ UTR of RNF68 (siRNF68 seq2). Cells were fixed 30 min after laser microirradiation and stained with antibodies to γH2A.X (orange) and H2AK119Ub1 (green). Scale bar represents 5 μm. The graph represents the mean intensity of the H2AK119Ub1 signal on the γH2A.X track, normalized to the mean values of the siCTRL sample. At least 30 laser stripes were analyzed per condition from 2 or three independent experiments. A white dash line denotes the border of each nucleus. Error bars represent S.E.M. Differences relative to siCTRL were calculated using one-way ANOVA. ****p≤0.0001, ***p≤0.001, **p≤0.01, *p≤0.05, ns = not significant. (C) Left: Schematic of DSB generation by ER-mCherry-LacI-FokI-DD at lac operator (LacO) repeats integrated into the genome of U-2OS DSB reporter cells. The ER-mCherry-LacI-FokI-DD is stabilized by Shield1 and targeted to the nucleus by 4-OHT. The qChIP primer sets around the induced DSBs are labeled as p1-p2. ER, estrogen receptor; DD, destabilization domain. The ER-mCherry-LacI-FokI-DD nuclease was induced for 1 hr using Shield-1 and 4-OHT. Right: qChIP was performed in FokI reporter U-2OS cells with and without FokI-induced DSBs using antibodies to H2A and ubiquitylated H2A. To determine the relative amount of mono-ubiquitylated H2A, H2AK119Ub1 values were normalized on total H2A values. Error bars represent S.E.M from ≥3 independent experiments. P values were calculated using one-way ANOVA. ****p≤0.0001, ***p≤0.001, **p≤0.01, *p≤0.05, ns = not significant.
Figure 3—figure supplement 1
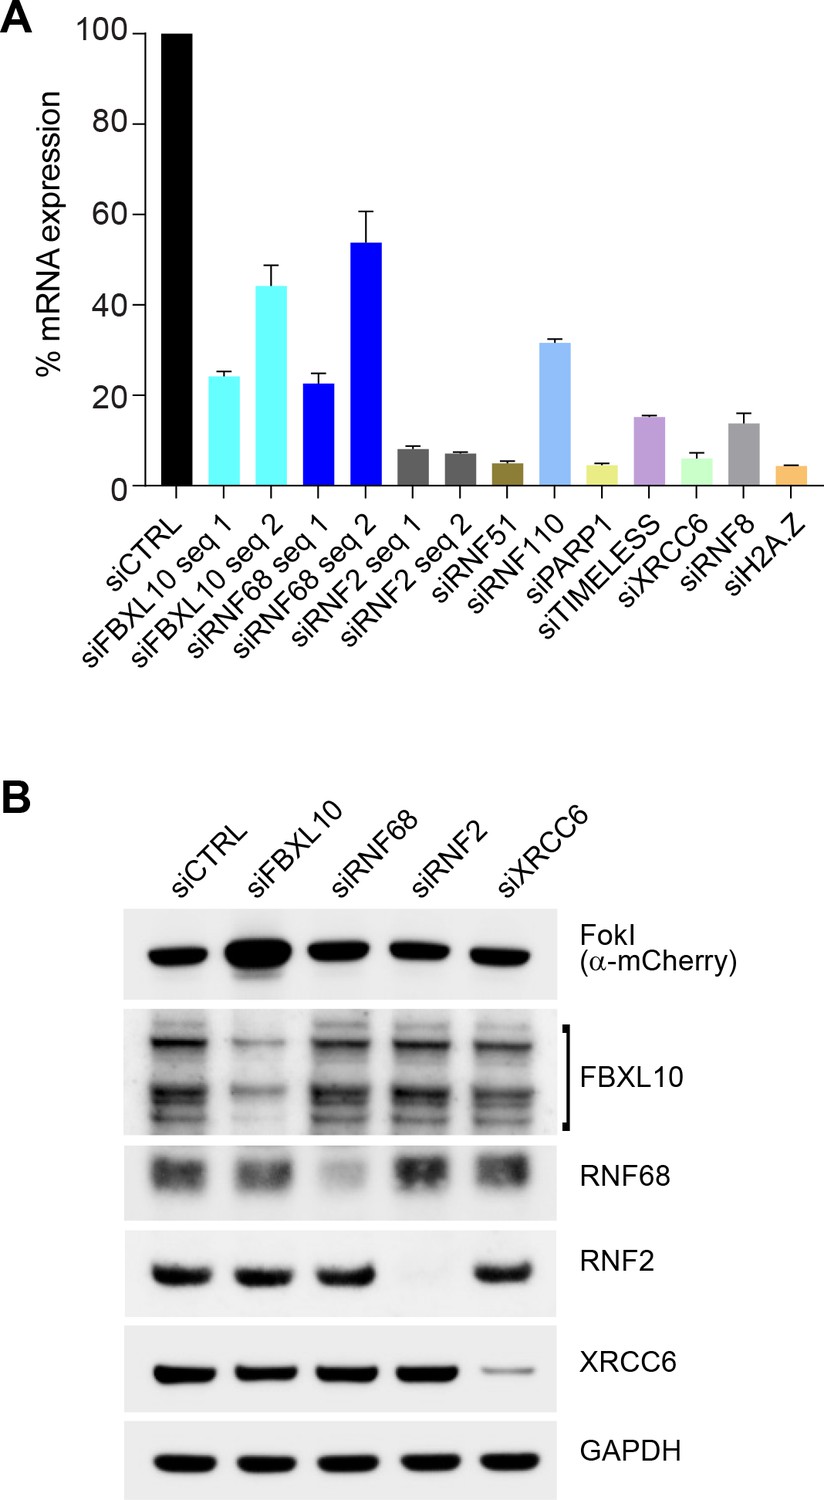
Representative efficiency of siRNA silencing for all oligos used in this study.
(A) U-2OS cells were transfected with the indicated siRNA sequences. The graph shows representative knockdown efficiencies of the indicated genes. Corresponding mRNA levels were analyzed using quantitative PCR from ≥3 independent experiments using triplicates. Each sample is compared with a non-targeting siRNA control (siCTRL). Error bars represent S.E.M. (B) U-2OS FokI reporter cells used in qChIP experiments were transfected with indicated siRNAs or a non-targeting control (siCTRL). 48 hr later, cells were treated with Shield-1 ligand (250 nM) and 4-OHT (500 nM) for 4 hr. Cells were lysed and immunoblotting was performed as indicated.
Figure 4 with 1 supplement
The FRUCC is required for transcriptional repression at sites of DNA damage.
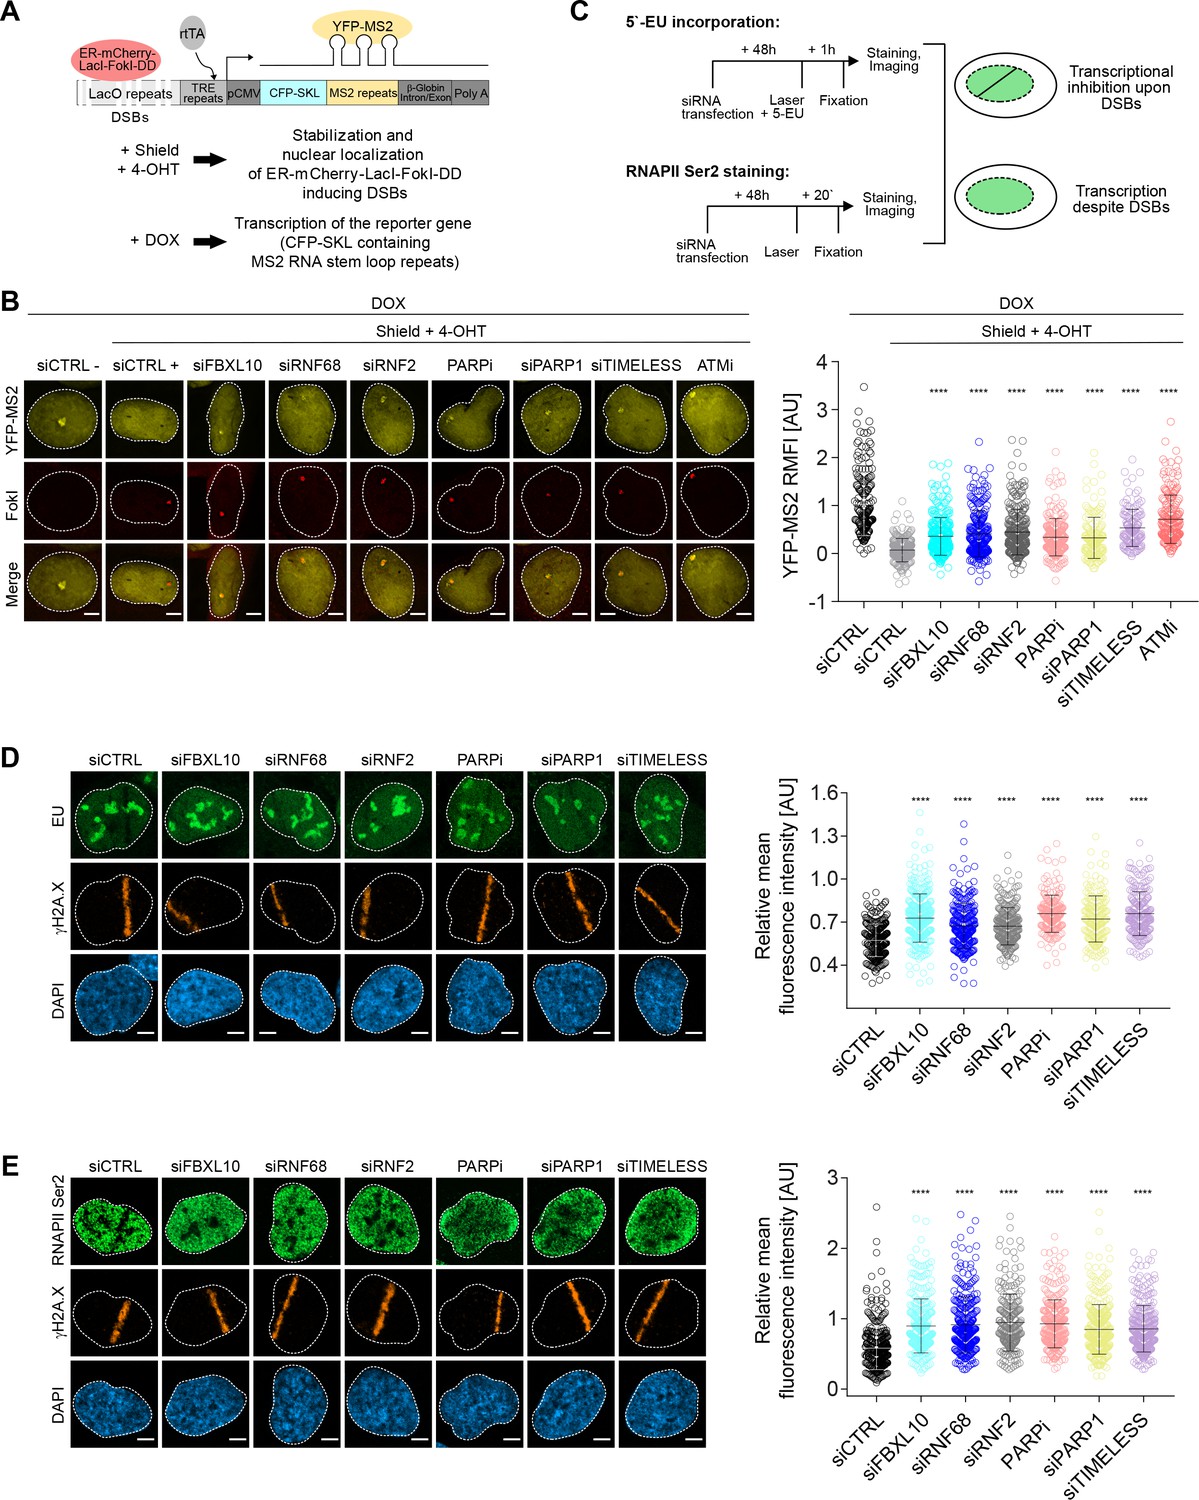
(A) Schematic of the U-2OS reporter system that allows monitoring transcription following induction of DSBs. DSBs are induced in the LacO repeats by activating the ER-mCherry-LacI-FokI-DD fusion protein with Shield-1 and 4-OHT. The transcription of the MS2 stem loop containing CFP-SKL is driven by a minimal CMV promoter and the binding of the tetracycline-controlled transactivator (rtTA) after DOX treatment. Nascent transcript is visualized by the binding of the YFP-MS2 viral coat protein. (B) Transcription activity was measured in U-2OS FokI-YFP-MS2 reporter cells transfected with the indicated siRNAs or inhibitors upon induction of DSBs. Quantification of YFP-MS2 relative mean fluorescence intensity (RMFI) was carried out from 3 to 4 independent experiments as in (Shanbhag et al., 2010). Error bars represent S.D. n = 179, 204, 280, 235, 263, 215, 148, 133 and 185 for siCTRL -, siCTRL +, siFBXL10, siRNF68, siRNF2, PARPi (Olaparib), siPARP1, siTIMELESS and ATMi (KU60018) respectively. Scale bar represents 5 μm. A white dash line denotes the border of each nucleus. P values were calculated using one-way ANOVA. ****p≤0.0001, ***p≤0.001, **p≤0.01, *p≤0.05, ns = not significant. (C) Schematics of 5-EU and RNAPII Ser2 staining to monitor transcription following laser micro-irradiation in U-2OS cells. Upon transcriptional silencing due to DNA damage, one can observe a dark anti-stripe for the 5-EU and RNAPII Ser2 staining (green) on the laser track which is highlighted by the γH2A.X staining. (D) U-2OS cells transfected with the indicated siRNAs were laser micro-irradiated and treated with 5-Ethynyl Uridine (5-EU) for 1 hr prior to fixation. Cells were stained with an antibody to γH2A.X (orange). 5-EU was detected using Click -IT imaging kit (green). Scale bar represents 5 μm. The dot plot represents the relative mean intensity of the 5-EU signal along the laser stripe compared to unaffected regions of the nucleus with error bars representing S.D. At least 20 cells were analyzed per condition from 2 or three independent experiments. A white dash line denotes the border of each nucleus. P values were calculated using one-way ANOVA. ****p≤0.0001, ***p≤0.001, **p≤0.01, *p≤0.05, ns = not significant. (E) U-2OS cells were fixed 20 min after laser micro-irridiation and stained with an antibody to γH2A.X (orange) and RNAPII Ser2 (green). Scale bar represents 5 μm. The dot plot represents the relative mean intensity of the RNAPII Ser2 signal along the laser stripe compared to unaffected regions of the nucleus with error bars representing S.D. At least 22 cells were analyzed per condition from 2 or three independent experiments. A white dash line denotes the border of each nucleus. P values were calculated using one-way ANOVA. ****p≤0.0001, ***p≤0.001, **p≤0.01, *p≤0.05, ns = not significant.
Figure 4—figure supplement 1
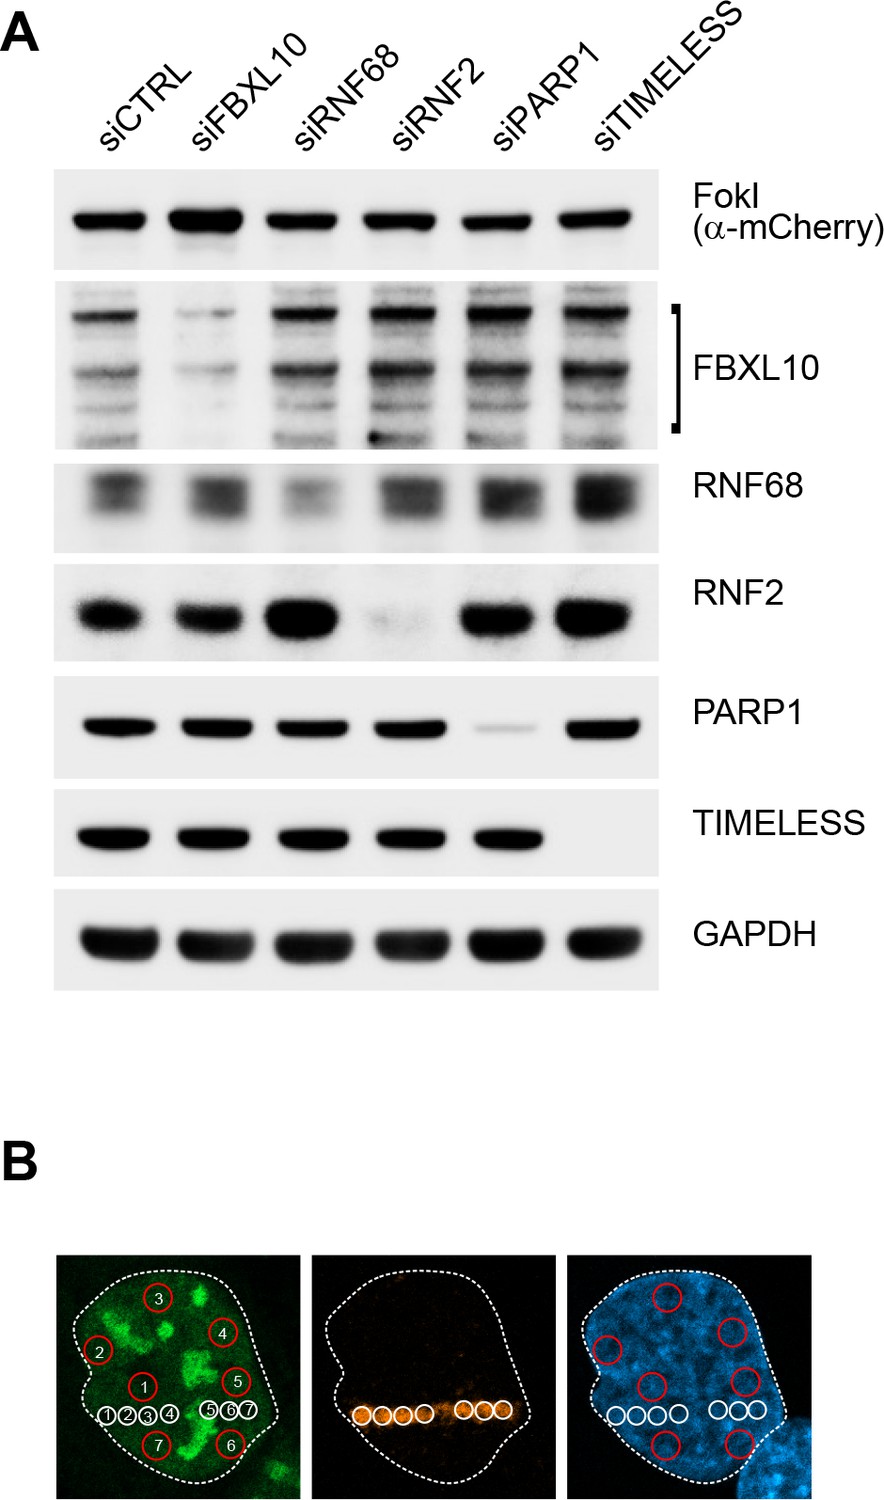
Top, representative immunoblots corresponding to Figure 4B; bottom, mode of quantification of experiments shown in Figure 4D–E.
(A) U-2OS FokI-YFP-MS2 reporter cells used to detect transcriptional repression upon DNA damage were transfected with either the indicated siRNAs or a non-targeting control (siCTRL). 48 hr later, cells were treated with Shield-1 ligand (250 nM) and 4-OHT (500 nM) for 4 hr. Cells were lysed and immunoblotting was performed as indicated. (B) Schematic image showing evaluation of 5-EU incorporation. U-2OS cells were laser micro-irradiated and treated with 5-Ethynyl Uridine (5-EU) for 1 hr prior to fixation. Cells were stained with an antibody to γH2A.X (orange). 5-EU was detected using Click-IT imaging kit (green). Mean fluorescence values were calculated by measuring 5-EU intensities at various spots (between 6 and 10) along the laser track highlighted by the γH2A.X staining (white circles) using ImageJ. Mean 5-EU fluorescence values were also calculated for undamaged regions (between 6 and 10 spots) of the nucleus (red circles). Ratios of the mean fluorescence values were calculated to get the relative mean fluorescent values plotted on the graphs shown in Figure 4D and Figure 7C. Nucleolar regions were excluded from the quantification. Quantification of the RNAPII Ser2 stainings were performed using the same method.
Figure 5 with 2 supplements
The FRUCC promotes the DNA damage response and Homologous Recombination Repair.
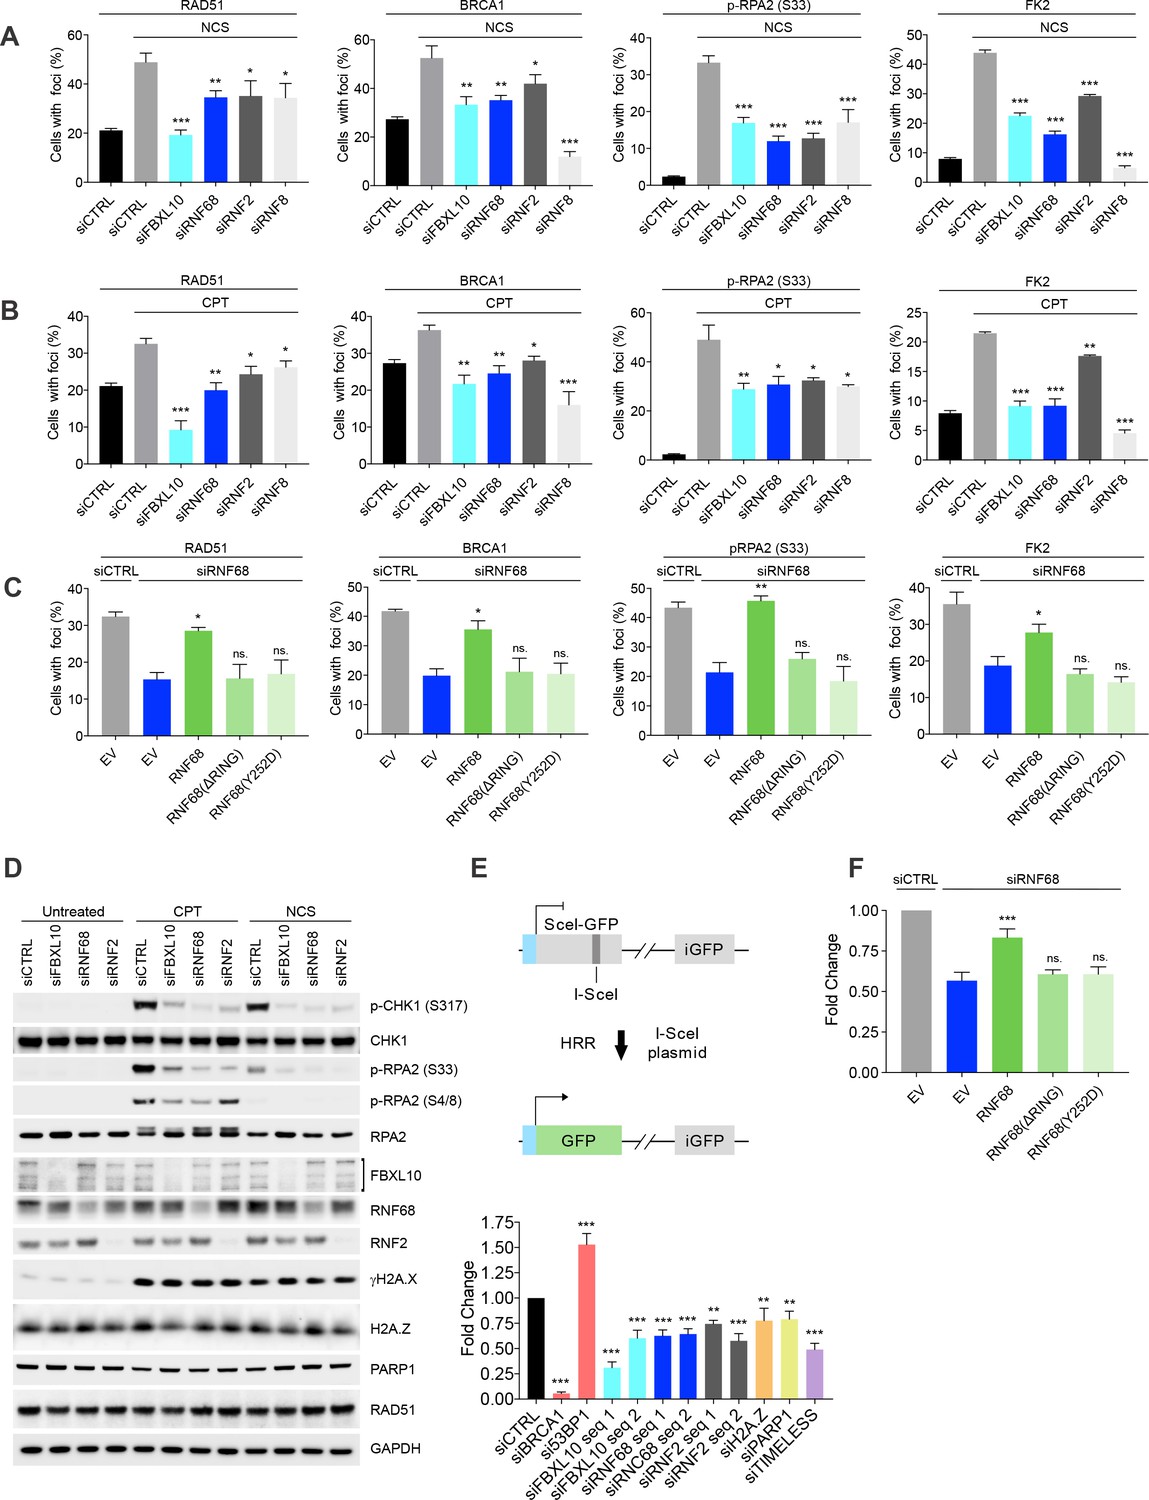
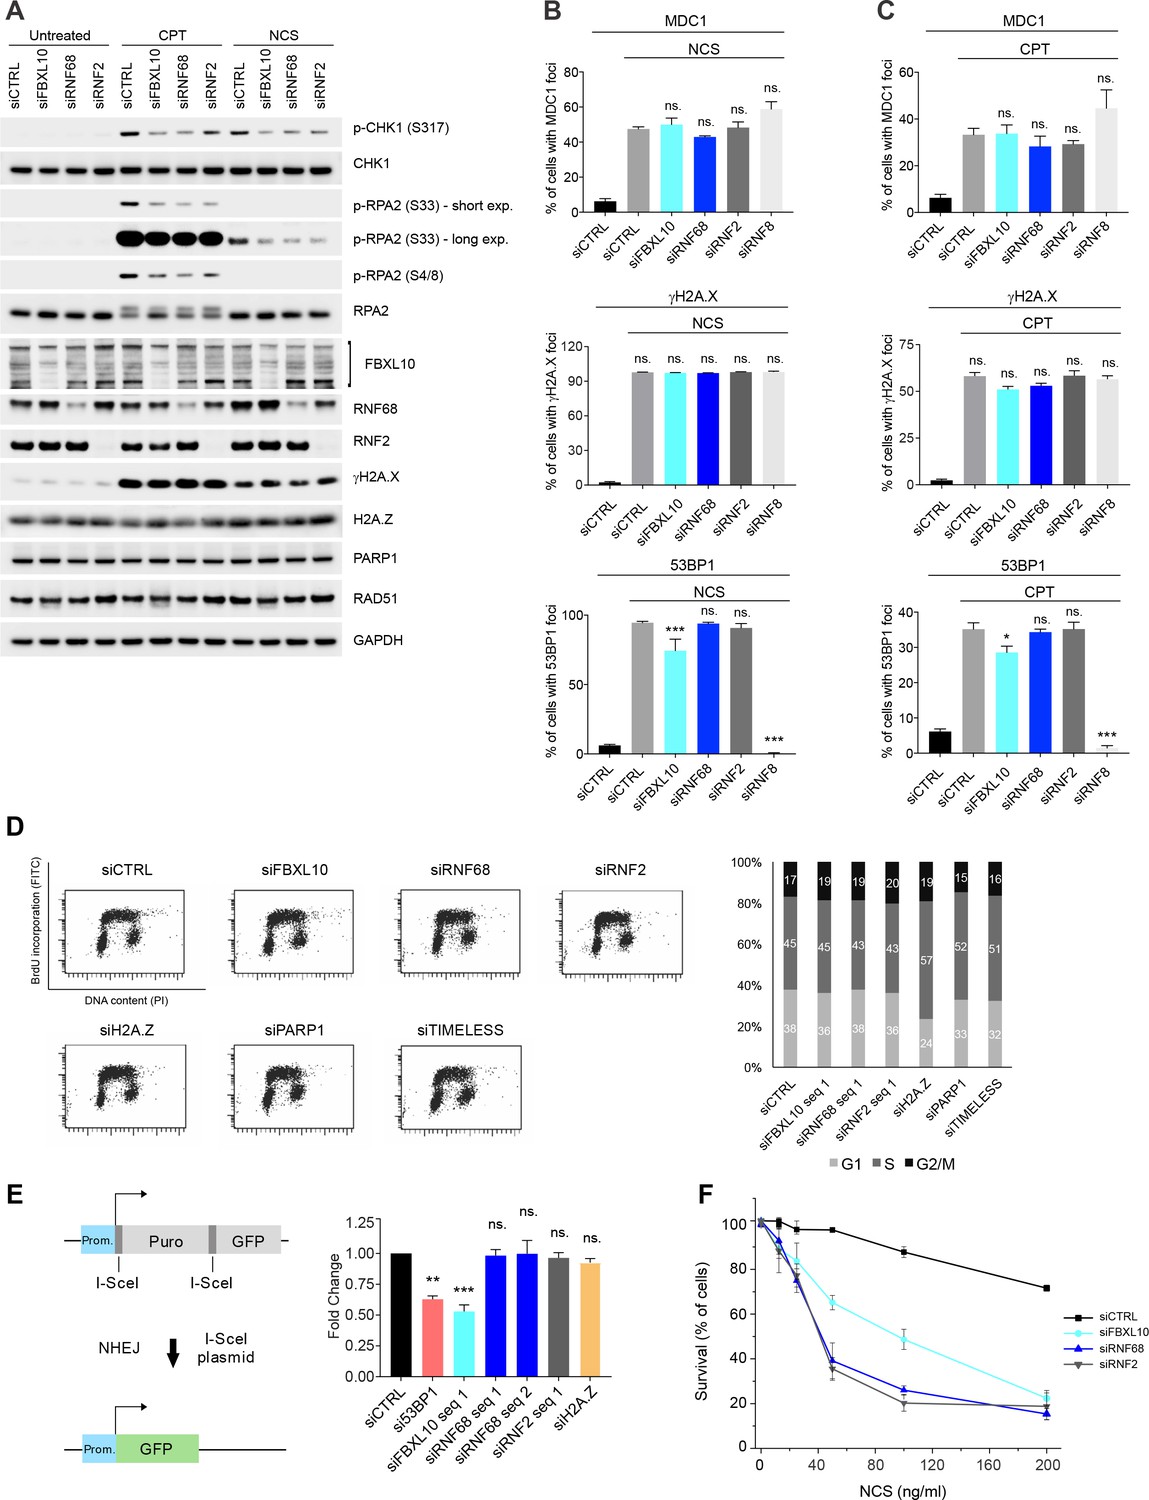
(A) U-2OS cells were transfected with siRNA oligos targeting FBXL10, RNF68, RNF2, RNF8 or a non-targeting control (siCTRL). Cells were treated for 3 hr (BRCA1, Rad51) or 1 hr (FK2, pRPA S33) with 0.1 μg/mL neocarzinostatin (NCS. Cells were fixed and stained with the indicated antibodies. The percentages of cells containing DNA-damage induced foci (≥15 foci/nucleus) marked with the specific antibody are shown. At least 800 cells were counted for each condition from ≥3 independent experimental repetitions. Error bars represent S.E.M. Differences relative to siCTRL (NCS) were calculated using one-way ANOVA. ***p≤0.001, **p≤0.01, *p≤0.05, ns = not significant. (B) The experiment was performed in (A), except that cells were treated with 1 μM C for 6 hr (BRCA1, Rad51) or 3 hr (FK2, pRPA S33). Error bars represent S.E.M. Differences relative to siCTRL (CPT) were calculated using one-way ANOVA. ***p≤0.001, **p≤0.01, *p≤0.05, ns = not significant. (C) U-2OS cells engineered to express FLAG-HA-tagged RNF68, RNF68(ΔRING) or RNF68(Y252D) were transfected with siRNAs targeting the 3’ UTR of RNF68 (siRNF68 seq2). Cells were treated with CPT for 6 hr (BRCA1, Rad51) or 3 hr (FK2, pRPA S33) and the percentages of cells containing damage-induced foci in the specified conditions were quantified. Error bars represent S.E.M from three independent experiments. P values were calculated using one-way ANOVA. ***p≤0.001, **p≤0.01, *p≤0.05, ns = not significant. (D) MIA-PaCa-2 cells were transfected with siRNAs targeting FBXL10, RNF68, or RNF2, or a non-targeting control (siCTRL). Cells were treated with 0.1 μg/mL NCS for 30 min or 1 μM CPT for 3 hr. Cells were lysed and immunoblotting was performed as indicated. Similar results were obtained in U-2OS cells (Figure 5—figure supplement 2A). (E) Upper: schematic representation of the DR-GFP-based reporter HR assay. The reporter consists of two inactive GFP genes in tandem. SceI-GFP contains a stop codon in the I-SceI endonuclease site, and iGFP is an N-terminally truncated GFP fragment. Cleavage of Sce-GFP using expression of I-SceI endonuclease introduces a double stranded break which can be repaired by HR using the downstream iGFP sequence as a template, restoring GFP expression. Lower: graph representing the quantification of HRR measured as fold change in frequency of repair of DR-GFP U-2OS cells. DR-GFP U-2OS cells were transfected with the indicated siRNAs. GFP-positive cells were measured using flow cytometry. Bars represent the mean of ≥4 independent experiments ± S.E.M. P values were calculated using one-way ANOVA. ***p≤0.001, **p≤0.01, *p≤0.05, ns = not significant. (F) DR-GFP U-2OS were engineered to express FLAG-HA-tagged RNF68, RNF68(ΔRING) or RNF68(Y252D). Cells were transfected with siRNAs targeting the 3’ UTR (siRNF68 seq2) of RNF68 and HR repair was measured as in (E). Bars represent the mean of five independent experiments ± S.E.M. P values were calculated using one-way ANOVA. ***p≤0.001, **p≤0.01, *p≤0.05, ns = not significant.
Figure 5—figure supplement 1
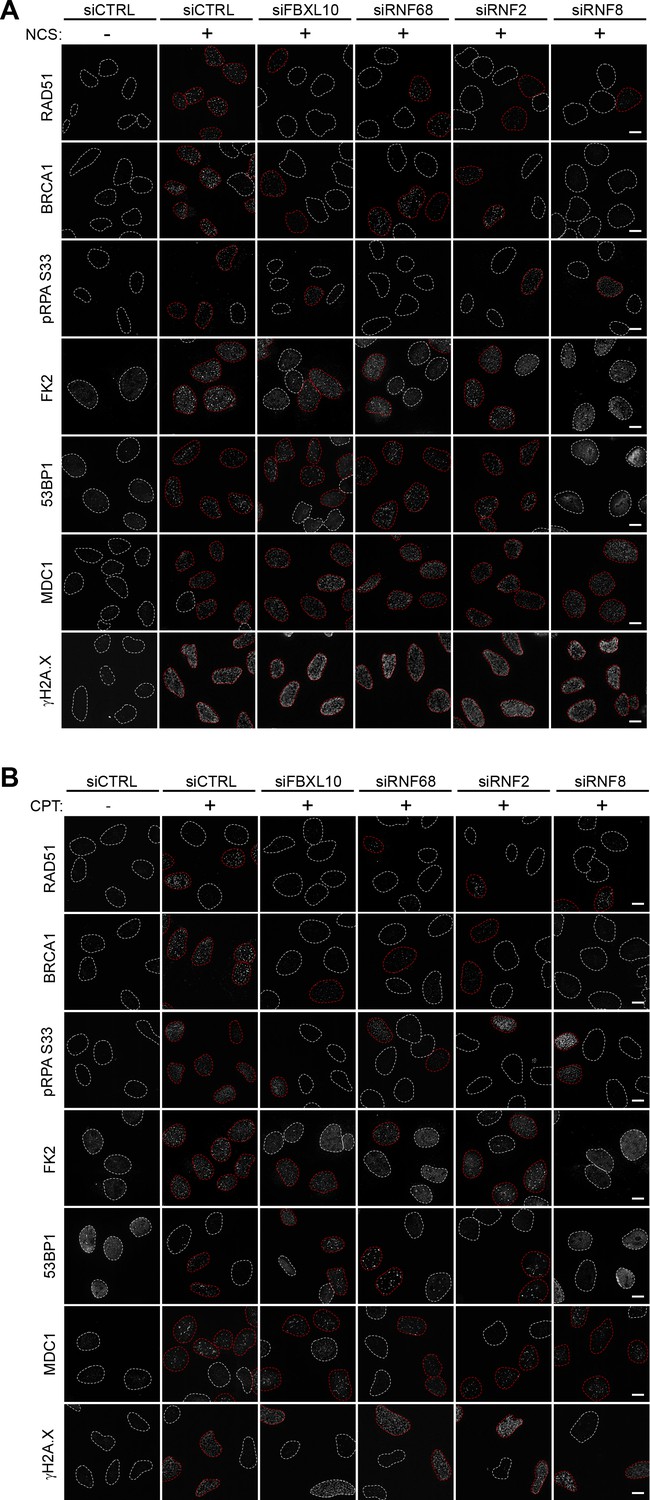
Representative images for Figure 5A-B.
(A) U-2OS cells were transfected with siRNAs targeting FBXL10, RNF68, RNF2, RNF8, or a non-targeting control (siCTRL). Cells were treated with 0.1 μg/ml NCS (+) for 1 hr (FK2, pRPA S33, MDC1, γH2A.X) or 3 hr (BRCA1, Rad51, 53BP1) or left untreated (-). Cells were stained with the indicated antibodies. Representative images are shown. A white dash line denotes the border of each nucleus that was not considered positive for the indicated antibody staining, while a red dash line denotes the boarder of nucleuses that were considered positive for the indicated staining. Graphical representation of the data is shown in Figure 5A. Scale bar represents 10 μm. (B) U-2OS cells were transfected with siRNAs targeting FBXL10, RNF68, RNF2, RNF8, or a non-targeting control (siCTRL). Cells were treated with 1 μM CPT (+) for 3 hr (FK2, pRPA S33, MDC1, γH2A.X) or 6 hr (BRCA1, Rad51, 53BP1) or left untreated (-). Cells were stained with the indicated antibodies. Representative images are shown. A white dash line denotes the border of each nucleus that was not considered positive for the indicated antibody staining, while a red dash line denotes the boarder of nucleuses that were considered positive for the indicated staining. Graphical representation of the data is shown in Figure 5B. Scale bar represents 10 μm.
Figure 5—figure supplement 2
The FRUCC promotes a proper DNA damage response and is needed for cell survival upon genotoxic stress.
(A) U-2OS cells were transfected with siRNAs targeting FBXL10, RNF68, or RNF2, or a non-targeting control (siCTRL). Cells were treated with 0.1 μg/mL NCS for 30 min or 1 μM CPT for 3 hr. Cells were lysed and immunoblotting was performed as indicated. (B) U-2OS cells were transfected with siRNA oligos targeting FBXL10, RNF68, RNF2, or RNF8, or with a non-targeting control (siCTRL). Cells were treated with 0.1 μg/mL NCS (1 hr: MDC1, γH2A.X; 3 hr: 53BP1). Cells were fixed and stained with antibodies to MDC1, γH2A.X, or 53BP1. The percentages of cells containing DNA-damage induced foci (≥15 foci/nucleus) marked with the specific antibody are shown. Error bars represent S.E.M. At least 800 cells were counted for each condition from ≥3 independent experiments. P values were calculated using one-way ANOVA. ***p≤0.001, **p≤0.01, *p≤0.05, ns = not significant. (C) U-2OS cells were transfected with siRNA oligos targeting FBXL10, RNF68, RNF2, or RNF8, or a non-targeting control (siCTRL). Cells were treated with 1 μM CPT (3 hr: MDC1, γH2A.X; 6 hr: 53BP1). Cells were fixed and stained with antibodies to MDC1, γH2A.X, or 53BP1. The percentages of cells containing DNA-damage induced foci (≥15 foci/nucleus) marked with the specific antibody are shown. Error bars represent S.E.M. At least 800 cells were counted for each condition from ≥3 independent experiments. P values were calculated using one-way ANOVA. ***p≤0.001, **p≤0.01, *p≤0.05, ns = not significant. (D) U-2OS cells were transfected with the indicated siRNAs. Cell cycle analyses were based on flow cytometric measurements of BrdU incorporation and propidium iodine DNA-staining. Left: representative profiles are shown. Right: the bar graph represents the mean percentage of cells in the different stages of the cell cycle, as quantified using FlowJo software from two independent experiments. (E) Left, the schematic represents the GFP reporter (EJ5-GFP) used to monitor NHEJ. EJ5-GFP reporter, detects multiple classes of NHEJ events. The GFP coding cassette is inactive because it is separated from its promoter by a puromycin gene that is flanked by two I-SceI sites. After the transfection of I-SceI the puromycin gene is excised by the two I-SceI-induced cuts, so that the promoter can drive the expression of GFP, leading to GFP+ cells. Right, graph representing the quantification of NHEJ measured as fold change. U-2OS EJ5-GFP cells were transfected with the indicated siRNAs. GFP-positive cells were measured using flow cytometry. Bars represent the mean of at least three independent experiments ± S.E.M. P values were calculated using one-way ANOVA. ***p≤0.001, **p≤0.01, *p≤0.05, ns = not significant. (F) MIA-PaCa-2 cells were transfected with control siRNA (siCTRL) or siRNAs directed against FBXL10, RNF68, or RNF2, and subsequently treated with various concentrations of NCS. Survival curves were generated based on AlamarBlue intensity. Error bars represent SD. The signal from each condition was normalized to an untreated control to adjust for any relative growth effects of the siRNAs.
Figure 6 with 1 supplement
The recruitment of H2A.Z to DSBs depends on the FRUCC.
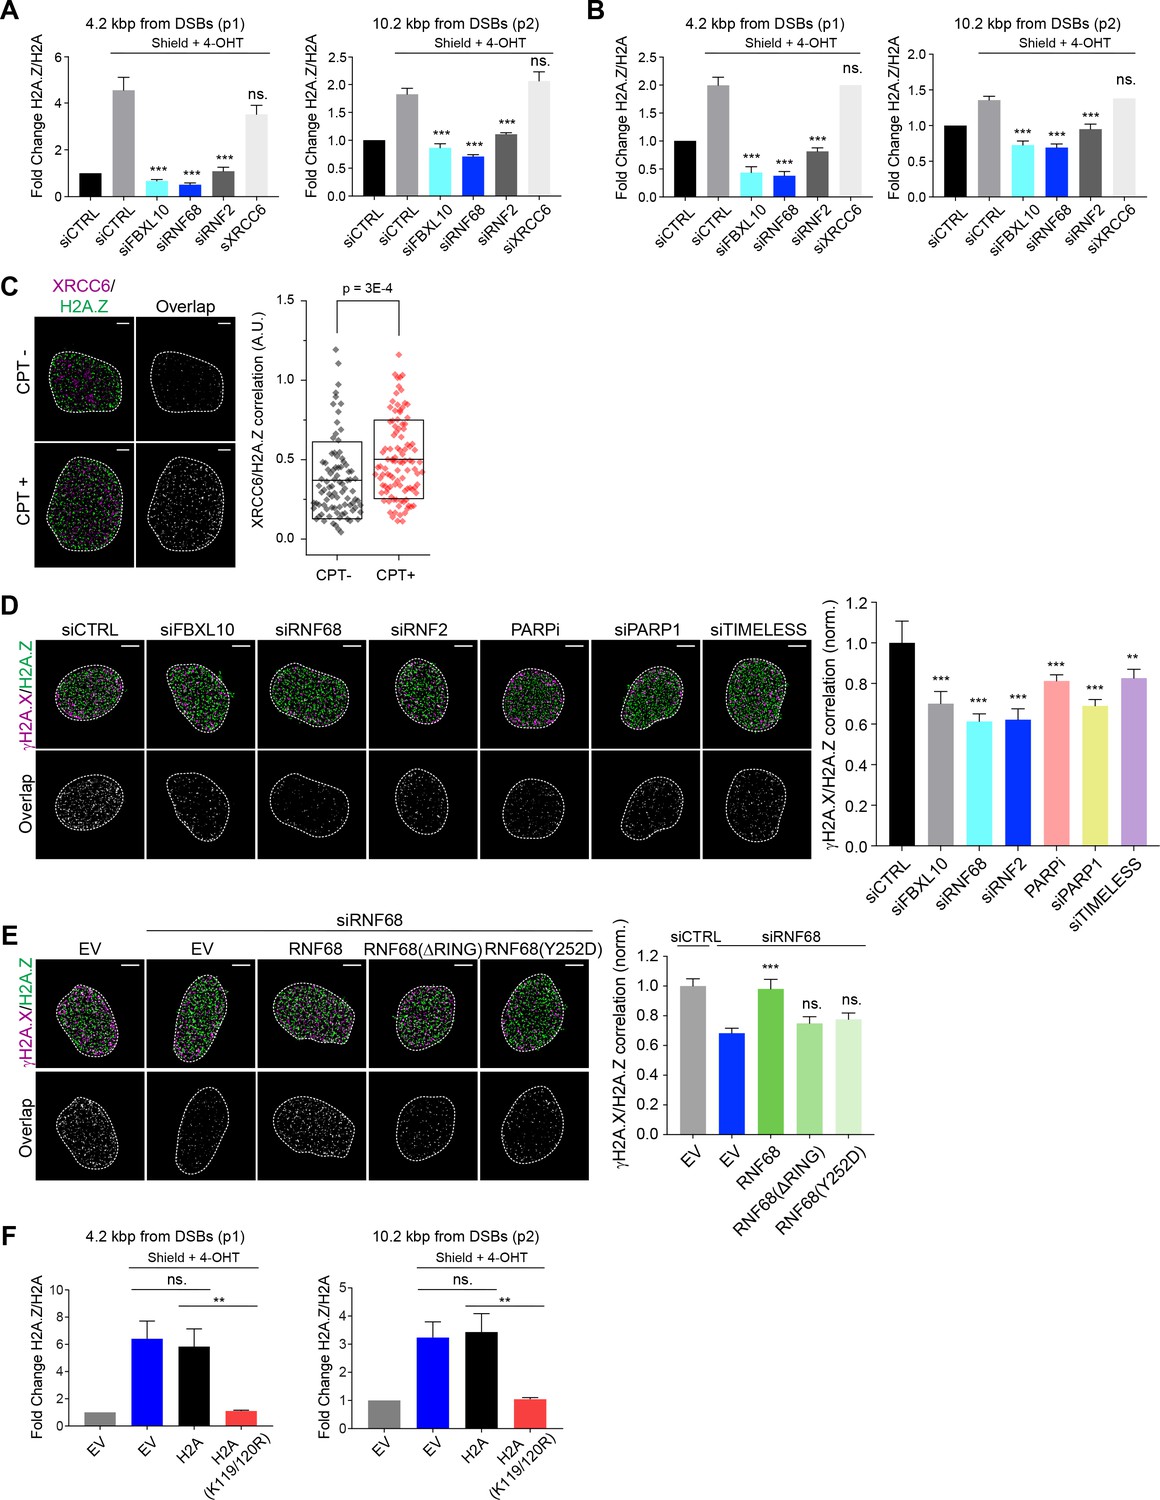
(A) qChIP was performed in the DSB reporter U-2OS cells (see Figure 3C) with and without FokI-induced DSBs using the indicated antibodies. The results are shown as a ratio of H2A.Z to H2A levels. The mCherry-LacI-FokI-DD nuclease was induced for 1 hr using Shield-1 and 4-OHT. qPCR-results for amplicons 4.2 kbp (p1) and 10.2 kbp (p2) from the induced DSBs are shown. Error bars represent S.E.M from four independent experiments. P values were calculated using one-way ANOVA. ***p≤0.001, **p≤0.01, *p≤0.05, ns = not significant. (B) The qChIPs were performed as in (A) except that the mCherry-LacI-FokI-DD nuclease was induced for 4 hr using Shield-1 and 4-OHT. (C) SR imaging was performed to analyze the colocalization between XRCC6 and H2A.Z, before and after 1 hr of CPT treatment. U-2OS cells were serum starved for 72 hr, followed by release for 14 hr into complete media. Cells were fixed and stained with antibodies to XRCC6 (magenta) and H2A.Z (green). Representative nuclei are shown the left. A white dash line denotes the border of each nucleus. Scale bar represents 3 μm. The signal overlap (white) demonstrates the colocalization between XRCC6 and H2A.Z. The graph on the right displays the correlation between XRCC6 and H2A.Z in individual nuclei. Untreated, n = 87; CPT, n = 102. The number of analyzed nuclei, n, is pooled from the three independent experiments. A.U., arbitrary units. Whisker box shows mean and S.D. values. P values were calculated using two-sample t-test between CPT - and CPT + samples. (D) U-2OS cells were transfected with siRNAs targeting FBXL10, RNF68, or RNF2 and subjected to NCS treatment for 20 min followed by fixation and immunostaining with antibodies to γH2A.X (magenta) and H2A.Z (green). SR imaging was performed to analyze the colocalization between γH2A.X and H2A.Z. Representative nuclei are shown in the top panels, and signal overlap is shown in the lower panels. Scale bar represents 5 μm. The graph on the right represents the correlation between γH2A.X and H2A.Z after depletion of the indicated proteins. Amplitudes were normalized to the mean value of siCTRL. Error bars represent S.E.M. n = 546, 160, 172, 167, 237, 159 and 151 nuclei for siCTRL, siFBXL10, siRNF68, siRNF2, PARPi (Olaparib), siPARP1 and siTIMELESS respectively. The n value is pooled from the three independent experiments. Errors bars show S.E.M. P values were calculated using two-sample t-test between siCTRL and each indicated siRNA. ***p≤0.001, **p≤0.01, *p≤0.05, ns = not significant. (E) U-2OS cells stably expressing FLAG-HA-tagged RNF68, RNF68(ΔRING), RNF68(Y252D) or infected with an empty vector (EV) were transfected with siRNAs targeting the 3’ UTR of RNF68 (siRNF68 seq2) or a non-targeting control (siCTRL). Cells were subjected to NCS treatment for 20 min and the extent of colocalization between γH2A.X and H2A.Z was analyzed by dSTORM microscopy, as in (D). Scale bar represents 5 μm. Correlation amplitudes were normalized to the mean value of siCTRL EV. Errors represent S.E.M. n = 363, 224, 296, 206, and 253 nuclei for siCTRL EV, siRNF68 EV, RNF68(WT), RNF68(ΔRING), and RNF68(Y252D), respectively. The n value is pooled from three independent experiments. Differences relative to siRNA68 EV were calculated using two-sample t-test. ***p≤0.001, **p≤0.01, *p≤0.05, ns = not significant. (F) DSB reporter U-2OS cells were transiently transfected with FLAG-Strep-tagged H2A, H2A(K119/120R) or with an empty vector (EV). qChIP was performed with and without FokI-induced DSBs using the indicated antibodies. The results are shown as a ratio of H2A.Z to H2A levels. The mCherry-LacI-FokI-DD nuclease was induced for 1 hr using Shield-1 and 4-OHT. qPCR-results for amplicons 4.2 kbp (p1) and 10.2 kbp (p2) from the induced DSBs are shown. Error bars represent S.E.M from five independent experiments. P values were calculated using one-way ANOVA. ***p≤0.001, **p≤0.01, *p≤0.05, ns = not significant.
Figure 6—figure supplement 1
The recruitment to DSBs of H2A.Z, but not TIP48 and TIP49, depends on the FRUCC.
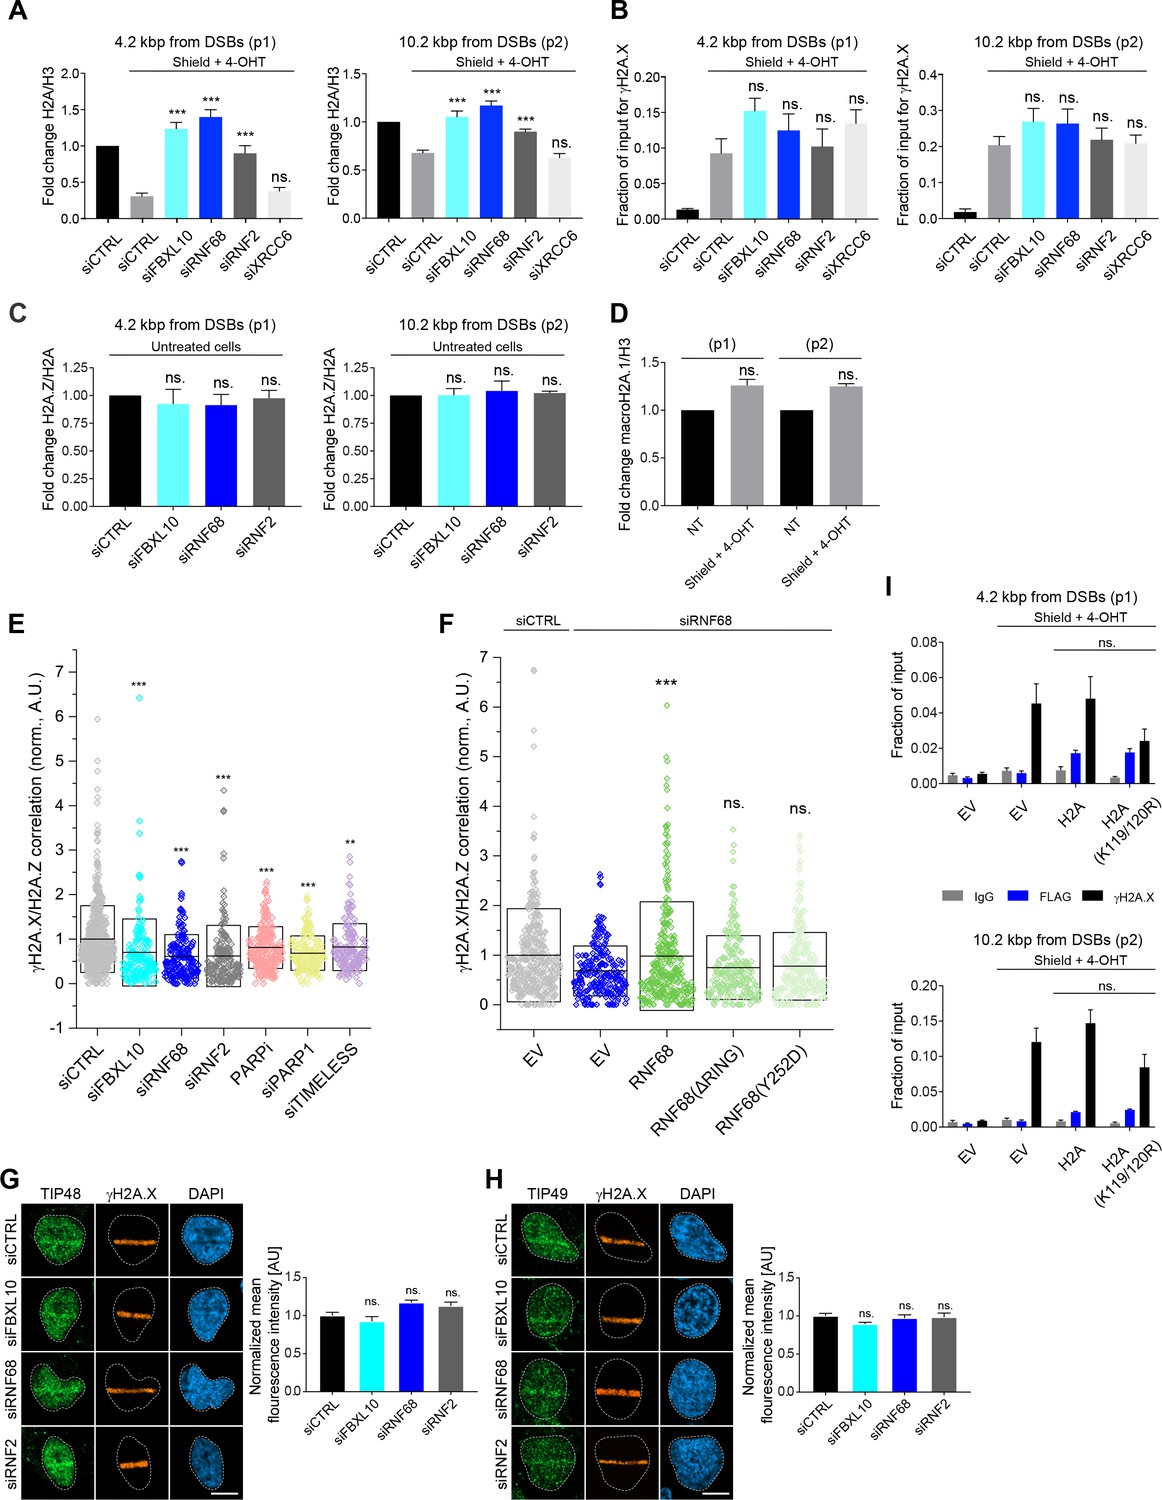
(A) U-2OS FokI reporter cells were used in qChIP experiments. The ER-mCherry-LacI-FokI-DD nuclease was induced for 1 hr using Shield-1 and 4-OHT. qChIP was performed with and without ER-mCherry-LacI-FokI-DD induction using antibodies to Histone H2A and Histone H3. qPCR-results for amplicons 4.2 kbp (p1) and 10.2 kbp (p2) from the induced DSB are shown. The results are shown as a ratio of H2A to H3 levels. Error bars represent S.E.M from four independent experiments. P values were calculated using one-way ANOVA. ***p≤0.001, **p≤0.01, *p≤0.05, ns = not significant. (B) qChIP was performed in U-2OS FokI reporter cells using an antibody to γH2A.X. qPCR-results for amplicons 4.2 kbp (p1) and 10.2 kbp (p2) from the induced DSB are shown. The ER-mCherry-LacI-FokI-DD nuclease was induced for 1 hr using Shield-1 and 4-OHT. Error bars represent S.E.M from three independent experiments. P values were calculated using one-way ANOVA. ***p≤0.001, **p≤0.01, *p≤0.05, ns = not significant. (C) qChIP was performed in U-2OS FokI reporter cells without the induction of the FokI nuclease using the indicated antibodies. The results are shown as a ratio of H2A.Z to H2A levels. qPCR-results for amplicons 4.2 kbp (p1) and 10.2 kbp (p2) from the uninduced DSBs are shown. Error bars represent S.E.M from three independent experiments. P values were calculated using one-way ANOVA. ***p≤0.001, **p≤0.01, *p≤0.05, ns = not significant. (D) U-2OS FokI reporter cells were used in qChIP experiments. The ER-mCherry-LacI-FokI-DD nuclease was induced for 1 hr using Shield-1 and 4-OHT. qChIP was performed with and without ER-mCherry-LacI-FokI-DD induction using antibodies to macroH2A.1 and Histone H3. qPCR-results for amplicons 4.2 kbp (p1) and 10.2 kbp (p2) from the induced DSB are shown. The results are shown as a ratio of macroH2A.1 to H3 levels. Error bars represent S.E.M from three independent experiments. P values were calculated using Wilcoxon rank sum test. ***p≤0.001, **p≤0.01, *p≤0.05, ns = not significant. (E) U-2OS cells were transfected with siRNAs targeting FBXL10, RNF68, RNF2, or with a non-targeting control (siCTRL) and subjected to NCS treatment (0.1 μg/mL) for 20 min followed by fixation and immunostaining with antibodies to γH2A.X and H2A.Z. The dot plot corresponds to Figure 6D and represents the correlation values between γH2A.X and H2A.Z for individual nuclei measured using dSTORM microscopy. Whisker box shows mean and S.D. values. Amplitudes were normalized to the mean correlation value of siCTRL. n = 546, 160, 172, 167, 237, 159 and 151 nuclei for siCTRL, siFBXL10, siRNF68, siRNF2, PARPi (Olaparib), siPARP1 and siTIMELESS respectively. The n value is pooled from the three independent experiments. P values were calculated using two-sample t-test between siCTRL and each indicated siRNA. ***p≤0.001, **p≤0.01, *p≤0.05, ns = not significant. (F) U-2OS cells stably expressing RNF68, RNF68(ΔRING), RNF68(Y252D) or infected with an empty vector (EV) were transfected with siRNAs targeting the 3` UTR of RNF68 (siRNF68 seq2) or a non-targeting control (siCTRL). Cells were subjected to 0.1 μg/mL NCS treatment for 20 min and the extent of colocalization between γH2A.X and H2A.Z was measured using dSTORM microscopy. The dot plot corresponds to Figure 6E represents the correlation values for individual nuclei. Whisker box shows mean and S.D. values. Correlation amplitudes were normalized to the mean value of siCTRL EV. Errors represent S.E.M. n = 363, 224, 296, 206, and 253 nuclei for siCTRL EV, siRNF68 EV, RNF68(WT), RNF68(ΔRING), and RNF68(Y252D), respectively. The n value is pooled from the three independent experiments. Differences relative to siRNA68 EV were calculated using two-sample t-test. ***p≤0.001, **p≤0.01, *p≤0.05, ns = not significant. (G) Confocal images of U-2OS cells fixed 5 min after laser micro-irradiation and stained for TIP48 (green) and the DNA damage marker γH2A.X (orange). Scale bar represents 10 μm. The graph represents the mean intensity of the TIP48 signal on the γH2A.X track, normalized to the mean values of the siCTRL sample. At least 18 laser stripes were analyzed per condition from two independent experiments. A white dash line denotes the border of each nucleus. Error bars represent S.E.M. Differences relative to siCTRL were calculated using one-way ANOVA. ****p≤0.0001, ***p≤0.001, **p≤0.01, *p≤0.05, ns = not significant. (H) Same is in (G) but cells were stained for TIP49. (I) qChIP was performed in U-2OS FokI reporter cells transiently transfected with EV, FLAG-Strep-tagged H2A, or H2A(K119/120R) using antibodies to FLAG and γH2A.X. qPCR-results for amplicons 4.2 kbp (p1) and 10.2 kbp (p2) from the induced DSB are shown. The ER-mCherry-LacI-FokI-DD nuclease was induced for 1 hr using Shield-1 and 4-OHT. Error bars represent S.E.M from five independent experiments. P values were calculated using one-way ANOVA. ***p≤0.001, **p≤0.01, *p≤0.05, ns = not significant.
Figure 7 with 1 supplement
H2A.Z is involved in transcriptional repression at sites of DNA breaks and is required for efficient DSB signaling.
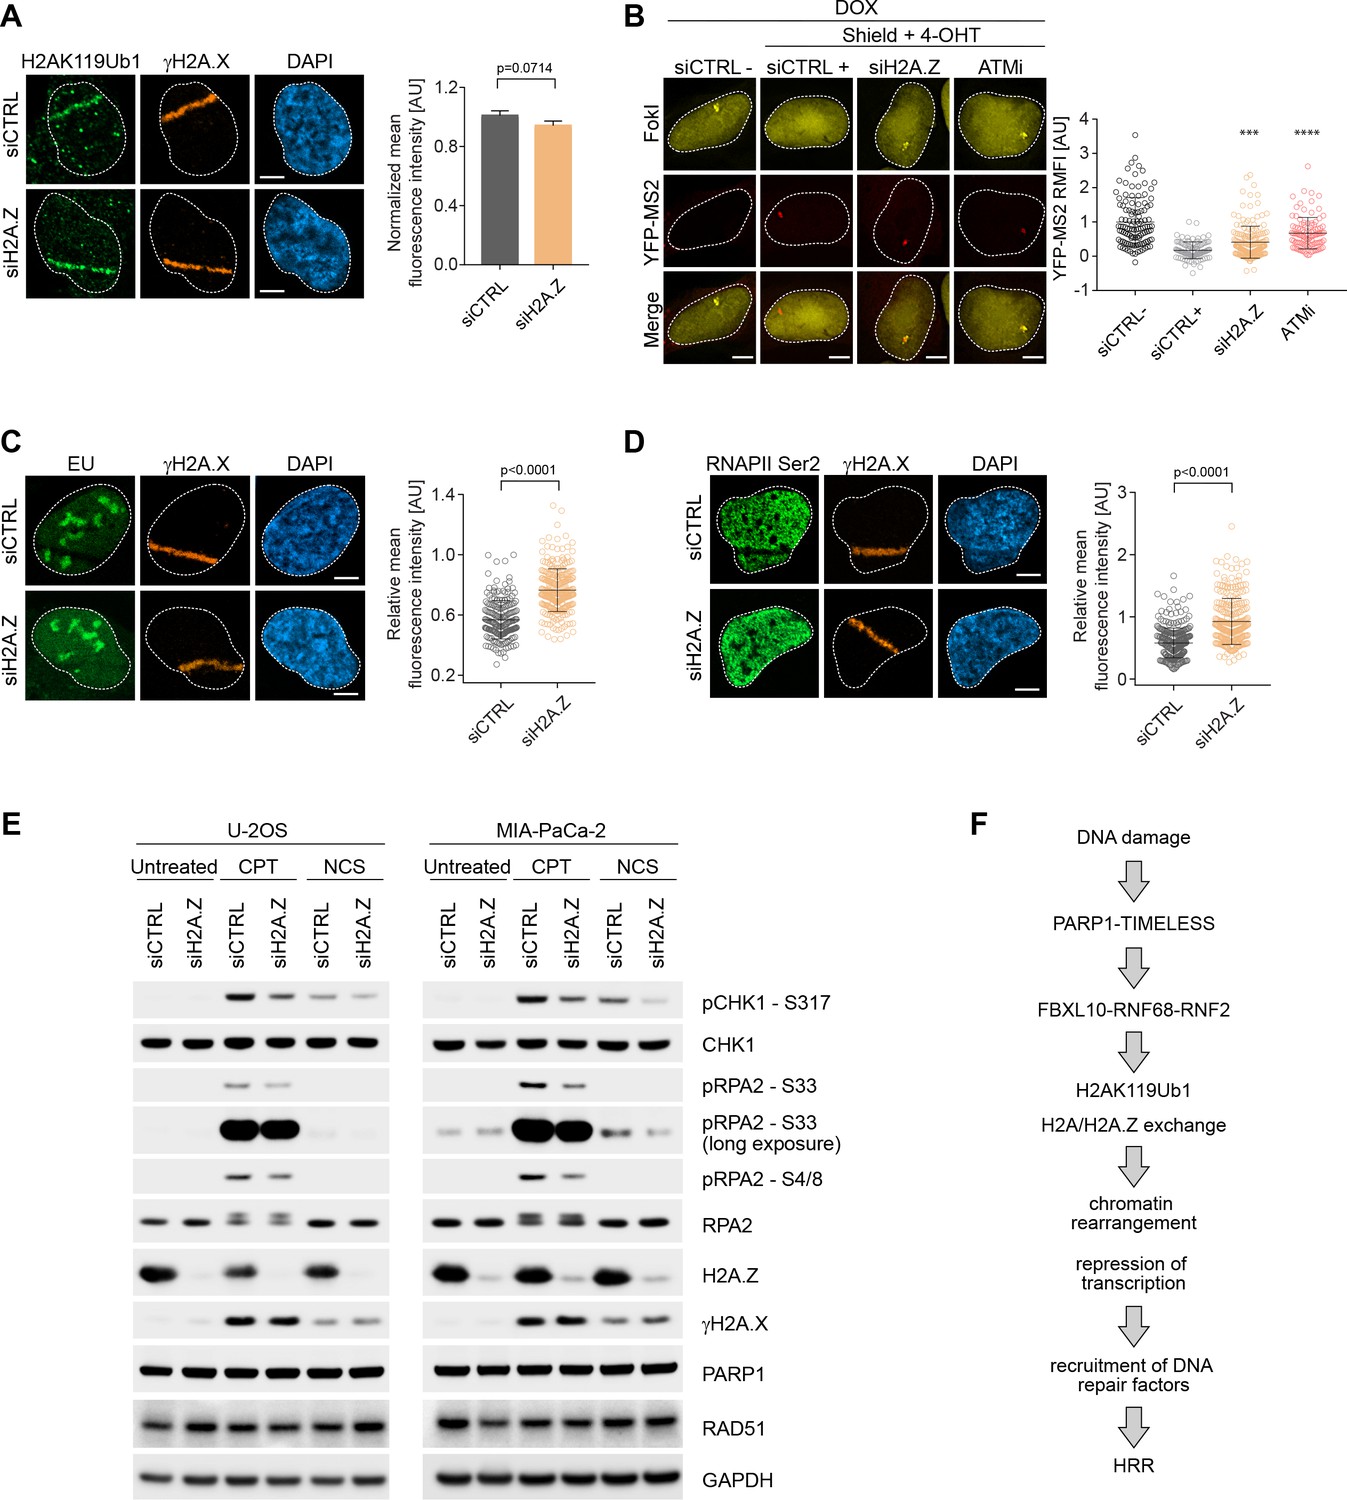
(A) U-2OS cells were transfected with H2A.Z siRNA or CTRL siRNA. Cells were fixed 30 min after laser micro-irradiation and stained with antibodies to γH2A.X (orange) and H2AK119Ub1 (green). Scale bar represents 5 μm. The graph represents the mean intensity of the H2AK119Ub1 signal on the γH2A.X track, normalized to the mean values of the siCTRL sample. At least 40 laser stripes were analyzed per condition from 2 or three independent experiments. Error bars represent S.E.M. Differences relative to siCTRL were calculated using the nonparametric Mann-Whitney test. (B) Transcription activity was measured in cells silenced against H2A.Z upon induction of DSBs in U-2OS FokI-YFP-MS2 reporter cells. Quantification of YFP-MS2 relative mean fluorescence intensity (RMFI) was carried out from three independent experiments. Error bars represent S.D. n = 115, 103, 175 and 103 for siCTRL -, siCTRL +, siH2AZ and ATMi (KU60018) respectively. A white dash line denotes the border of each nucleus. Scale bar represents 5 μm. P values were calculated using one-way ANOVA. ****p≤0.0001, ***p≤0.001, **p≤0.01, *p≤0.05, ns = not significant. (C) Cells were transfected with H2A.Z siRNA or CTRL siRNA. Cells were treated with 5-Ethynyl Uridine (5-EU) immediately after laser microirradiation and were fixed 1 hr after damage induction. 5-EU was detected using Click -IT imaging kit (green) and stained with antibody to γH2A.X (orange). Scale bar represents 5 μm. The dot plot represents the relative mean intensity of the EU signal located along the laser stripe compared to unaffected regions of the nucleus with error bars representing S.D. At least 25 cells were analyzed per condition from 2 or three independent experiments. P values were calculated using the nonparametric Mann-Whitney test. (D) Right panel: Cells were stained with antibodies to γH2A.X (orange) and RNAPII Ser2 (right panel) 20 min after laser microirradiation. Scale bar represents 5 μm. The dot plot represents the relative mean intensity of the RNAPII Ser2 signal along the laser stripe compared to unaffected regions of the nucleus with error bars representing S.D. At least 25 cells were analyzed per condition from 2 or three independent experiments. P values were calculated using the nonparametric Mann-Whitney test. (E) U-2OS and MIA-PaCa-2 cells were transfected with siRNA targeting H2A.Z or a non-targeting control (siCTRL). Cells were treated with 0.1 μg/mL NCS for 30 min or 1 μM CPT for 3 hr. Cells were lysed and immunoblotting was performed as indicated. (F) Model of the role of the FRUCC in the response to genotoxic stress. See text for details.
Figure 7—figure supplement 1
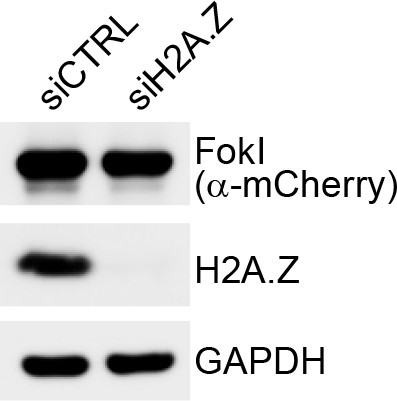
FokI levels in H2A.Z depleted cells.
U-2OS FokI-YFP-MS2 reporter cells used to measure transcription near DSB sites were transfected with siRNA against H2A.Z or a non-targeting control (siCTRL).
48 hr later cells were treated with Shield-1 ligand (250 nM) and 4-OHT (500 nM) for 4 hr. Cells were lysed, and immunoblotting was performed as indicated.
Author response image 1
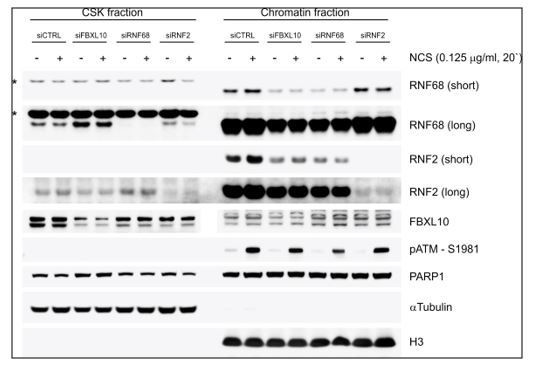
U2OS cells were transfected with the indicated siRNAs.
After 72 h, cells were treated with NCS for 20 minutes. After harvesting, cells were fractionated into soluble and chromatin fractions, and lysates were immunoblotted as indicated. For chromatin fractionation, cells were pre-extracted with CSK buffer (D’Angiolella et al., 2010) for 10 minutes on ice and centrifuged for 3 min at 3000 g. The insoluble pellets were digested with TurboNuclease in the presence of 250 mM NaCl to generate the chromatin fraction. Asterisks denote unspecific bands.
Author response image 2
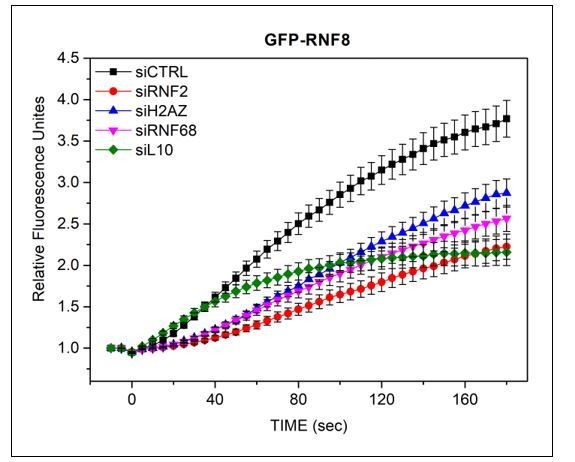
U-2OS cells stably expressing GFP-RNF8 (a kind gift from Dr D Durocher) were transfected with siRNAs targeting FBXL10, RNF68, RNF2 or H2A.Z, or a non-targeting control (CTRL).
Cells were pre-sensitized with BrdU (10 μM) for 36 hours and subjected to 405 nm laser induced damage. DNA damage recruitment dynamics were captured by live cell imaging. Relative fluorescence values and images were acquired every 5 seconds for 3 minutes. For each condition, ≥25 cells were evaluated from 2 or 3 independent experiments. Mean relative fluorescence values and standard errors were plotted against time.
Additional files
-
Source data 1
Raw data for all graphs in main figures and figure supplements.
- https://doi.org/10.7554/eLife.38771.020
-
Transparent reporting form
- https://doi.org/10.7554/eLife.38771.021
Download links
A two-part list of links to download the article, or parts of the article, in various formats.
Downloads (link to download the article as PDF)
Open citations (links to open the citations from this article in various online reference manager services)
Cite this article (links to download the citations from this article in formats compatible with various reference manager tools)
PARP1-dependent recruitment of the FBXL10-RNF68-RNF2 ubiquitin ligase to sites of DNA damage controls H2A.Z loading
eLife 7:e38771.
https://doi.org/10.7554/eLife.38771


