Enhanced ER proteostasis and temperature differentially impact the mutational tolerance of influenza hemagglutinin
- Massachusetts Institute of Technology, United States
- Fred Hutchinson Cancer Research Center, United States
- University of Washington, United States
- Tufts University, United States
Figures
Figure 1
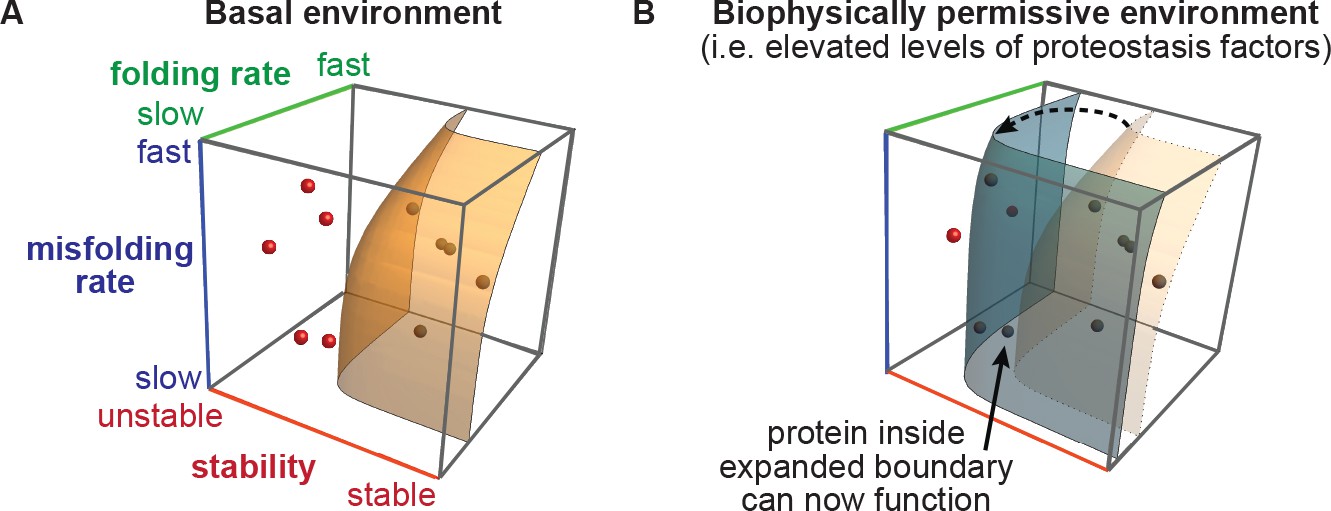
The proteostasis boundary model for protein evolution.
(A) The accessibility of protein evolutionary intermediates is defined by protein stability, folding rate, and misfolding rate. Protein variants inside the boundary are accessible (shaded in black), and those outside the boundary are inaccessible (shaded in red). Figure generated using modified Mathematica macro from Powers et al (Powers et al., 2009). (B) In a biophysically permissive environment, such as cells with elevated levels of proteostasis factors, the boundary may be shifted, making otherwise non-functional variants accessible.
Figure 2 with 3 supplements
Induction of XBP1s and ATF6f/XBP1s is selective and does not globally induce stress responses.
(A) Heat map of selected transcript-level effects of upregulating ER folding machinery in HEK293ATF6f/XBP1s cells via XBP1s or ATF6f/XBP1s at 37˚C, relative to a basal environment at 37˚C. (B) Heat map of selected transcript-level effects of upregulating ER proteostasis machinery via XBP1s or ATF6f/XBP1s at 39˚C, relative to a basal environment at 39˚C. (C) Heat map of selected transcript-level effects of increasing the temperature from 37˚C to 39˚C in a basal ER proteostasis environment for 24 hr. Genes in A–C grouped by ER (top) or cytosolic (bottom) proteostasis networks, and also based on functional classifications (Shoulders et al., 2013). For (A–B), tetracycline repressor-regulated XBP1s was induced by treatment with 0.1 μg/mL doxycycline (24 hr); destabilized domain-regulated ATF6f was induced by treatment with 1 μM trimethoprim (24 hr). Figure 2—figure supplement 1. Full transcriptome analysis confirmed selectivity of XBP1s and ATF6f/XBP1s induction. Figure 2—figure supplement 2. Comparison of HEKATF6f/XBP1s RNA-Seq characterization to previous whole-genome array characterization. Figure 2—figure supplement 3. Methods to induce XBP1s and ATF6f/XBP1s did not cause cytotoxicity and were functional during influenza infection. Figure 2—source data 1. Complete RNAseq differential expression analysis. Figure 2—source data 2. Comparison of HEKATF6f/XBP1s characterization to previous characterization. Figure 2—source data 3. Fold-change of HSR and UPR targets during influenza infection.
-
Figure 2—source data 1
Complete RNAseq differential expression analysis.
- https://doi.org/10.7554/eLife.38795.007
-
Figure 2—source data 2
Comparison of HEKATF6f/XBP1s characterization to previous characterization.
Genes are tabulated as upregulated in the current study (RNAseq), the previous study (Array) alone (Shoulders et al., 2013), or upregulated in both studies, as illustrated in Figure 2—figure supplement 2. For each gene subset, the corresponding GO group enrichment analysis is provided.
- https://doi.org/10.7554/eLife.38795.008
-
Figure 2—source data 3
Fold change of HSR and UPR targets during influenza infection.
- https://doi.org/10.7554/eLife.38795.009
Figure 2—figure supplement 1
Full transcriptome analysis confirmed selectivity of XBP1s and ATF6f/XBP1s induction.
Volcano plots show change in transcript expression upon activating XBP1s alone or with ATF6f at 37 (A–B) and 39˚C (C–D) in HEK293ATF6f/XBP1s cells. (E) Change in transcript expression upon increasing temperature in basal cells. In (A–E), transcripts displaying >2 fold change in expression with p-values<0.00001 are plotted in red, with select outliers labeled. Figure 2—source data 1. Complete RNAseq differential expression analysis.
Figure 2—figure supplement 2
Comparison of HEKATF6f/XBP1s RNA-Seq characterization to previous whole-genome array characterization.
Number of upregulated genes in current study represented in red (as determined by RNA-Seq following 24 hr treatment with 0.1 μg/mL doxycycline and 1 μM trimethoprim in low serum media); number of upregulated genes observed in previous study represented in blue (as determined by whole-genome array following 12 hr treatment with 1 μg/mL doxycycline and 10 μM trimethoprim in complete media [Shoulders et al., 2013]). For this comparison, genes were considered upregulated if they increased in expression by more than 2-fold, using a FDR of 0.05. This filtering is more stringent than that reported in Shoulders et al (Shoulders et al., 2013), but was necessary to compare data generated from RNA-Seq and a whole genome array. Figure 2—source data 2. Comparison of HEKATF6f/XBP1s characterization to previous characterization.
Figure 2—figure supplement 3
Methods to induce XBP1s and ATF6f/XBP1s are not cytotoxic and are functional during influenza infection.
(A) Induction of XBP1s or ATF6f/XBP1s and increased temperature (72 hr) does not alter metabolic activity in the absence of influenza, as measured by a resazurin assay. (B) Wild-type WSN/1933 influenza titers (determined by TCID50 assay) from infections in modulated cellular environments (MOI = 0.01; 48 hr post-infection). For A–B, the average of biological triplicates is plotted with error bars representing the SEM. (C) Fold change of heat shock response (HSR) and unfolded protein response (UPR) gene transcripts in modulated ER proteostasis environments with and without influenza (MOI = 1, 8 hr post-infection), relative to a mock-infected basal environment at 37˚C. UPR gene transcripts are designated as ATF6f or XBP1s targets based on prior studies (Shoulders et al., 2013). Positive controls for activating the UPR (treatment with the N-glycosylation inhibitor tunicamycin) and the heat shock response (HSR) (treatment with arsenite to induce oxidative stress) are shown. Figure 2—source data 3. Fold-change of HSR and UPR targets during influenza infection.
Figure 3
Deep mutational scanning of HA in modulated ER proteostasis environments.
(A) Scheme for performing deep mutational scanning, and (B) quantifying the differential selection (diffsel) for each mutant in the selection environments, which can be visualized on sequence logo plots. In A, XBP1s or ATF6f/XBP1s were induced at either 37˚C or 39˚C for 16 hr prior to the selection, which consisted of a 48 hr infection. In B, fWT and fmut denote the wild-type and mutant frequencies, respectively. (C) Percentage of amino acid space sampled by each replicate library prior to filtering, and the percentage sampled by all three replicate mutant libraries. Figure 3—source data 1. Correlation coefficients for unfiltered absolute site differential selection values between biological replicate selections.
-
Figure 3—source data 1
Correlation coefficients for unfiltered absolute site differential selection values between biological replicate selections.
N = 565.
- https://doi.org/10.7554/eLife.38795.011
Figure 4 with 5 supplements
HA variants were depleted at increased temperature but enriched upon XBP1s or ATF6f/XBP1s induction.
Cropped sequence logo plots show differential selection on HA at positions where variants were depleted upon increased temperature but enriched upon XBP1s and ATF6f/XBP1s induction (based on sequential numbering of WSN HA). Size of amino acid abbreviation corresponds to magnitude of selection. Only variants behaving consistently across biological triplicates are plotted; all selections are plotted on the same scale. Figure 4—figure supplement 1. Full WSN HA sequence logo plot: Basal 39˚C vs. Basal 37˚C. Figure 4—figure supplement 2. Full WSN HA sequence logo plot: XBP1s 37˚C vs. Basal 37˚C. Figure 4—figure supplement 3. Full WSN HA sequence logo plot: XBP1s 39˚C vs. Basal 39˚C. Figure 4—figure supplement 4. Full WSN HA sequence logo plot: ATF6f/XBP1s 37˚C vs. Basal 37˚C. Figure 4—figure supplement 5. Full WSN HA sequence logo plot: ATF6f/XBP1s 39˚C vs. Basal 39˚C. Source data 1. Complete analysis of deep mutational scanning data.
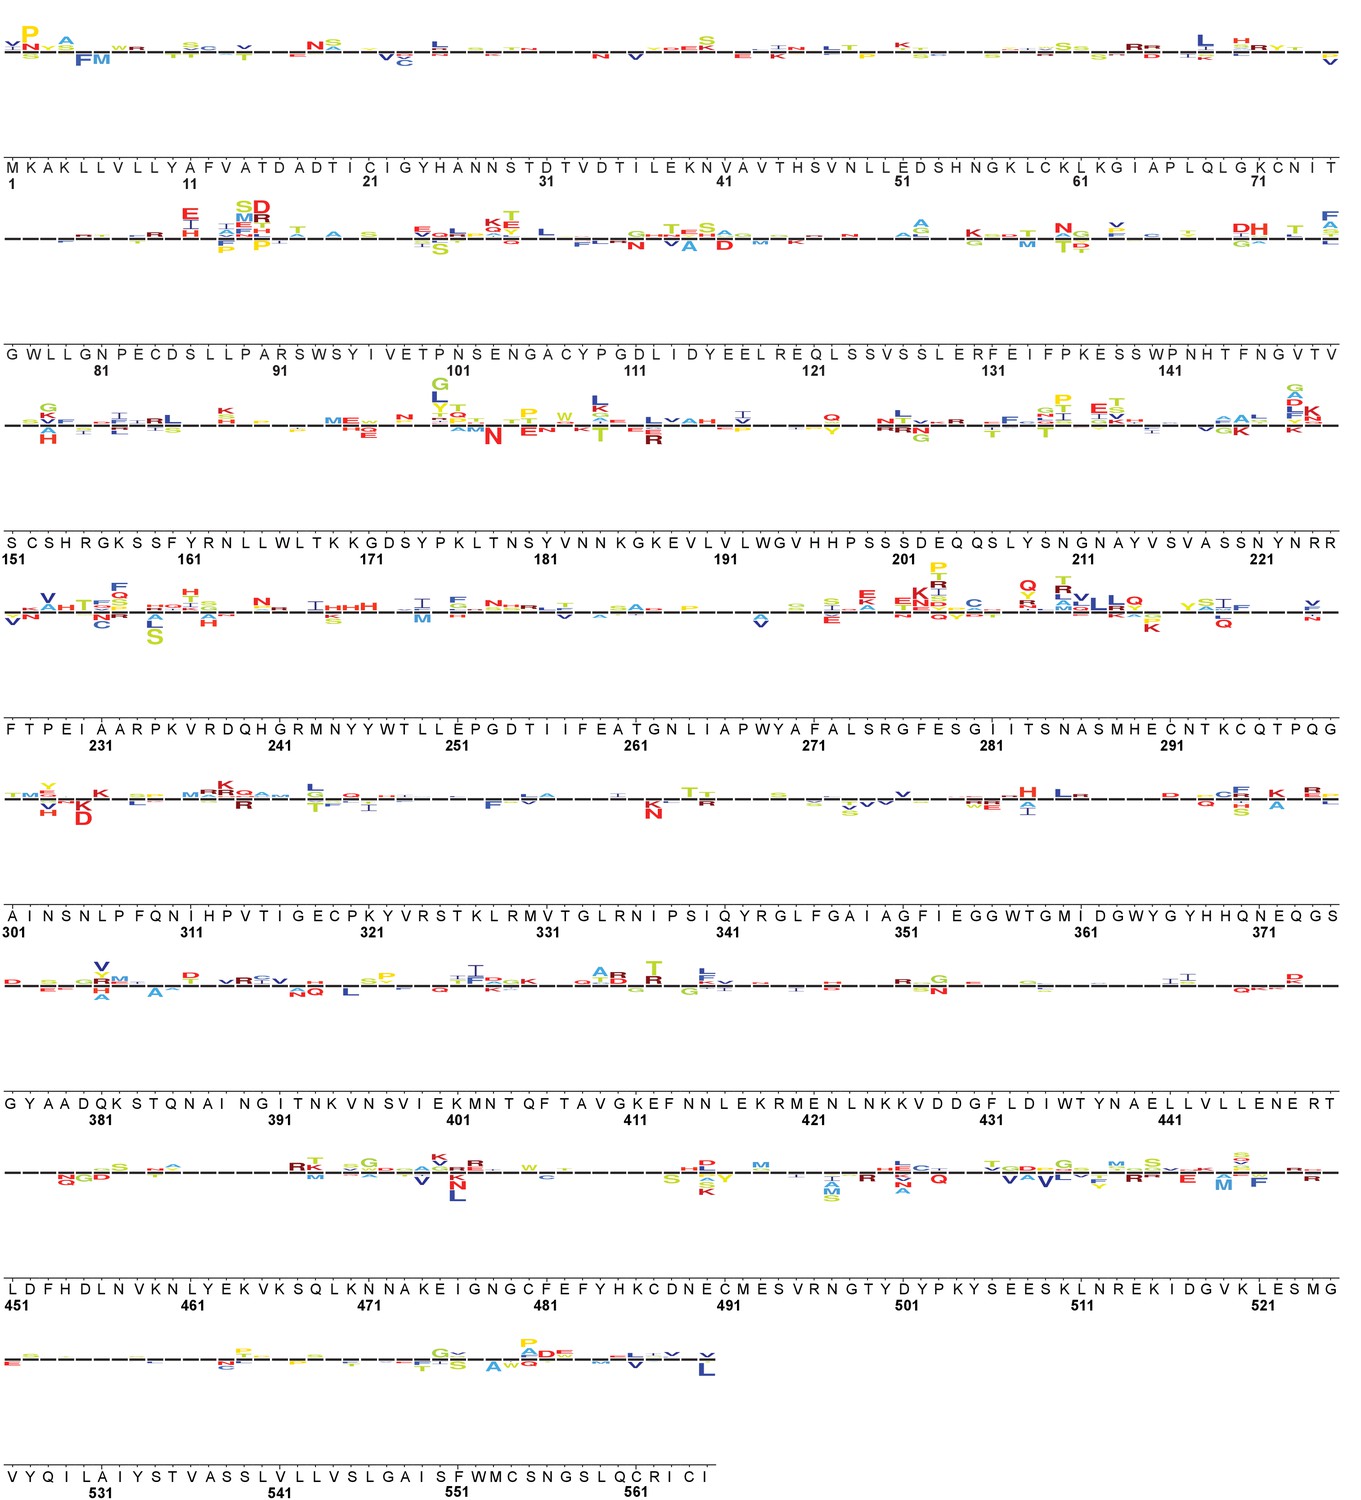
Figure 4—figure supplement 1
Full WSN HA sequence logo plot: Basal 39˚C vs. Basal 37˚C.
Logo plot displays variants that behaved consistently across three biological replicates. Variants above the line (representative of selection on wild-type) were enriched at 39˚C relative to 37˚C in a basal environment; variants below the line were depleted at 39˚C. The wild-type WSN HA residue is shown below the corresponding logo, with the sites numbered below the wild-type sequence (based on sequential numbering of WSN HA). The size of the amino acid letter abbreviation is proportional to the diffsel for that amino acid variant, and all logo plots are plotted on the same scale.
Figure 4—figure supplement 2
Full WSN HA sequence logo plot: XBP1s 37˚C vs. Basal 37˚C.
Logo plot displays variants that behaved consistently across three biological replicates. Variants above the line (representative of selection on wild-type) were enriched upon XBP1s induction at 37˚C; variants below the line were depleted. The wild-type WSN HA residue is shown below the corresponding logo, with the sites numbered below the wild-type sequence (based on sequential numbering of WSN HA). The size of the amino acid letter abbreviation is proportional to the diffsel for that amino acid variant, and all logo plots are plotted on the same scale.
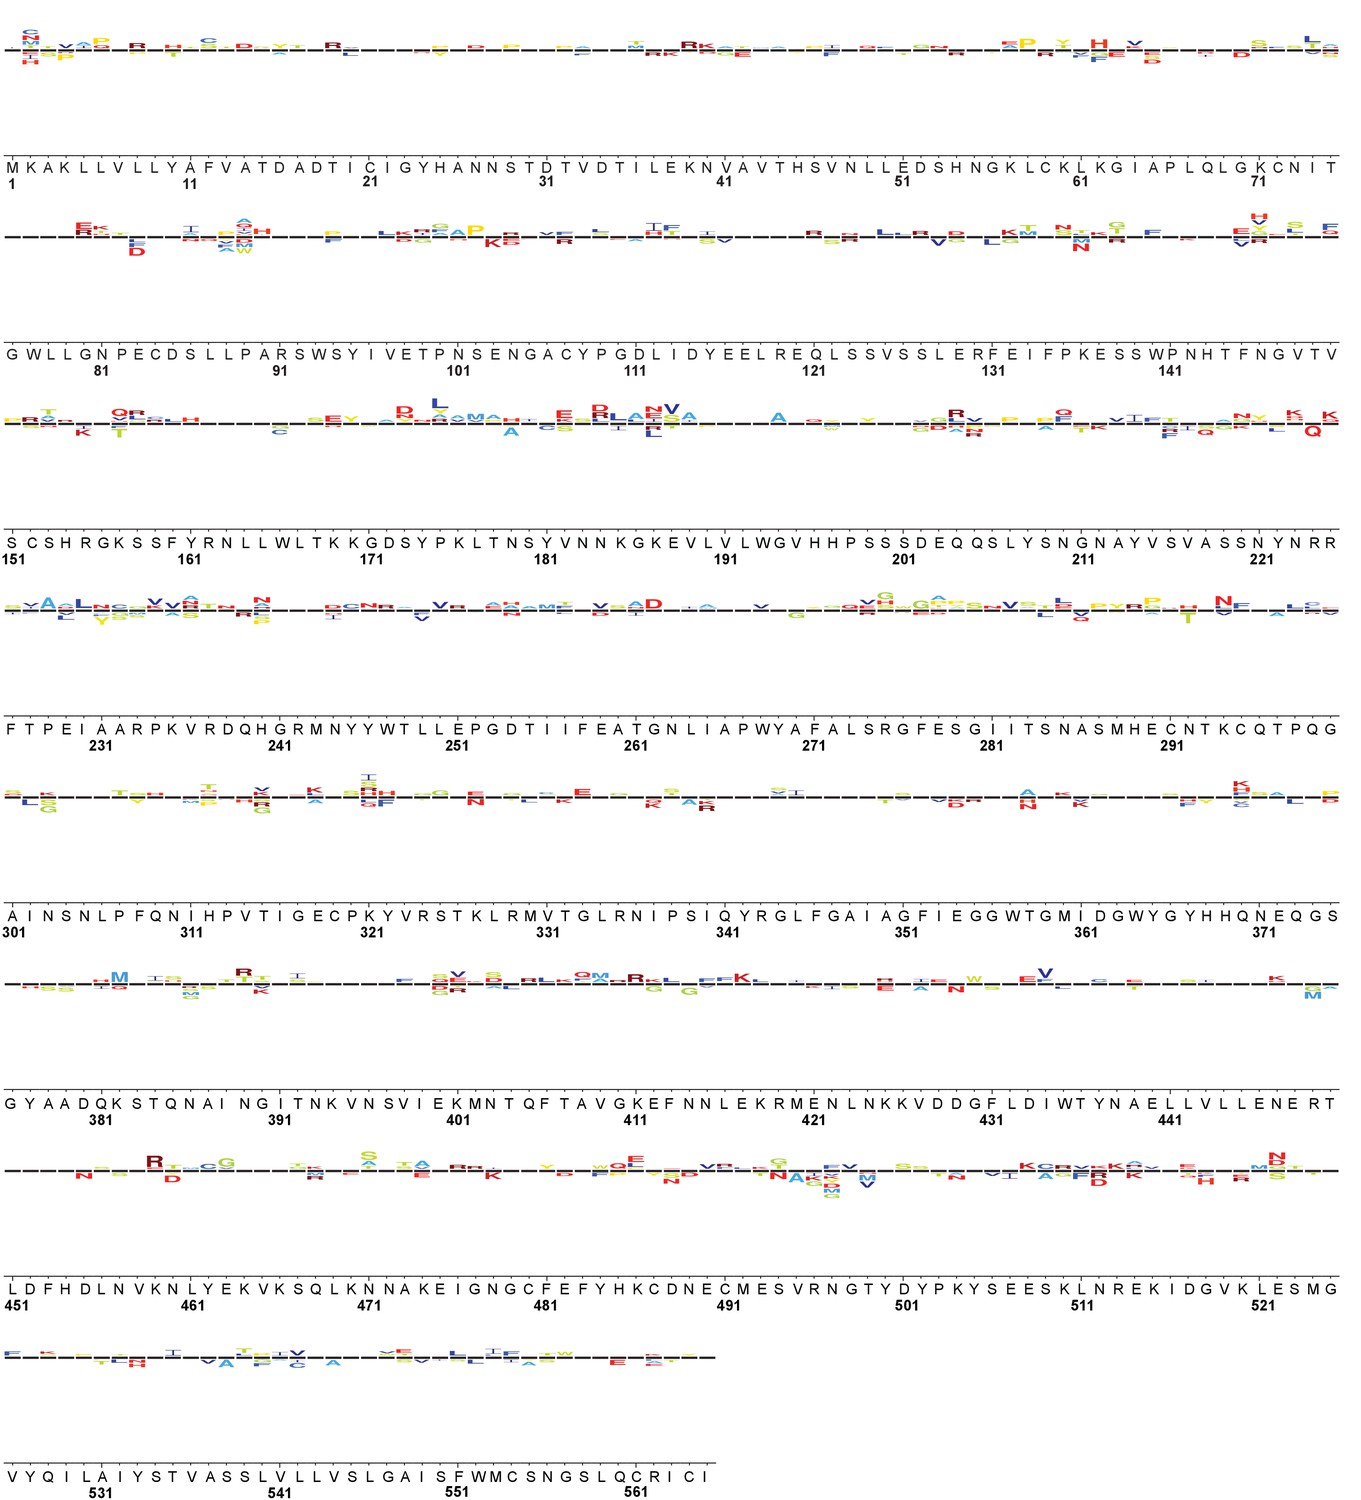
Figure 4—figure supplement 3
Full WSN HA sequence logo plot: XBP1s 39˚C vs. Basal 39˚C.
Logo plot displays variants that behaved consistently across three biological replicates. Variants above the line (representative of selection on wild-type) were enriched upon XBP1s induction at 39˚C; variants below the line were depleted. The wild-type WSN HA residue is shown below the corresponding logo, with the sites numbered below the wild-type sequence (based on sequential numbering of WSN HA). The size of the amino acid letter abbreviation is proportional to the diffsel for that amino acid variant, and all logo plots are plotted on the same scale.
Figure 4—figure supplement 4
Full WSN HA sequence logo plot: ATF6f/XBP1s 37˚C vs. Basal 37˚C.
Logo plot displays variants that behaved consistently across three biological replicates. Variants above the line (representative of selection on wild-type) were enriched upon ATF6f/XBP1s induction at 37˚C; variants below the line were depleted. The wild-type WSN HA residue is shown below the corresponding logo, with the sites numbered below the wild-type sequence (based on sequential numbering of WSN HA). The size of the amino acid letter abbreviation is proportional to the diffsel for that amino acid variant, and all logo plots are plotted on the same scale.
Figure 4—figure supplement 5

Full WSN HA sequence logo plot: ATF6f/XBP1s 39˚C vs. Basal 39˚C.
Logo plot displays variants that behaved consistently across three biological replicates. Variants above the line (representative of selection on wild-type) were enriched upon ATF6f/XBP1s induction at 39˚C; variants below the line were depleted. The wild-type WSN HA residue is shown below the corresponding logo, with the sites numbered below the wild-type sequence (based on sequential numbering of WSN HA). The size of the amino acid letter abbreviation is proportional to the diffsel for that amino acid variant, and all logo plots are plotted on the same scale.
Figure 5 with 1 supplement

ER proteostasis mechanisms and temperature divergently impact HA variant viral growth.
(A) Average differential selection (diffsel) for each HA variant; the black line designates the mean of the distribution. Significance of deviation of the mean from zero (no differential selection) was tested by a one-sample t-test; *** designates two-tailed p-values≤0.001. Variant diffsel values are staggered about the x-axis to minimize overlap. The number of variants with diffsel >0 and <0 is listed below each distribution. (B) Correlation for diffsel values for inducing XBP1s at 39˚C versus increasing the temperature in basal cells (N = 271). (C) Correlation for diffsel values for inducing ATF6f/XBP1s at 39˚C versus increasing the temperature in basal cells (N = 320). For (A–C), average diffsel values for variants behaving consistently across biological triplicates are plotted. For (B–C), Pearson correlation and p-value from an F-test are shown. Figure 5—figure supplement 1. Induction of ATF6f/XBP1s and XBP1s similarly impact HA variant viral growth. Figure 5—source data 1. Differential selection values for each selection, pre- and post-filtering.
-
Figure 5—source data 1
Differential selection values for each selection, pre- and post-filtering.
- https://doi.org/10.7554/eLife.38795.020
Figure 5—figure supplement 1
Induction of ATF6f/XBP1s and XBP1s similarly impact HA variant viral growth.
Correlation for diffsel values for inducing XBP1s at 39˚C versus inducing ATF6f/XBP1s at 39˚C (N = 261). Average diffsel values for variants behaving consistently across biological triplicates are plotted; Pearson correlation and p-value from an F-test are shown.
Figure 6 with 1 supplement
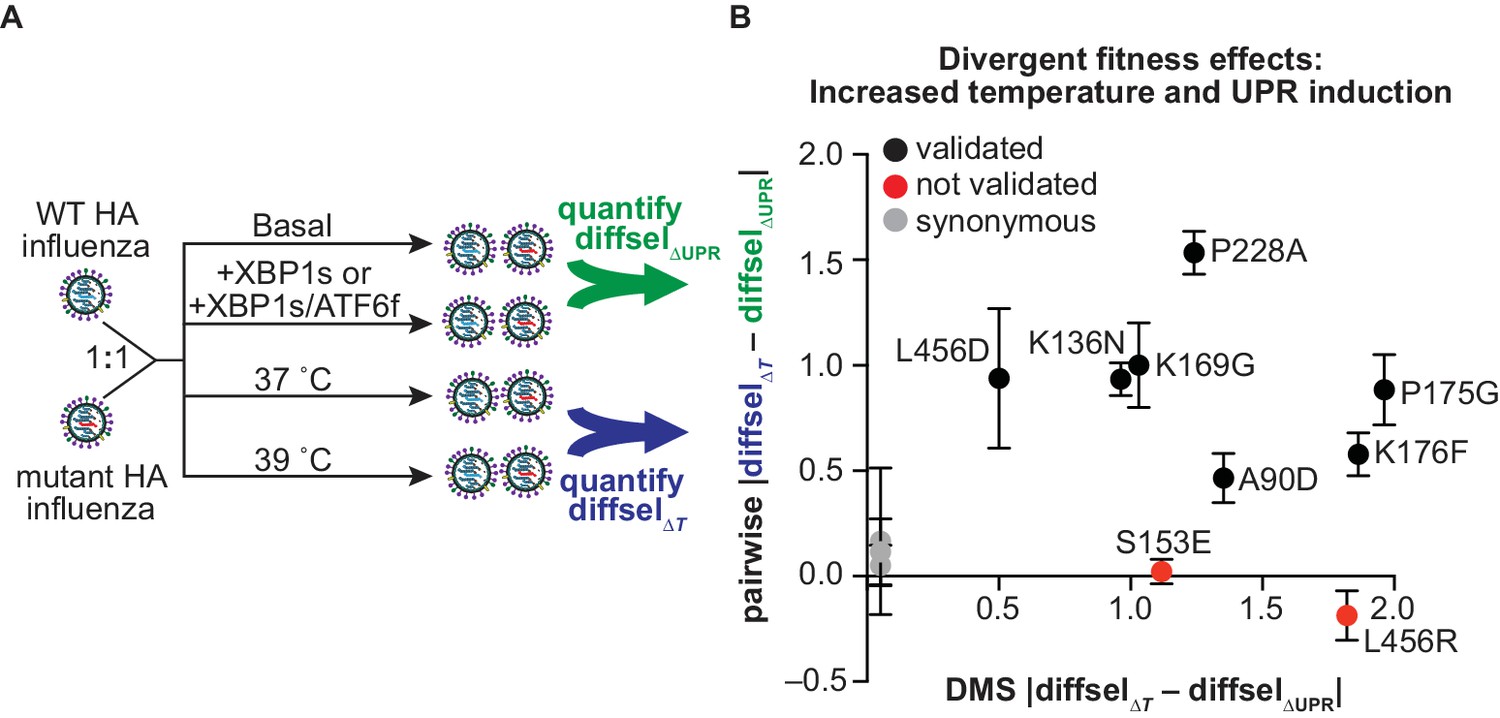
Divergent fitness effects revealed by DMS assessed by pairwise competitions.
(A) Scheme for pairwise competition between wild-type HA and mutant HA influenza. Detailed description of competition conditions in Figure 6—figure supplement 1. (B) The difference between the average diffsel upon increased temperature (ΔT) and the average diffsel upon induction of XBP1s or ATF6f/XBP1s (ΔUPR) is plotted. This difference from the pairwise competitions is plotted on the y-axis, with error bars representing SEM for biological triplicates, and the corresponding difference from the DMS is plotted on the x-axis. Variants that validated (i.e., diffsel upon increased temperature was significantly different from that upon UPR induction in both DMS and pairwise competitions) are in black; variants that did not validate are in red; synonymous (neutral) validated negative controls are in gray. All non-synonymous variants are labeled. Figure 6—figure supplement 1. Individual pairwise competition diffsel values.
Figure 6—figure supplement 1
Individual pairwise competition diffsel values.
(A) Diffsel of validated variants in pairwise competition with wild-type influenza upon induction of XBP1s or ATF6f/XBP1s and increased temperature. Variants were considered ‘validated’ if the diffsel upon induction of XBP1s or ATF6f/XBP1s was significantly different from that upon increased temperature. (B) Diffsel of non-validated variants in pairwise competition. (C) Diffsel of synonymous mutants in pairwise competition. For (A–C), the average of biological triplicates is plotted with error bars corresponding to SEM. Asterisks comparing selection conditions represent significance evaluated by Student’s t-test, while asterisks comparing an individual selection condition to no selection (diffsel of zero) represent significance evaluated by a one-sample t-test. For all significance tests, *, **, and *** represent two-tailed p-values≤0.05, 0.01, and 0.001, respectively; ‘ns’ corresponds to a p-value>0.05. Induction of UPR conditions in green corresponds to ΔUPR in Figure 6; increased temperature conditions in blue correspond to ΔT in Figure 6.
Figure 7 with 1 supplement
XBP1s induction and temperature impacted HA mutational tolerance at sites across HA with diverse functional and structural roles.
(A) Average net site diffsel (sum of mutation diffsel values at a given site) is plotted for increased temperature in a basal environment (blue) and upon induction of XBP1s at 39˚C (purple). Sites are sorted by secondary structure, functional/structural role, conservation in H1 sequences, and surface accessibility (buried residues are the 50% least surface-accessible sites). Select outliers are labeled. Means are represented by black lines and significance of deviation from zero (no selection) was determined by a one-sample t-test and is indicated above each distribution; *, **, and *** represent one-tailed p-values≤0.05, 0.01, and 0.001, respectively; ns corresponds to a p-value>0.05. (B) Average net site diffsel is plotted as a function of site conservation, where x = 0 corresponds to a completely conserved site among 989 non-redundant human H1 sequences (1918–2008) (Zhang et al., 2017). (C) Average net site diffsel is plotted as a function of site surface accessibility, where x = 0 corresponds to a buried residue (PDBID 1RVX [Gamblin et al., 2004]). Figure 7—figure supplement 1. ATF6f/XBP1s induction and temperature impacted HA mutational tolerance at sites across HA with diverse functional and structural roles. Figure 7—source data 1. Properties and differential selection for each site of HA.
-
Figure 7—source data 1
Properties and differential selection for each site of HA.
- https://doi.org/10.7554/eLife.38795.025
Figure 7—figure supplement 1
ATF6f/XBP1s induction and temperature impacted HA mutational tolerance at sites across HA with diverse functional and structural roles.
(A) Average net site diffsel (sum of mutation diffsel values at a given site) is plotted for increased temperature in a basal environment (blue) and upon induction of XBP1s at 39˚C (pink). Sites are sorted by secondary structure, functional/structural role, conservation in H1 sequences, and surface accessibility (buried residues are the 50% least surface-accessible sites). Select outliers are labeled. Means are represented by black lines and significance of deviation from zero (no selection) was determined by a one-sample t-test and is indicated above each distribution; *, **, and *** represent one-tailed p-values≤0.05, 0.01, and 0.001, respectively; ns corresponds to a p-value>0.05. (B) Average net site diffsel is plotted as a function of site conservation, where x = 0 corresponds to a completely conserved site among 989 non-redundant human H1 sequences (1918–2008) (Zhang et al., 2017). (C) Average net site diffsel is plotted as a function of site surface accessibility, where x = 0 corresponds to a buried residue (PDBID 1RVX [Gamblin et al., 2004]). Figure 7—source data 1. Properties and differential selection for each site of HA.
Figure 8 with 1 supplement

Mutational tolerance at sites across the mature HA protein was impacted by XBP1s induction and increased temperature.
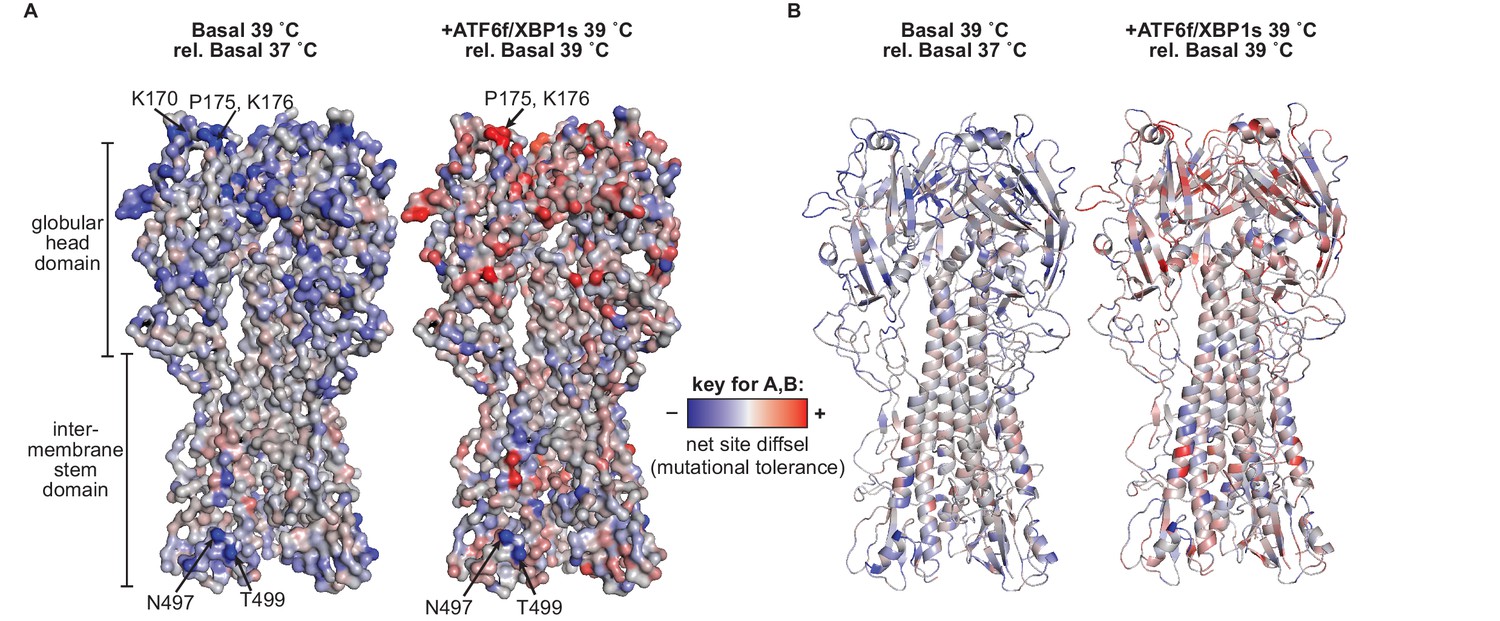
(A) Average net site diffsel values (which correspond to mutational tolerance) are mapped onto the HA crystal structure PDBID 1RVX (Gamblin et al., 2004), with select outliers from Figure 7 labeled. (B) Cartoon representation of A displaying secondary structural elements. In A–B, negative net site diffsel values are mapped in blue; positive net site diffsel values are mapped in red. Figure 8—figure supplement 1. Mutational tolerance at sites across the mature HA protein was impacted by ATF6f/XBP1s induction and increased temperature.
Figure 8—figure supplement 1
Mutational tolerance at sites across the mature HA protein was impacted by ATF6f/XBP1s induction and increased temperature.
(A) Average net site diffsel values (which correspond to mutational tolerance) are mapped onto the HA crystal structure PDBID 1RVX (Gamblin et al., 2004), with select outliers from Figure 7—figure supplement 1 labeled. (B) Cartoon representation of A displaying secondary structural elements. In A–B, negative net site diffsel values are mapped in blue; positive net site diffsel values are mapped in red.
Tables
Key resources table
| Reagent type (species) or resource | Designation | Source or reference | Additional information |
|---|---|---|---|
| strain, strain background (Influenza A virus) | Influenza A/WSN/1933 | PMID 27271655 | |
| genetic reagent (Influenza A virus) | Influenza A/WSN/1933 Mutant Library 1 | PMID 27271655 | |
| genetic reagent (Influenza A virus) | Influenza A/WSN/1933 Mutant Library 2 | PMID 27271655 | |
| genetic reagent (Influenza A virus) | Influenza A/WSN/1933 Mutant Library 3 | PMID 27271655 | |
| cell line (Homo sapiens) | HEK293ATF6f/XBP1s | PMID 23583182 | |
| recombinant DNA reagent | pHW181-PB2 | PMID 10801978 | plasmid |
| recombinant DNA reagent | pHW182-PB1 | PMID 10801978 | plasmid |
| recombinant DNA reagent | pHW183-PA | PMID 10801978 | plasmid |
| recombinant DNA reagent | pHW184-HA | PMID 10801978 | plasmid |
| recombinant DNA reagent | pHW185-NP | PMID 10801978 | plasmid |
| recombinant DNA reagent | pHW186-NA | PMID 10801978 | plasmid |
| recombinant DNA reagent | pHW187-M | PMID 10801978 | plasmid |
| recombinant DNA reagent | pHW188-NS1 | PMID 10801978 | plasmid |
| software, algorithm | dms_tools | PMID 25990960 |
Additional files
-
Source data 1
Complete analysis of deep mutational scanning data.
- https://doi.org/10.7554/eLife.38795.028
-
Supplementary file 1
Primer sequences for qPCR and HA sequencing.
- https://doi.org/10.7554/eLife.38795.029
-
Transparent reporting form
- https://doi.org/10.7554/eLife.38795.030
Download links
A two-part list of links to download the article, or parts of the article, in various formats.
Downloads (link to download the article as PDF)
Open citations (links to open the citations from this article in various online reference manager services)
Cite this article (links to download the citations from this article in formats compatible with various reference manager tools)
Enhanced ER proteostasis and temperature differentially impact the mutational tolerance of influenza hemagglutinin
eLife 7:e38795.
https://doi.org/10.7554/eLife.38795


