Rap2 and TNIK control Plexin-dependent tiled synaptic innervation in C. elegans
- The University of British Columbia, Canada
- National Institute for Physiological Sciences, Japan
Figures
Figure 1 with 3 supplements
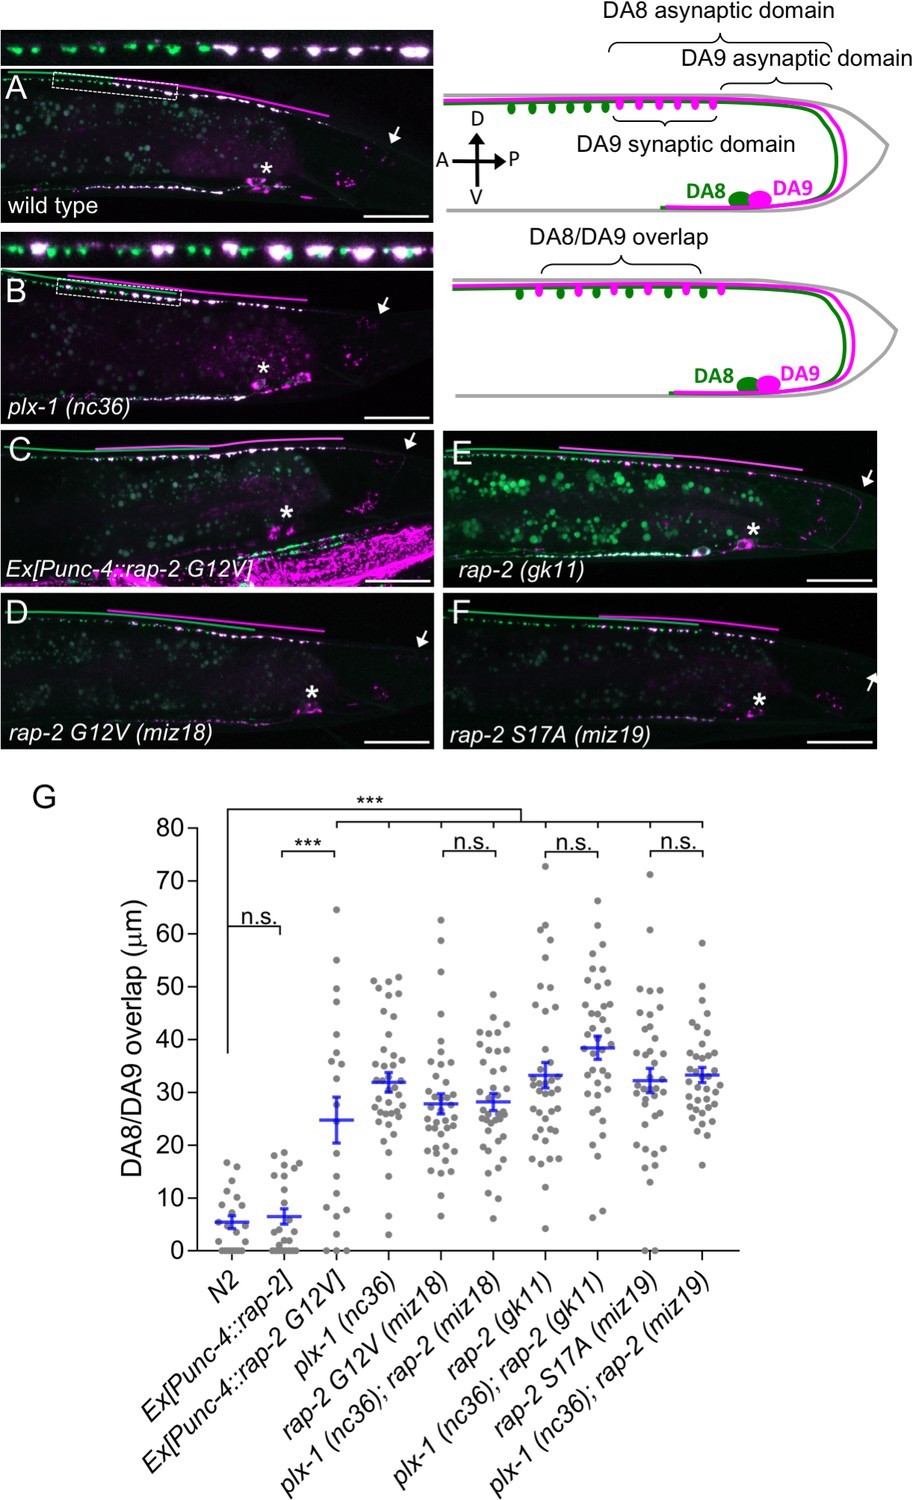
Gain- and loss-of-function rap-2 mutants show synaptic tiling defects.
(A and B) Representative image of synaptic tiling of wild type (A) and plx-1 mutant (B) animals. Images show wyIs446 marker to label synapses in DA8 (GFP::RAB-3) and DA9 (GFP::RAB-3+mCherry::RAB-3). Dotted box represents the magnified images from A and B of the synaptic tiling border. Schematics of DA8 (green) and DA9 (magenta) neurons with parameters for analysis shown on the right. (C–F) Representative images of wyIs446 strains with the following genotypes: rap-2(G12V) overexpression in DA neurons (C), rap-2 G12V (miz18) (D), rap-2 null (gk11) (E) and rap-2 S17A (miz19) (F). Synaptic domains from DA8 and DA9 are highlighted with green and magenta lines, respectively. Asterisks: DA9 cell body. Arrows: dorsal commissure of DA9. Scale bars: 20 μm. (G) Quantification of overlap between DA8 and DA9 synaptic domains. Each dot represents a single animal. Blue bars indicate mean ± SEM. n.s.: not significant; ***p<0.001.
Figure 1—figure supplement 1

rap-1 and rap-3 are not involved in synaptic tiling of DA8 and DA9.
(A–C) Representative images of Prap-1::GFP (wyEx5445) (A), Prap-2::GFP (wyEx5464) (B) and Prap-3::GFP (mizEx194) (C). Merged images with DA markers shown on the right. (D) Representative image of synaptic tiling marker (wyIs446) in rap-1 mutants. (E) Representative image of synaptic tiling marker (wyIs524) in rap-3 mutants. wyIs524 shown given the linkage between wyIs446 and rap-3. Synaptic domains of DA8 and DA9 highlighted with green and magenta lines, respectively. Asterisks: DA9 cell body. Arrows: dorsal commissure of DA9. Scale bars: 20 μm. (F and G) Quantification of DA8/DA9 overlap. Blue bars indicate mean ± SEM. n.s.: not significant; ***p<0.001.
Figure 1—figure supplement 2
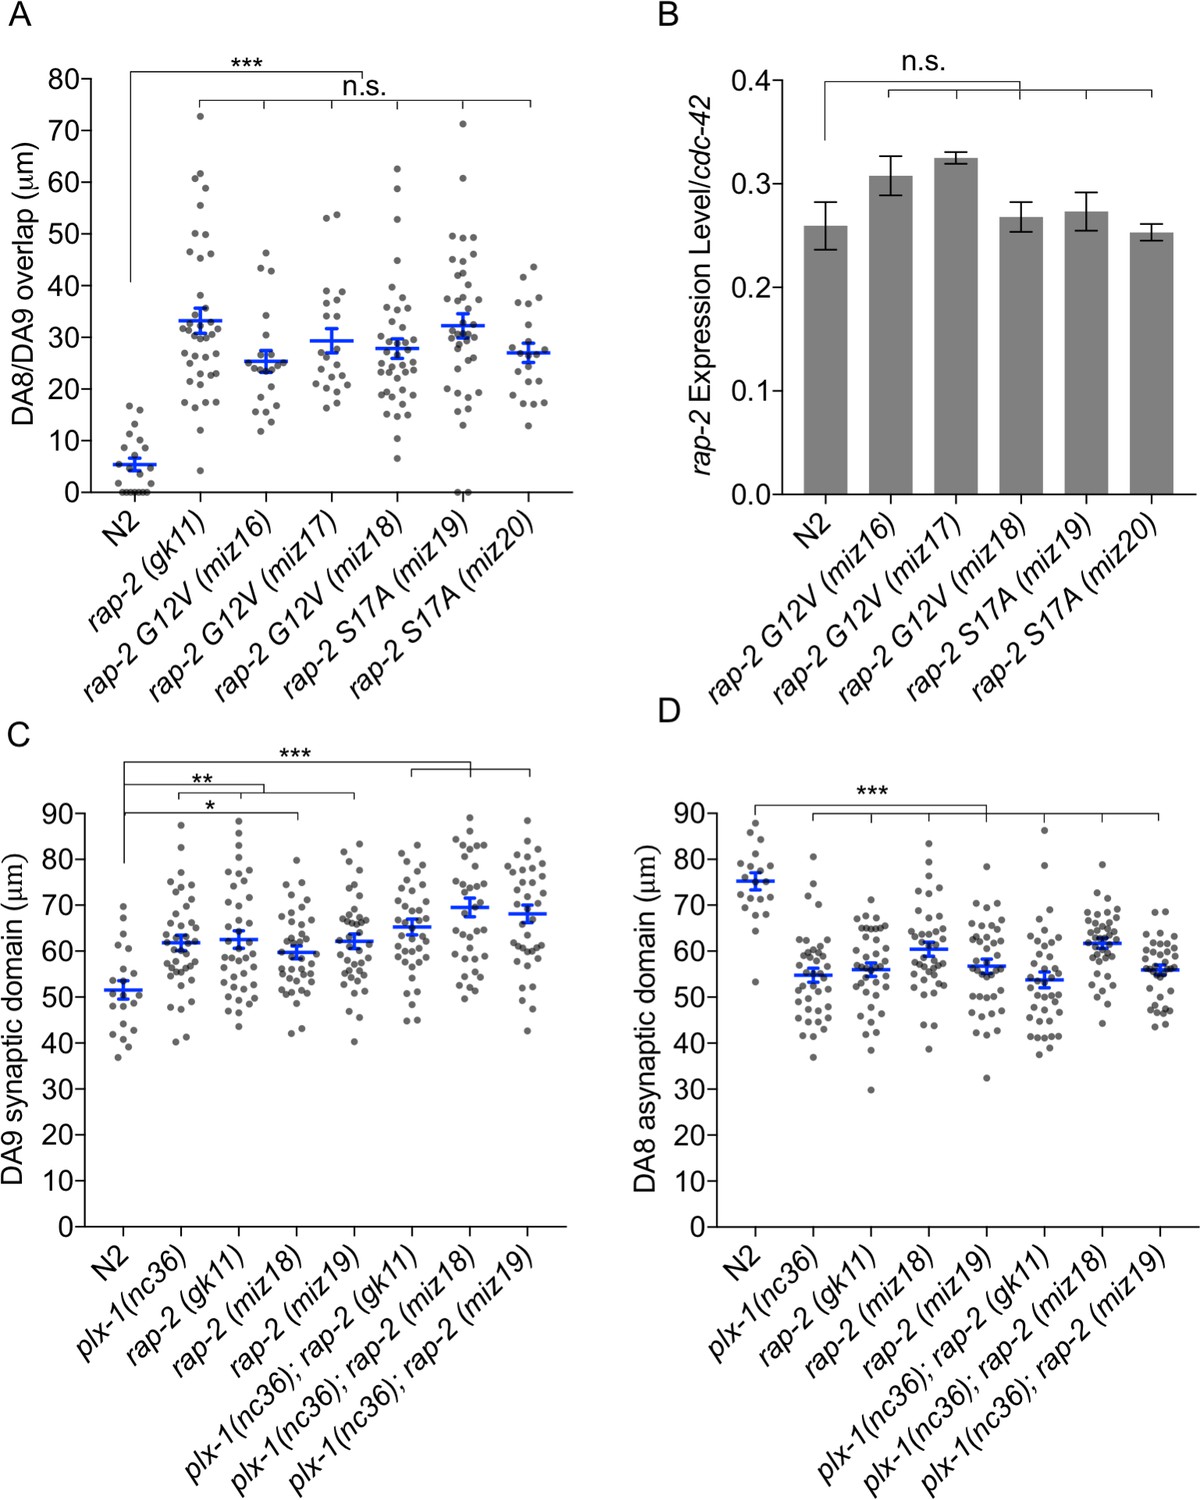
Synaptic tiling requires both GTP- and GDP-bound forms of RAP-2.
(A) Quantification of DA8/DA9 overlap. Blue bars indicate mean ± SEM. n.s.: not significant; **p<0.001. (B) RT-qPCR analysis of rap-2 CRISPR mutants. cdc-42 served as an internal reference. Average of 3 independent qPCR reactions are shown. Bars indicate mean ± SEM. n.s.: not significant. (C) Quantification of DA9 synaptic domain length. (D) Quantification of DA8 asynaptic domain length. Blue bars indicate mean ± SEM. n.s.: not significant; ***p<0.001; **p<0.01, *p<0.05.
Figure 1—figure supplement 3
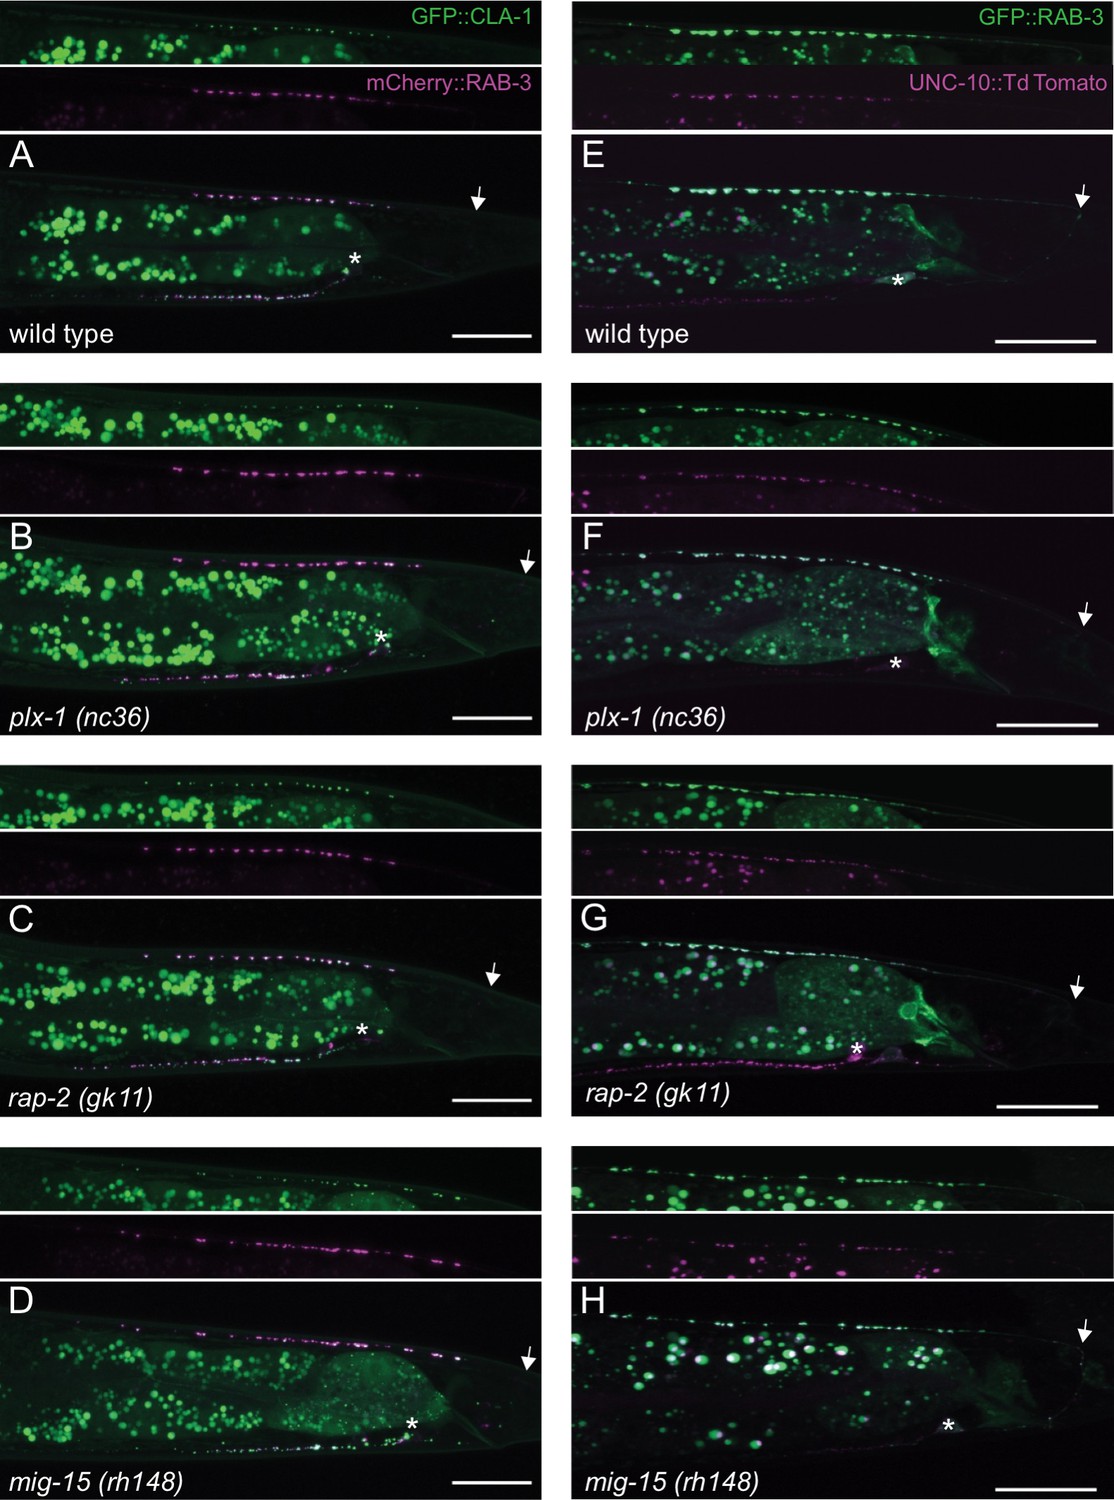
Co-localization between RAB-3 and the active zone markers, CLA-1 and UNC-10.
(A–D) Representative images of DA9 synaptic vesicle marker, mCherry::RAB-3, and active zone marker, CLA-1::3xGFPnovo2 (wyIs685) in wild type (A), plx-1 (B), rap-2 (C) and mig-15 (D). (E–H) Representative images of DA9 synaptic vesicle marker, GFP::RAB-3(wyIs85), and active zone marker, UNC-10::TdTomato (mizEx272) in wild type (E), plx-1 (F), rap-2 (G) and mig-15 (H). Arrows represent the position of DA9 commissure. Asterisks indicate DA9 cell body. Scale bars: 20 μm.
Figure 2
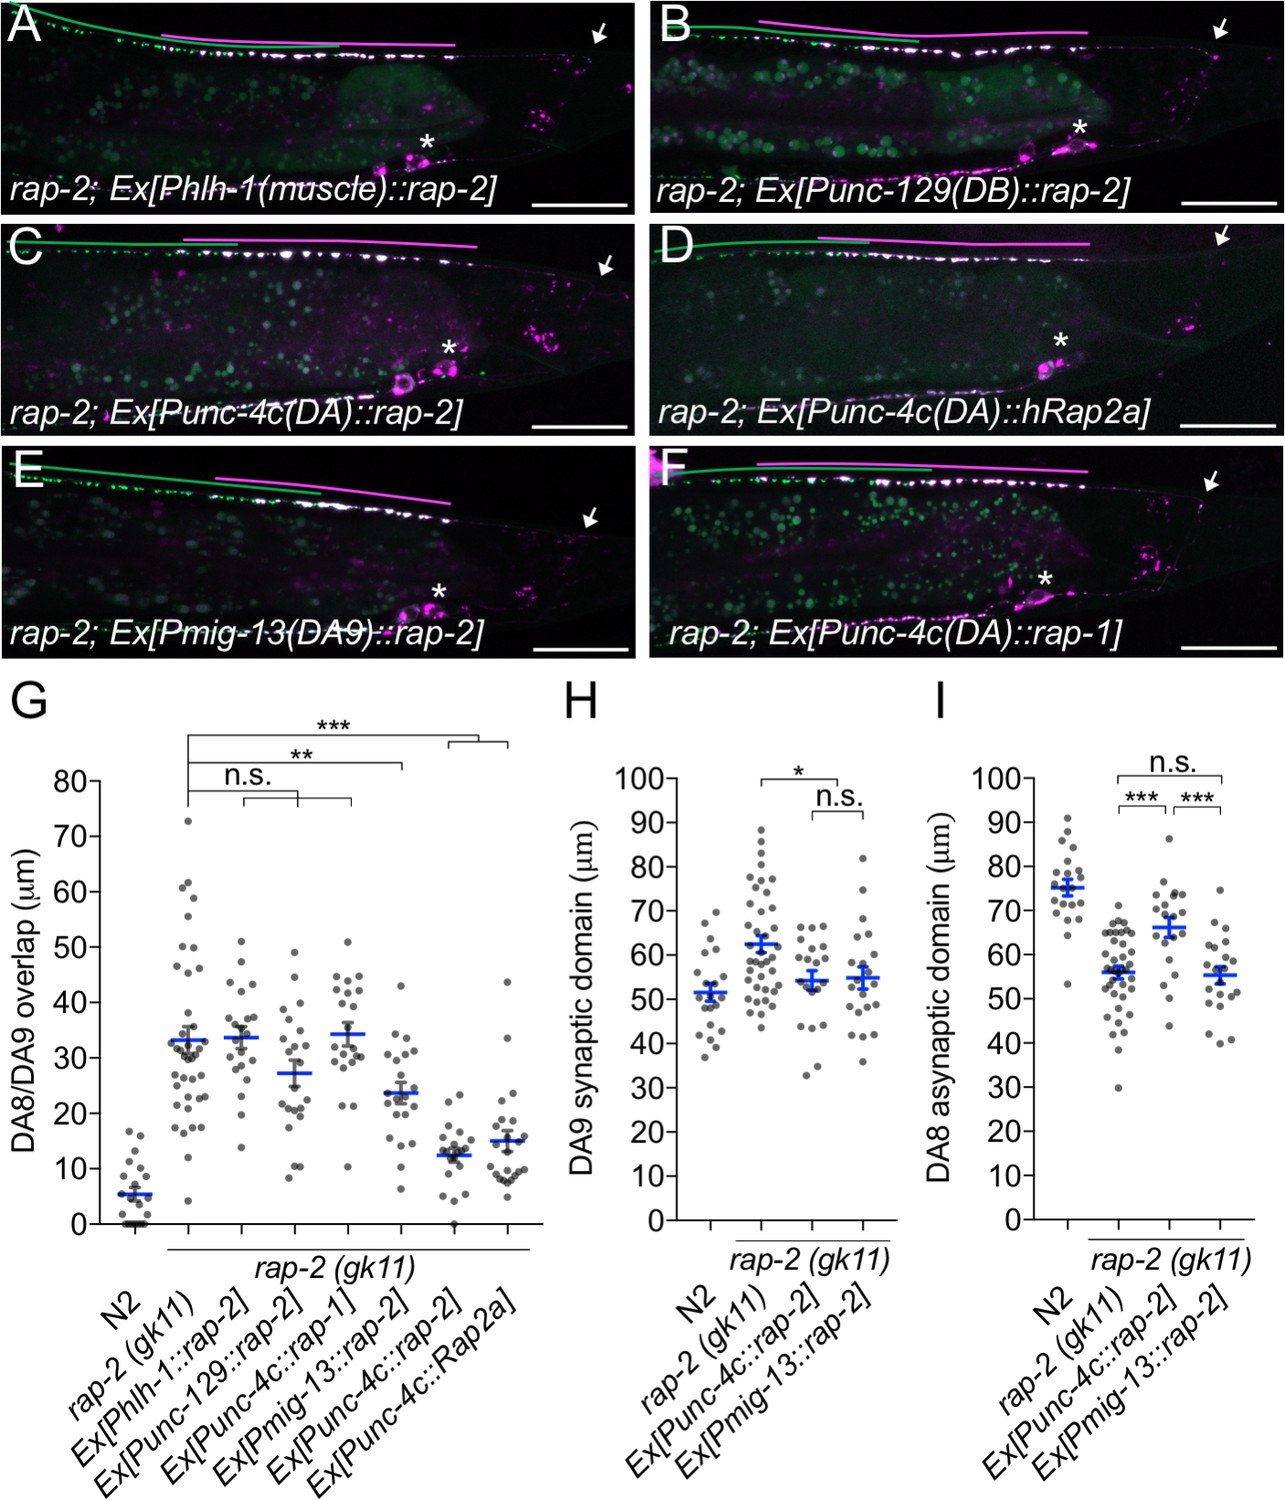
rap-2 functions in DA neurons.
(A–F) Representative images of rap-2; wyIs446 animals expressing Phlh-1::rap-2 (A), Punc-129::rap-2 (B), Punc-4c::rap-2 (C), Punc-4c::Rap2a (human) (D), Pmig-13::rap-2 (E) and Punc-4c;;rap-1 (F). Synaptic domains of DA8 and DA9 are highlighted with green and magenta lines, respectively. Asterisks: DA9 cell body. Arrows: dorsal commissure of DA9. Scale bars: 20 μm. (G–I) Quantification of DA8/DA9 overlap (G), DA9 synaptic domain (H) and DA8 asynaptic domain (I). Each dot represents a single animal. Blue bars indicate mean ± SEM. n.s.: not significant; ***p<0.001; **p<0.01; *p<0.05.
Figure 3
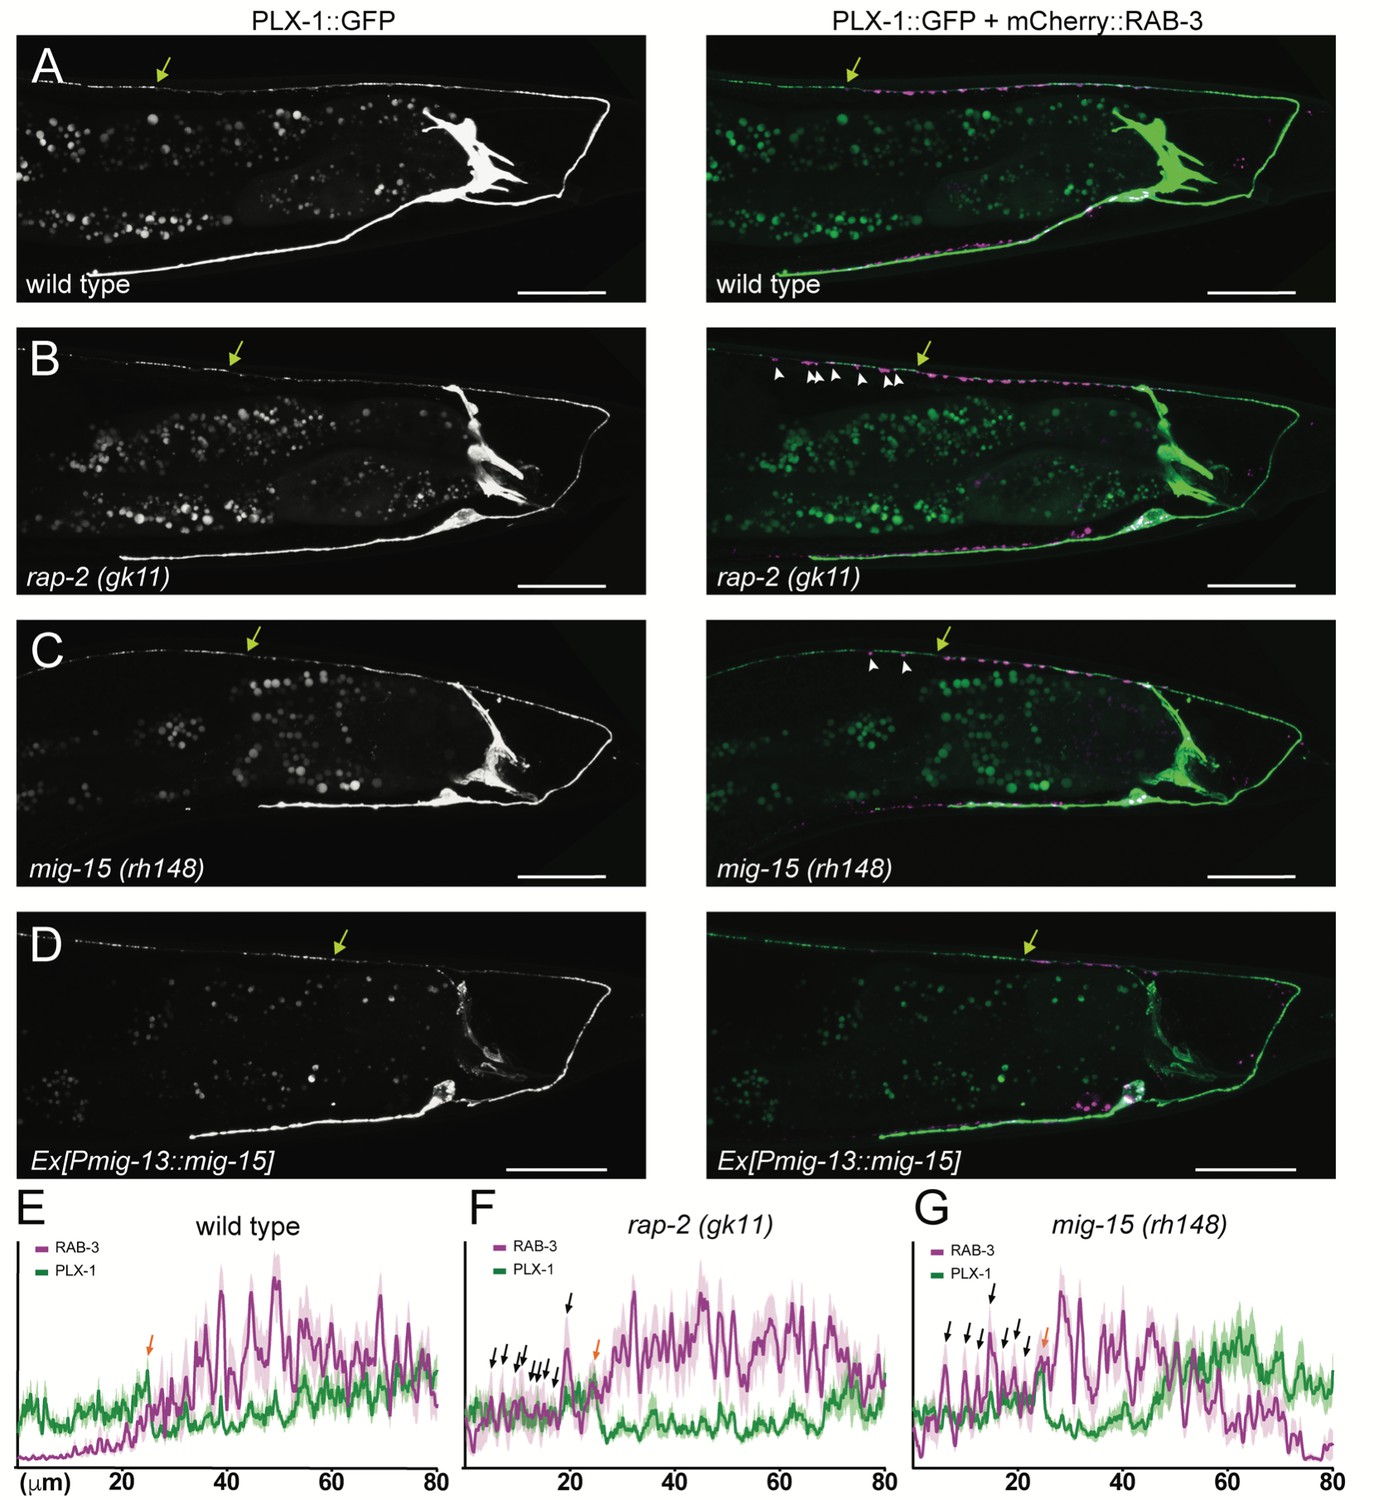
PLX-1::GFP localization is not affected in rap-2 and mig-15 mutants.
(A–D) Representative image of PLX-1::GFP alone (top) and PLX-1::GFP with mCherry::RAB-3 (middle) labeled with wyIs320 in DA9 of wildtype (A), rap-2 (gk11) (B) and mig-15(rh148) (C). Bracket indicates the PLX-1::GFP patch localized at the anterior edge of the DA9 synaptic domain. Arrowheads indicate ectopic synapses formed anterior to the PLX-1::GFP patch. Scale bars: 20 μm. (E–G) Quantification of the normalized mCherry::RAB-3 signal (magenta) and PLX-1::GFP signal (green) in the dorsal axon of DA9 in wildtype (E), rap-2 (gk11) (F) and mig-15(rh148) (G). Animal were aligned according to the PLX-1::GFP patch at the anterior edge of the DA9 synaptic domain (orange arrow). Light colors indicate SEM.
Figure 4
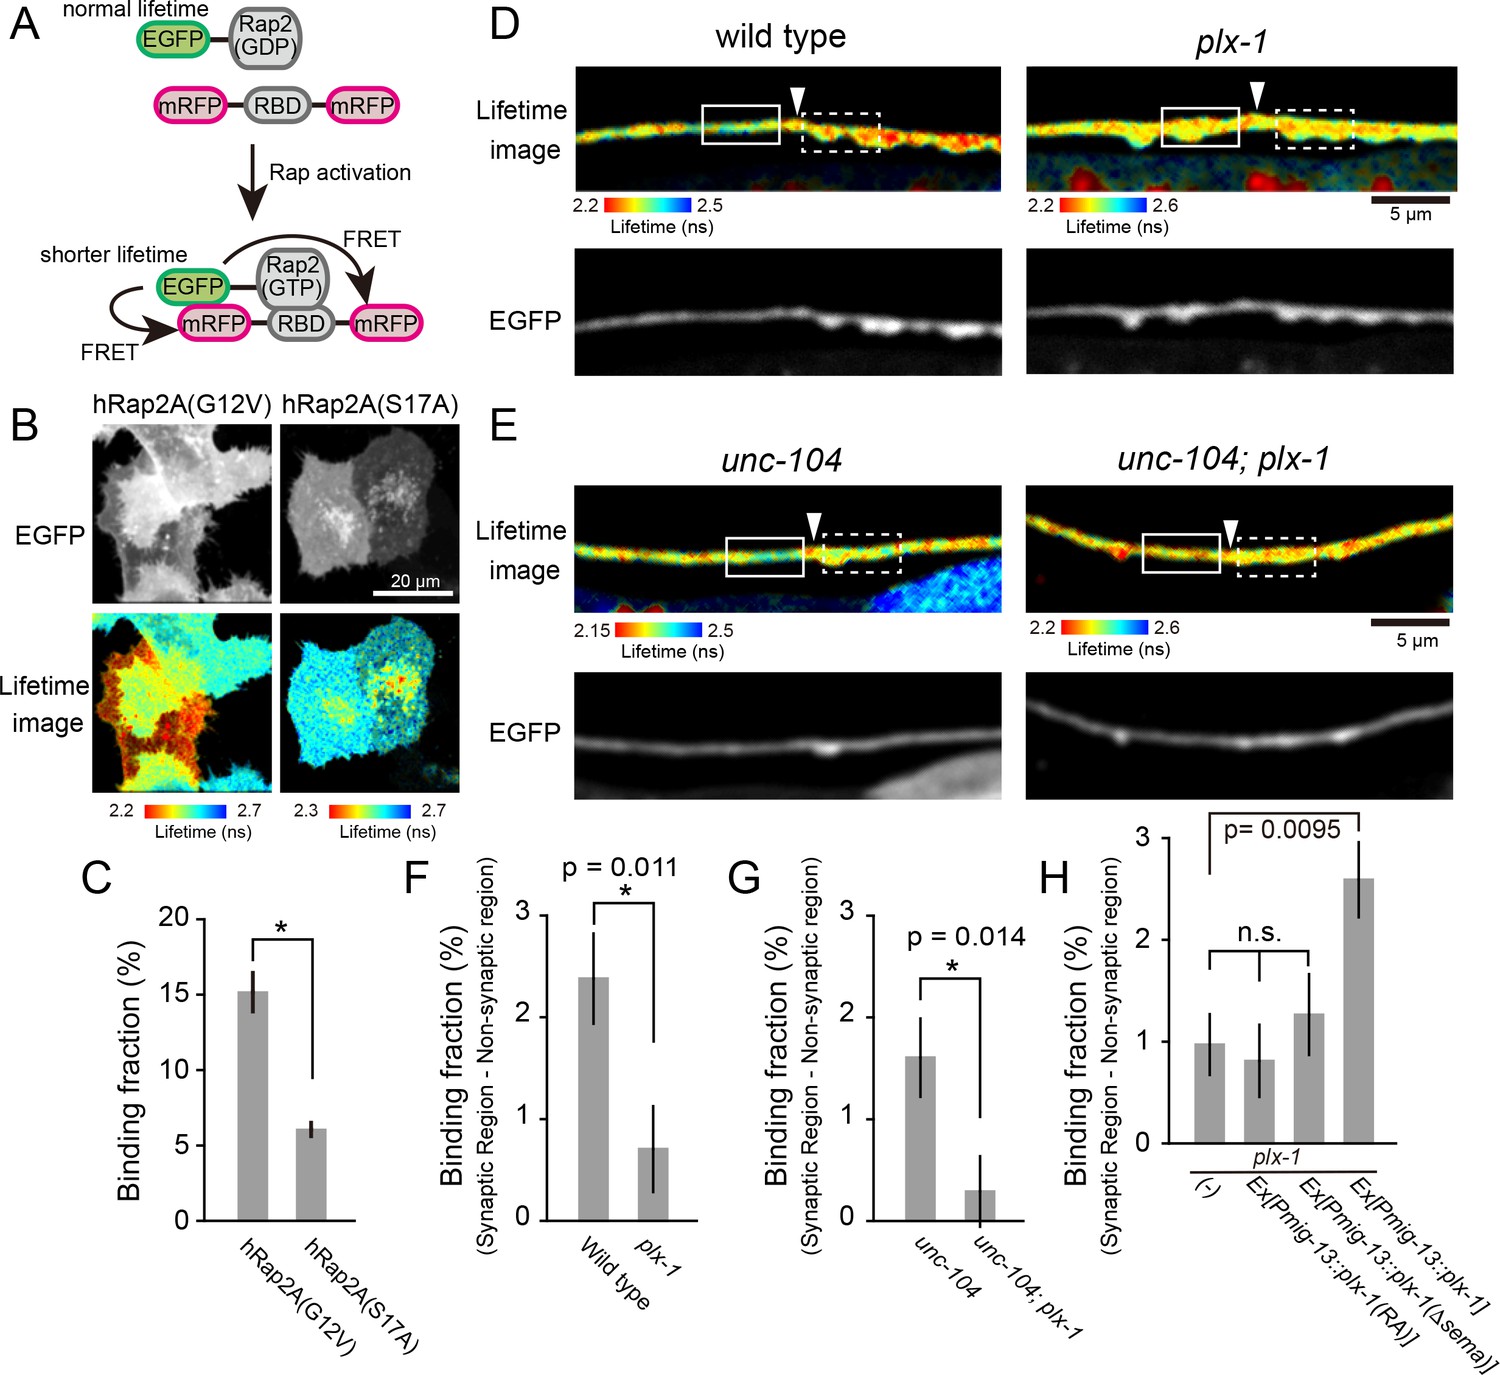
PLX-1 locally inhibits Rap2 activity in DA9.
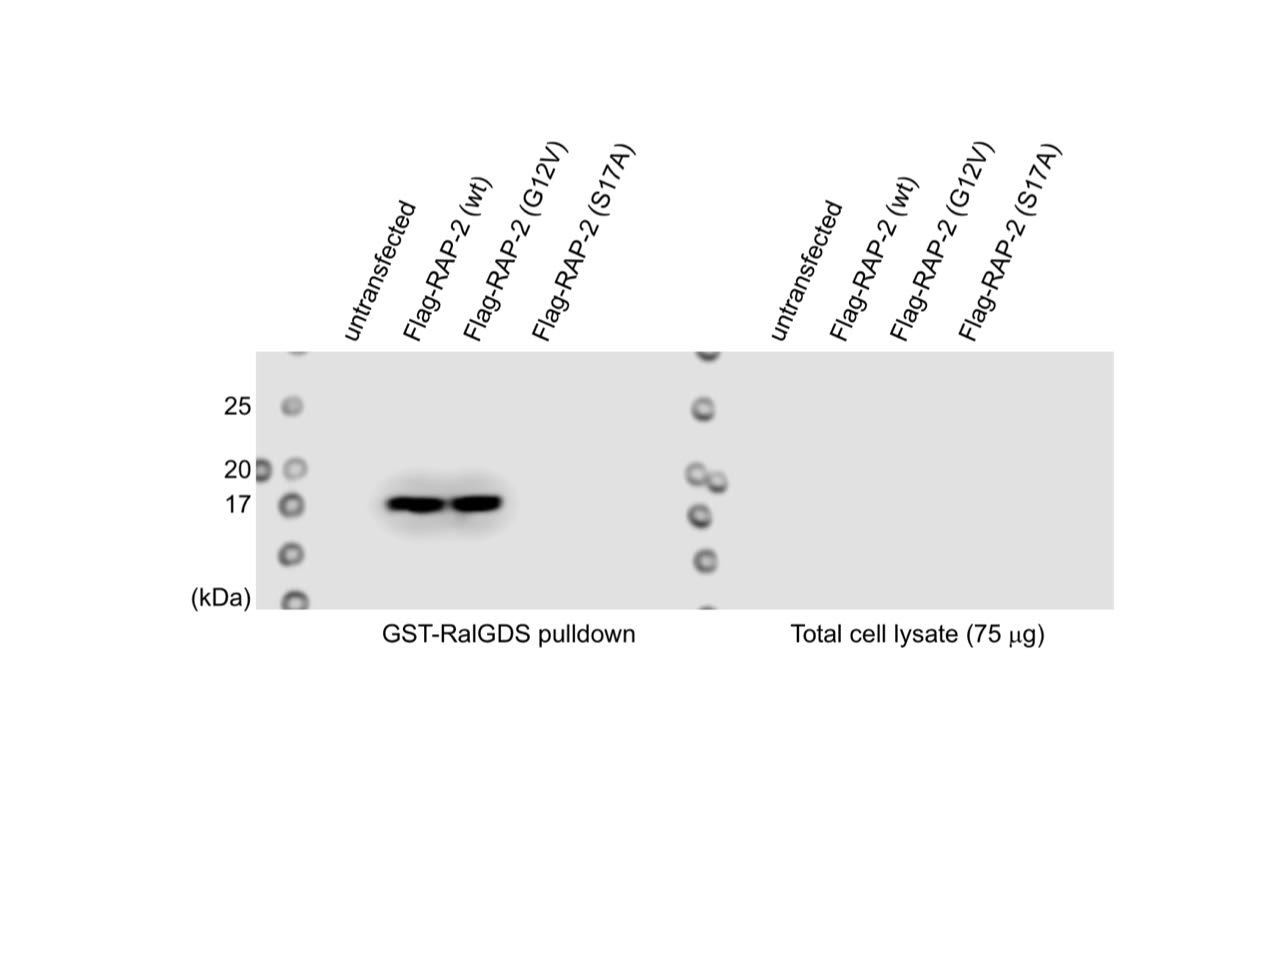
(A) Schematic of Rap2 FRET sensor system. Binding of mRFP- RalGDS(RBD)-mRFP to EGFP-Rap2 induces FRET from EGFP to mRFP, leading to decreased EGFP fluorescence lifetime. (B) Representative fluorescence (top) and fluorescence lifetime images (bottom) of HeLa cells expressing Rap2 FRET sensor (mRFP-RalGDS(RBD)-mRFP) with either constitutively GTP(G12V)- or GDP(S17A)- forms of human Rap2A. (C) Quantification of the binding fraction of Rap2 mutants in HeLa cells. Binding fractions measured from fluorescence decay curves of individual cells (G12V, n = 25; S17A, n = 25), as described previously (Murakoshi et al., 2011). Data shown as mean ± SEM. Asterisks denote statistical significance (p<0.05, student’s t-test). (D) Representative images of fluorescence lifetime (top) and fluorescence (bottom) of mizIs19 in wild type (left) and plx-1 mutants (right). White arrowheads indicate the position of the putative synaptic tiling border, as judged by the slight dorsal shift of the DA9 axon, as reported previously (Mizumoto and Shen, 2013a). (E) Representative images of fluorescence lifetime (top) and fluorescence (bottom) of mizIs19 in unc-104 (left) and unc-104; plx-1 double mutants (right). (F) Quantification of the difference in binding fraction of GTP-Rap2a and RalGDS(RBD) between synaptic region (dotted boxes in D) and anterior asynaptic region (solid boxes in D). The binding fraction measured in synaptic region (dotted rectangle) was subtracted by that in non-synaptic region (solid rectangle). Five micrometers along the axon line from the synaptic tiling border were used for quantification. Data presented as mean ± SEM (wild type, n = 22; plx-1, n = 17). (G) Quantification of the difference in binding fraction of GTP-Rap2A and RalGDS(RBD) between synaptic region (dotted boxes in E) and anterior asynaptic region (solid boxes in E). The binding fraction measured in synaptic region (dotted rectangle) subtracted from that in non-synaptic region (solid rectangle). Five micrometers along the axon line from the synaptic tiling border were used for quantification. Data are presented as mean ± SEM (unc-104, n = 21; unc-104; plx-1, n = 23). (H) Quantification of the difference in binding fraction of GTP-Rap2a and RalGDS(RBD) between synaptic region and anterior asynaptic region in plx-1 mutants and plx-1 mutants expressing rescuing constructs. Five micrometers along the axon line from the synaptic tiling border were used for quantification. Data are presented as mean ± SEM (no array, n = 35; Ex[Pmig-13::plx-1(RA)], n = 39; Ex[Pmig-13::plx-1(Δsema)], n = 41; Ex[Pmig-13::plx-1], n = 51).
Figure 5 with 2 supplements
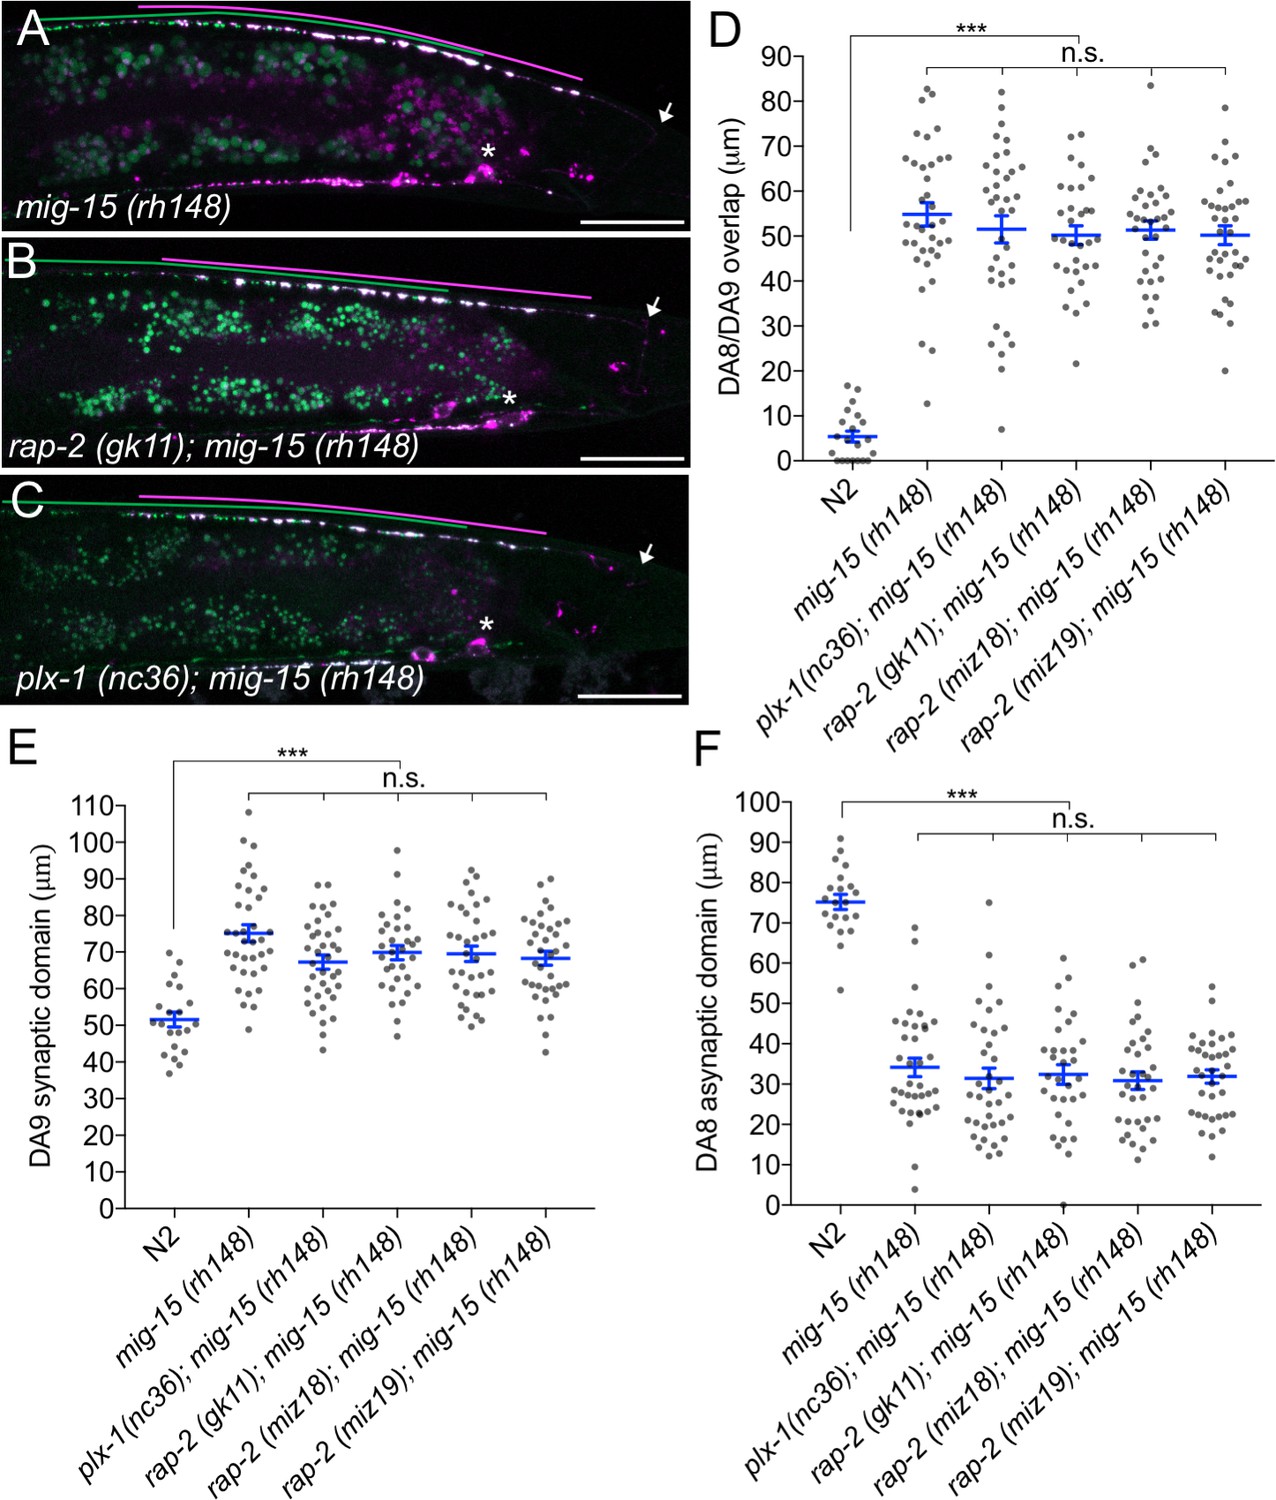
mig-15(TNIK) mutants show a severe synaptic tiling defect.
(A–C) Representative images of synaptic tiling marker (wyIs446) in mig-15(rh148) (A), rap-2(gk11); mig-15(rh148) (B) and plx-1(nc36); mig-15(rh148) (C) mutants. Synaptic domains of DA8 and DA9 are highlighted with green and magenta lines, respectively. Asterisks: DA9 cell body. Arrows: dorsal commissure of DA9. Scale bars: 20 μm. (D–F) Quantification of overlap between DA8 and DA9 synaptic domains (D), DA9 synaptic domain (E) and DA8 asynaptic domain (F) in respective mutant backgrounds. Each dot represents measurement from a single animal. Blue bars indicate mean ± SEM. n.s.: not significant; ***p<0.001.
Figure 5—figure supplement 1
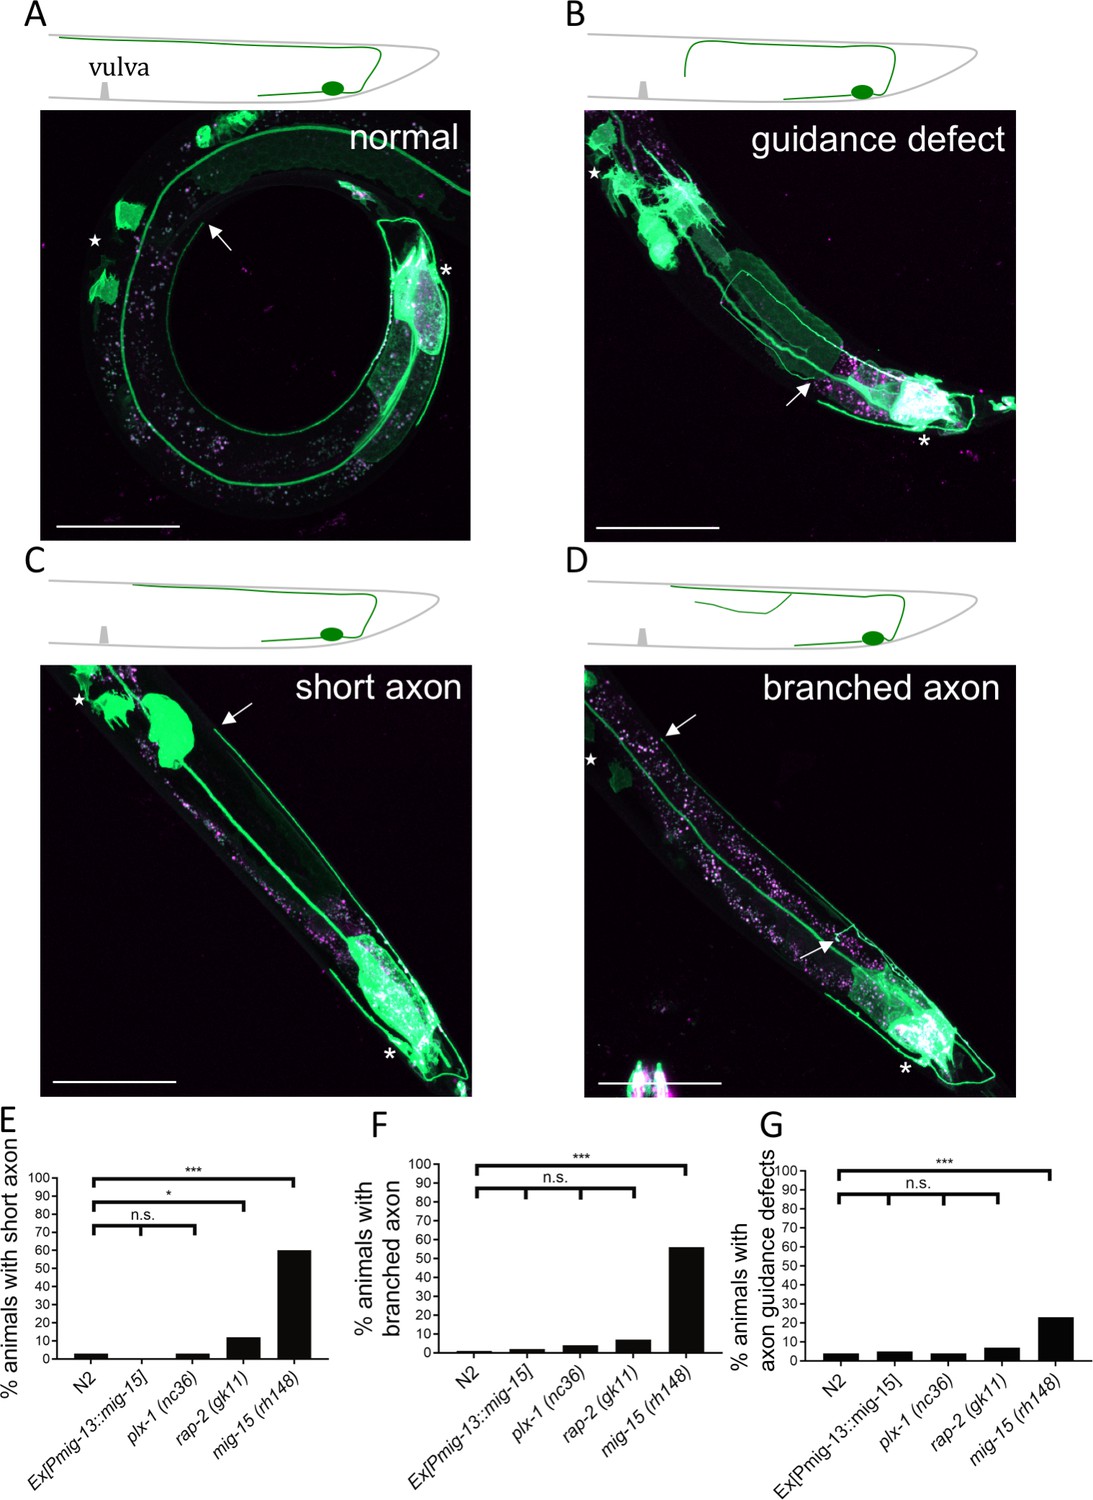
Morphological defects of DA9 axon in mig-15(rh148) mutants.
(A–D) Representative images of DA9 marker (mizIs1) in mig-15(rh148) mutants with normal structure (A), axon guidance defect (B), short axon (C) and branched axon (D). Scale bars: 50 μm. Stars indicate the position of vulva. Asterisks: DA9 cell body. Arrows: position of DA9 axonal tip. In wild type, DA9 axon extends beyond the vulva. We defined a short axon as not reaching the vulva. (E–G) Quantification of DA9 axonal defects represented in B-D in each genetic background (n = 100). n.s.: not significant; ***p<0.001; *p<0.05.
Figure 5—figure supplement 2
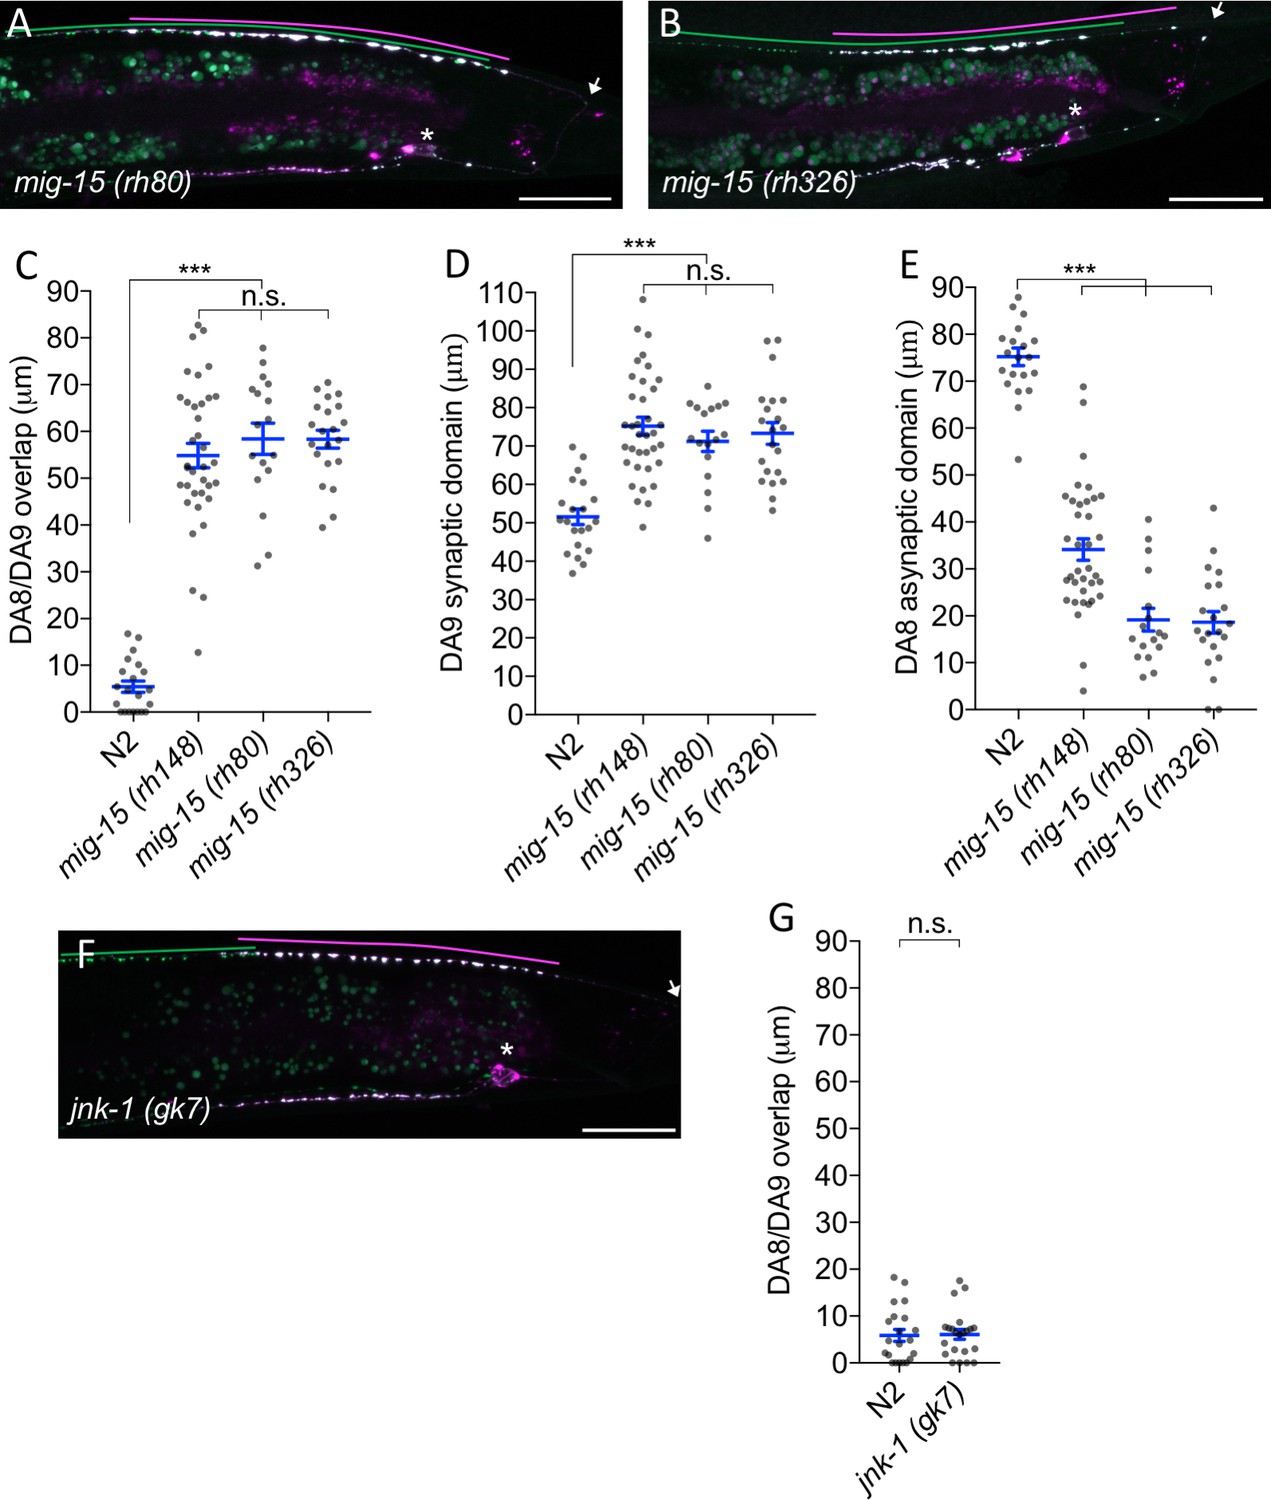
Synaptic tiling defect in mig-15 mutants.
(A and B) Representative images of synaptic tiling marker (wyIs446) in mig-15(rh80) (A) and mig-15(rh326) (B) mutants. Synaptic domains of DA8 and DA9 are highlighted with green and magenta lines, respectively. Asterisks: DA9 cell body. Arrows: dorsal commissure of DA9. Scale bars: 20 μm. (C–E) Quantification of DA8/DA9 overlap (C), DA9 synaptic domain (D) and DA8 asynaptic domain (E). Each dot represents measurement from a single animal. Blue bars indicate mean ± SEM. n.s.: not significant; ***p<0.001. (F) Representative image of synaptic tiling marker (wyIs524) in jnk-1 mutants. Synaptic domains of DA8 and DA9 highlighted with green and magenta lines, respectively. Asterisks: DA9 cell body. Arrows: dorsal commissure of DA9. Scale bars: 20 μm. (G) Quantification of DA8/DA9 overlap. Each dot represents measurements from a single animal. Blue bars indicate mean ± SEM. n.s.: not significant.
Figure 6
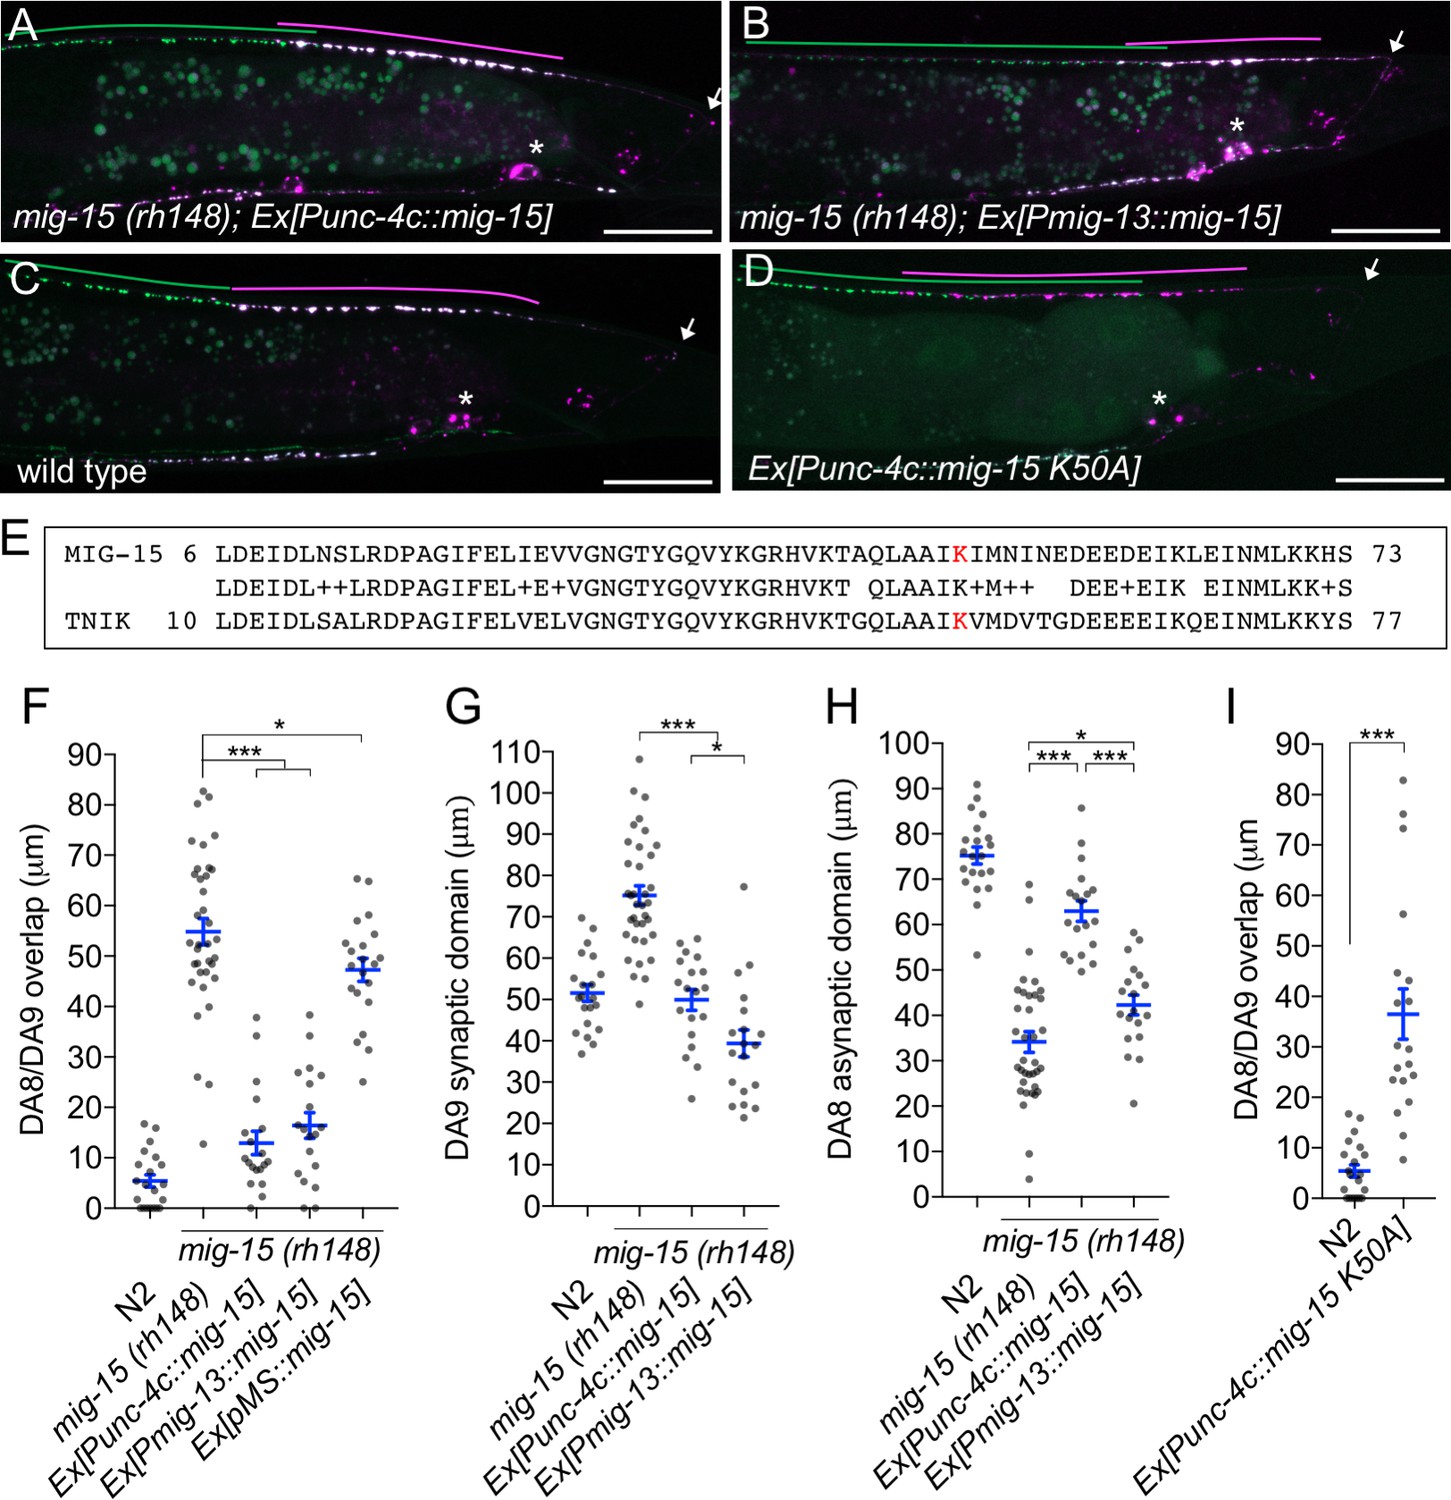
mig-15 functions in DA neurons.
(A–D) Representative images of synaptic tiling marker (wyIs446) in the following backgrounds: mig-15(rh148); Ex[Punc-4c::mig-15] (A), mig-15(rh148); Ex[Pmig-13::mig-15] (B), wild type (C) and wild type animals expressing dominant-negative mig-15(K50A) in DA neurons (D). Synaptic domains of DA8 and DA9 are highlighted with green and magenta lines, respectively. Asterisks: DA9 cell body. Arrows: dorsal commissure of DA9. Scale bars: 20 μm. (E) Amino acid alignment of amino-terminal region of MIG-15 and TNIK. A kinase-dead mutation in TNIK (K54A) and corresponding mutation in MIG-15 (K50A) are highlighted in red. (F–I) Quantification of overlap between DA8 and DA9 synaptic domains (F and I), DA9 synaptic domain (G), DA8 asynaptic domain (H) in respective mutant backgrounds. Each dot represents measurements from a single animal. Blue bars indicate mean ± SEM. n.s.: not significant; ***p<0.001; *p<0.05.
Figure 7 with 3 supplements
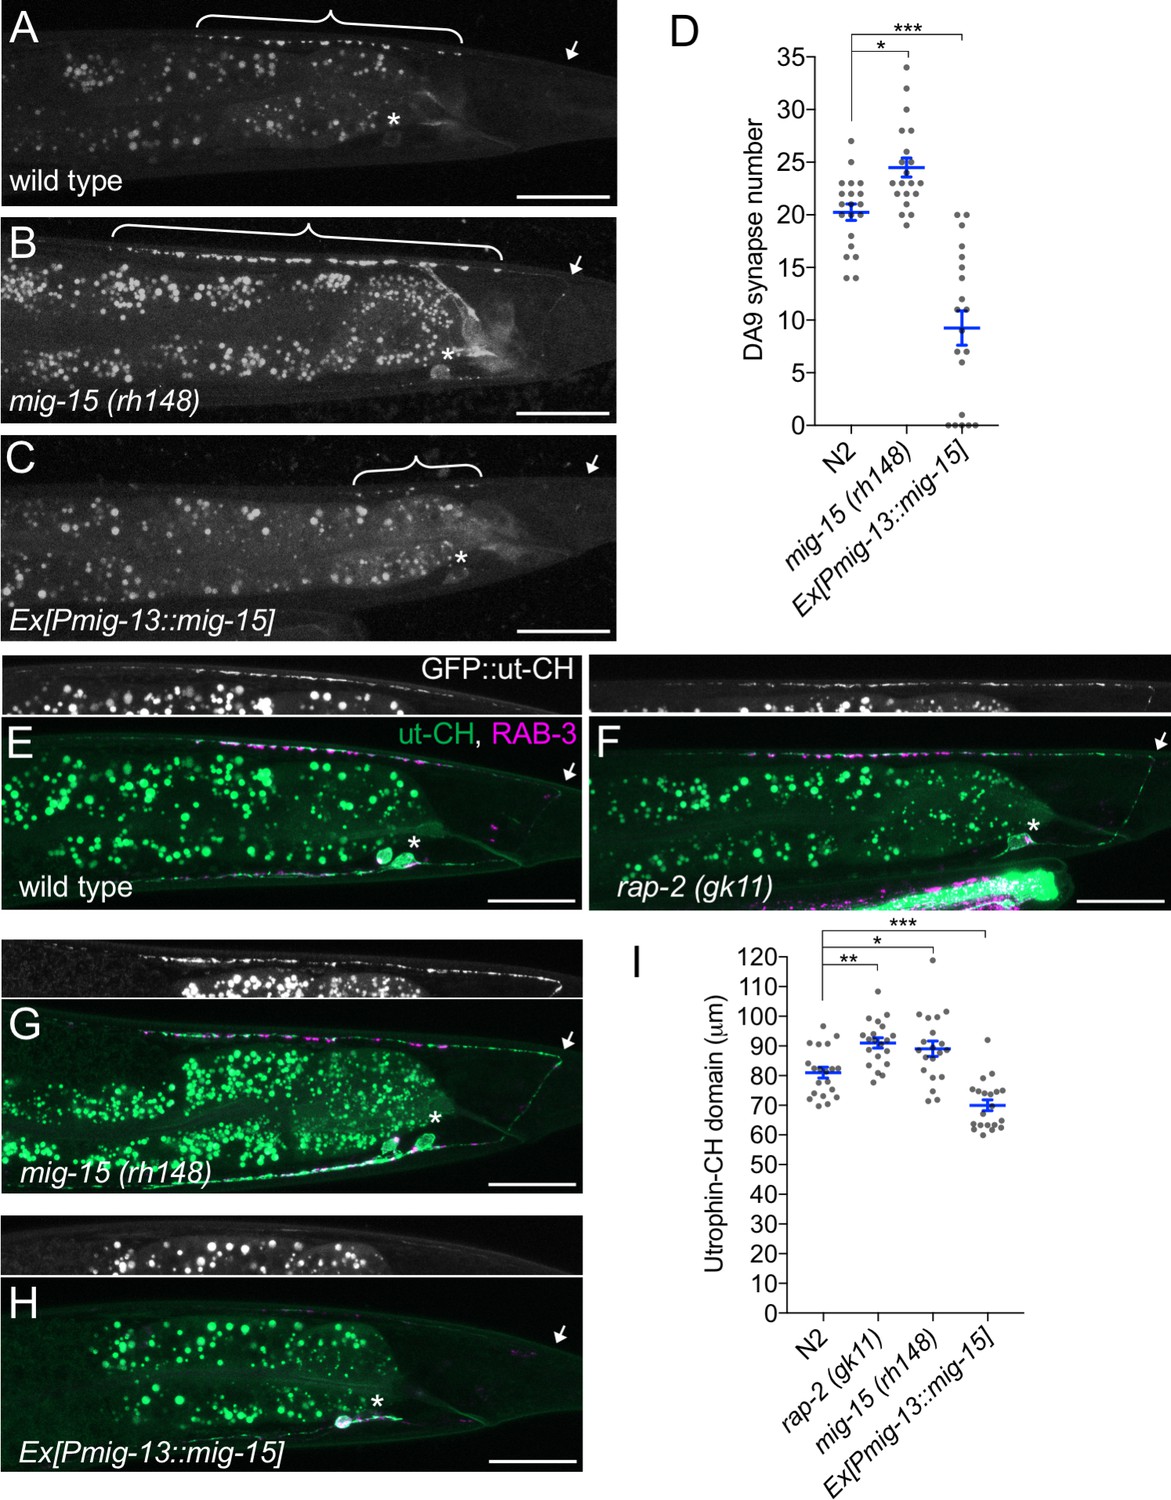
mig-15 negatively regulates synapse number.
(A–C) Representative images of DA9 presynaptic marker, GFP::RAB-3 (wyIs85), in wild type (A), mig-15(rh148) (B) and mig-15 overexpressing animals (C). Brackets represent DA9 synaptic domain. Asterisks: DA9 cell body. Arrows: dorsal commissure of DA9. Scale bars: 20 μm. (D) Quantification of DA9 synapse number. Each dot represents measurements from a single animal. Blue bars indicate mean ± SEM. n.s.: not significant; ***p<0.001; *p<0.05. (E–H) Representative images of synaptic branched F-actin labeled with GFP::ut-CH (wyIs329) in wild type (E), rap-2(gk11) (F), mig-15(rh148) (G) and mig-15 overexpressing animals (H). (I) Quantification of the length of GFP::ut-CH. Distance from the dorsal commissure to the most anterior and brightest GFP spot was measured. Blue bars indicate mean ± SEM. n.s.: not significant; ***p<0.001; **p<0.01, *p<0.05.
Figure 7—figure supplement 1
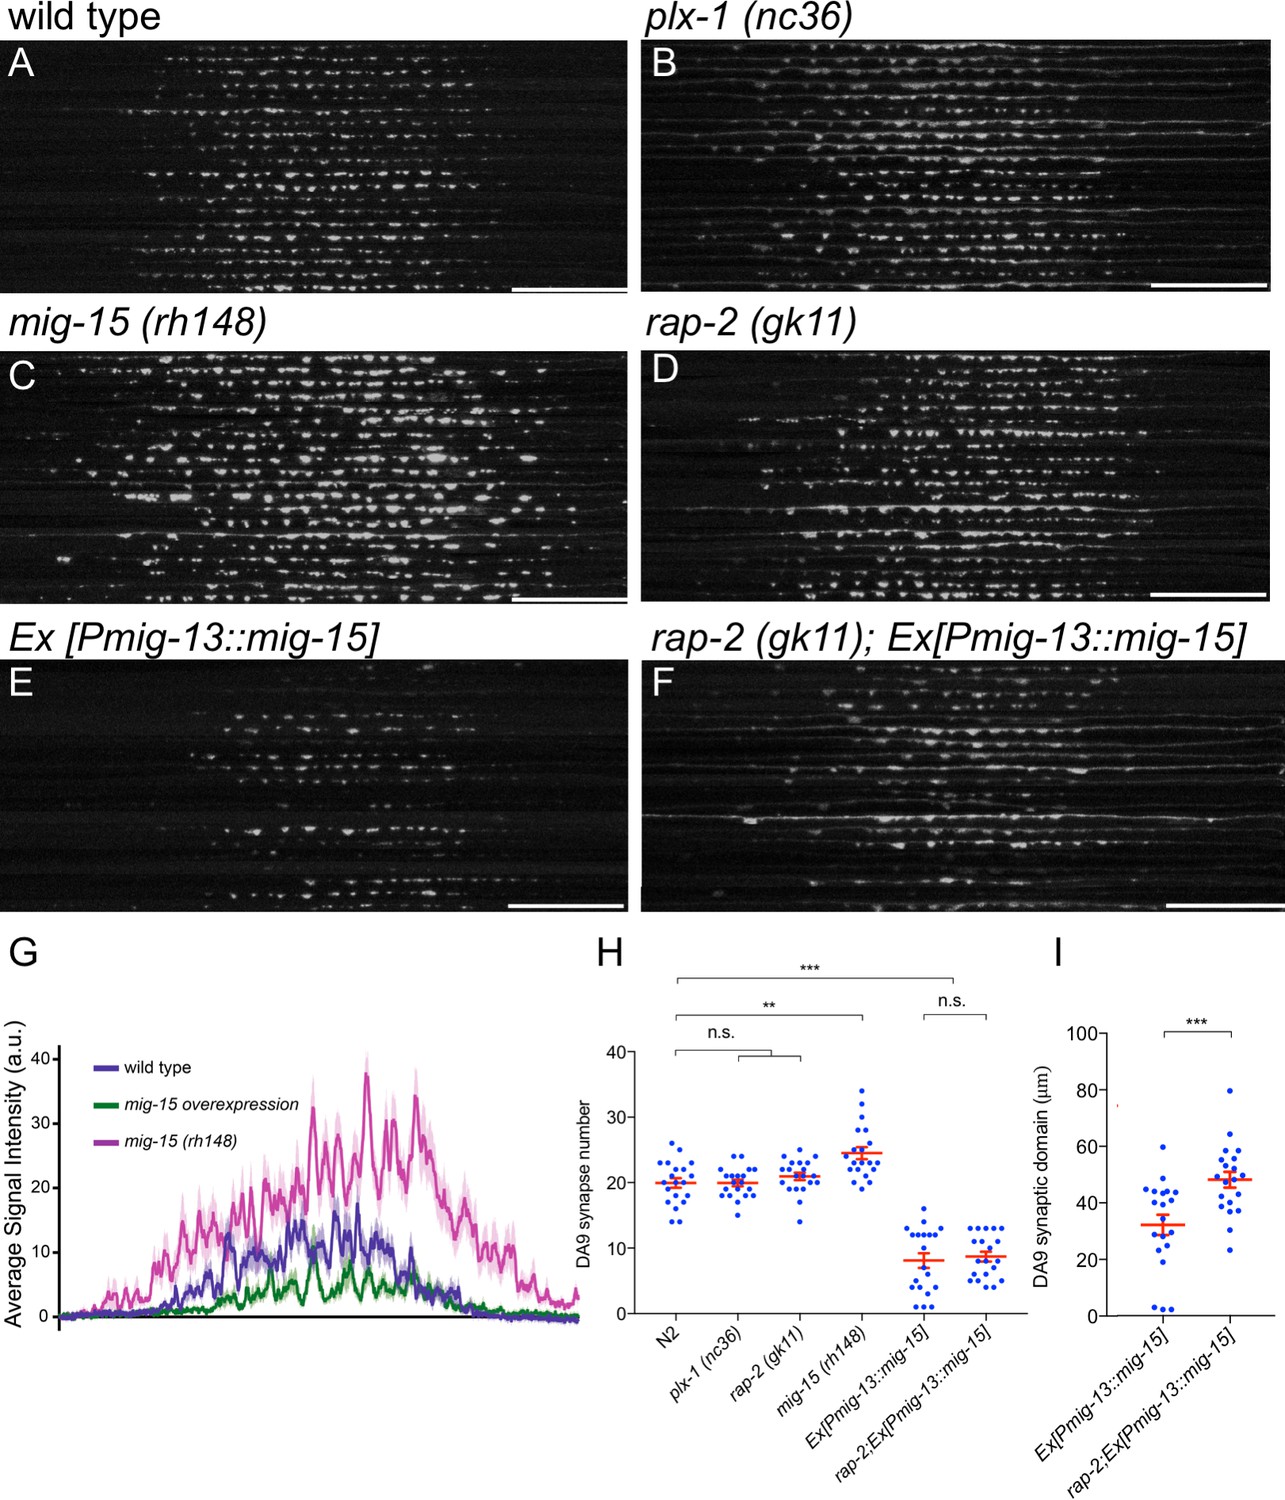
mig-15 is a negative regulator of synapse formation.
(A–F) 20 confocal images of DA9 synapses (wyIs85) in wild type (A), plx-1(nc36) (B), mig-15(rh148) (C), rap-2(gk11) (D), mizEx151 (mig-15(OE)) (E) and rap-2(gk11); mizEx151 (F). Dorsal axon from the commissure (right end of each image) of DA9 was straightened and aligned along the anterior-posterior axis. Scale bars: 20 μm. (G) Quantification of the signal intensity of GFP::RAB-3 in panels A to C. (H) Quantification of synapse numbers in panels A to F. Each dot represents measurement from single animal. Red bars indicate mean ± SEM. n.s.: not significant; **p<0.01; ***p<0.001. (I) Quantification of the DA9 synaptic domain length in panels E and F. Each dot represents measurement from single animal. Red bars indicate mean ± SEM. ***p<0.001.
Figure 7—figure supplement 2
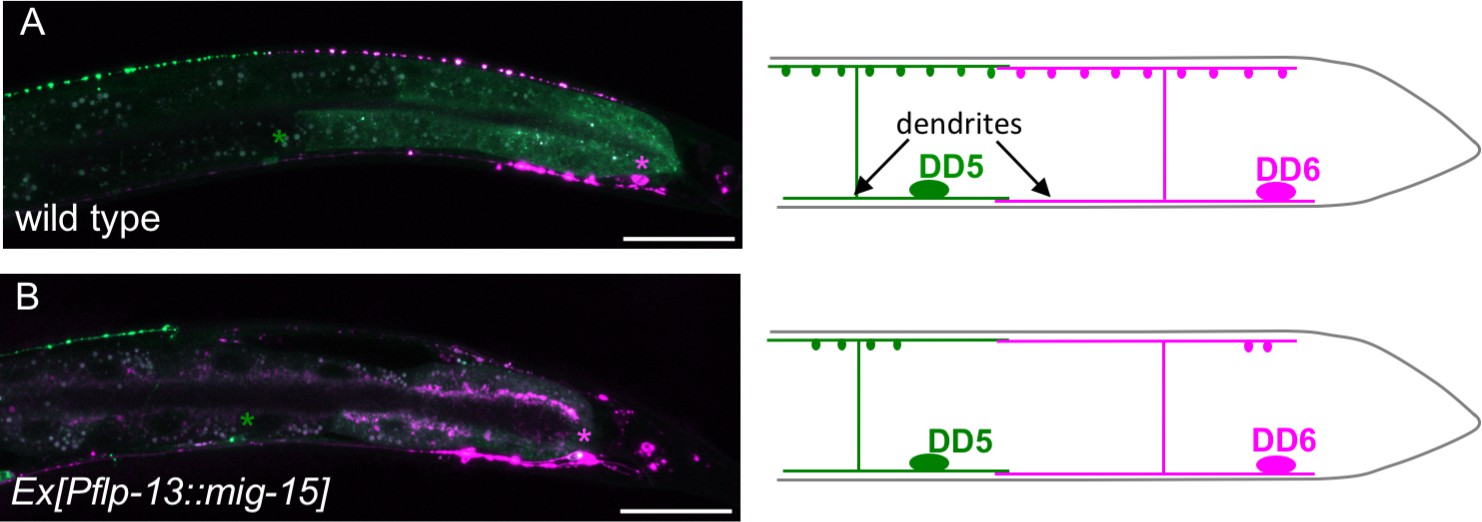
Overexpression of mig-15 reduces synapse numbers in GABAergic motor neurons.
Synapses from DD5 (GFP::RAB-3) and DD6 (GFP::RAB-3+mCherry::RAB-3) (wyIs442) in wild type (A) and animals overexpressing mig-15 in DD neurons (B). Schematics of the DD5 (green) and DD6 (magenta) neurons shown in the right. Green and magenta asterisks represent the position of DD5 and DD6 cell bodies, respectively. Scale bars: 20 μm.
Figure 7—figure supplement 3
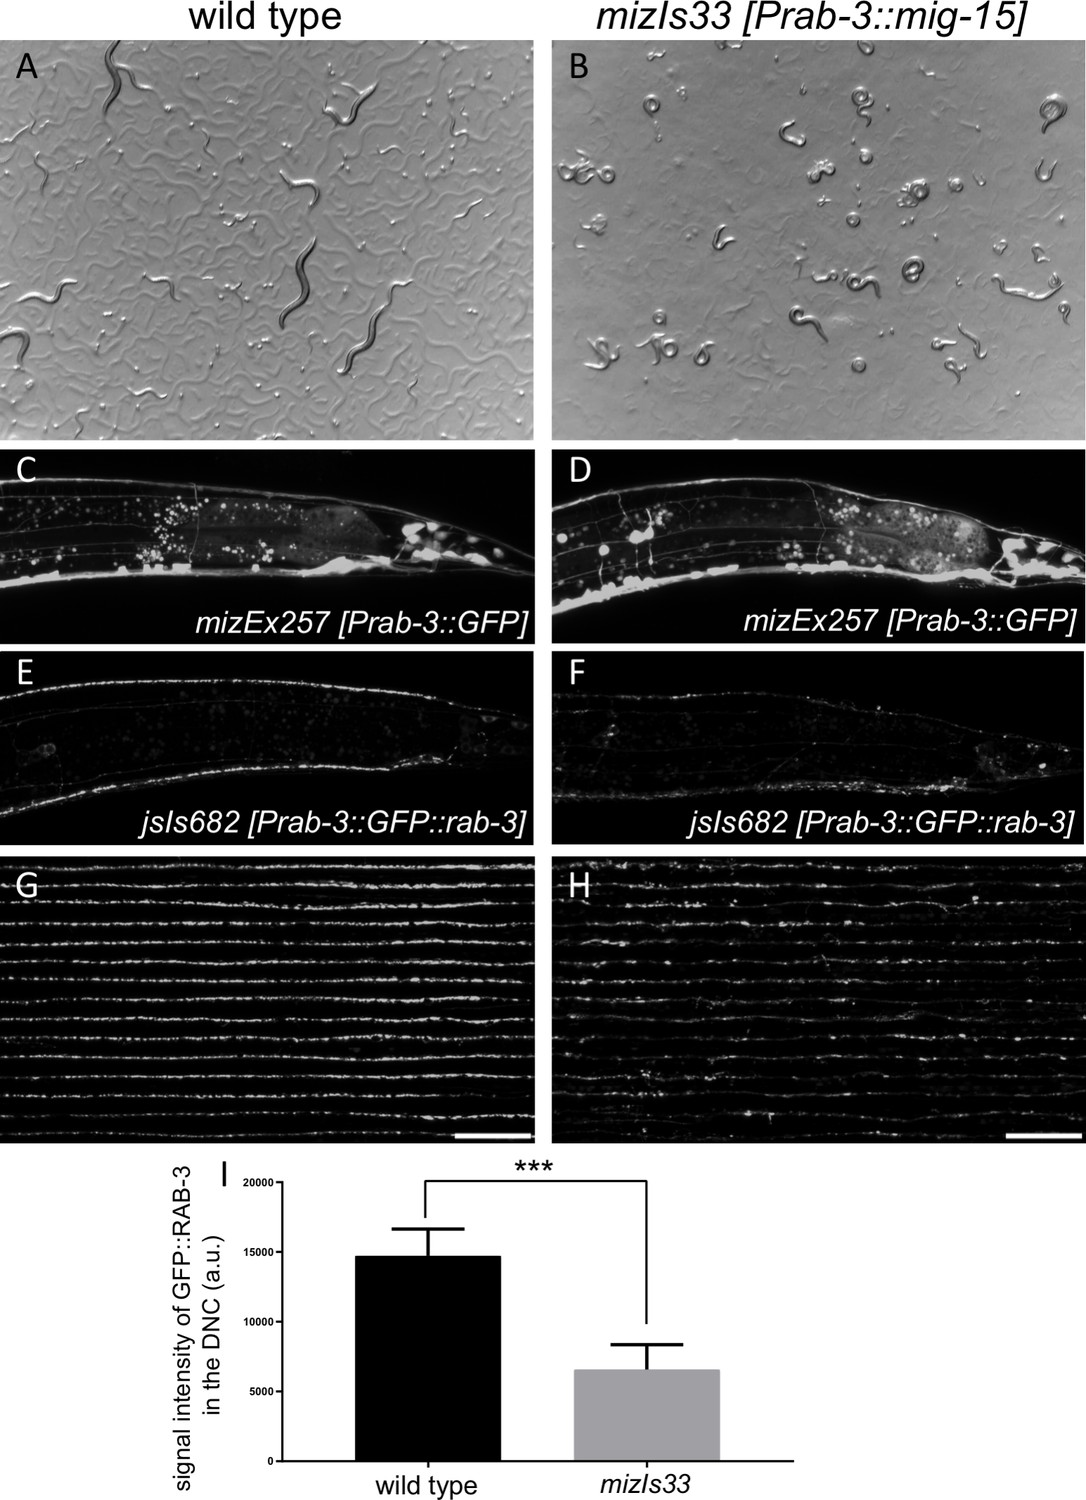
Reduction of synapses by mig-15 overexpression caused severe locomotion defects.
(A and B) Stereoscopic images of wild type (A) and mizIs33 (Prab-3::mig-15) (B). Note that wildtype animals show normal sinusoidal body bending pattern, while mig-15 overexpressing animals are severely uncoordinated. (C and D) Axonal morphology labeled with mizEx257 (Prab-3::GFP) in wild type (C) and mizIs33 (D). (E and F) Synapse distribution labeled with jsIs682 (Prab-3::GFP::rab-3) in wild type (E) and mizIs33 (F). Synapses in the dorsal nerve cord were severely reduced. (G and H) 15 confocal images of synapses in the dorsal nerve cord (jsIs682) in wild type (G) and mizIs33 (mig-15 overexpression) (H). Middle part of the dorsal nerve cord was straightened and aligned along the anterior-posterior axis. Scale bars: 20 μm. (I) Quantification of the total signal intensity of GFP::RAB-3 in the dorsal nerve cord shown in G and H. 155 μm region of the middle part of the dorsal nerve cord was used for quantification. Data presented as mean ± SEM (n = 15). ***p<0.001 (student’s t-test).
Figure 8

PLX-1/RAP-2 signaling coordinates synapse number and synaptic tiling border.
(A–C) Representative images of synaptic tiling marker (wyIs446) overexpressing mig-15 in DA9 from wild type (A), plx-1(nc36) (B) and rap-2(gk11) (C). Synaptic domains of DA8 and DA9 highlighted with green and magenta lines, respectively. Asterisks: DA9 cell body. Arrows: dorsal commissure of DA9. Scale bars: 20 μm. (D) Schematic illustration of synapse distribution in wild type (left), animals overexpressing mig-15 in DA9 (middle) and synaptic tiling mutants overexpressing mig-15 in DA9 (right). Arrows indicate the synaptic tiling border. Colored arrows represent expanded or shortened synaptic domain from DA8 (green) and DA9 (magenta). (E) Quantification of the DA8 asynaptic domain. (F) Quantification of the DA9 synaptic domain. Each dot represents measurements from a single animal. Blue bars indicate mean ± SEM. n.s.: not significant; ***p<0.001. (G) A model of synaptic tiling. PLX-1/RAP-2 signaling controls synaptic tiling via MIG-15, while MIG-15 also plays crucial roles in inhibiting the number of synapses. Solid lines indicate putative direct regulations, dotted lines represent indirect or unknown mode of regulations.
Author response image 1
Tables
Key resources table
| Reagent type (species) or resource | Designation | Source or reference | Identifiers | Additional information |
|---|---|---|---|---|
| Gene (C. elegans) | rap-2 | NA | C25D7.7 | |
| Gene (C. elegans) | plx-1 | NA | Y55F3AL.1 | |
| Gene (C. elegans) | mig-15 | NA | ZC504.4 | |
| Strain, strain background (C. elegans) | rap-2(gk11) | C. elegans stock center (CGC) | VC14 | |
| Strain, strain background (C. elegans) | mig-15(rh148) | C. elegans stock center (CGC) | NJ490 | |
| Strain, strain background (C. elegans) | plx-1(nc36) | C. elegans stock center (CGC) | ST36 | |
| Strain, strain background (C. elegans) | rap-2(miz18) | This study | UJ401 | G12V mutant |
| Strain, strain background (C. elegans) | rap-2(miz19) | This study | UJ402 | S17A mutant |
| Strain, strain background (C. elegans) | wyIs446 | This study | TV14517 | synaptic tiling marker |
| Strain, strain background (C. elegans) | mizIs19 | This study | UJ397 | Rap2 FRET sensor strain |
Additional files
-
Supplementary file 1
Supplementary experimental procedures.
- https://doi.org/10.7554/eLife.38801.019
-
Transparent reporting form
- https://doi.org/10.7554/eLife.38801.020
Download links
A two-part list of links to download the article, or parts of the article, in various formats.
Downloads (link to download the article as PDF)
Open citations (links to open the citations from this article in various online reference manager services)
Cite this article (links to download the citations from this article in formats compatible with various reference manager tools)
Rap2 and TNIK control Plexin-dependent tiled synaptic innervation in C. elegans
eLife 7:e38801.
https://doi.org/10.7554/eLife.38801


