Ancestral reconstruction reveals mechanisms of ERK regulatory evolution
- New York University Langone Medical Center, United States
- Memorial Sloan Kettering Cancer Center, United States
- Icahn School of Medicine at Mount Sinai, United States
- Yale University School of Medicine, United States
Figures
Figure 1 with 6 supplements
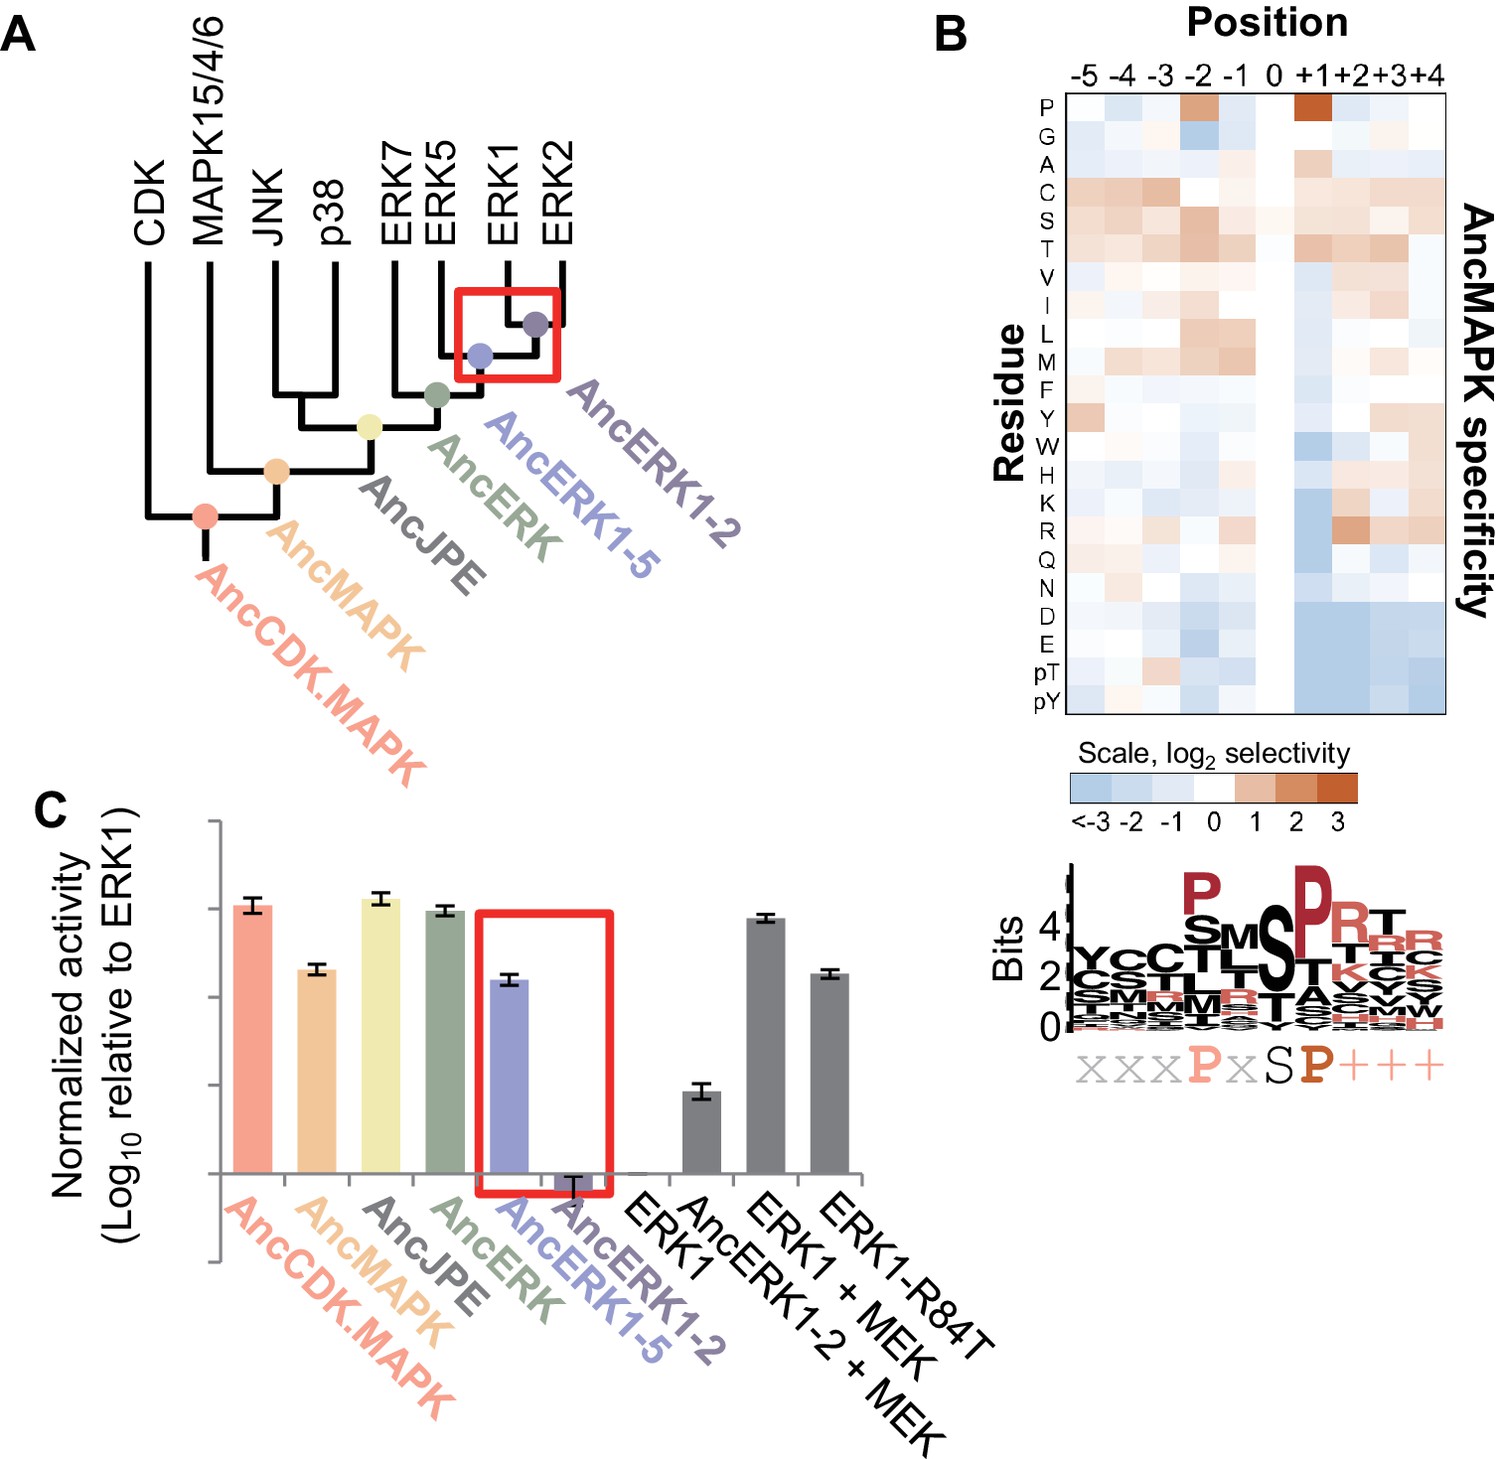
Kinase activity became more tightly regulated at the transition from AncERK1-5 to AncERK1-2.
(A) Phylogenetic tree for the CDK. MAPK group. The ancestral nodes corresponding to the kinases reconstructed in this study are indicated by circles. The red box indicates a transition from high basal activity to low activity in the absence of activation by MEK. (B) Substrate specificity of AncMAPK. Average of two replicates positional scanning peptide libraries were used to profile the specificity of the inferred ancestral kinase AncMAPK. Red indicates positive selection, blue indicates negative selection. (C) Quantification of the basal activities of inferred ancestral kinases and modern ERK1 with and without the activating kinase, MEK (log10 rate of myelin basic protein phosphorylation activity relative to ERK1), red box indicates the transition in basal activity. Error bars indicate ± SD, n = 3.
Figure 1—figure supplement 1
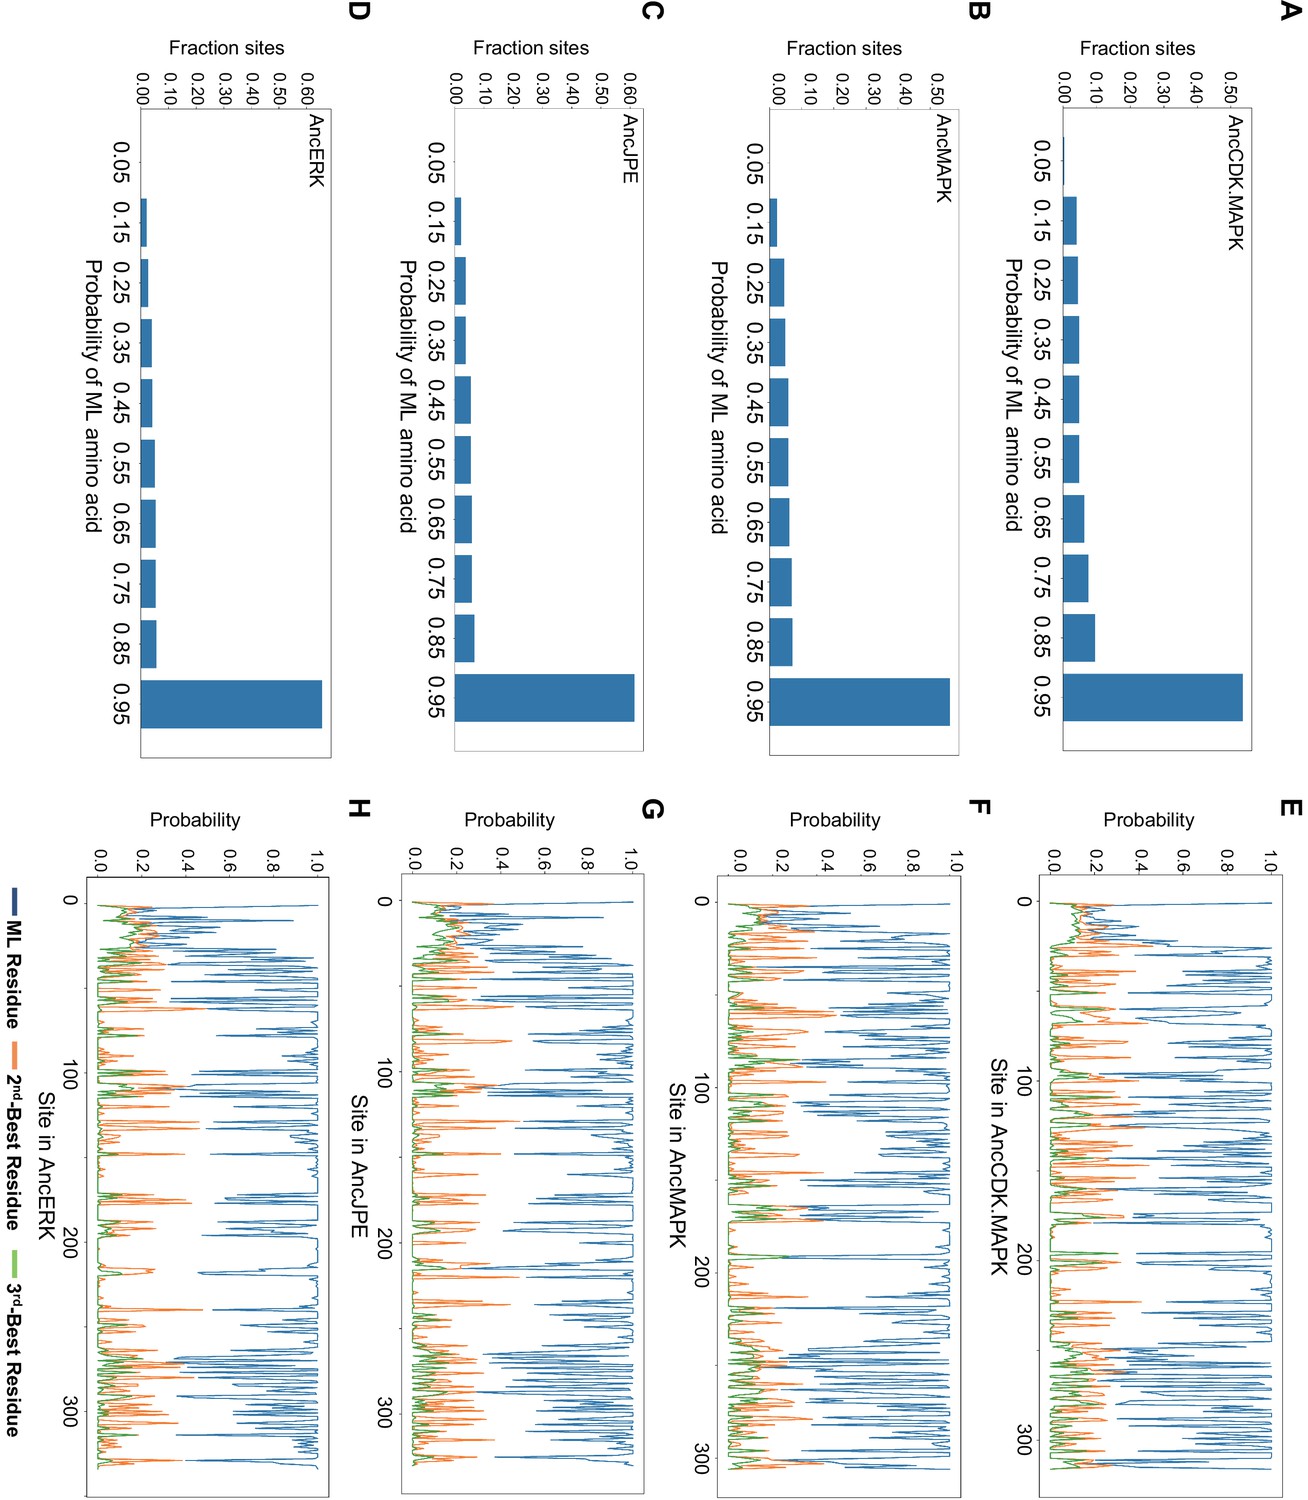
Summary of posterior probabilities of residues for AncCDK.MAPK, AncMAPK, AncJPE and AncERK.
(A–D) Histogram showing posterior probabilities of all maximum likelihood (ML) residues for the core kinase fold of AncCDK.MAPK (A), AncMAPK (B), AncJPE (C) and AncERK (D). (E–H) Posterior probabilities of the ML (blue), along with the 2nd and (orange) and 3rd (green) most likely residues across the primary sequence of the ancestor. AncCDK.MAPK (E), AncMAPK (F), AncJPE (J) and AncERK (H).
Figure 1—figure supplement 2
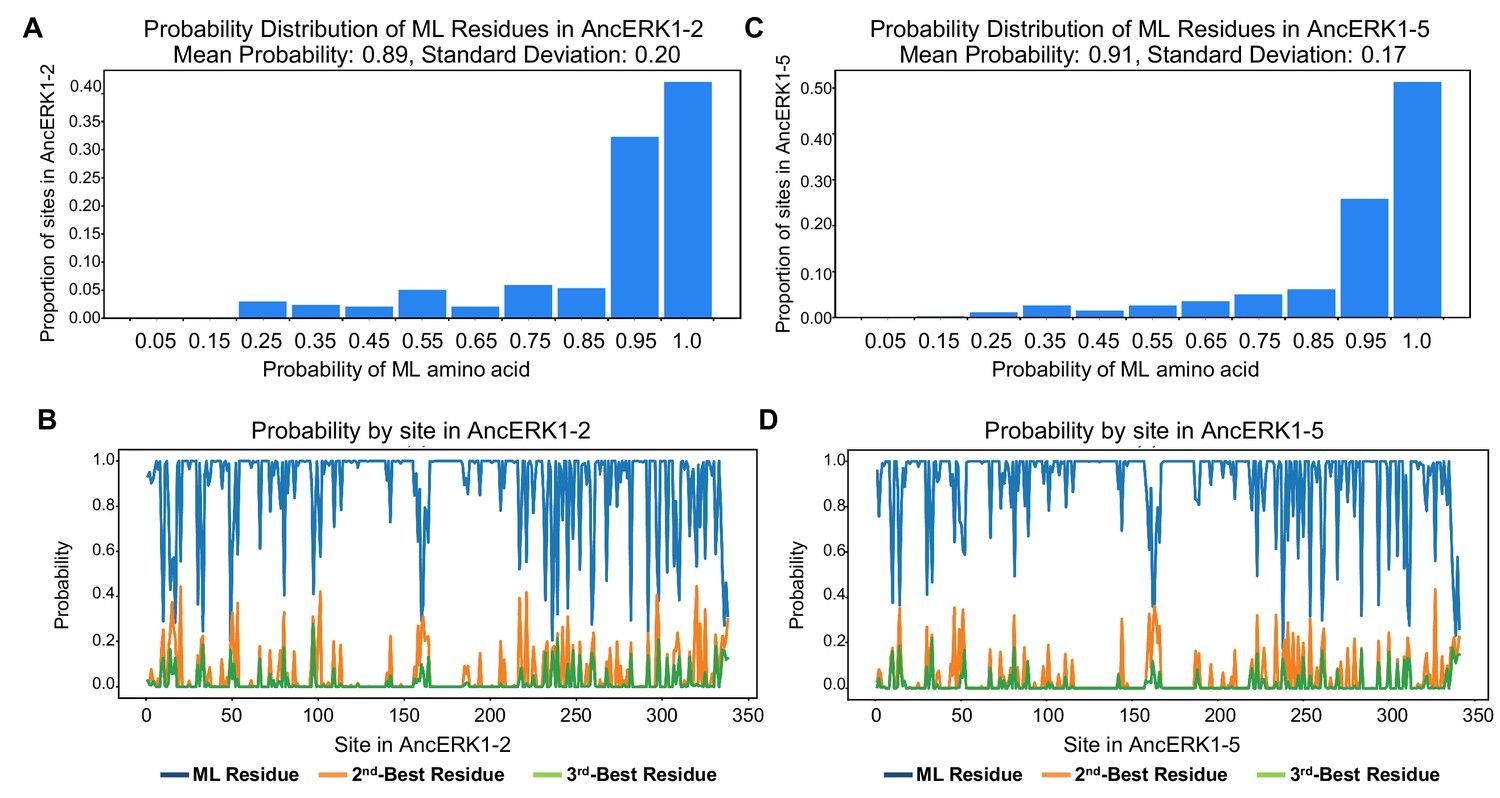
Summary of posterior probabilities of residues for AncERK1-2 and AncERK1-5.
(A) and (C) Histogram showing posterior probabilities of all maximum likelihood (ML) residues. (B) and (D) Posterior probabilities of the ML, 2nd and 3rd most likely residues across the primary sequence of the ancestor.
Figure 1—figure supplement 3
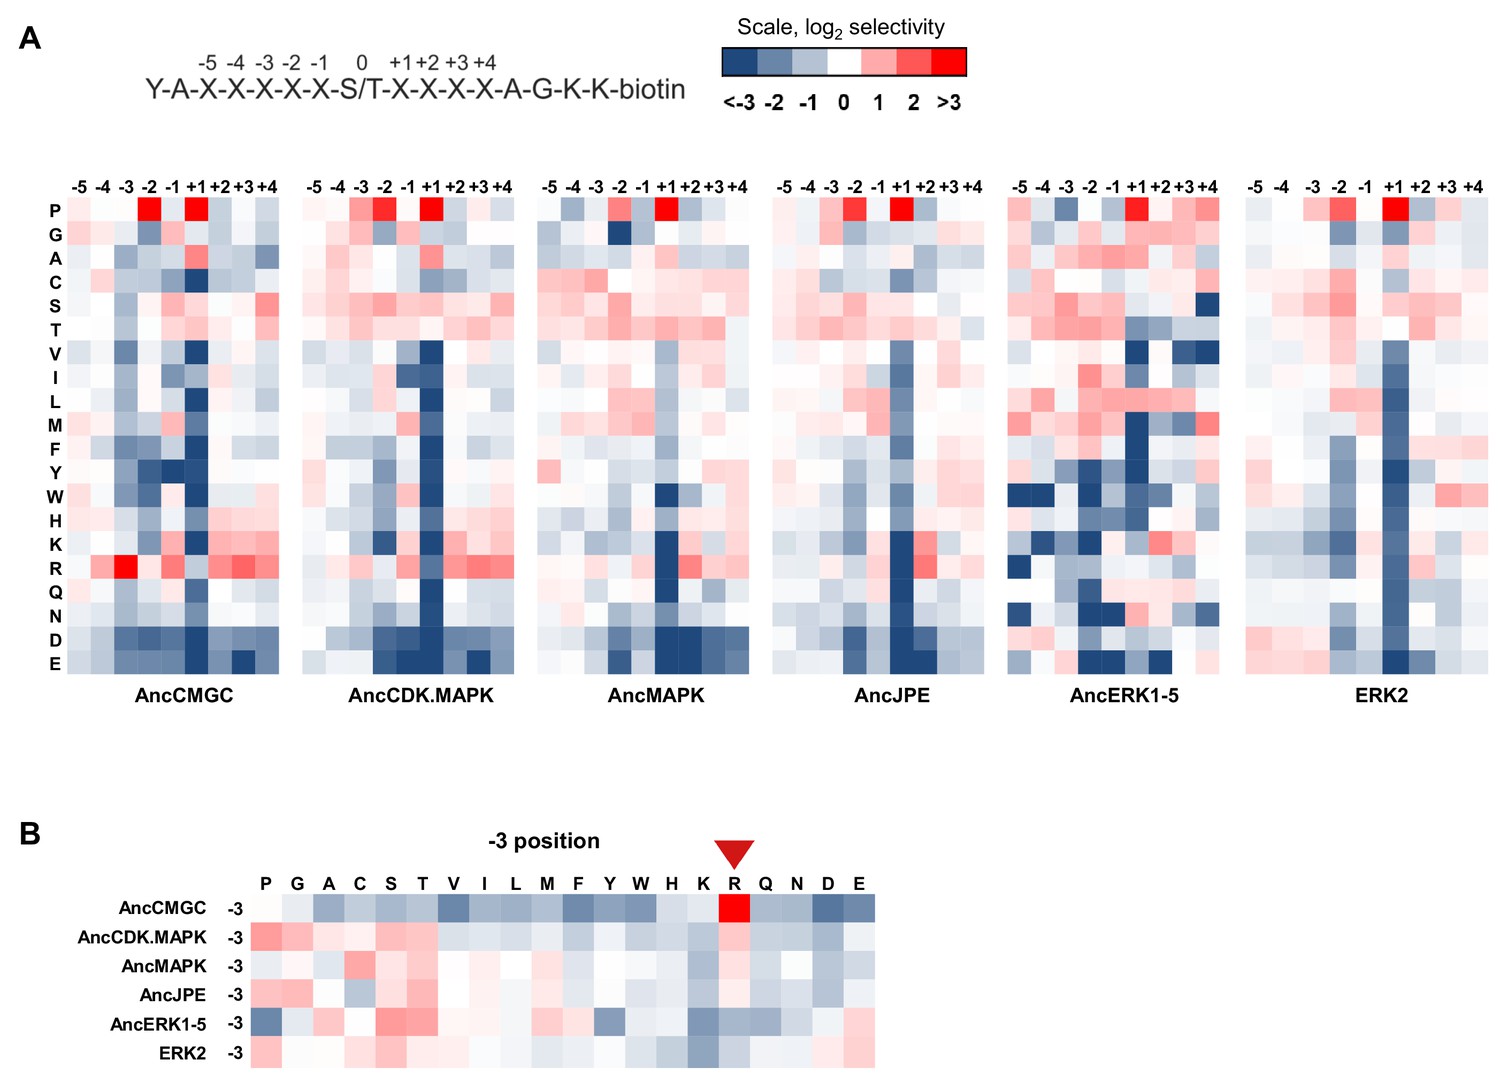
Determination of the primary sequence specificity of inferred ancestral kinases.
(A) The specificity of AncCMGC (the inferred ancestor of CDKs, MAPKs, GSKs and CK2s), AncCDK.MAPK, AncMAPK, AncJPE (inferred ancestor of JNKs, p38s and ERKs), AncERK1-5 and ERK2 were profiled by position scanning peptide libraries. Red indicates positive selection for a given amino acid while blue indicates negative selection. A schematic of the peptide library is shown above. The positions are numbered according to the schematic of the peptide library. Results are the average of 2 replicates. (B) A subset of the data above focusing on the evolution of −3 selectivity. Red arrow indicates diminishing preference for −3 arginine in more recent kinases in the lineage leading to ERK.
Figure 1—figure supplement 4
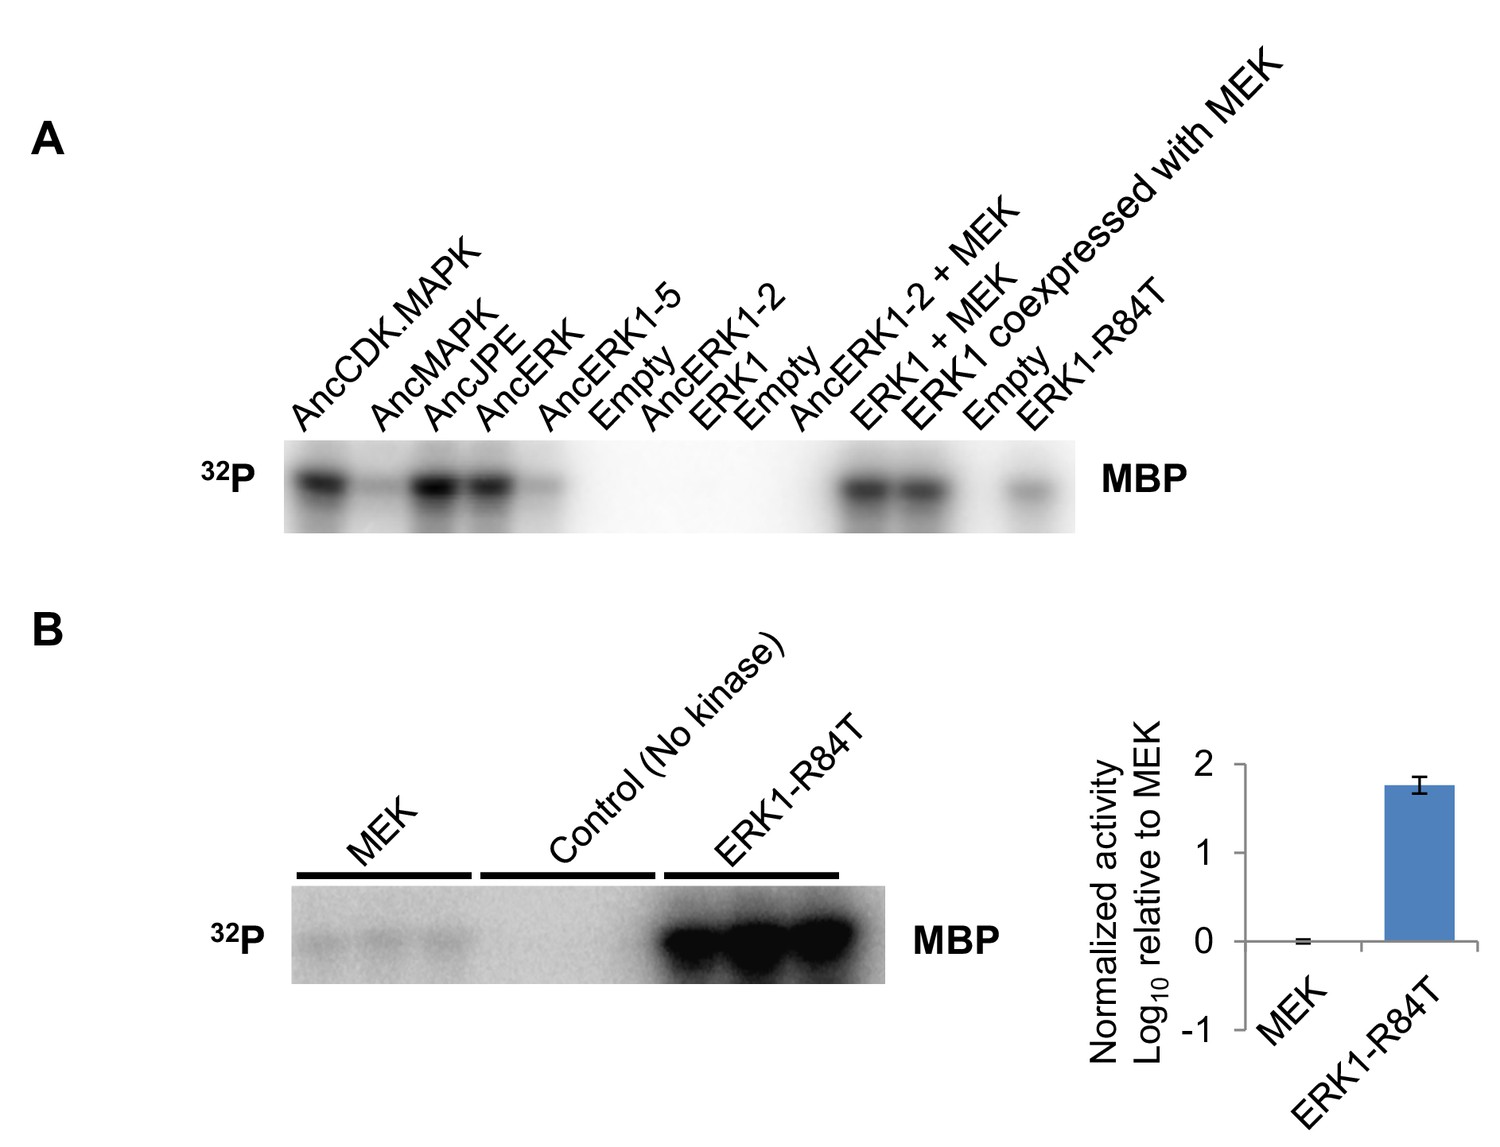
Example primary data for kinase assays.
(A) Example primary data for Figure 1C. In vitro kinase assays were performed with the indicated kinases with Myelin Basic Protein (MBP) as a substrate. (B) In vitro kinase assay measuring activity of MEK towards MBP. In the control reactions, all components were the same except no kinase was added.
Figure 1—figure supplement 5
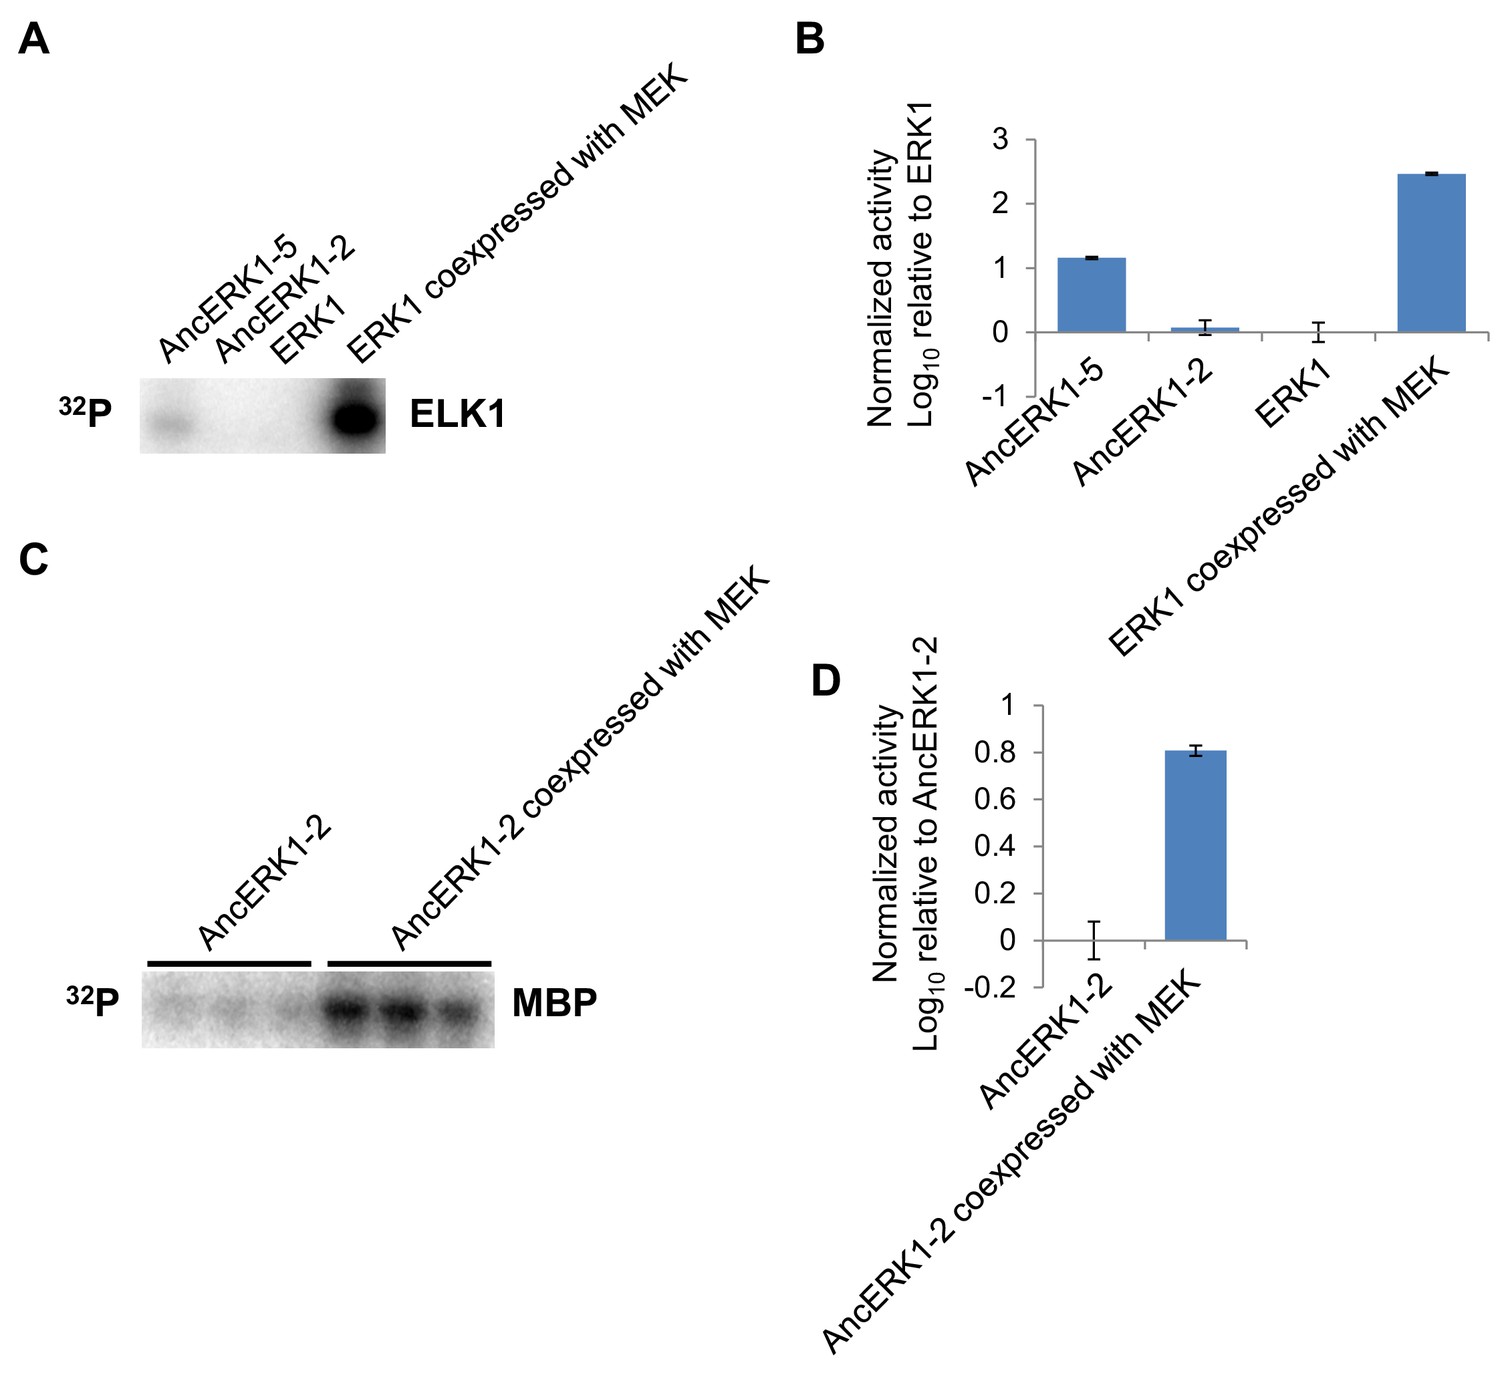
The pattern of activities of AncERK-2 and AncERK1-5 towards a second substrate, ELK1, and activation of AncERK1-2 by MEK.
(A, B) The activities of AncERK1-2 and AncERK1-5 were determined by in vitro kinase assays with ELK1 as a substrate. The pattern of activities with ELK as a substrate is similar to that with MBP as a substrate. (C, D) The activation of AncERK1-2 by MEK was determined by in vitro kinase assay with MBP as a substrate. His6-AncERK1-2 was activated through coexpression with MEK (no His tag) in E. coli, purified and compared to kinase expressed with no MEK.
Figure 1—figure supplement 6
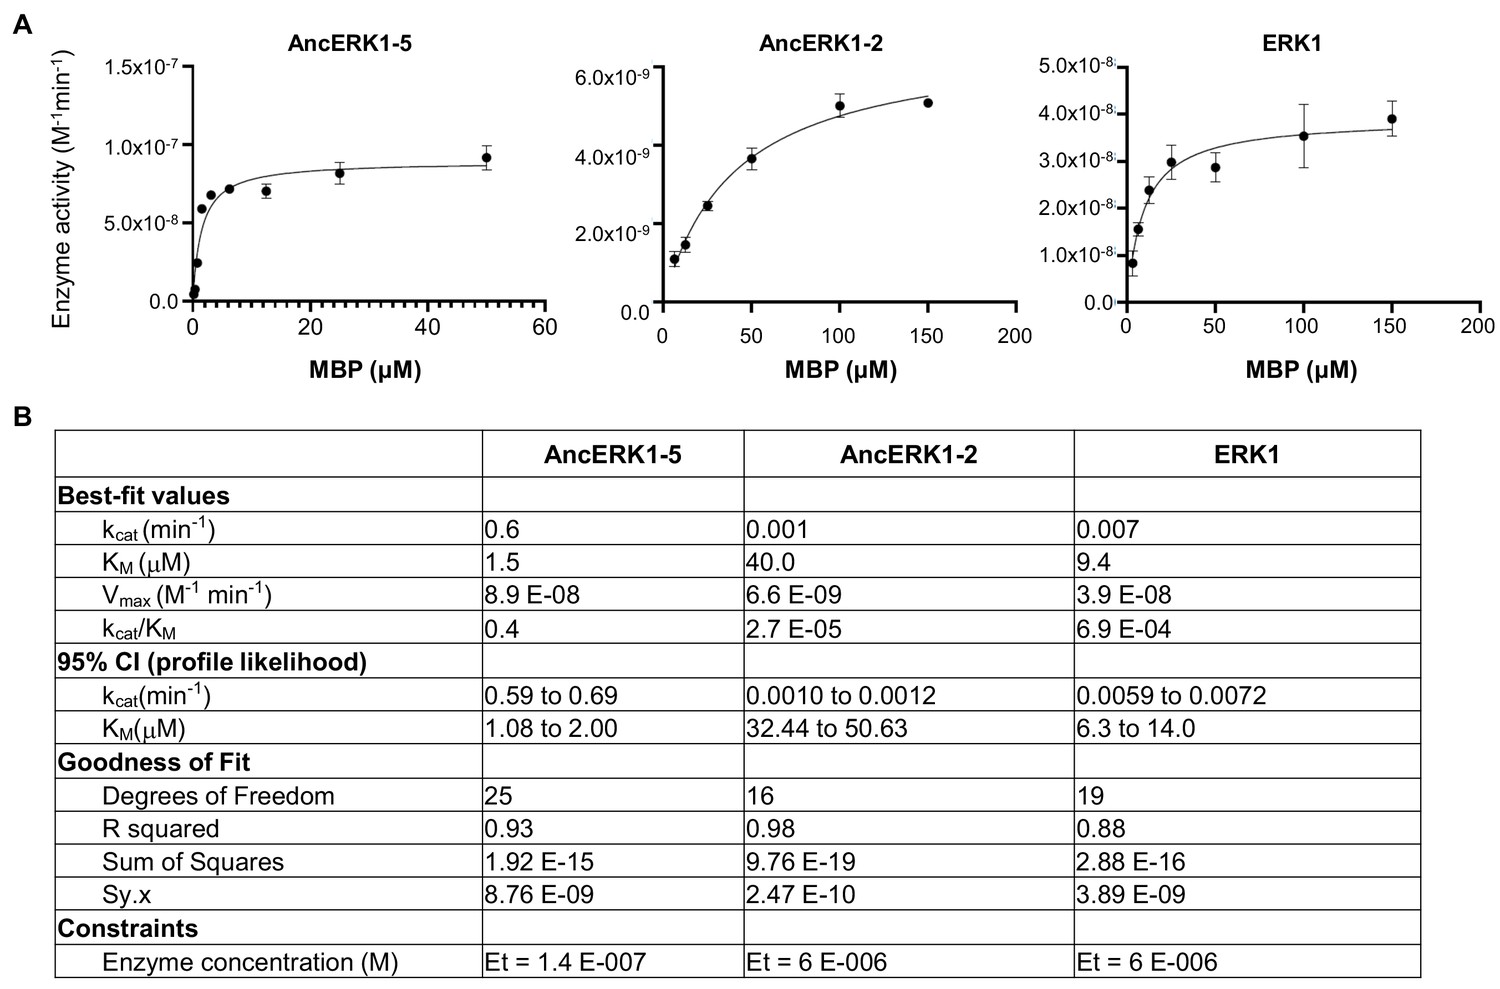
Michaelis–Menten plots.
(A) and kinetic parameters (B) for AncERK1-5, AncERK1-2 and ERK1 with MBP was as substrate.
Figure 2 with 1 supplement
Higher basal activity of inferred ancestors is due to autophosphorylation on the TxY motif.
(A) Superposition of ERK2 (gray, Protein Data Bank code 1ERK) and phosphorylated ERK2 (tan, Protein Data Bank code 2ERK). The activation segment (ribbon diagram) and the ‘TEY’ motif (represented as sticks) are colored orange and yellow for ERK2, blue and red for phosphorylated ERK2. Phosphorylation of the TEY motif leads to a conformational change that remodels the activation loop to enable substrate binding, and rotation of the C helix (arrow) leading to interaction between Lys (K52) on the β3 strand and Glu (E69) on the C helix. Part of Loop L16 adopts a helical conformation in phosphorylated ERK2. (B) Kinase activity of wildtype and AxF mutants of inferred ancestors towards MBP. (C) LC-MS quantification of phosphorylation levels threonine and tyrosine in the ‘TEY’ motif in reconstructed ancestral kinases and ERK1. Bar graphs indicate the relative abundance of various phosphorylated forms of tryptic peptides that contain the ‘TEY’ motif.
Figure 2—figure supplement 1
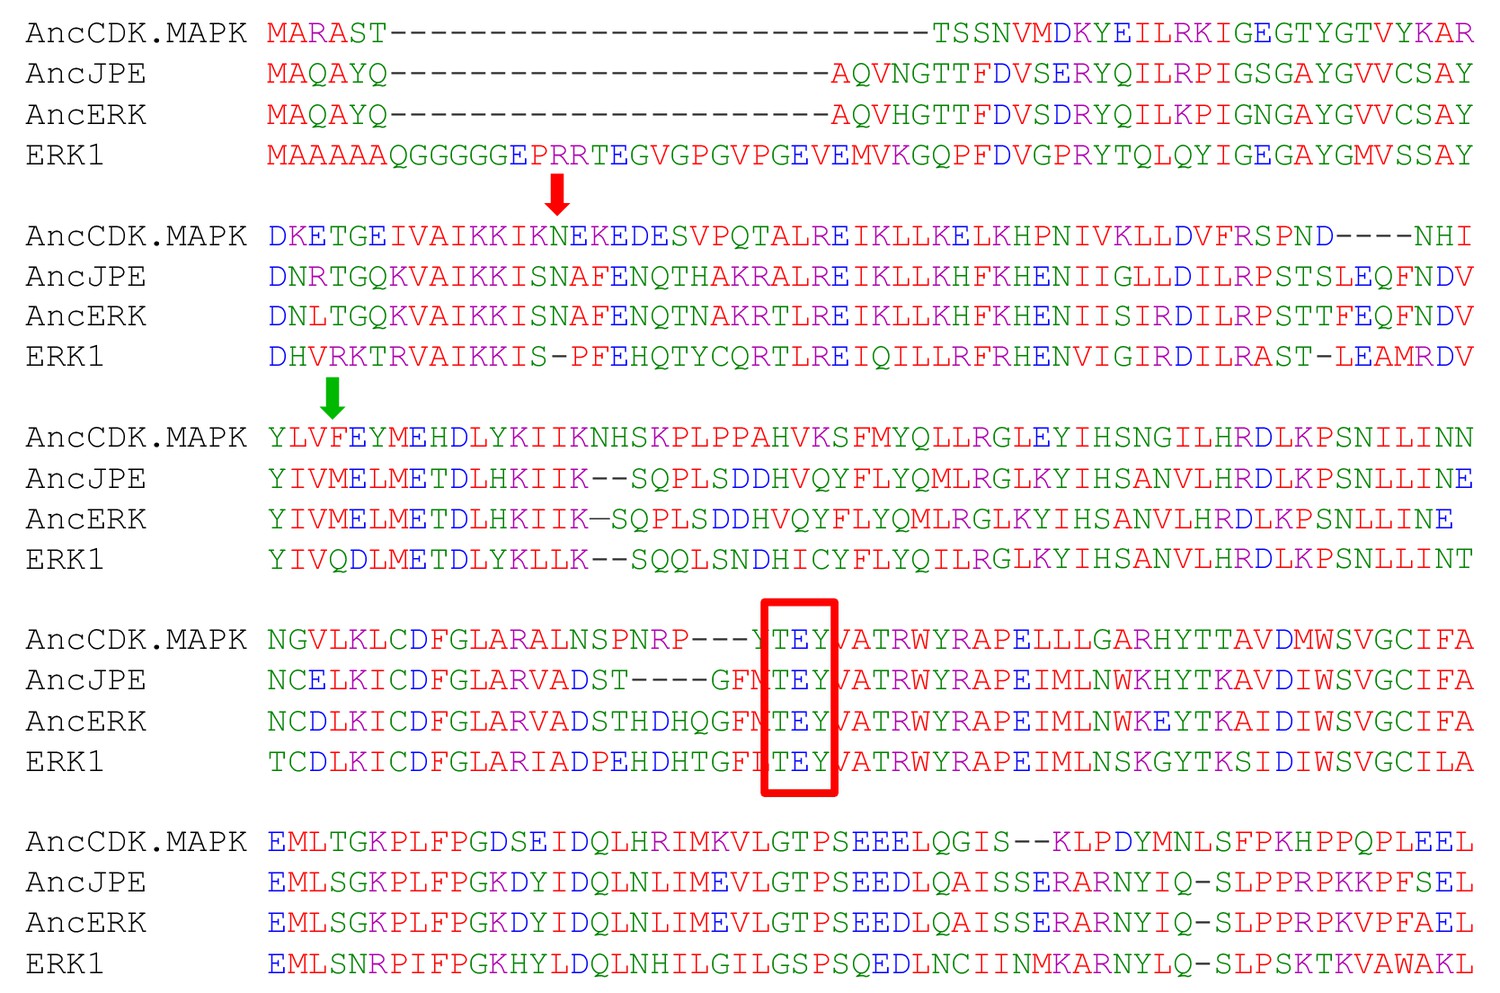
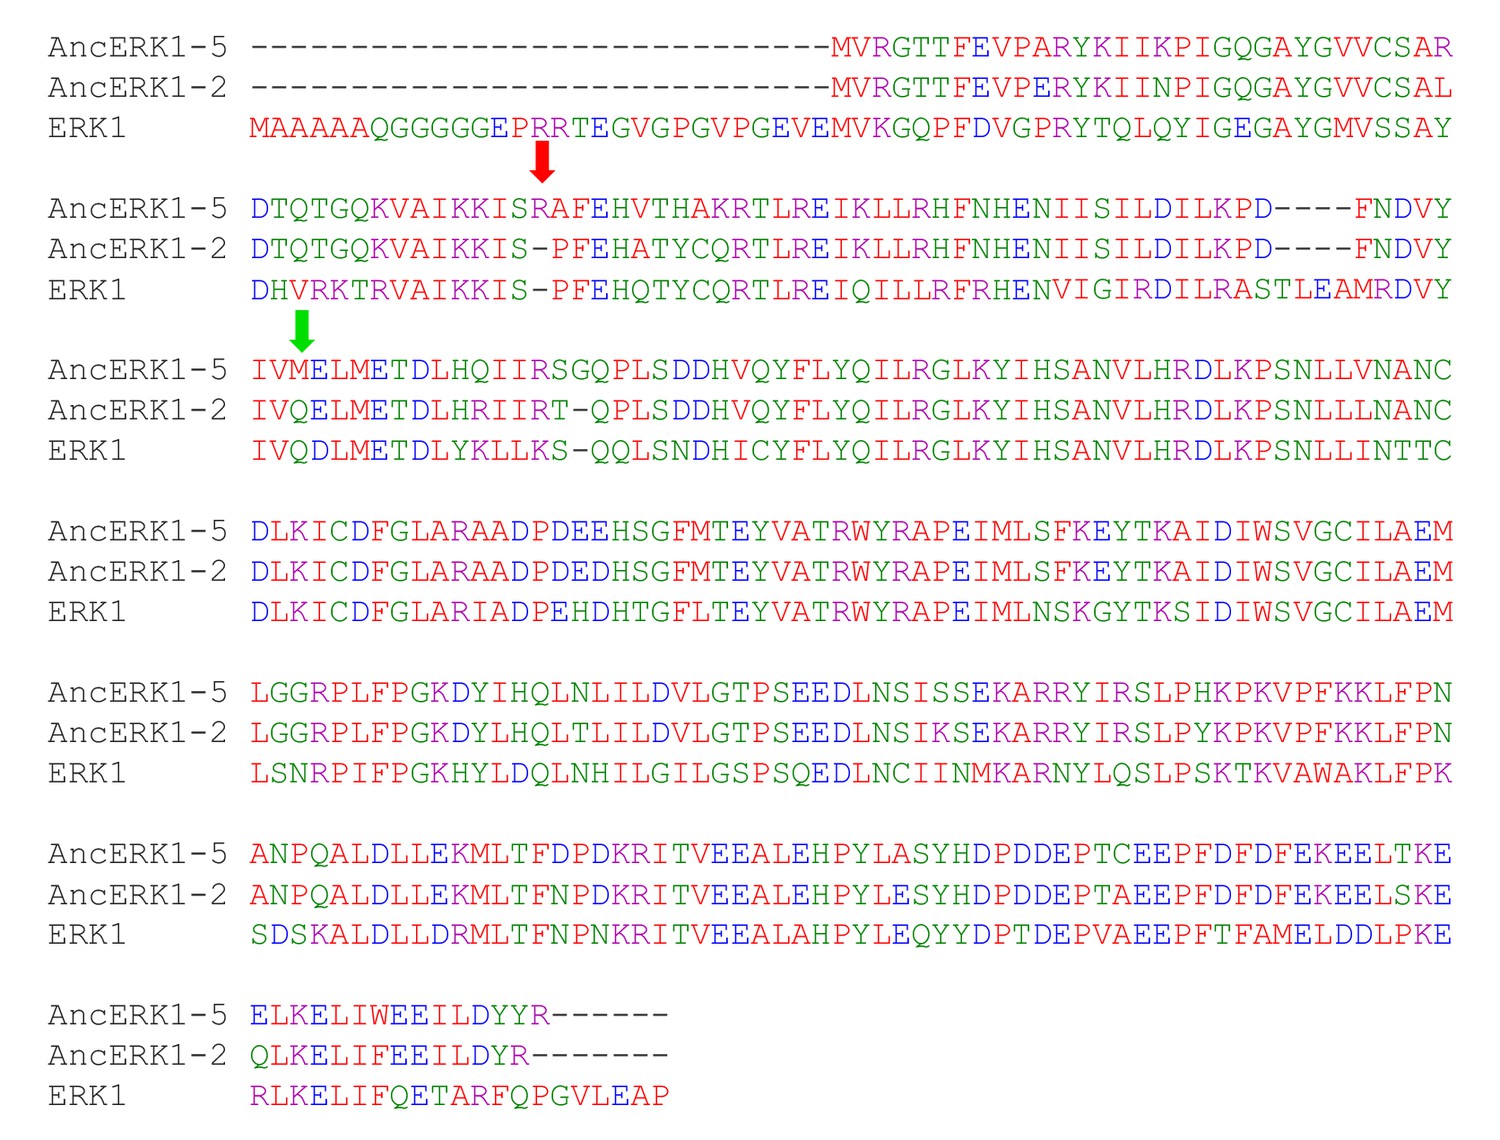
Sequence alignment of Reconstructed ERK1-2 kinase ancestors and modern ERK1.
Primary sequences of the core kinase domains of inferred ancestors and modern ERK1 were aligned using MUSCLE (http://www.ebi.ac.uk/Tools/msa/muscle/). The ‘TEY’ motif is indicated by the red box. The red and green arrows indicate the inferred evolutionary changes that led to increased dependence of ERKs 1 and 2 on MEK.
Figure 3 with 5 supplements
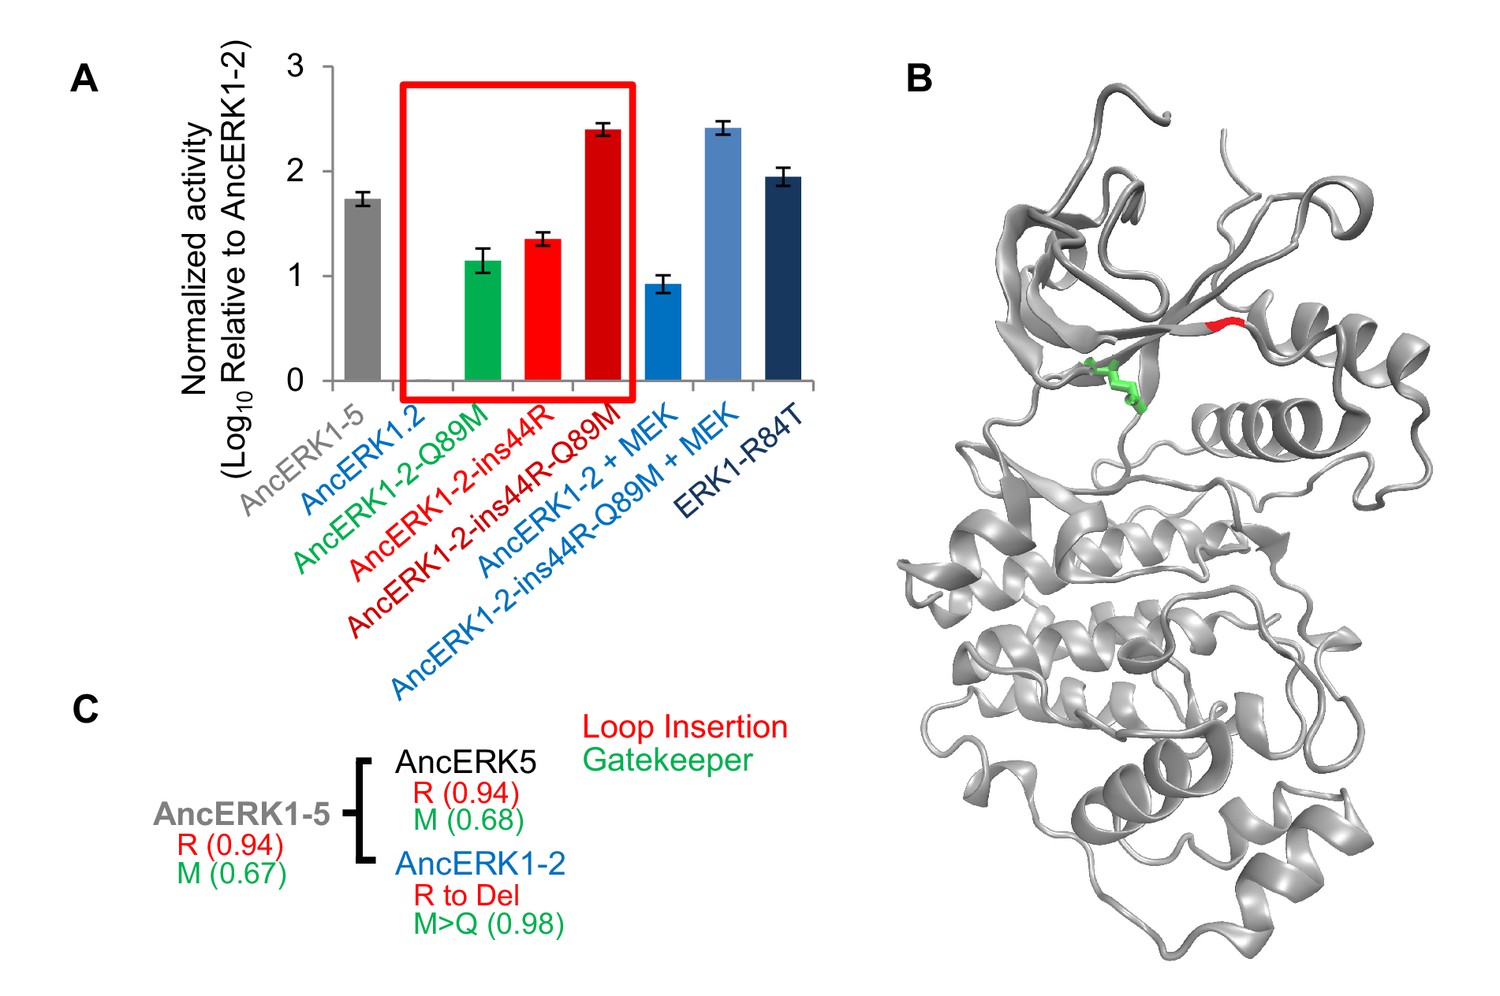
Shortening of the linker loop and mutation of the gatekeeper residue led to tight regulation in the ERK1-2 family.
(A) Kinase assays comparing the activity of two evolutionary mutants to the activity of AncERK1-2 before and after preincubation with active MEK kinase (log10 rate MBP phosphorylation). Error bars indicate ± SD, n = 3. (B) Positions of the two evolutionary mutations modeled on the ERK2 structure (PDB 1ERK). The gatekeeper residue, Q122, is shown in green, and the location of the 74N insertion is shown in red. (C) Phylogenetic tree indicating the state of the β3-αC insertion and identity of gatekeeper residues during evolution of the AncERK1-5 group. Numbers in the brackets indicate the posterior probability for ancestral reconstructions.
Figure 3—figure supplement 1
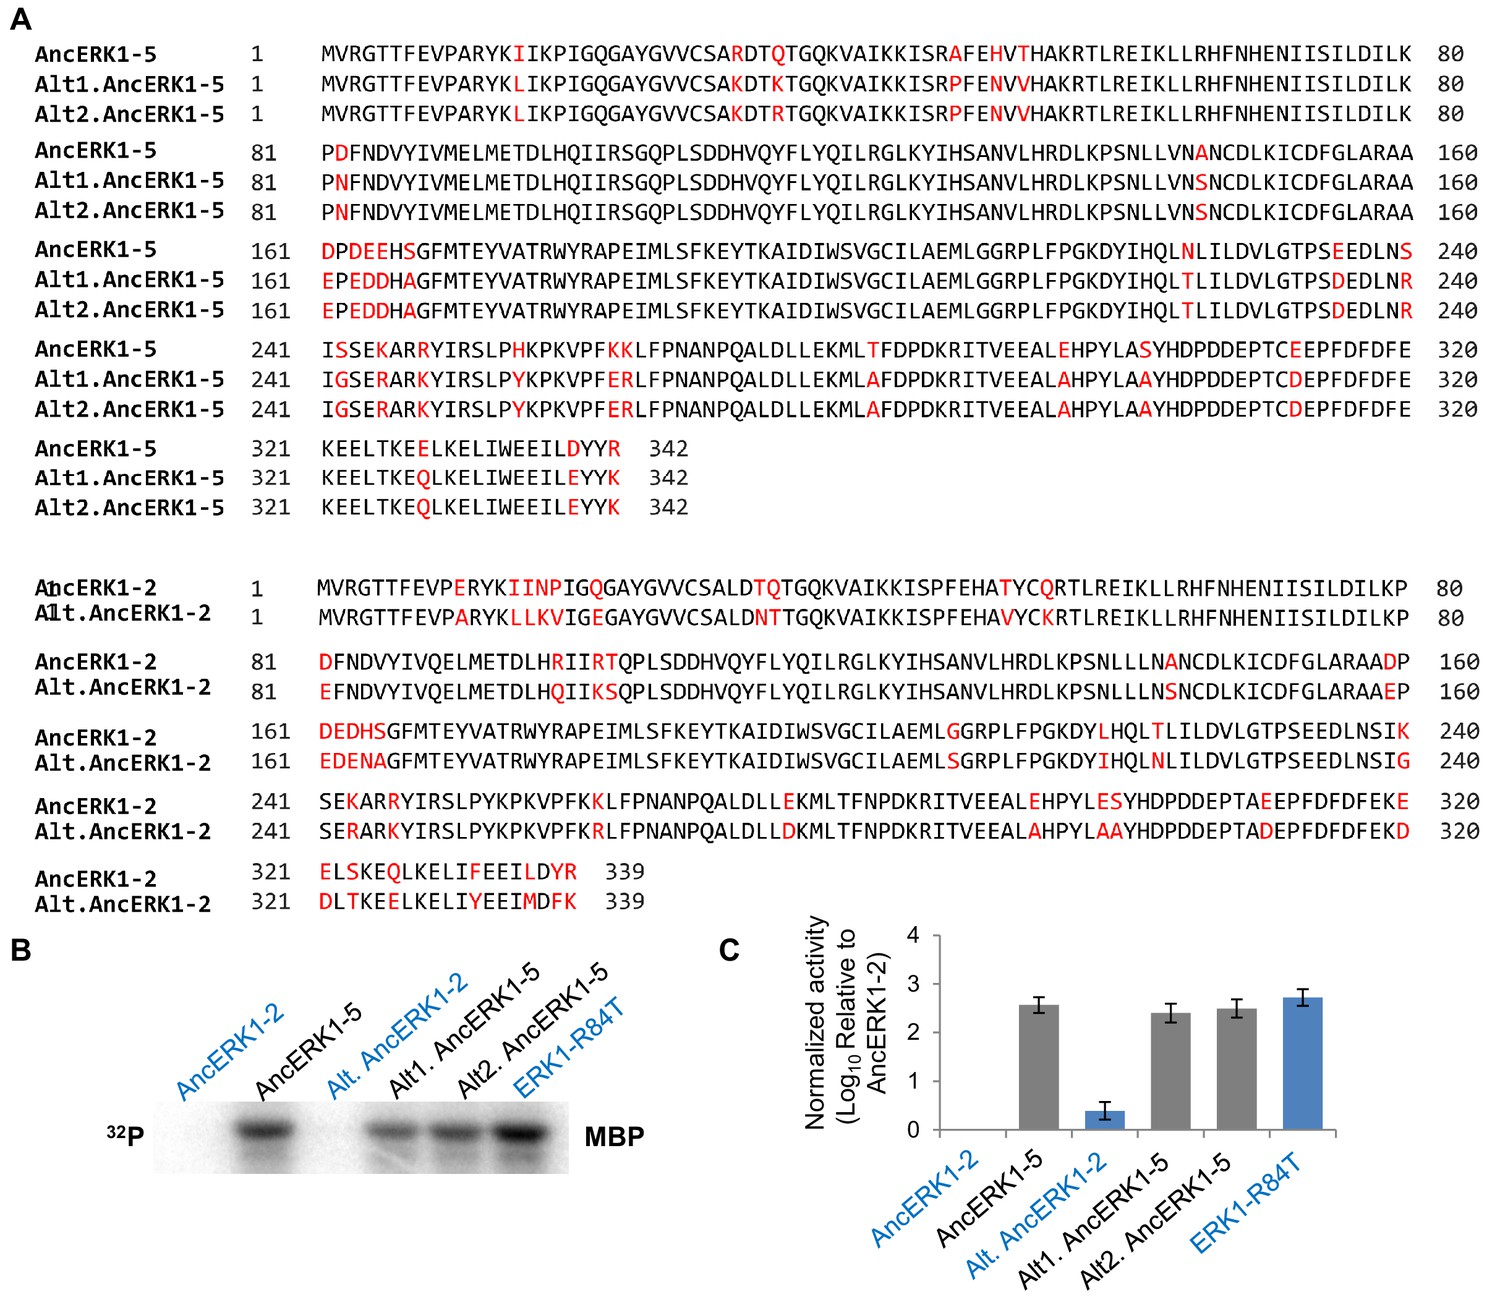
Activities of inferred ancestors are robust to uncertainties in reconstruction.
(A) Alignment of alternative reconstructed ancestral kinases. Plausible alternate states with Posterior Probability (PP) >0.2 were all included in the alternate reconstructions (Alt.AncERK1-2 and Alt.AncERK1-5). As there were two alternate states with PP >0.2 at the residue 34 in AncErk1-5, two alternative inferred ancestors of AncERK1-5 were constructed (Alt1.AncERK1-5 and Alt2.AncERK1-5). Residues that were alternatively sampled are labeled in red. (B and C) Kinase assays measuring the activity of two alternative reconstructions of AncERK1-5 and one alternative reconstruction of AncERK1-2, normalized to the activity of AncERK1-2 (log10 scale). Error bars indicate ± SD, n = 3.
Figure 3—figure supplement 2
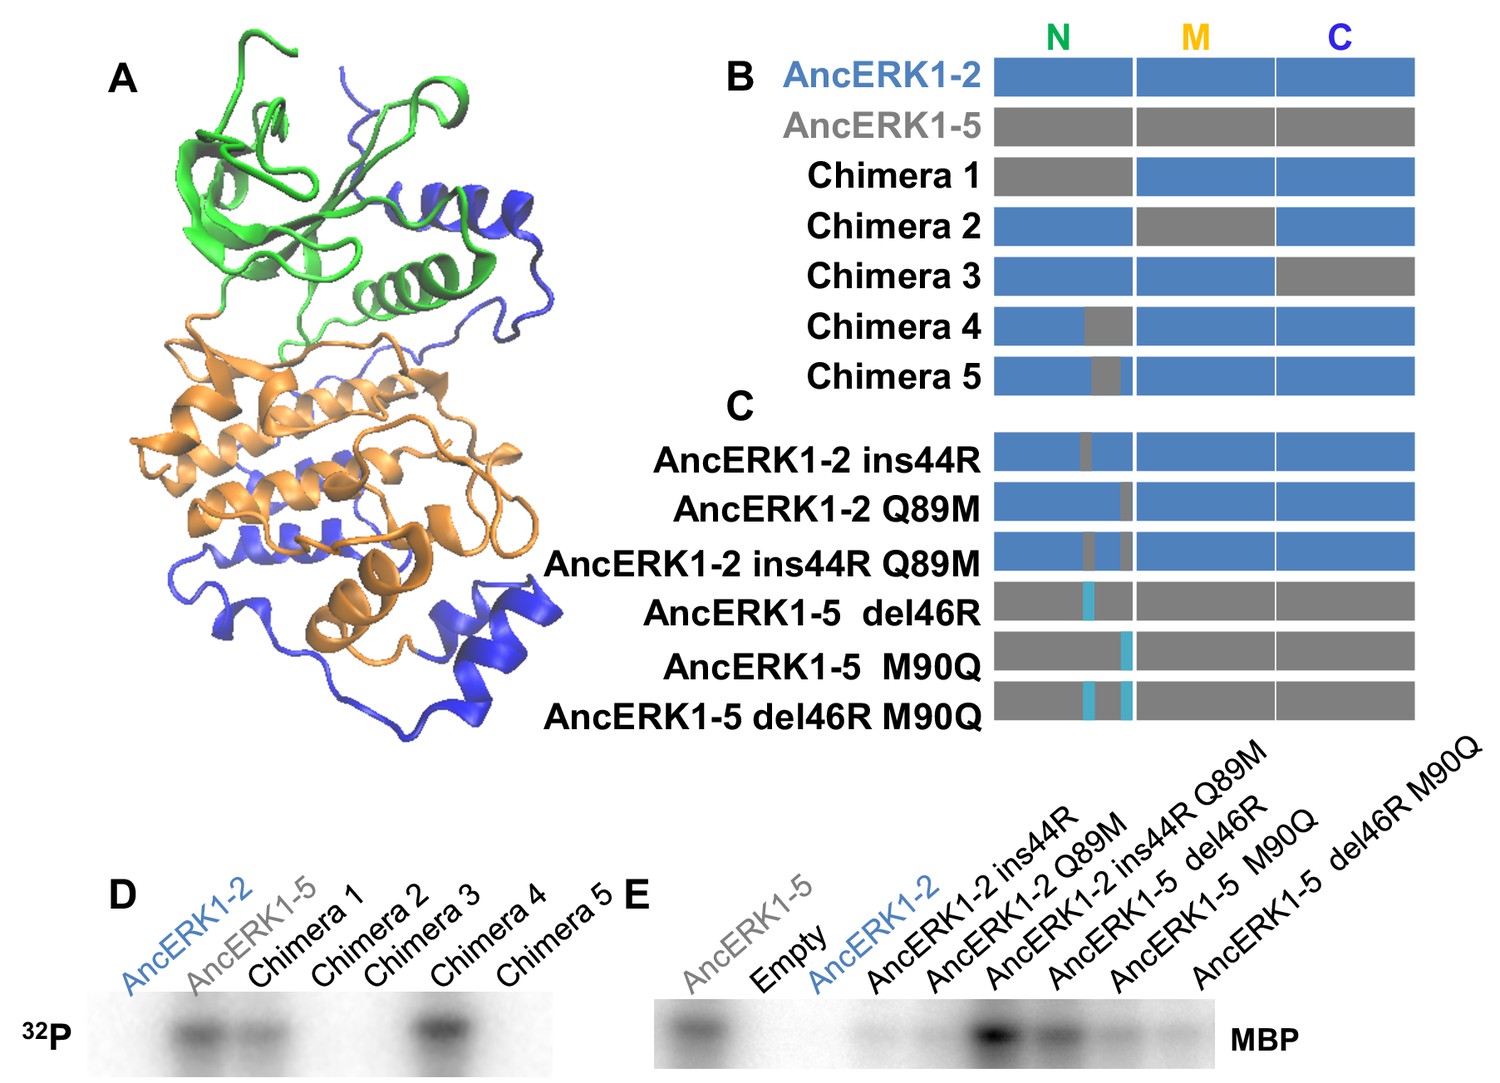
Identification of the evolutionary mutations mediating the decrease in basal activity between AncERK1-5 and AncERK1-2.
(A) Kinase domains were divided into N-terminal (green), middle (orange) and C-terminal sections (blue). (B and C) Summary of the chimeric constructs and mutations used to map the mutations that caused a change in the basal activity of inferred ancestors. Blue blocks derive from AncERK1-2, gray blocks from AncERK1-5. (D and E) Kinase assays to determine the basal activity of the chimeras and mutants towards MBP.
Figure 3—figure supplement 3
Alignments showing the position of the mutations that drove the transition in activity that occurred between AncERK1-5 and AncERK1-2.
The insertion in the β3-αC loop is indicated by a red arrow and the mutation at the gatekeeper residue is indicated by a green arrow.
Figure 3—figure supplement 4
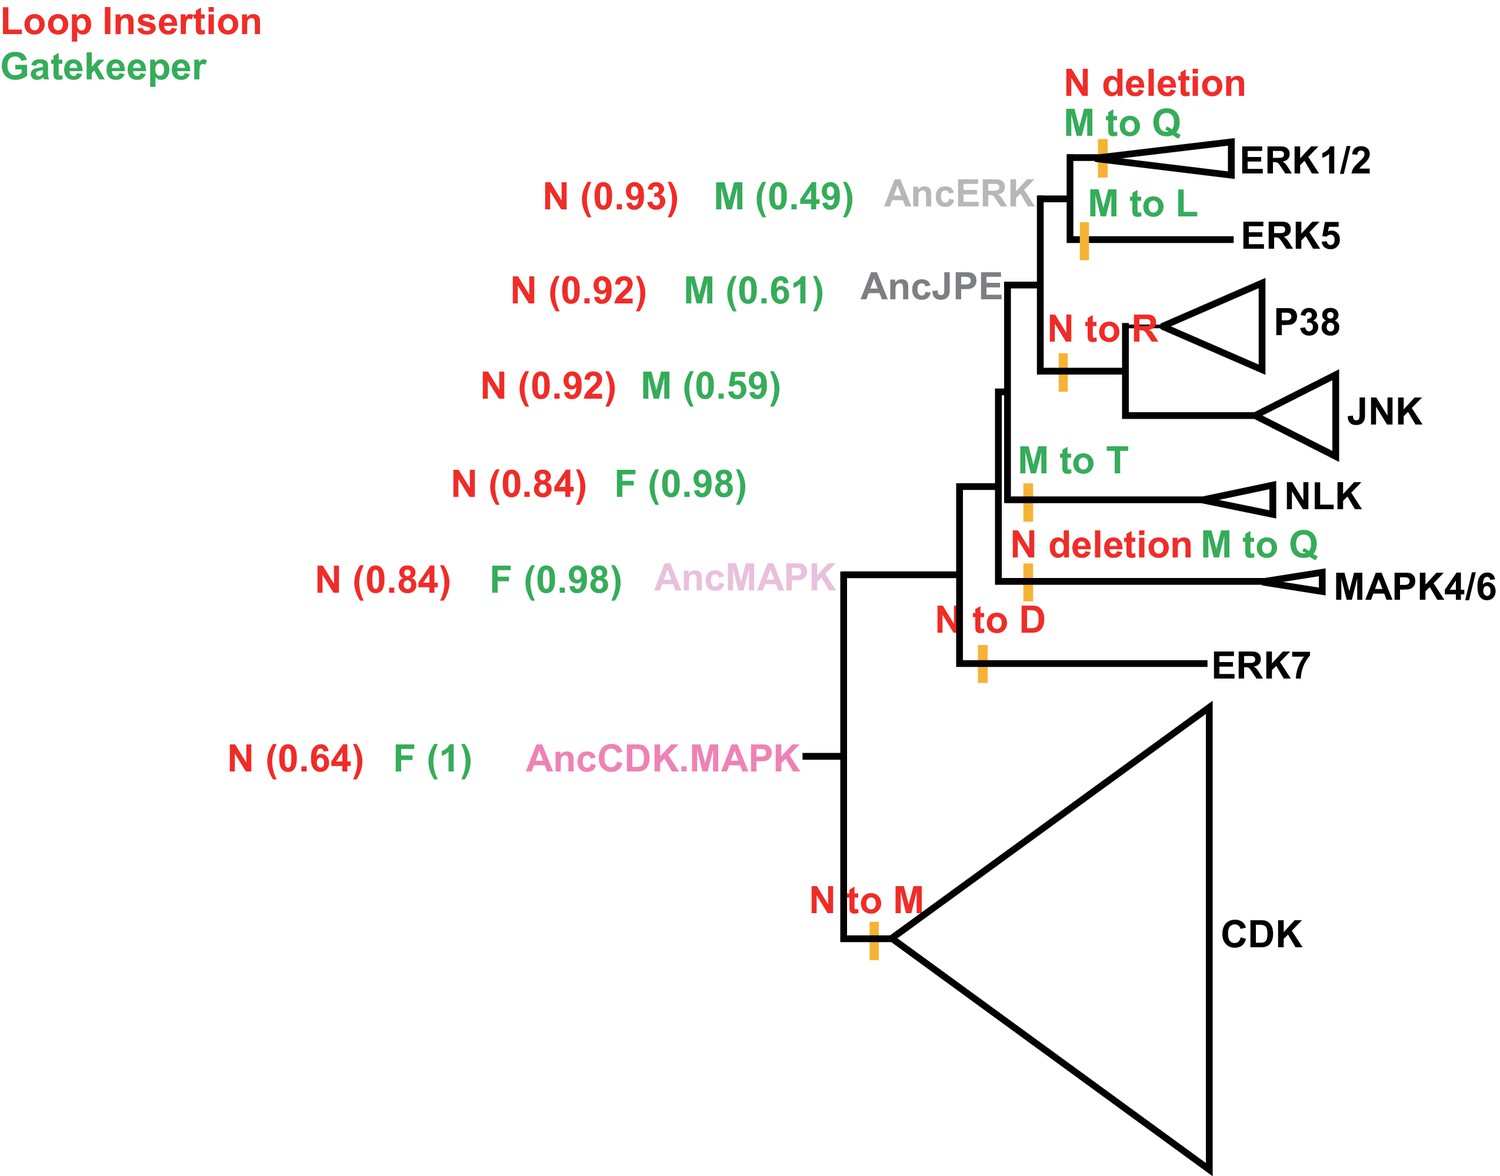
Phylogenetic tree indicating the mutations that occurred during the evolution from the inferred common ancestor of CDK and MAPK to modern kinases.
The status of the insertion (red) and identity of the gatekeeper residue (green) are indicated in the context of the CDK/MAPK group phylogenetic tree. The positions of ancestral nodes analyzed in this study are indicated by colored circles. Numbers in the brackets indicate the posterior probability for ancestral reconstructions. All posterior probabilities for the most recent evolutionary mutations are >0.99.
Figure 3—figure supplement 5
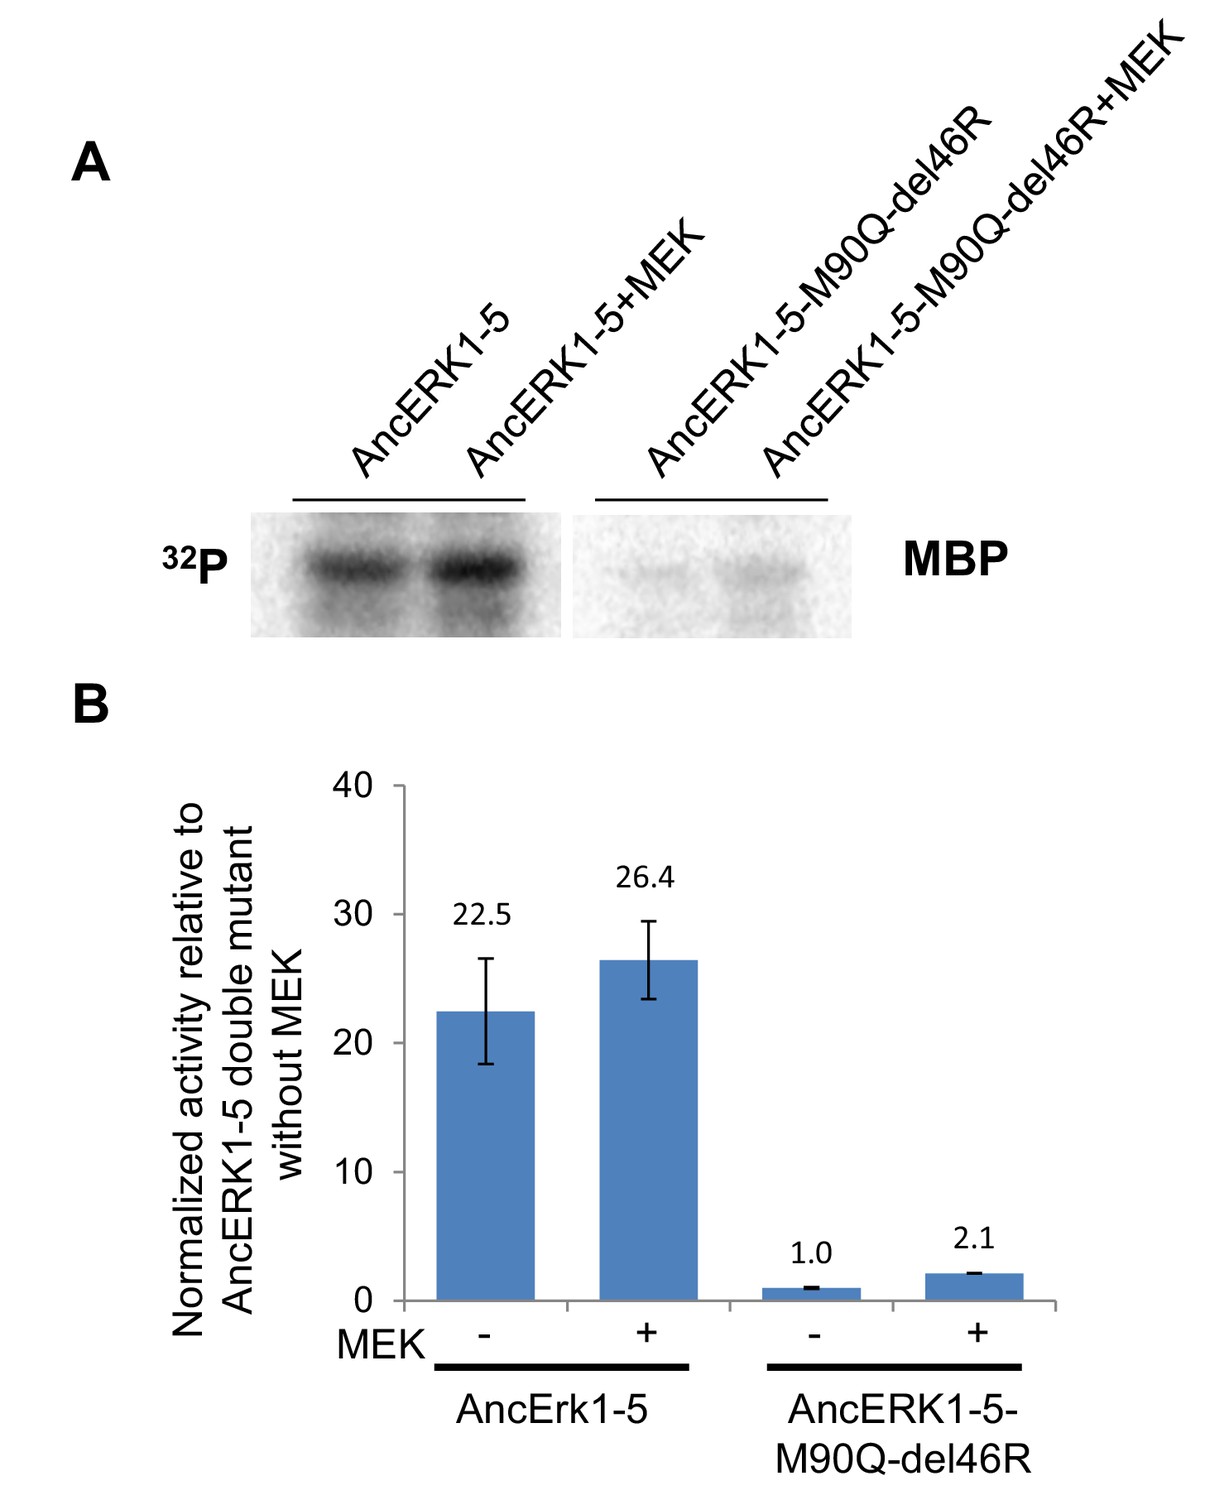
Slight activation of wildtype AncERK1-5 and AncERK1-5 double mutant by MEK.
(A and B) Activities of wildtype AncERK1-5 and its double mutant (M89Q del46R) by MEK was determined by in vitro kinase assay with MBP as a substrate. His6-AncERK1-5 and its double mutant were also coexpressed with MEK (no His tag) in E. coli, to determine the degree to which they could be activated. Error bars indicate ± SD, n = 3.
Figure 4 with 4 supplements

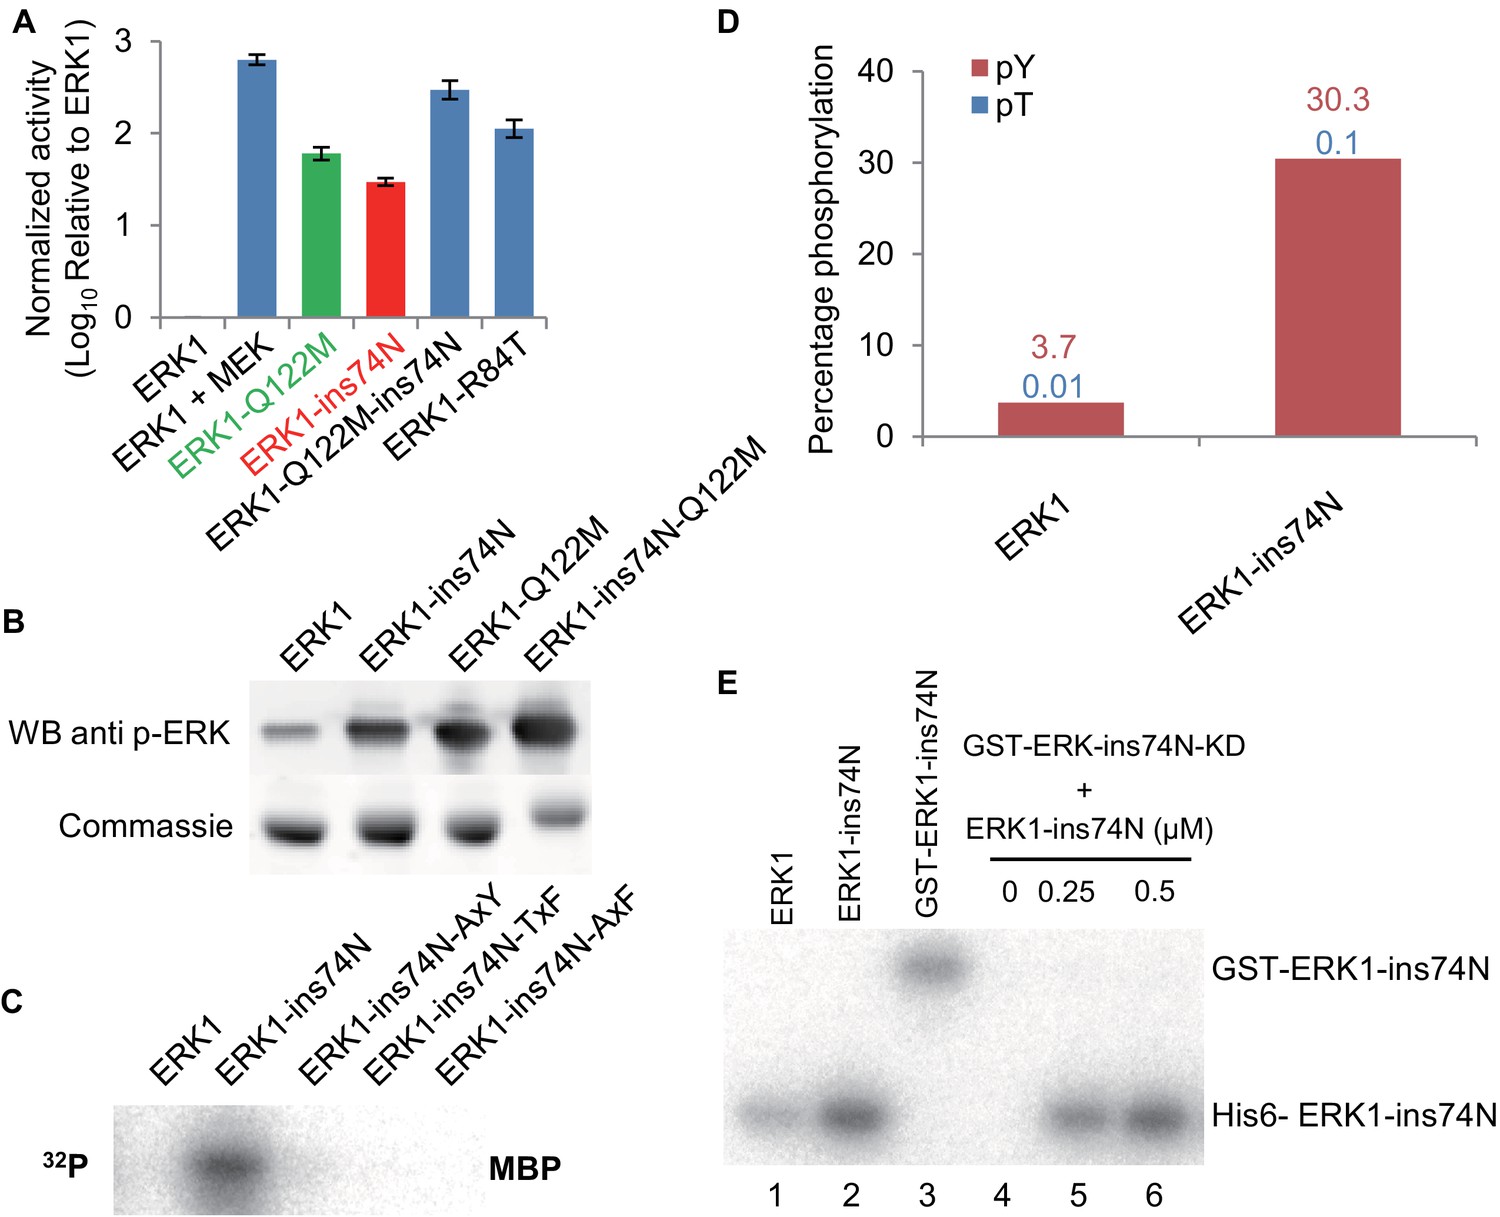
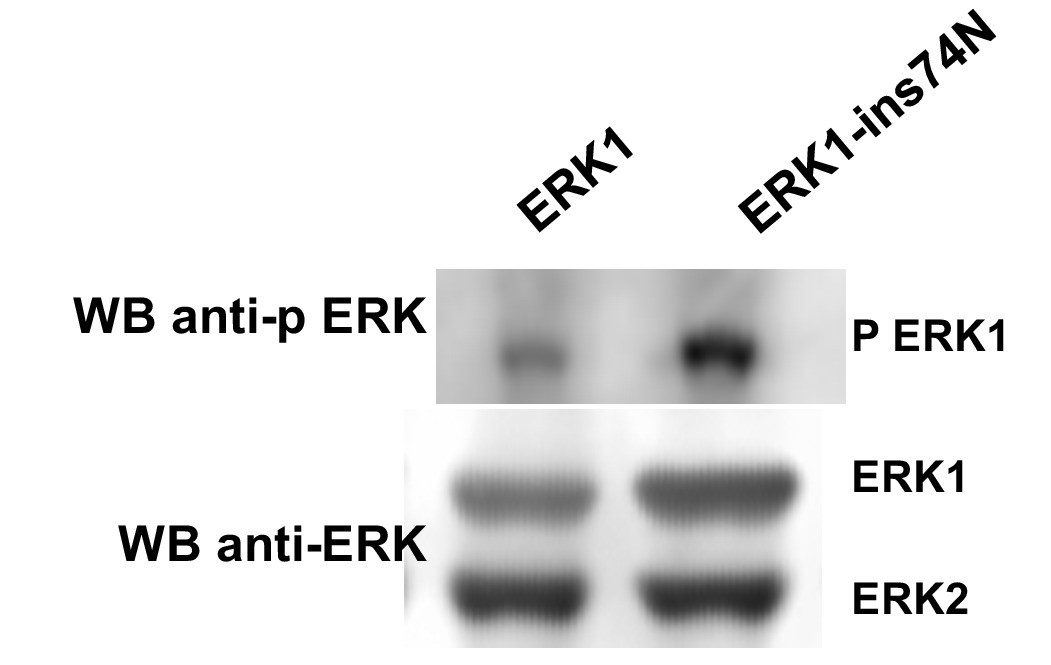
Reversing evolutionary mutations leads to activation of modern ERK1 through cis-autophosphorylation of the TEY motif.
(A) Kinase assays measuring activity of modern ERK1 and mutants that revert the β3-αC loop length and gatekeeper residue to the inferred ancestral state (log10 rate of MBP phosphorylation relative to ERK1). Error bars indicate ± SD, n = 3. (B) Western blots indicating degree of phosphorylation of the residues in the kinase activation loop (top), Coomassie brilliant blue loading control (bottom). (C) Activity of ERK-ins74N mutant and its ‘TEY’ mutants towards MBP. (D) Quantification of the phosphorylation level of the ‘TEY’ motif in ERK1 wildtype and ins74N mutant by LC/MS analysis of tryptic peptides. (E) Autophosphorylation assay. 0.5 µM Erk kinase and its mutants were incubated with kinase assay buffer without substrate. The ERK1 kinase and the ins74N mutant were tagged with either His6 (lanes 1 and 2) or GST (lane 3, the GST tag was used to alter the mobility of kinase alleles allowing them to be distinguished on an SDS-PAGE gel). GST-ERK1-ins74N kinase dead K71R mutant (ins74N KD) was incubated without His6-ERK1-ins74N (lane 4), and with 0.25 µM or 0.5 µM His6-ERK1-ins74N (lanes 5 and 6).
Figure 4—figure supplement 1
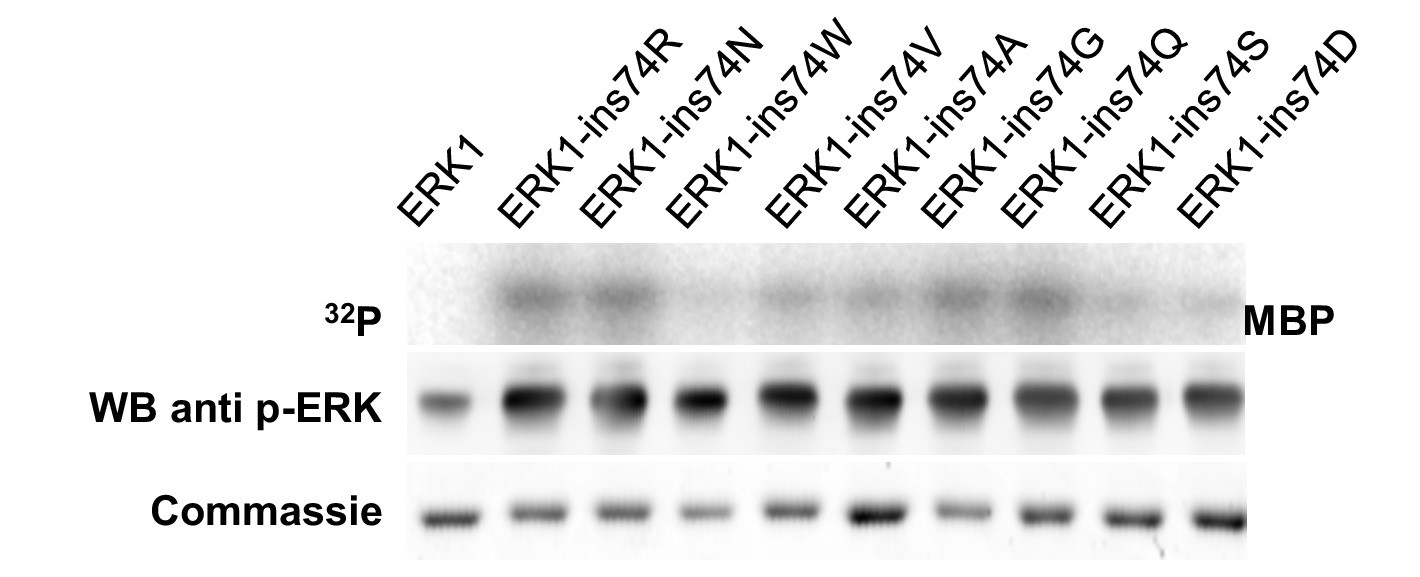
Other amino acid insertions after ERK1 residue 74 also increase basal activity.
Kinase assays measuring the activity of different amino acids insertions after residue 74 in the β3-αC loop (top), Western blot analysis of ‘TEY’ phosphorylation (middle). and Coomassie brilliant blue staining loading control (bottom).
Figure 4—figure supplement 2
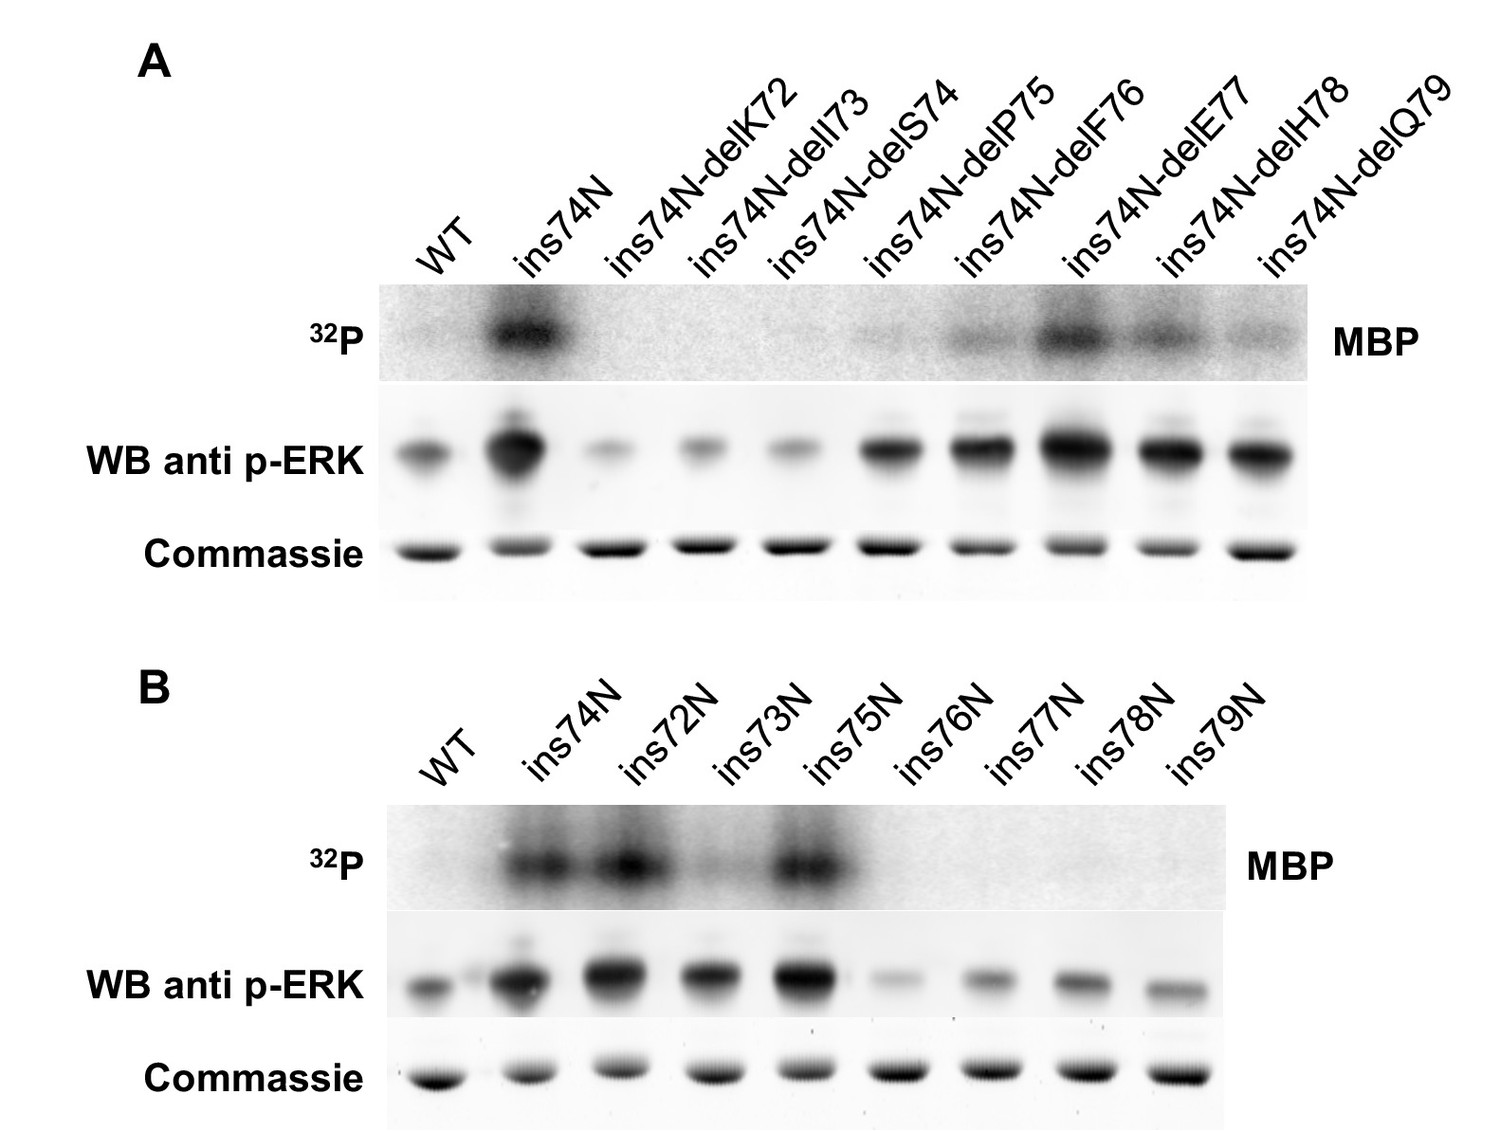
The length of the linker loop between K71 and P75 determines kinase activity.
(A) Kinase assays measuring the activity of several mutants starting with the Erk1-ins74N mutant and then deleting an amino acid at various positions along the the β3-αC loop (top), Western blot analysis of ‘TEY’ motif phosphorylation (middle), and Coomassie brilliant blue loading control (bottom) (B) Kinase assays measuring the activity of mutants with an asparagine insertion at various positions along the β3-αC loop (top), Western blot analysis of ‘TEY’ motif phosphorylation (middle), and Coomassie brilliant blue loading control (bottom).
Figure 4—figure supplement 3
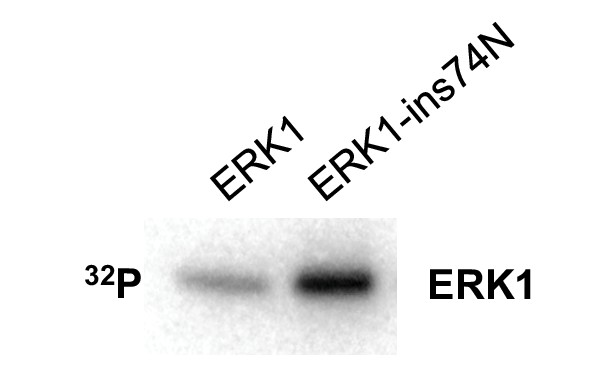
The ERK1 ins74N mutant has increased autophosphorylation on the TEY motif.
Autophosphorylation assay: purified ERK1 and ERK1-ins74N were incubated with kinase assay buffer for 30 min without substrate.
Figure 4—figure supplement 4
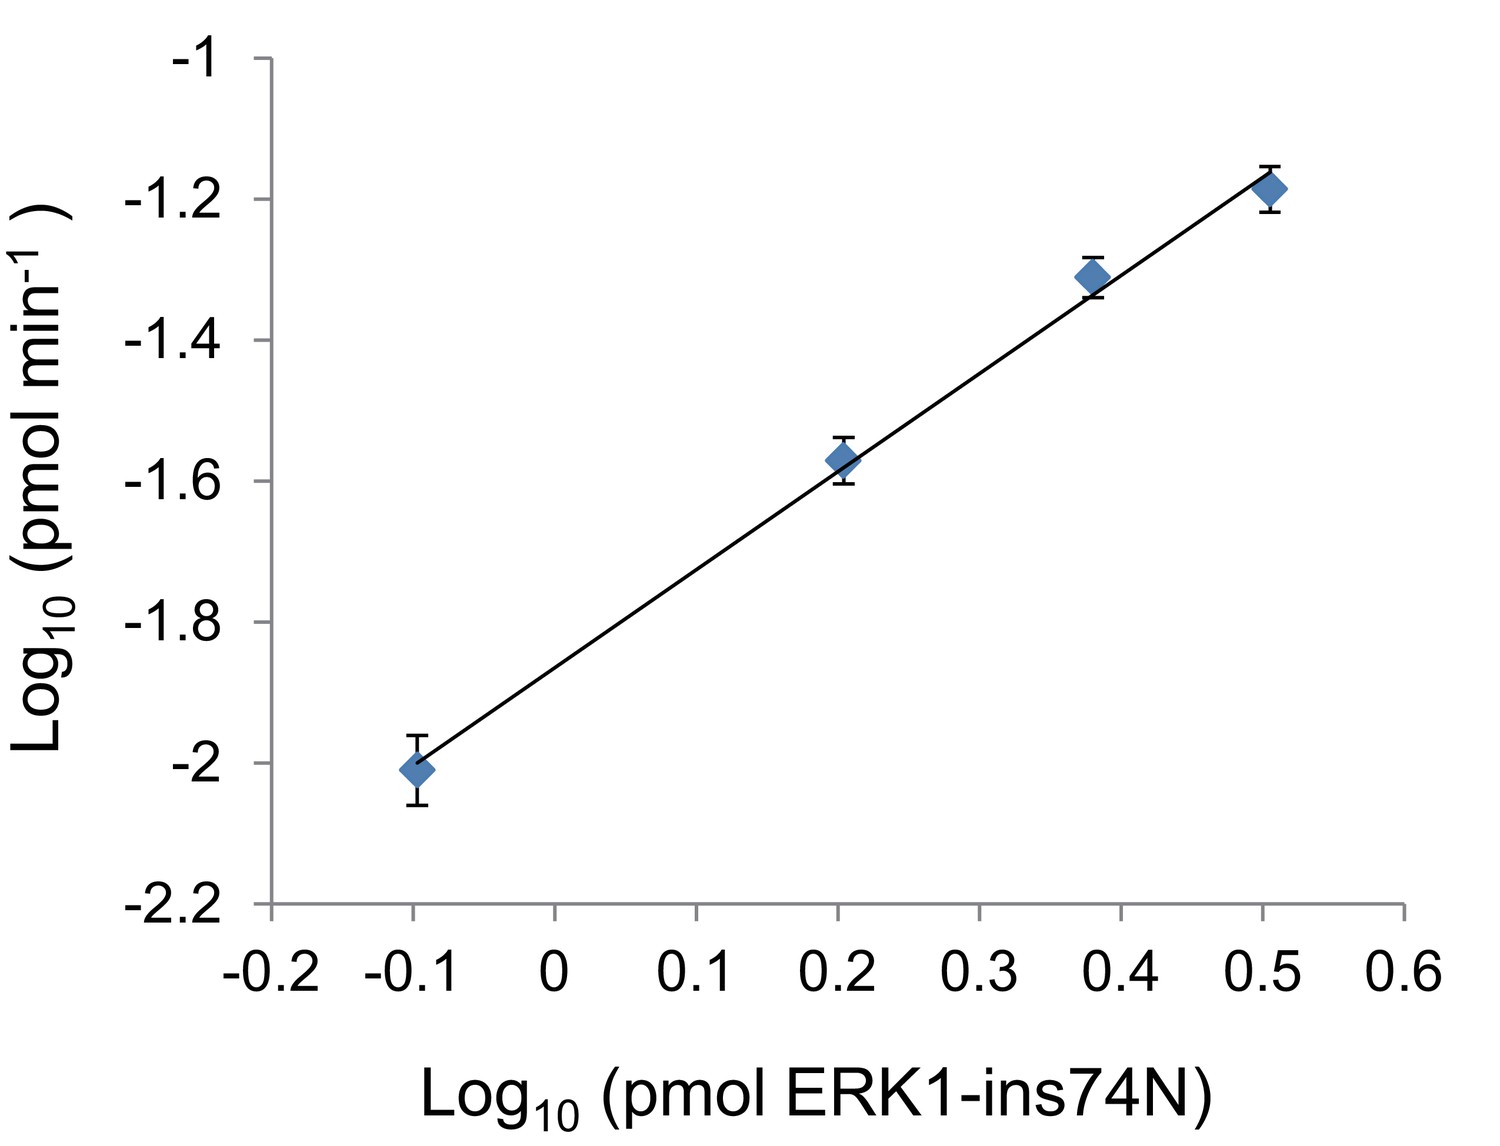
Autophosphorylation rate of ERK1-ins74N scales linearly with kinase concentration.
Autophosphorylation rates at varying concentrations of ERK1-ins74N.
Figure 5 with 7 supplements
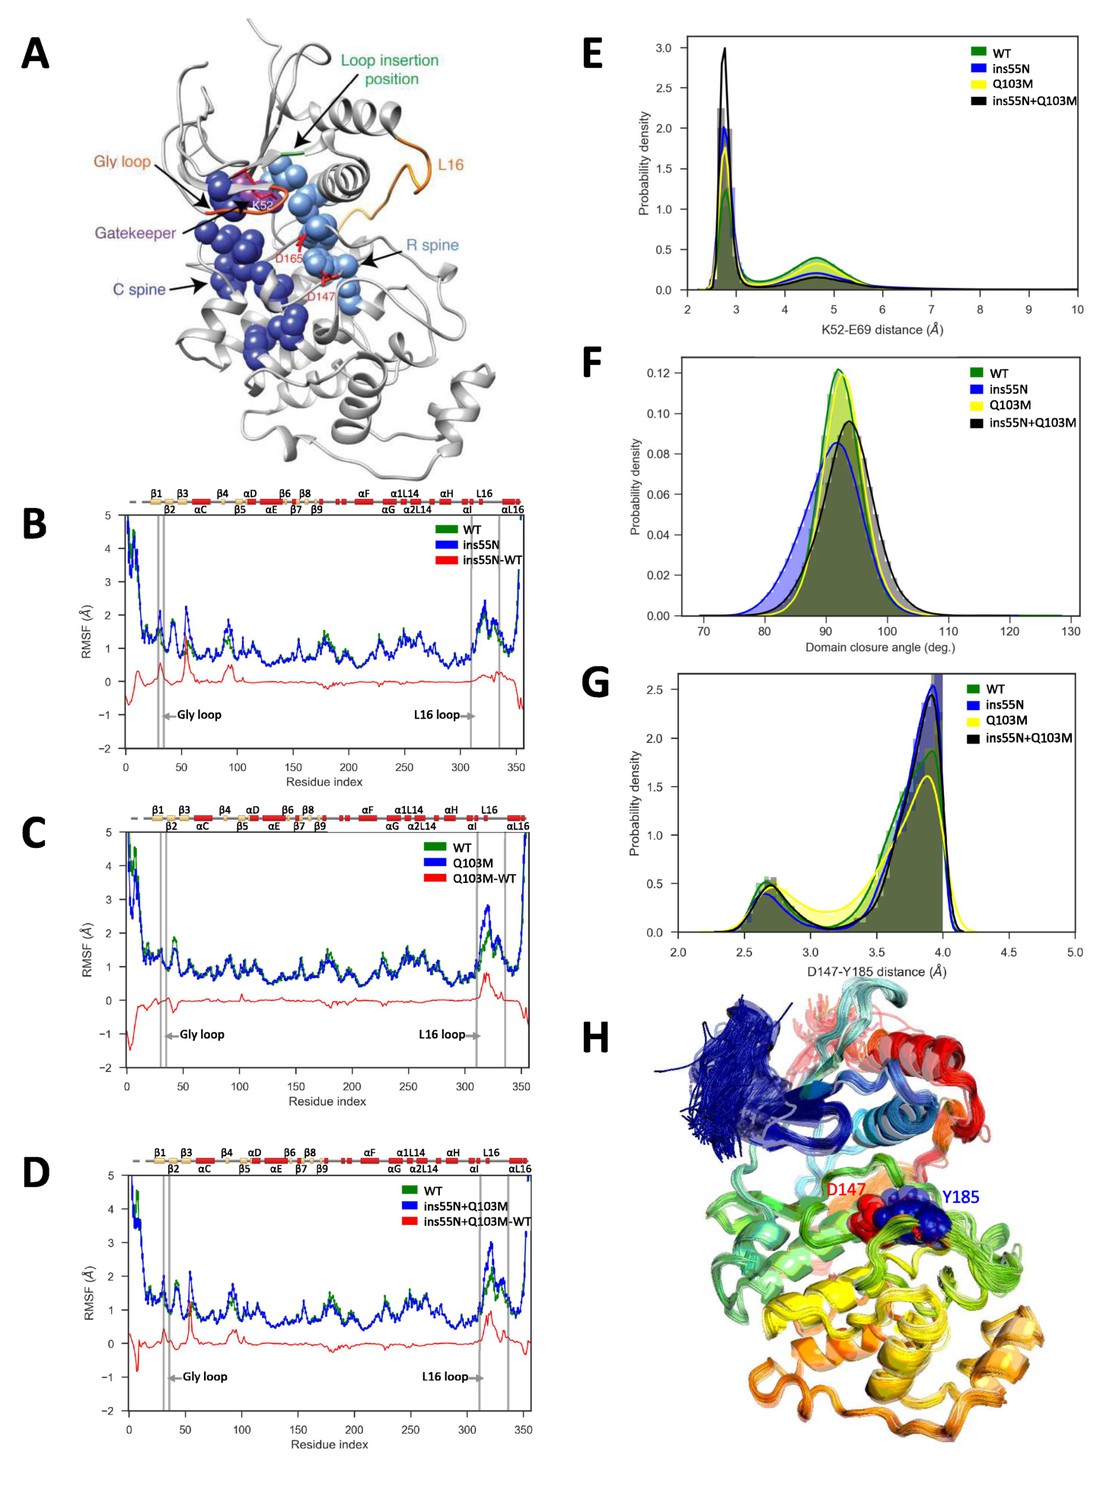
Molecular dynamics simulations of activated mutants show increased flexibility at the glycine rich loop and loop 16, and increased salt-bridge formation at the catalytic site.
(A) Structure of ERK2 with relevant features annotated: L16 – orange, Gly loop - dark orange, C spine - dark blue, R spine - light blue, gatekeeper residue – purple, catalytic residues (K52, D147 and D165) – red, and loop insertion position – green. (B–D) Root mean square fluctuations (RMSF, error bars indicating 95% confidence intervals of the means are plotted but are too small to see): Wild type – green, mutant – blue and difference between mutant and WT – red. (B) ERK2-ins55N (ß3-αC loop insertion mutant) (C) ERK2-Q103M (gatekeeper residue mutant) (D) ERK2-ins55N-Q103M (double mutant). (E) Probability density of salt-bridge between ß3-lysine and αC-glutamate, K52–E69. (F) Distribution of domain closure angles. (G) Probability density of distances < 4 Å between Y185 of the ‘TxY’ motif and active site D147H: Wild type – green, ERK2-ins55N – blue, ERK2-Q103M – yellow and ERK2-ins55N-Q103M – black. (H). Top 100 conformations of ERK2-WT with smallest Y185-D147 distance. D147 (red) and Y185 (blue) are shown as spheres.
Figure 5—figure supplement 1
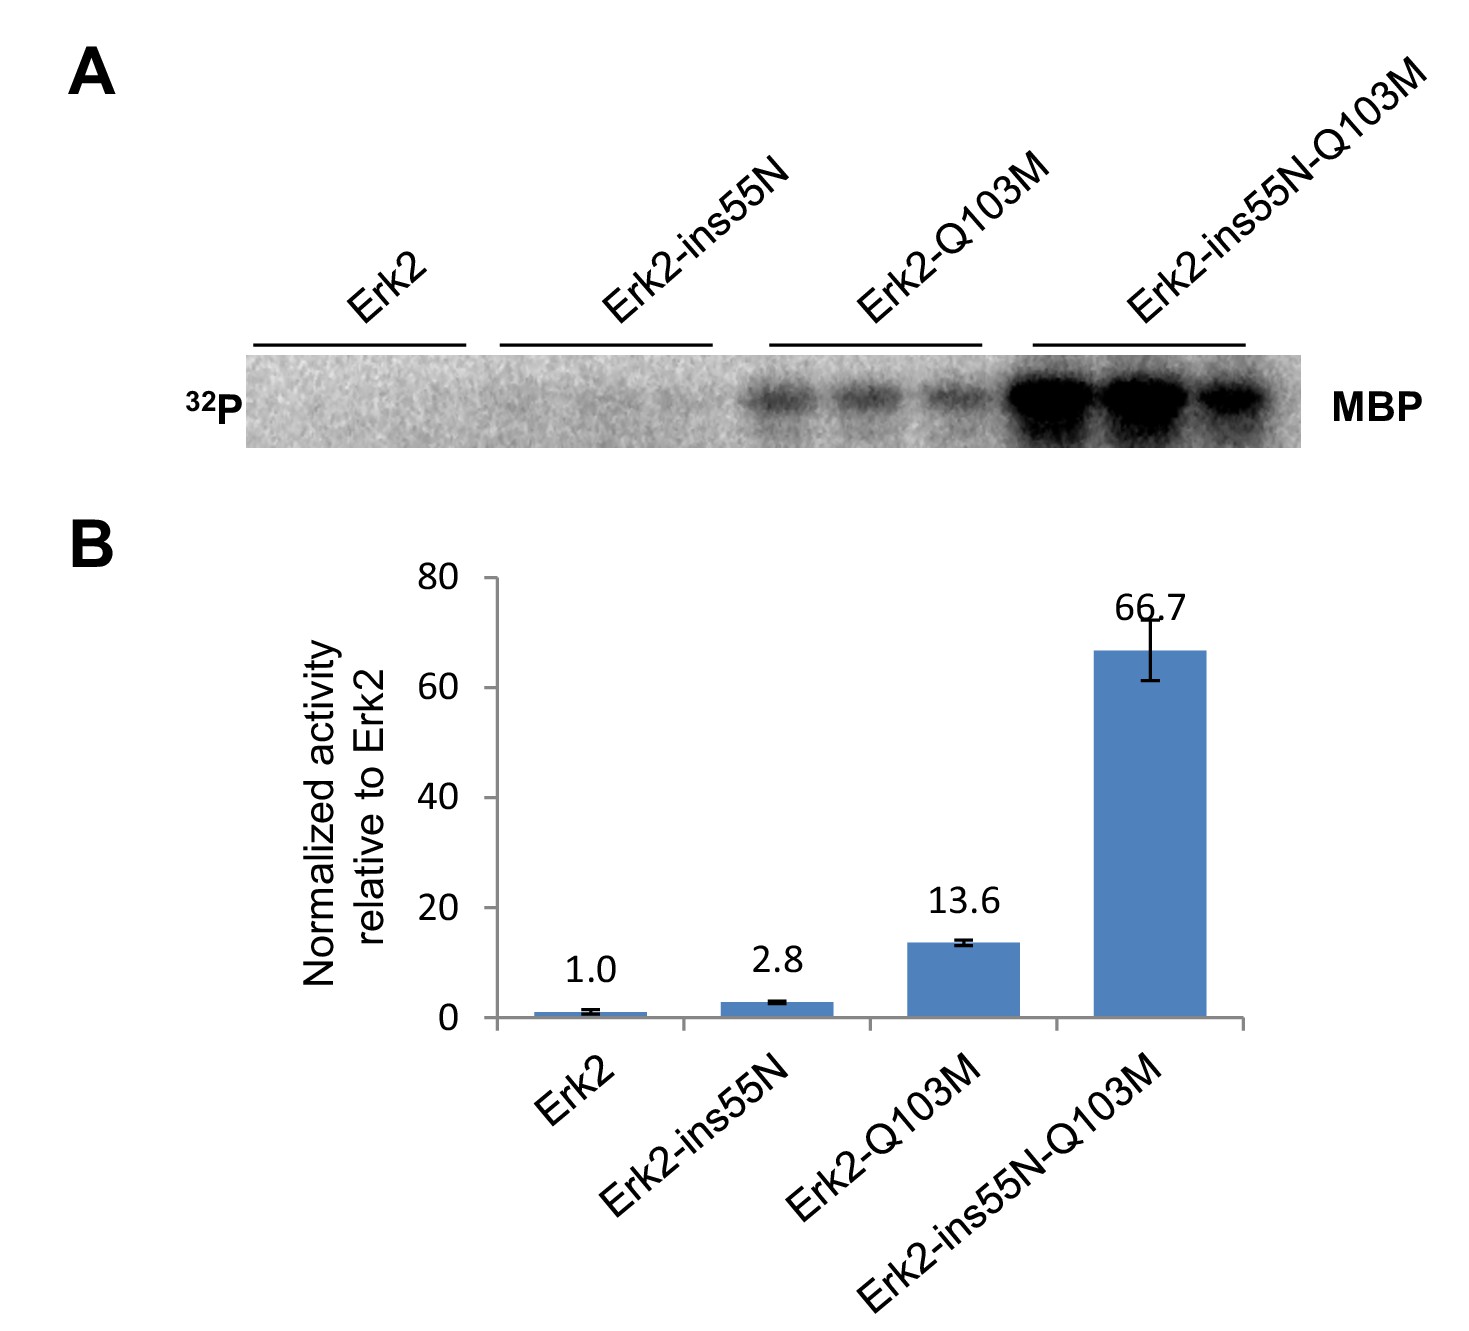
Reversion of evolutionary mutations also activates ERK2.
Kinase assays measuring activity of modern ERK2 and ERK2 with loop insertion and gatekeeper mutations that convert the kinase to inferred ancestral states. MBP was used as a substrate.
Figure 5—figure supplement 2
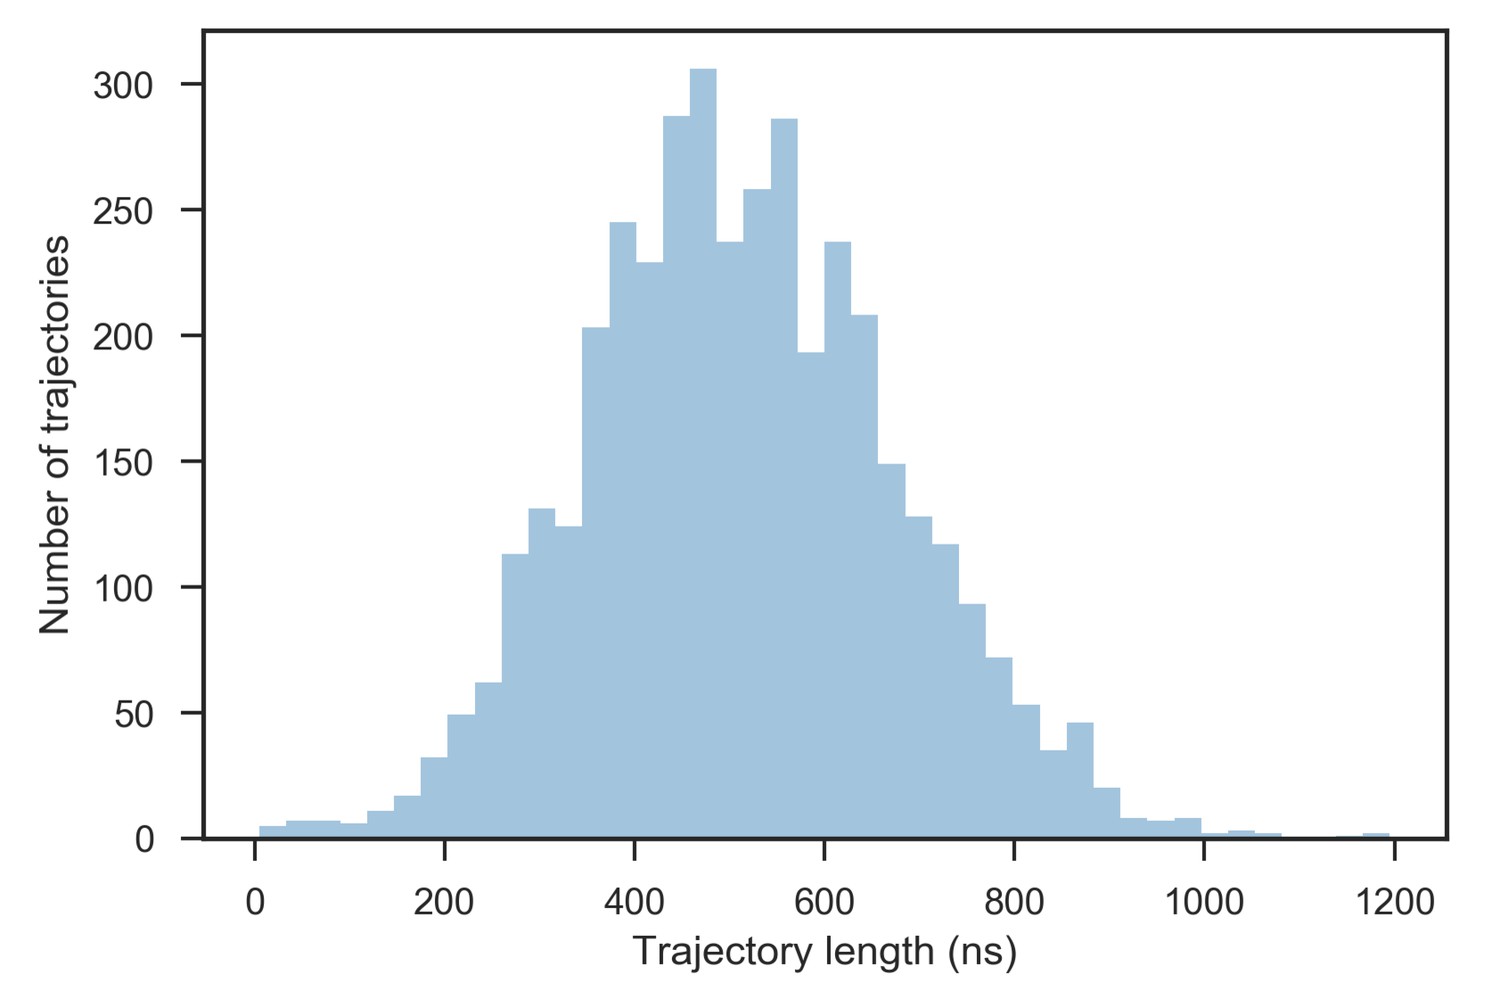
Distribution of trajectory lengths.
3999 trajectories were collected in total and propagated until at least 500 μs of simulation time for each system had been collected, resulting in the grand total of 2.05 ms of simulation time and 4,104,841 frames. The average trajectory length was 513 ns.
Figure 5—figure supplement 3
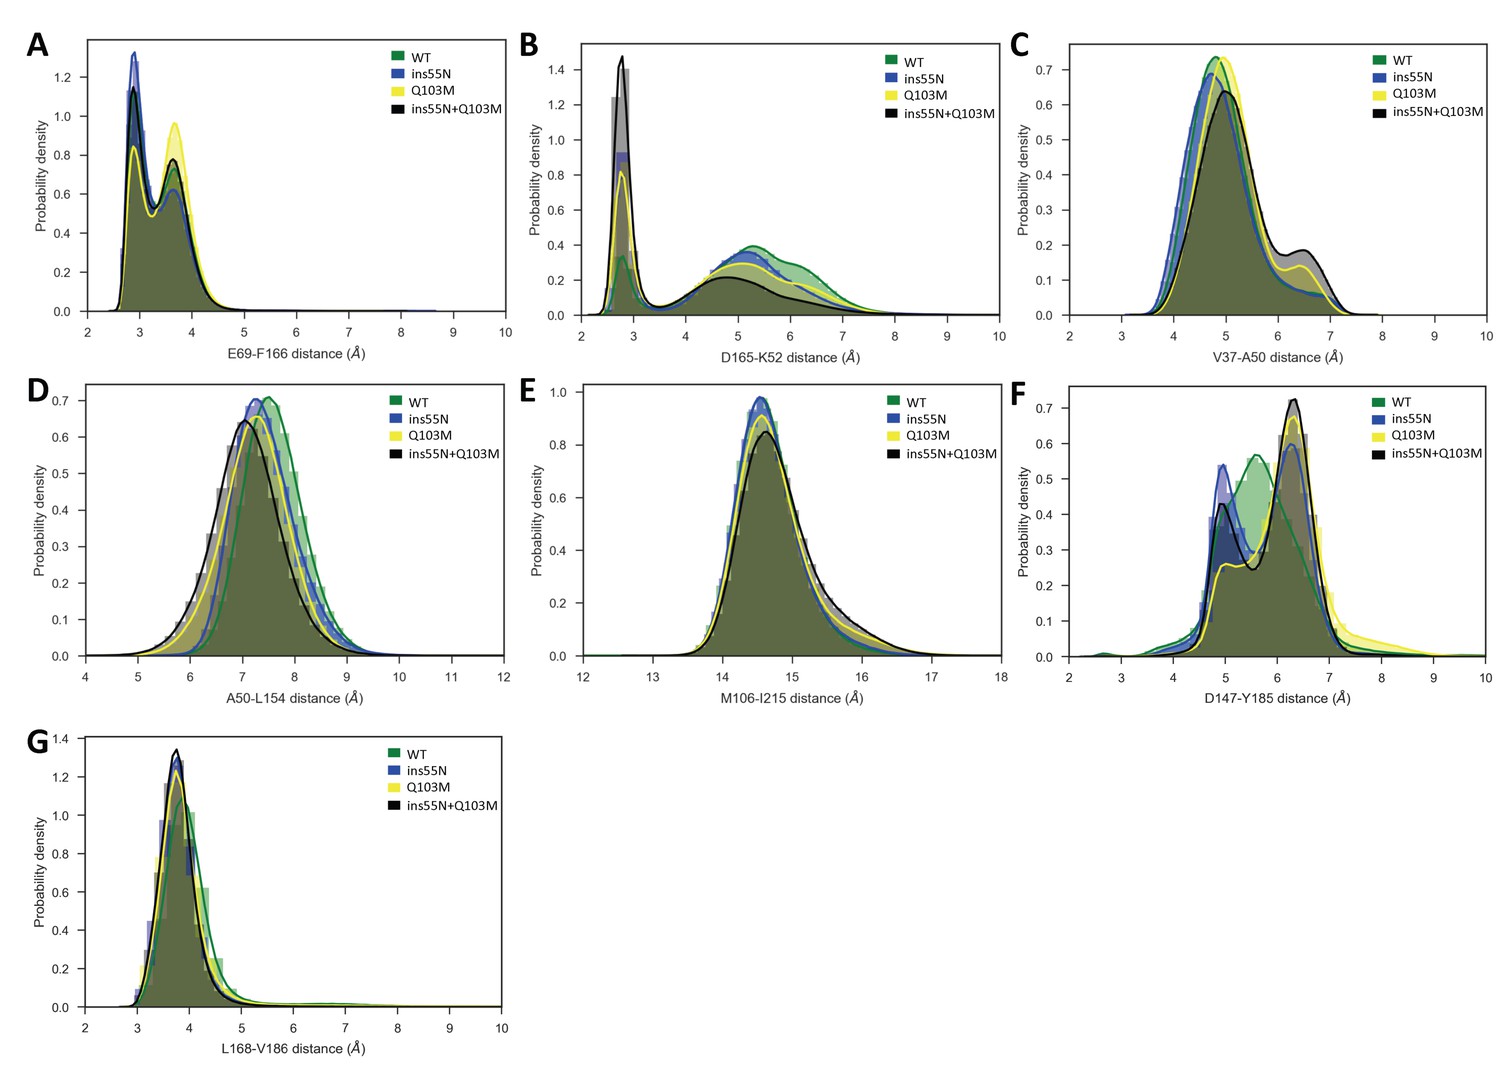
Probability densities of various inter-residue distances in the catalytic site.
(A, B), catalytic spine (C–E) and activation segment (F, G) in ERK2 WT and mutants. Wild type (WT) – green, ERK2-ins55N – blue, ERK2-Q103M – yellow and ERK2-ins55N + Q103M – black.
Figure 5—figure supplement 4
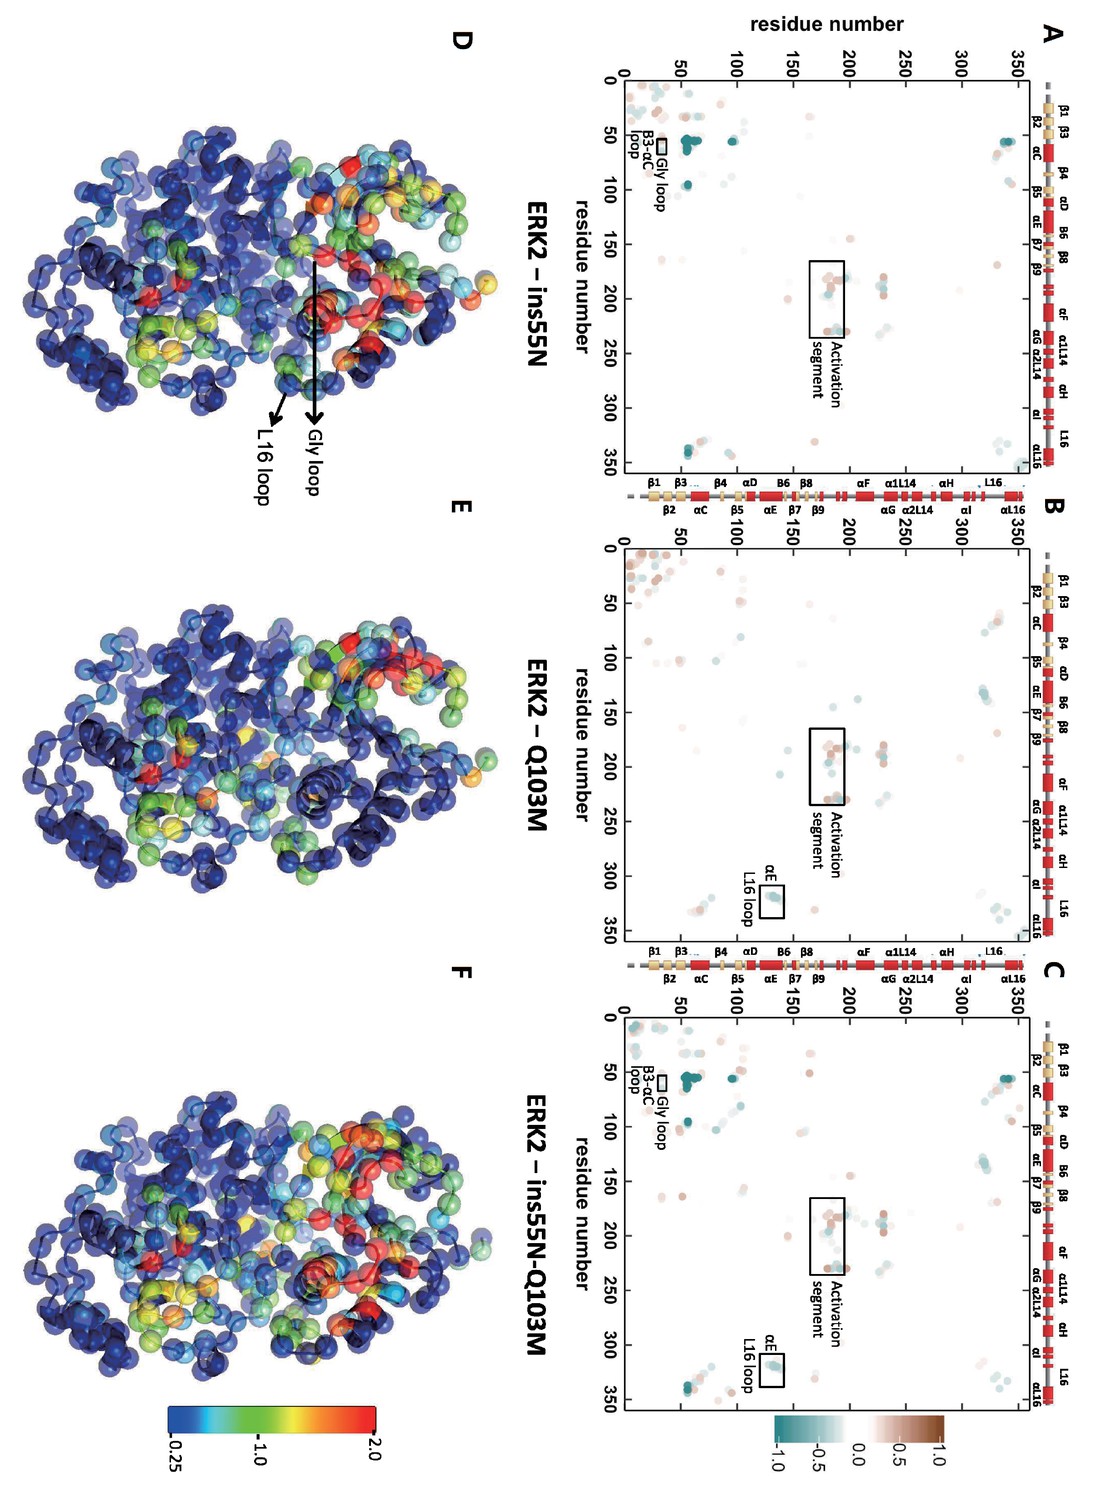
Differential contacts between ERK2 mutants and wild type (WT).
(A–C) Differential contact maps. Red represents gain of contact probability in mutant and blue represents decreased contact probability. (D–F) Structural map of contact changes. The sum of absolute contact changes is projected onto alpha carbons and the color scheme follows a standard rainbow 0.25–2 scale.
Figure 5—figure supplement 5
A 3-State Markov state model (MSM) indicates high contact disruption along the activation segment in the ERK2-Q103M mutant.
Each state is represented by 100 structures (smoothed) from the ERK2-Q103M system, colored by the absolute sum of contact changes per residue compared to WT, following the standard rainbow on a 0.25–2 scale. The Q103M mutation is represented by a red stick model. The frequency of each state is provided in the bar graph.
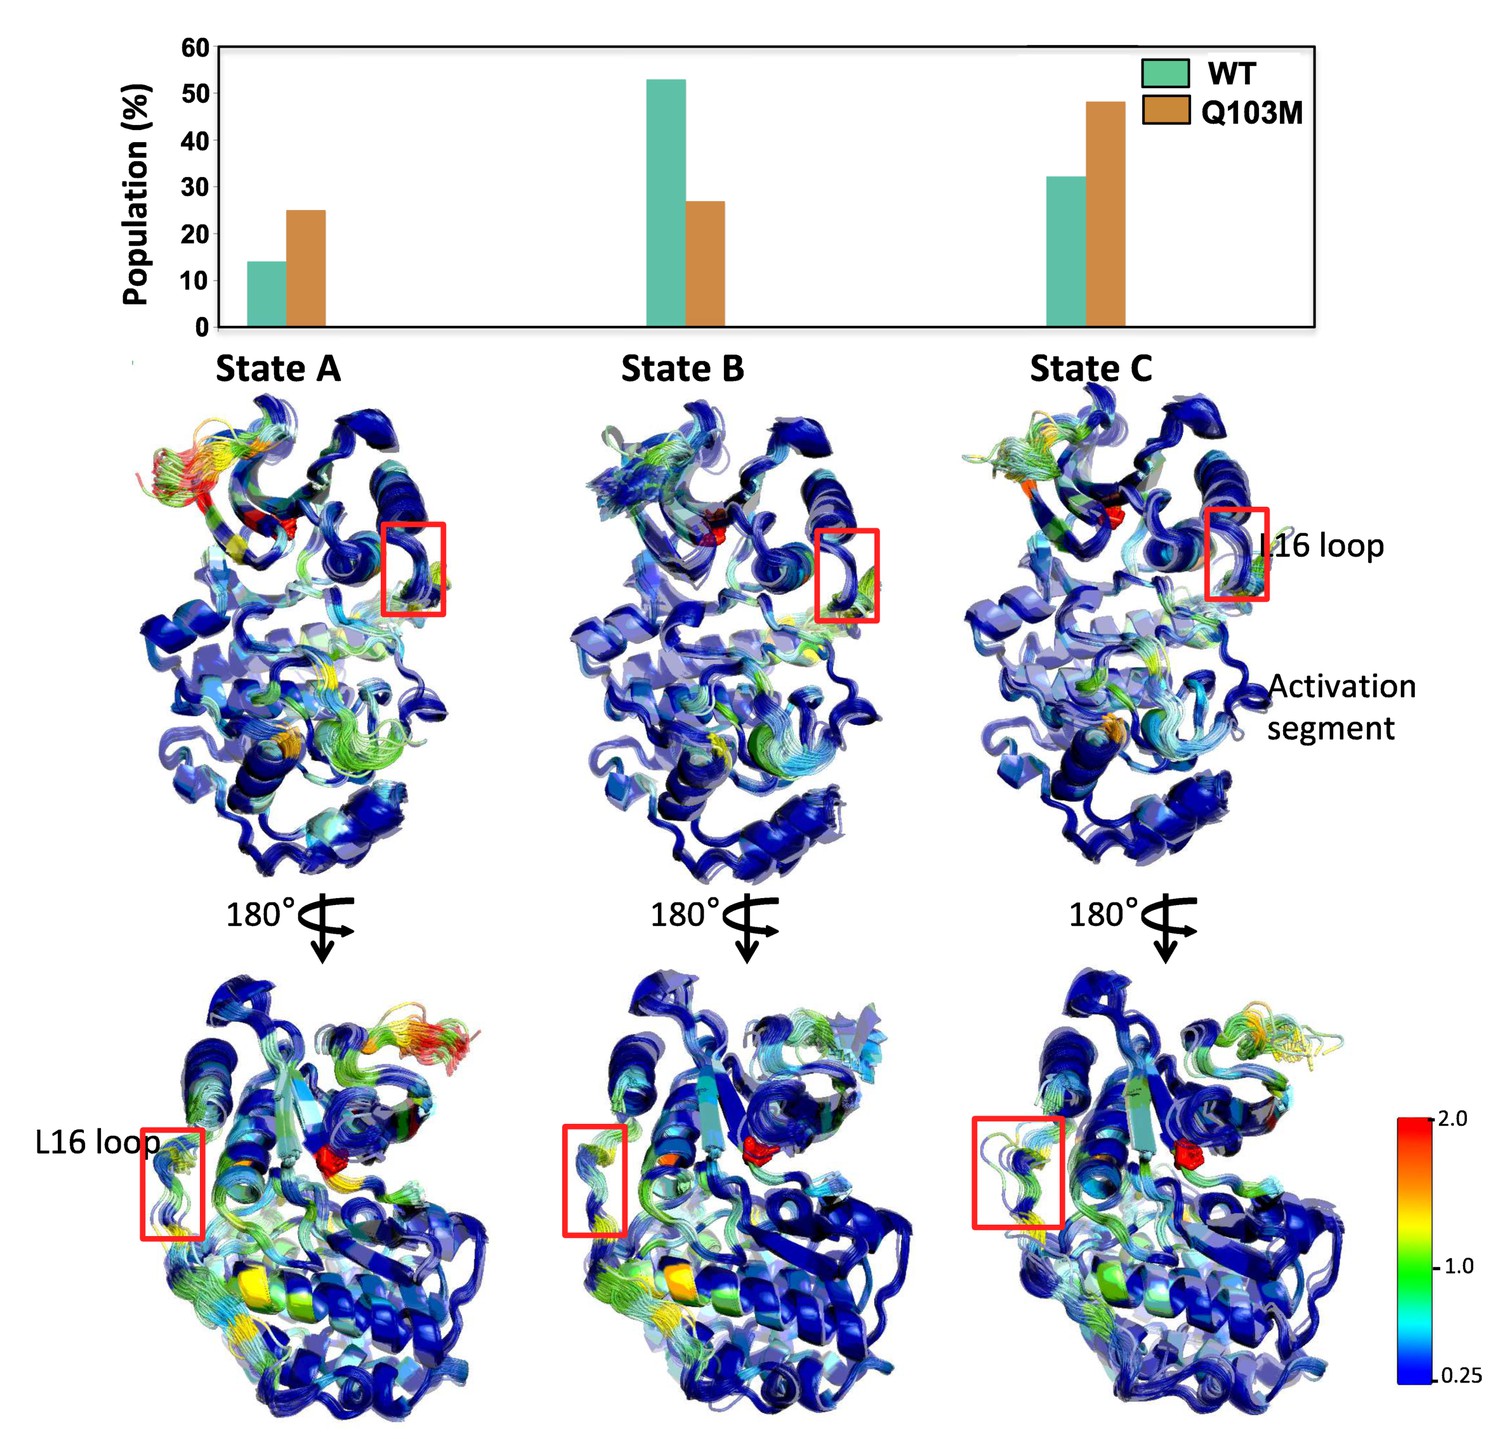
Figure 5—figure supplement 6
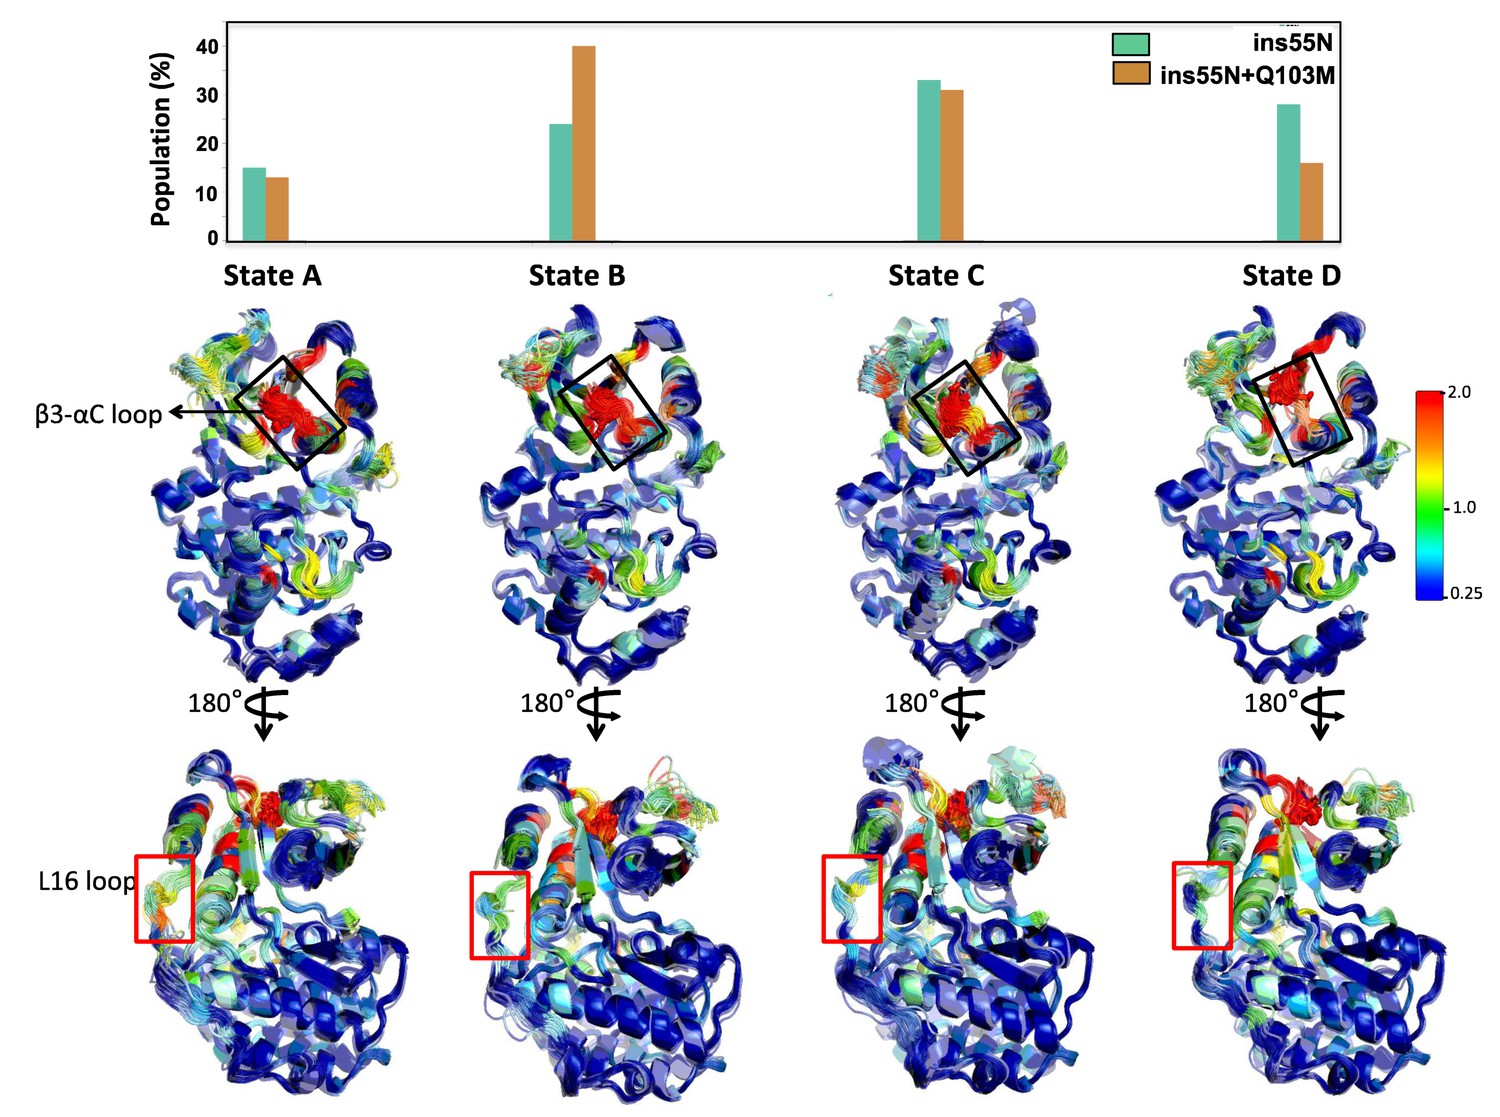
A 4-State Markov state model (MSM) indicates an increase in the open conformation of loop 16 in insertion mutants.
Each state is represented by 100 structures (smoothed) from the ERK2-ins55N system, colored by the absolute sum of contact changes per residue compared to WT, following the standard rainbow on 0.25–2 scale. Mutation and insertion mutations are represented by red sticks. The frequency of each state is provided in the bar graph.
Figure 5—figure supplement 7
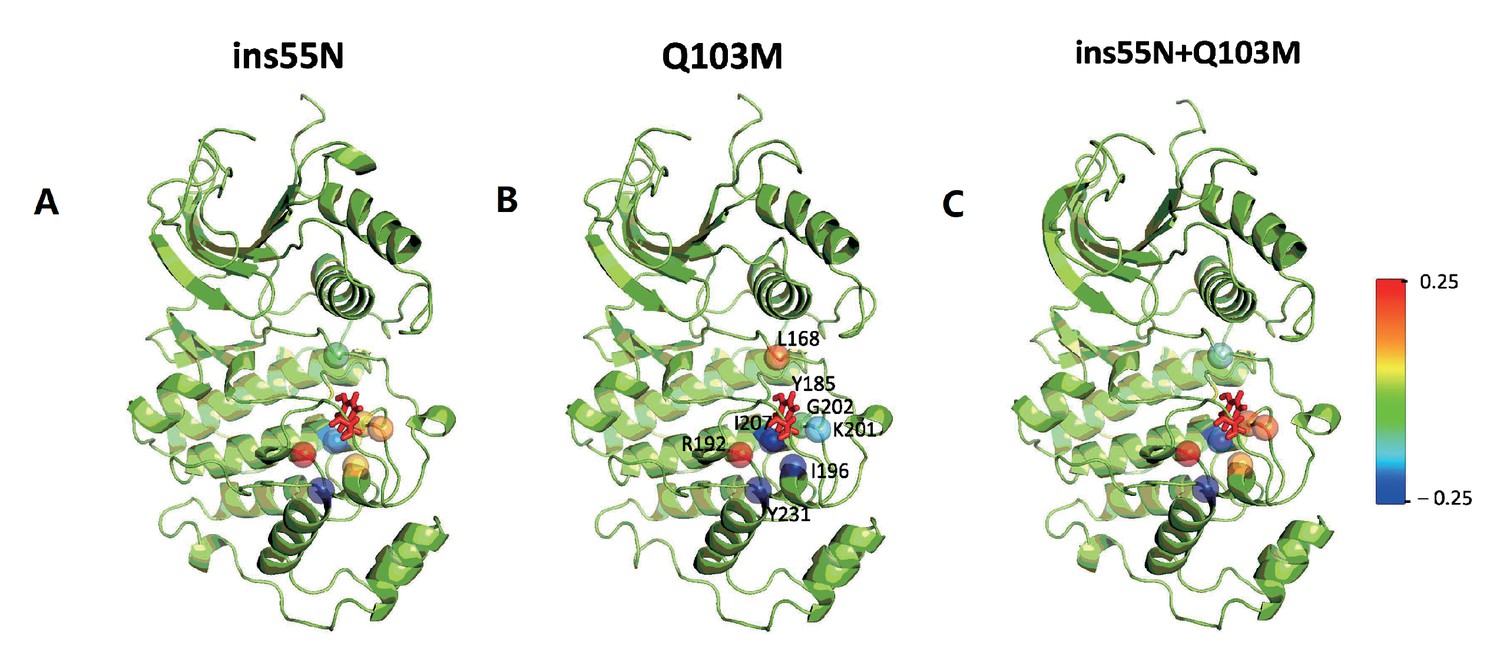
Major contact changes with Y185 mapped on to the structure of mutants.
(A–C) Residues that lose and gain contact with the Y185 in mutants compared to WT are projected onto alpha carbons of the ERK2 structure on a −0.25 to +0.25 scale. (A) ERK2-ins55N – WT, (B) ERK2-Q103M – WT and (C) ERK2-ins55N-Q103M – WT. Y185 is represented in sticks.
Figure 6 with 1 supplement
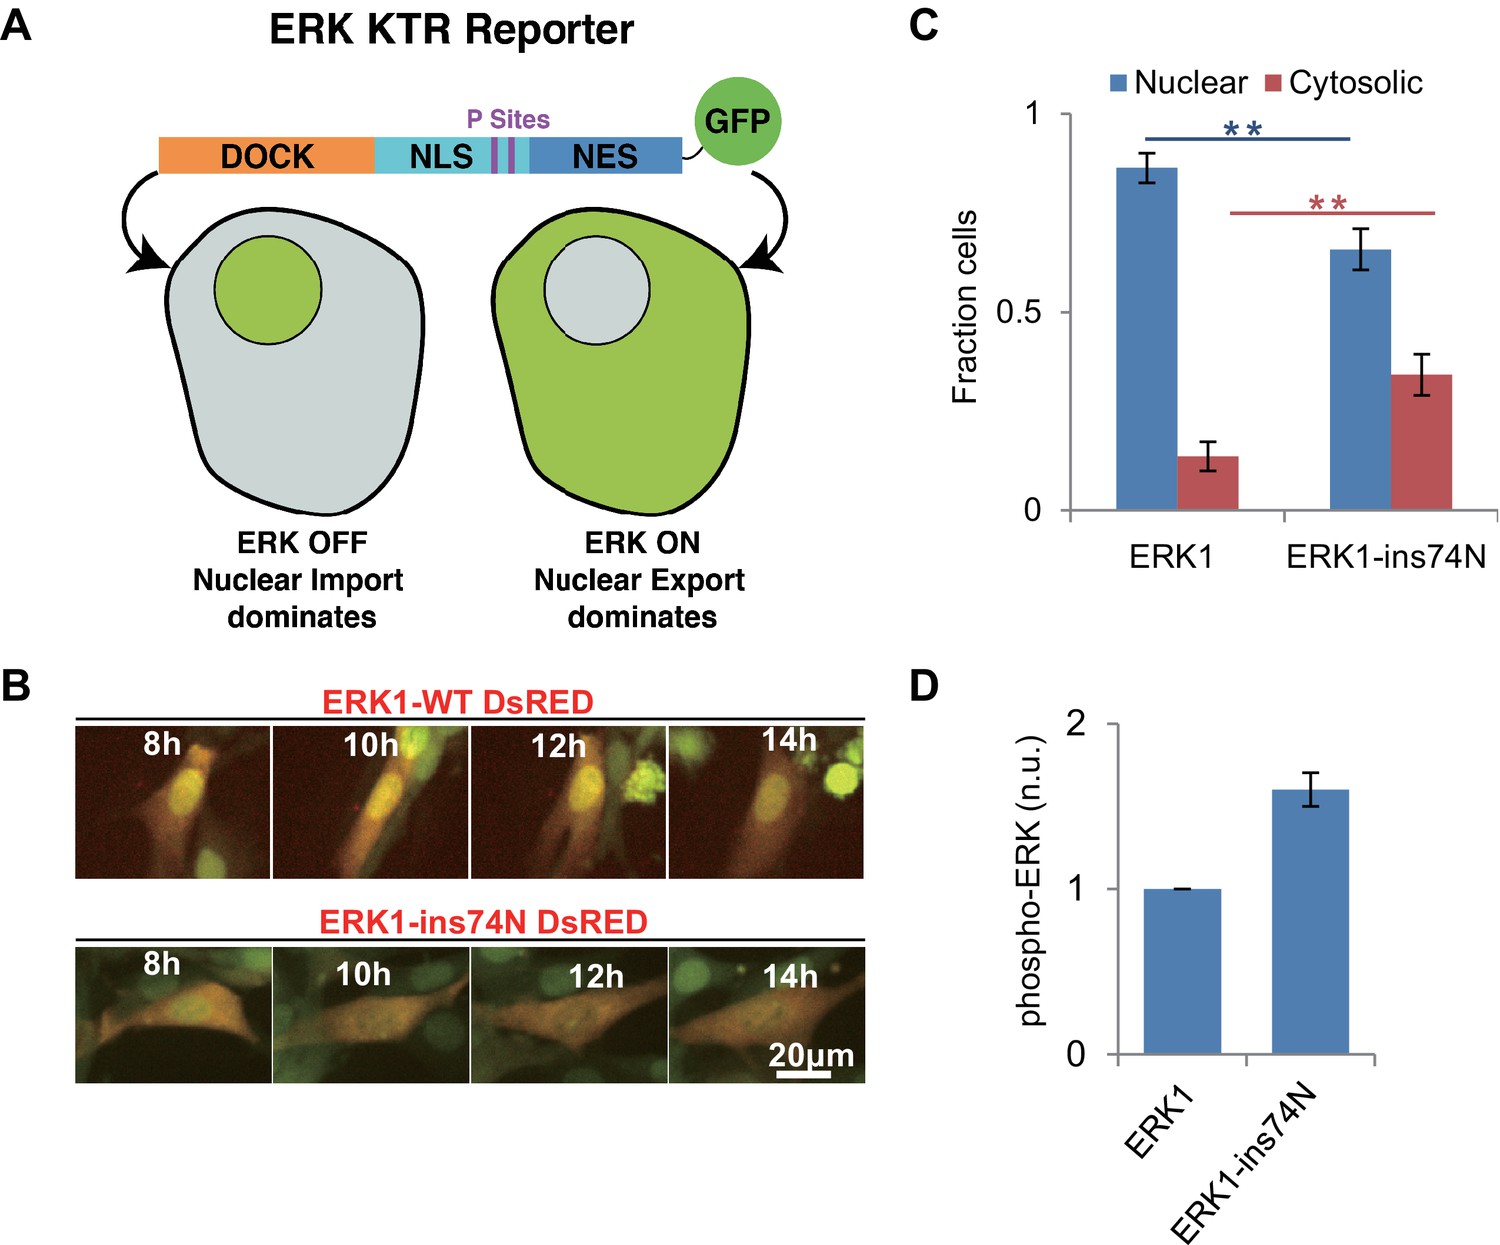
Reversion of ERK regulatory mutations to the inferred ancestral state leads to MEK independent activity in vivo.
(A) Schematic of the Kinase Translocation Reporter (KTR): phosphorylation of the reporter by ERK1/2 leads to inactivation of a nuclear localization signal (NLS) and activation of a nuclear export signal (NES), leading to nuclear export. Conversely, in cells with low ERK1/2 activity, the NLS is active and NES inactive, therefore the reporter is localized to the nucleus. (B) 3T3 cells expressing ERK1 (indicated by coexpression of DsRED with an IRES, after the ERK1 ORF) and the ERK-KTR (green) were treated with 1 μM MEK inhibitor (Trametinib) and grown without FBS. (C) Quantification of ERK-KTR localization after 12–14 hr Trametinib treatment and FBS deprivation. The fraction of cells in which the majority of ERK-KTR localizes to the nucleus or cytosol is plotted. Statistical comparisons are by Student’s t-test, **p<0.01. Error bars indicate ± SD, n = 3, biological replicates (40–50 cells per replicate). (D) Quantification of western blot to assess phosphorylation of the ERK TEY, normalized to the ppERK1 fraction in WT ERK1. Protein was extracted after 12–14 hr Trametinib treatment and FBS deprivation.
Figure 6—figure supplement 1
Raw data from Figure 6D.
Western blot to assess phosphorylation of the ERK TEY motif after 14 hr growth with Trametinib (1 μM) and without FBS (top) and total ERK loading control (bottom). Source data Raw data for LC-MS analysis. Area under the curve (AUC) for the extracted ion chromatogram of each peptide isoform is described.
Tables
Table 1
Michaelis-Menten kinetic parameters for AncERK1-5, AncERK1-2 and ERK1 with Myelin Basic Protein as a substrate.
https://doi.org/10.7554/eLife.38805.009| Kinase | KM (µM) | 95% confidence interval | kcat (min-1) | 95% confidence interval |
|---|---|---|---|---|
| AncERK1-5 | 1.47 | 1.08, 2.00 | 0.64 | 0.59 to 0.69 |
| AncERK1-2 | 40.43 | 32.44, 50.63 | 0.0011 | 0.0010 to 0.0012 |
| ERK1 | 9.48 | 6.35, 13.98 | 0.0065 | 0.0059 to 0.0072 |
Key resources table
| Reagent type | Designation | Source | Identifiers | Additional information |
|---|---|---|---|---|
| Cell line | NIH3T3 | ATCC | CRL1658 | |
| Antibody | anti-ERK | Santa Cruz Bio | SC154 | WB:1:200 |
| Antibody | anti-p-ERK | Santa Cruz Bio | SC7383 | WB:1:200 |
| Recombinant DNA | His AncCM | This paper | pLH1347 | for purification from E. coli |
| Recombinant DNA | His AncMAPK | This paper | pLH1348 | for purification from E. coli |
| Recombinant DNA | His AncJPE | This paper | pLH1349 | for purification from E. coli |
| Recombinant DNA | His AncERK | This paper | pLH1350 | for purification from E. coli |
| Recombinant DNA | His AncERK1-5 | This paper | pLH1571 | for purification from E. coli |
| Recombinant DNA | His AncERK1-2 | This paper | pLH1572 | for purification from E. coli |
| Recombinant DNA | His ERK1 | This paper | pLH1573 | for purification from E. coli |
| Recombinant DNA | His MEK | This paper | pLH1574 | for purification from E. coli |
| Recombinant DNA | MEK (without His tag) | This paper | pLH1575 | for purification from E. coli |
| Recombinant DNA | His ERK1-R84T | This paper | pLH1576 | for purification from E. coli |
| Recombinant DNA | His Elk1-GFP-FRB | This paper | pLH1577 | for purification from E. coli |
| Recombinant DNA | His AncCDK.MAPK-AxF | This paper | pLH1578 | for purification from E. coli |
| Recombinant DNA | His AncJPE-AxF | This paper | pLH1579 | for purification from E. coli |
| Recombinant DNA | His AncERK-AxF | This paper | pLH1580 | for purification from E. coli |
| Recombinant DNA | His AncERK1-2-Q89M | This paper | pLH1581 | for purification from E. coli |
| Recombinant DNA | His AncERK1-2-ins44R | This paper | pLH1582 | for purification from E. coli |
| Recombinant DNA | His AncERK1-2-ins44R-Q89M | This paper | pLH1583 | for purification from E. coli |
| Recombinant DNA | His Alt1.AncERK1-5 | This paper | pLH1584 | for purification from E. coli |
| Recombinant DNA | His Alt2.AncERK1-5 | This paper | pLH1585 | for purification from E. coli |
| Recombinant DNA | His Alt1.AncERK1-2 | This paper | pLH1586 | for purification from E. coli |
| Recombinant DNA | His Chimera 1 | This paper | pLH1587 | for purification from E. coli |
| Recombinant DNA | His Chimera 2 | This paper | pLH1588 | for purification from E. coli |
| Recombinant DNA | His Chimera 3 | This paper | pLH1589 | for purification from E. coli |
| Recombinant DNA | His Chimera 4 | This paper | pLH1590 | for purification from E. coli |
| Recombinant DNA | His Chimera 5 | This paper | pLH1591 | for purification from E. coli |
| Recombinant DNA | His AncERK1-5-del46R | This paper | pLH1592 | for purification from E. coli |
| Recombinant DNA | His AncERK1-5-M90Q | This paper | pLH1593 | for purification from E. coli |
| Recombinant DNA | His AncERK1-5-del46R-M90Q | This paper | pLH1594 | for purification from E. coli |
| Recombinant DNA | His ERK1-Q122M | This paper | pLH1595 | for purification from E. coli |
| Recombinant DNA | His ERK1-ins74N | This paper | pLH1596 | for purification from E. coli |
| Recombinant DNA | His ERK1-ins74N-Q122M | This paper | pLH1597 | for purification from E. coli |
| Recombinant DNA | His ERK1-ins74N AxY | This paper | pLH1598 | for purification from E. coli |
| Recombinant DNA | His ERK1-ins74N TxF | This paper | pLH1599 | for purification from E. coli |
| Recombinant DNA | His ERK1-ins74N AxF | This paper | pLH1600 | for purification from E. coli |
| Recombinant DNA | GST-ERK1-ins74N | This paper | pLH1601 | for purification from E. coli |
| Recombinant DNA | GST-ERK1- ins74N KD | This paper | pLH1602 | for purification from E. coli |
| Recombinant DNA | His ERK1-ins74W | This paper | pLH1603 | for purification from E. coli |
| Recombinant DNA | His ERK1-ins74v | This paper | pLH1604 | for purification from E. coli |
| Recombinant DNA | His ERK1-ins74a | This paper | pLH1605 | for purification from E. coli |
| Recombinant DNA | His ERK1-ins74G | This paper | pLH1606 | for purification from E. coli |
| Recombinant DNA | His ERK1-ins74Q | This paper | pLH1607 | for purification from E. coli |
| Recombinant DNA | His ERK1-ins74S | This paper | pLH1608 | for purification from E. coli |
| Recombinant DNA | His ERK1-ins74D | This paper | pLH1609 | for purification from E. coli |
| Recombinant DNA | His ERK1-ins74N-delK72 | This paper | pLH1610 | for purification from E. coli |
| Recombinant DNA | His ERK1-ins74N-delI73 | This paper | pLH1611 | for purification from E. coli |
| Recombinant DNA | His ERK1-ins74N-delS74 | This paper | pLH1612 | for purification from E. coli |
| Recombinant DNA | His ERK1-ins74N-delP75 | This paper | pLH1613 | for purification from E. coli |
| Recombinant DNA | His ERK1-ins74N-delF76 | This paper | pLH1614 | for purification from E. coli |
| Recombinant DNA | His ERK1-ins74N-delE77 | This paper | pLH1615 | for purification from E. coli |
| Recombinant DNA | His ERK1-ins74N-delH78 | This paper | pLH1616 | for purification from E. coli |
| Recombinant DNA | His ERK1-ins74N-delQ79 | This paper | pLH1617 | for purification from E. coli |
| Recombinant DNA | His ERK1-ins72N | This paper | pLH1618 | for purification from E. coli |
| Recombinant DNA | His ERK1-ins73N | This paper | pLH1619 | for purification from E. coli |
| Recombinant DNA | His ERK1-ins74N | This paper | pLH1620 | for purification from E. coli |
| Recombinant DNA | His ERK1-ins75N | This paper | pLH1621 | for purification from E. coli |
| Recombinant DNA | His ERK1-ins76N | This paper | pLH1622 | for purification from E. coli |
| Recombinant DNA | His ERK1-ins77N | This paper | pLH1623 | for purification from E. coli |
| Recombinant DNA | His ERK1-ins78N | This paper | pLH1624 | for purification from E. coli |
| Recombinant DNA | His ERK1-ins79N | This paper | pLH1625 | for purification from E. coli |
| Recombinant DNA | ERK KTR | Regot et al., 2014 | Addgene #59150 | Monitoring ERK activity in mammalian cells |
| Recombinant DNA | ERK1 wt DsRED | This paper | pLH1626 | for expresson in mammalian cells |
| Recombinant DNA | ERK1-ins74N DsRED | This paper | pLH1627 | for expresson in mammalian cells |
| Recombinant DNA | ERK1 wt overexpression | This paper | pLH1628 | for expresson in mammalian cells |
| Recombinant DNA | ERK1-ins74N overexpression | This paper | pLH1629 | for expresson in mammalian cells |
| Recombinant protein | MBP | EMD Millipore | 13–104 | kinase substrate |
| Recombinant DNA | His ERK2 | This paper | pLH1630 | for purification from E. coli |
| Recombinant DNA | His ERK2-ins55N | This paper | pLH1631 | for purification from E. coli |
| Recombinant DNA | His ERK2-Q103M | This paper | pLH1632 | for purification from E. coli |
| Recombinant DNA | His ERK2-ins55N-Q103M | This paper | pLH1633 | for purification from E. coli |
Additional files
-
Source data 1
Raw data for LC-MS quantification of phosphrylation level of 'TEY' motif in inferred ancestral and modern kinases.
- https://doi.org/10.7554/eLife.38805.033
-
Transparent reporting form
- https://doi.org/10.7554/eLife.38805.034
Download links
A two-part list of links to download the article, or parts of the article, in various formats.
Downloads (link to download the article as PDF)
Open citations (links to open the citations from this article in various online reference manager services)
Cite this article (links to download the citations from this article in formats compatible with various reference manager tools)
Ancestral reconstruction reveals mechanisms of ERK regulatory evolution
eLife 8:e38805.
https://doi.org/10.7554/eLife.38805


