Potentiation of cerebellar Purkinje cells facilitates whisker reflex adaptation through increased simple spike activity
- Erasmus MC, The Netherlands
- University of Pavia, Italy
- Netherlands Institute for Neuroscience, Royal Academy of Arts and Sciences, The Netherlands
- Instituto Fondazione C Mondino, Italy
Figures
Figure 1 with 2 supplements
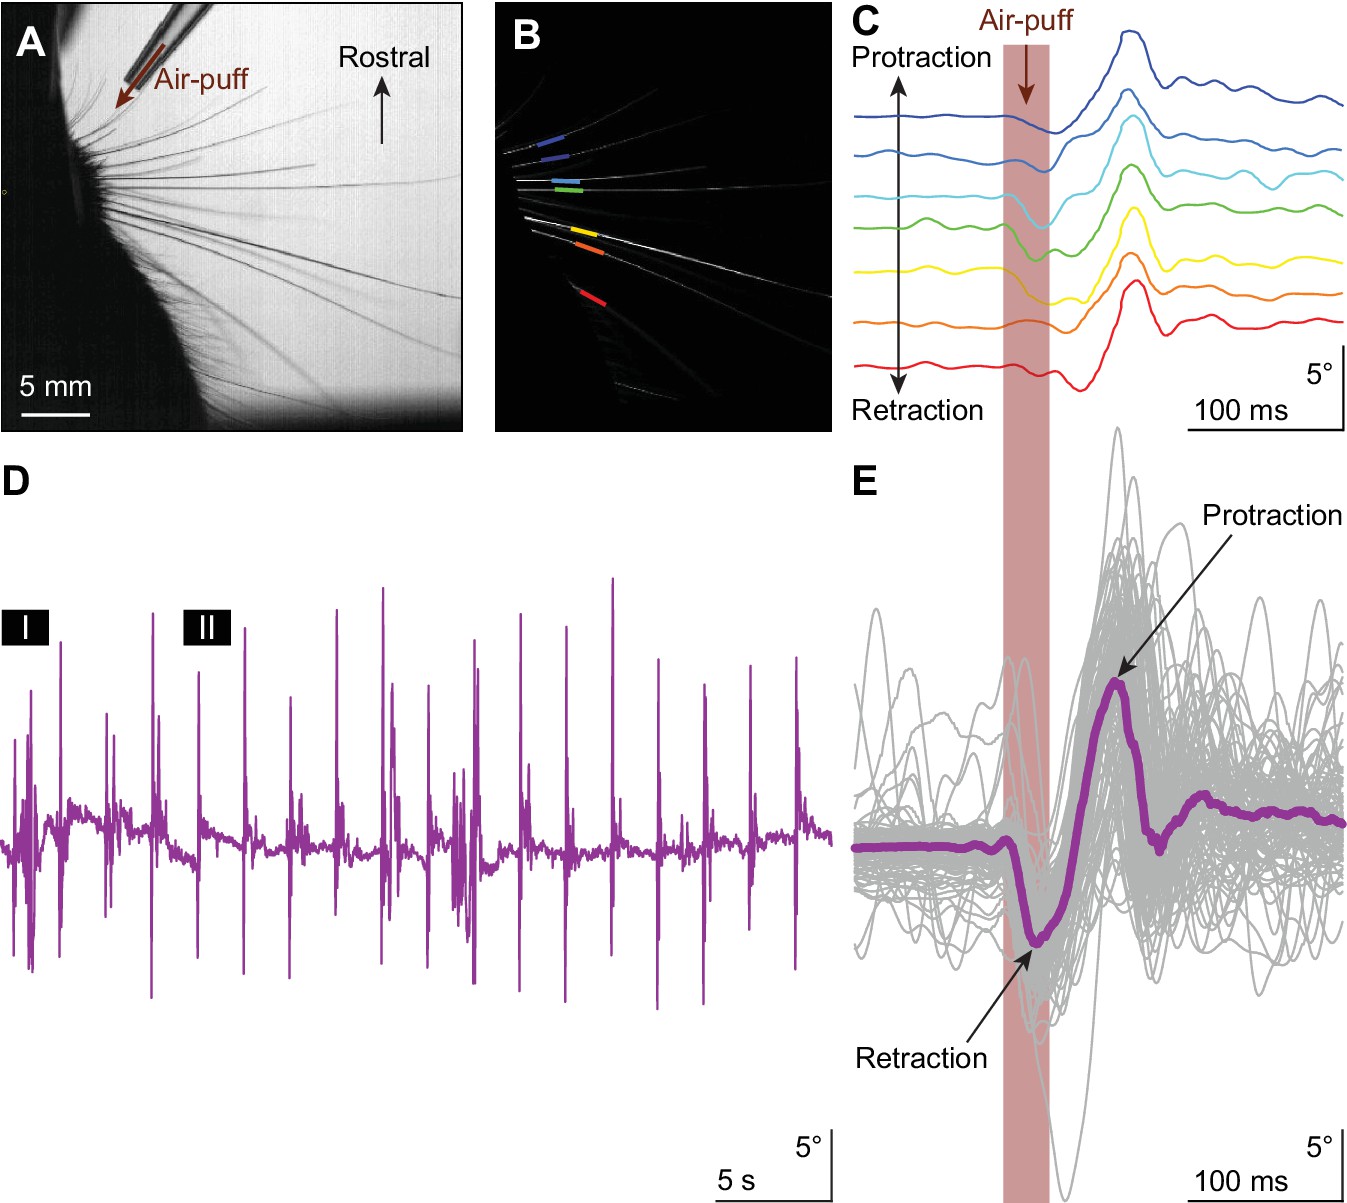
Touch-induced whisker protraction A brief (30 ms) air-puff to the whisker pad induces a reflexive protraction of all large mystacial whiskers.
Our experiments were performed in awake, head-restrained mice that had all whiskers intact. (A) Photograph showing a part of the mouse head with the large facial whiskers and the location and direction of the air-puffer (top). (B) The large facial whiskers were recognized in high-speed videos (1 kHz full-frame rate) by a tracking algorithm and individual whiskers are color-coded. (C) Air-puff stimulation triggered stereotypic whisker movements consisting of an initial backward movement followed by active protraction. Deflection angles of individually tracked whiskers are denoted in distinct colors (same color scheme as in (B)). (D) The mean whisker angle during 0.5 Hz air-puff stimulation of the whisker pad from a representative mouse. During approximately half the trials, the active protraction was only a single sweep; in the other traces multiple sweeps were observed. Prolonged periods of active whisking were rare. The periods marked ‘I’ and ‘II’ are enlarged in Figure 1—figure supplement 1A. (E) To indicate the variability in whisker behavior, 100 trials of the same experiment were superimposed. The thick colored line indicates the median. The retraction due to the air-puff is followed by an active protraction. The following supplements are available for Figure 1.
Figure 1—figure supplement 1

Whisker movements are largely restricted to the period after the air-puff.
(A) During a prolonged period of 0.5 Hz whisker pad stimulation, in roughly half the trials the stereotypic whisker movement – retraction followed by a large active forward sweep – is followed by a prolonged period of more variable whisker movements. The traces show here the whisker movements (averaged over all trackable whiskers) during the two trials marked ‘I’ and ‘II’ in Figure 1D. (B) Violin plots showing the amplitudes (difference between maximal retraction and maximal protraction in three 200 ms interval (relative to the start of the air-puff: −200–0 ms (Pre-stim), 0–200 ms (Stim) and 200–400 ms (Post-stim))) of individual trials of 16 mice (with approximately 100 trials per mouse). Horizontal lines represent 10th, 25th, 50th, 75th and 90th percentiles. (C) Fractions of trials with movements exceeding 10°. Asterisks indicate significantly different fractions of trials with movement. ***p<0.001 (χ2 = 1470.24; 3 × 2 χ2 test).
Figure 1—figure supplement 2
Air-puffs induce reflexive whisker movements.
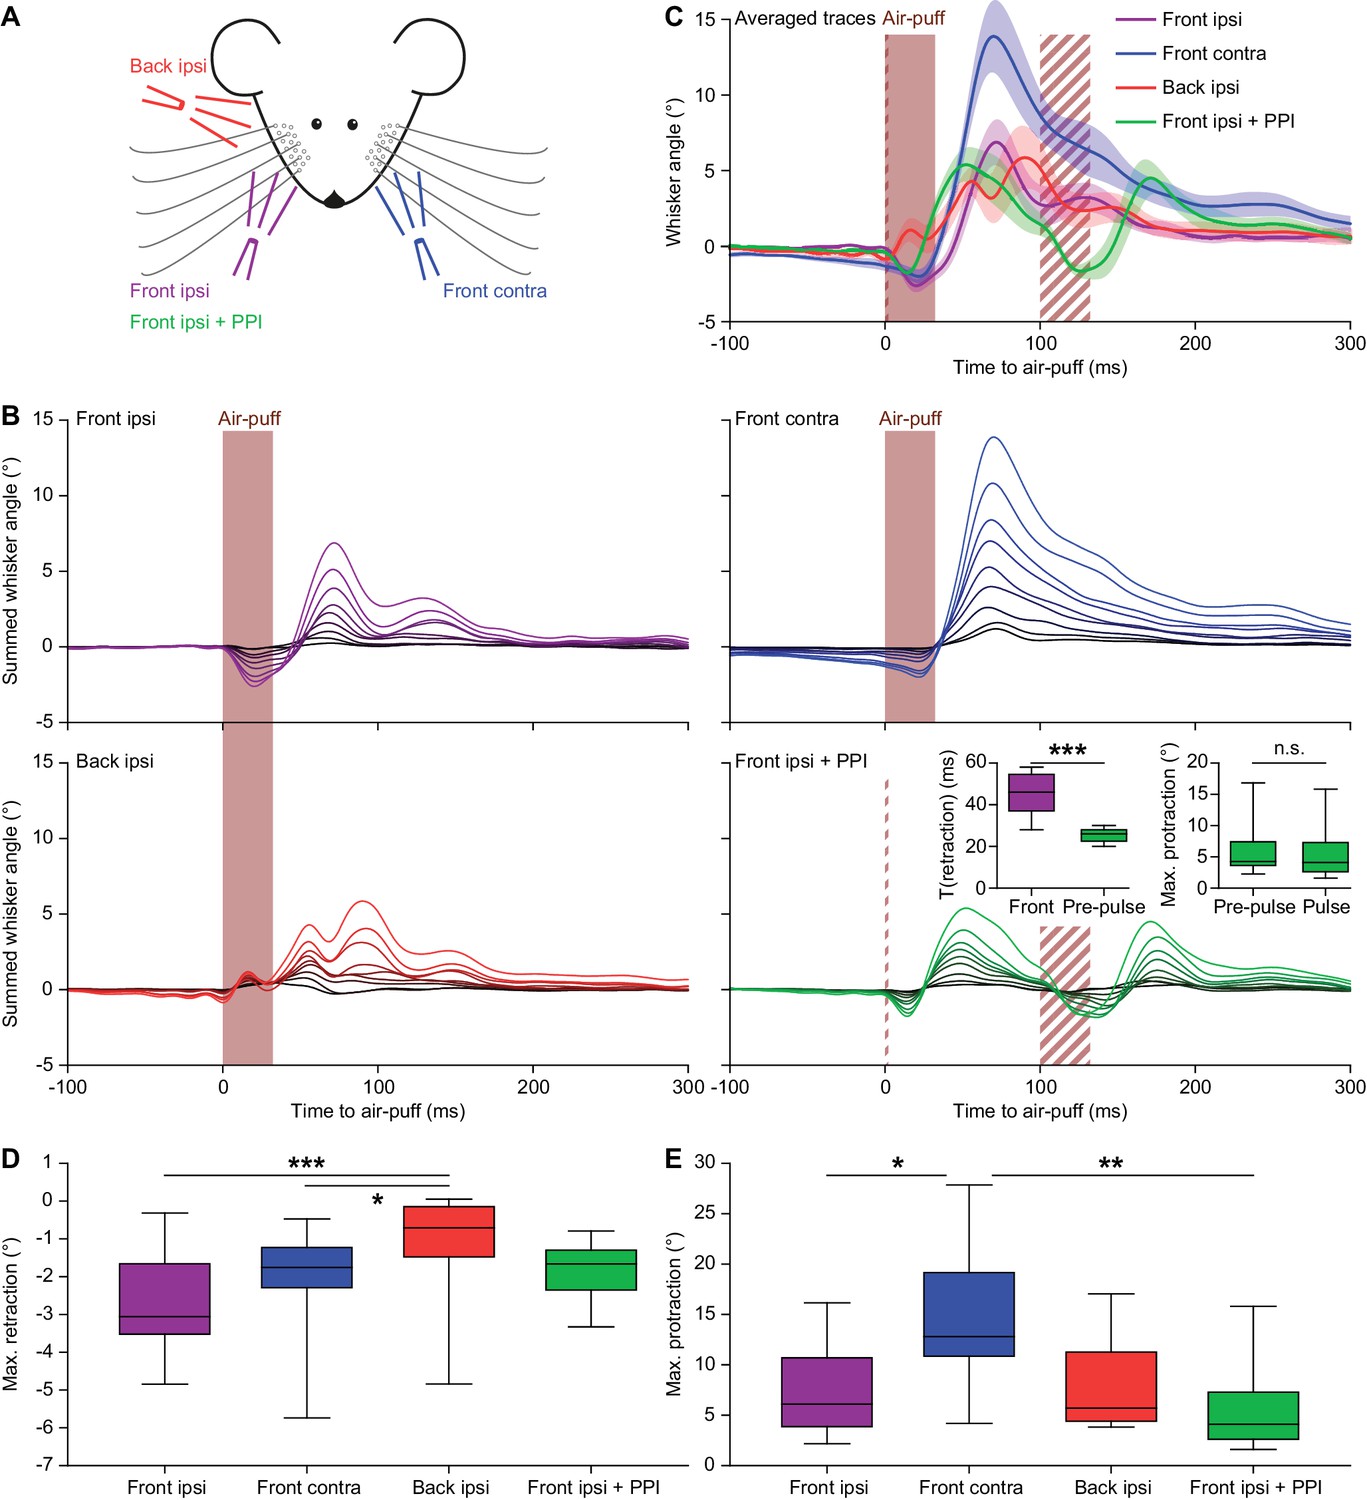
(A) Schematic drawing of the experimental layout. Air-puffs lasting 30 ms were delivered from three different locations. In addition, some air-puffs delivered ipsilaterally from the front were preceded by a brief air-puff (2 ms) 100 ms before the 30 ms air-puff to test for pre-pulse inhibition (PPI). The four stimulus conditions were applied in a random order. (B) For each of the nine mice tested, we calculated the average whisker response (always on the side with the two puffers) and represented these as summed line plots. The stacked line plots are scaled such that the brightest line (on top) depicts the average of all mice. The insets show the duration of the retraction (until the whiskers reached the baseline position again) comparing the 2 ms and the 30 ms pulses (left) and the maximal protraction amplitudes upon the pre-pulse compared to the pulse (right). The retraction upon the short pre-pulse was less intense, but the consecutive protractions were of similar amplitude, indicating the absence of pre-pulse inhibition (p=0.0078 and p=0.4961, respectively; Wilcoxon matched-pairs tests; significance level = 0.025 after Bonferroni correction for multiple comparisons). (C) Overlay of averaged ipsilateral whisker responses with shaded areas indicating ±SEM. The three ipsilateral conditions resulted in similar amounts of protraction. Note that the puff from the back did not cause a retraction preceding the protraction and that the pre-pulse did not affect the size of the protraction following the second air-puff. The brief pre-pulse induced a shorter retraction, but this had no effect on the protraction. Air-puffs to the contralateral whisker pad caused stronger protractions than the ipsilateral stimuli. (D) The maximum retraction was largest when the air-puffer was in front of the ipsilateral whiskers. The shorter pre-pulse did cause a briefer retraction (see inset in B), but the amplitude was not significantly different from the retraction caused by the longer pulse (p=0.268; Dunn’s pair-wise post-hoc test after Friedman’s two-way ANOVA; see Supplementary file 1A). Puffing from the contralateral whiskers or the ipsilateral whiskers from the back caused the least retraction, indicating that the initial retraction is largely passive and caused by the air flow of the stimulator. (E) The maximum protraction reached was similar for all conditions, except in case the contralateral whiskers were stimulated, which led to a stronger protraction on the ipsilateral side. n.s. p>0.05; *p<0.05; ***p<0.001; ***p<0.001. See also Source Data file.
-
Figure 1—figure supplement 2—source data 1
Data for Figure 1—figure supplement 2.
- https://doi.org/10.7554/eLife.38852.006
Figure 2 with 2 supplements

Anatomical distribution of Purkinje cell responses to whisker pad stimulation.
(A) Representative extracellular recording of a cerebellar Purkinje cell (PC) in an awake mouse showing multiple simple spikes (vertical deflections) and a single complex spike that is indicated by a blue dot above the trace. (B) Scatter plot and histogram of complex spike firing around the moment of air-puff stimulation of the whisker pad (applied at 0.5 Hz) of the same PC. (C) The latencies vs. the peak of the complex spike responses of all 118 PCs with a significant complex spike response. Note that a minority of the PCs showed relatively long latency times. (D) Simple spike responses of the same PC showing a bi-phasic response: first inhibition, then facilitation. Note that the simple spike firing frequency of this PC at rest is about 60–70 Hz. (E) Peak amplitudes and peak latency times of simple spike responses of all 127 PCs showing a significant simple spike response to whisker pad stimulation. As simple spike responses were often found to be bi-phasic, we represented the first phase with closed and the second phase with open symbols. Non-significant responses are omitted. (F) Simplified scheme of the somatosensory pathways from the whisker pad to the PCs and of the motor pathways directing whisker movement. The information flows from the whisker pad via the trigeminal nuclei and the thalamus to the primary somatosensory (S1) and motor cortex (M1). S1 and M1 project to the inferior olive via the nuclei of the meso-diencephalic junction (MDJ) and to the pontine nuclei. Both the inferior olive and the pontine nuclei also receive direct inputs from the trigeminal nuclei. The mossy fibers (MF) from the pontine nuclei converge with direct trigeminal MF and those of the reticular formation on the cerebellar granule cells (GrC) that send parallel fibers (PF) to the PCs. The inferior olive provides climbing fibers (CF) that form extraordinarily strong synaptic connections with the PCs. Both the PFs and the CFs also drive feedforward inhibition to PCs via molecular layer interneurons (MLI). The GABAergic PCs provide the sole output of the cerebellar cortex that is directed to the cerebellar nuclei (CN). The CN sends the cerebellar output both upstream via the thalamus back to the cerebral cortex and downstream to motor areas in the brainstem and spinal cord. The whisker pad muscles are under control of the facial nucleus which is mainly innervated via the reticular formation. Several feedback loops complement these connections. For references, see main text. (G) For most of the PC recordings in this study, the anatomical locations were defined by a combination of surface photographs and electrolytic lesions made after completion of the recordings. An example of such a lesion in crus 1 is shown here in combination with a Nissl staining. SL = simple lobule. (H) Heat map showing the anatomical distribution of the strength of the complex spike responses projected on the surface of crus 1 and crus 2. The locations of all 132 recorded PCs were attributed to a rectangular grid. The average complex spike response strength was calculated per grid position and averaged between each grid position and its neighbor. The grey lines indicate the borders to the cerebellar zones. (I) The same for the variation in the first phase of the simple spike responses. Note that for the simple spikes the blue colors indicate suppression of firing rather than the absence of a response.
Figure 2—figure supplement 1
Diversity in Purkinje cell responses.
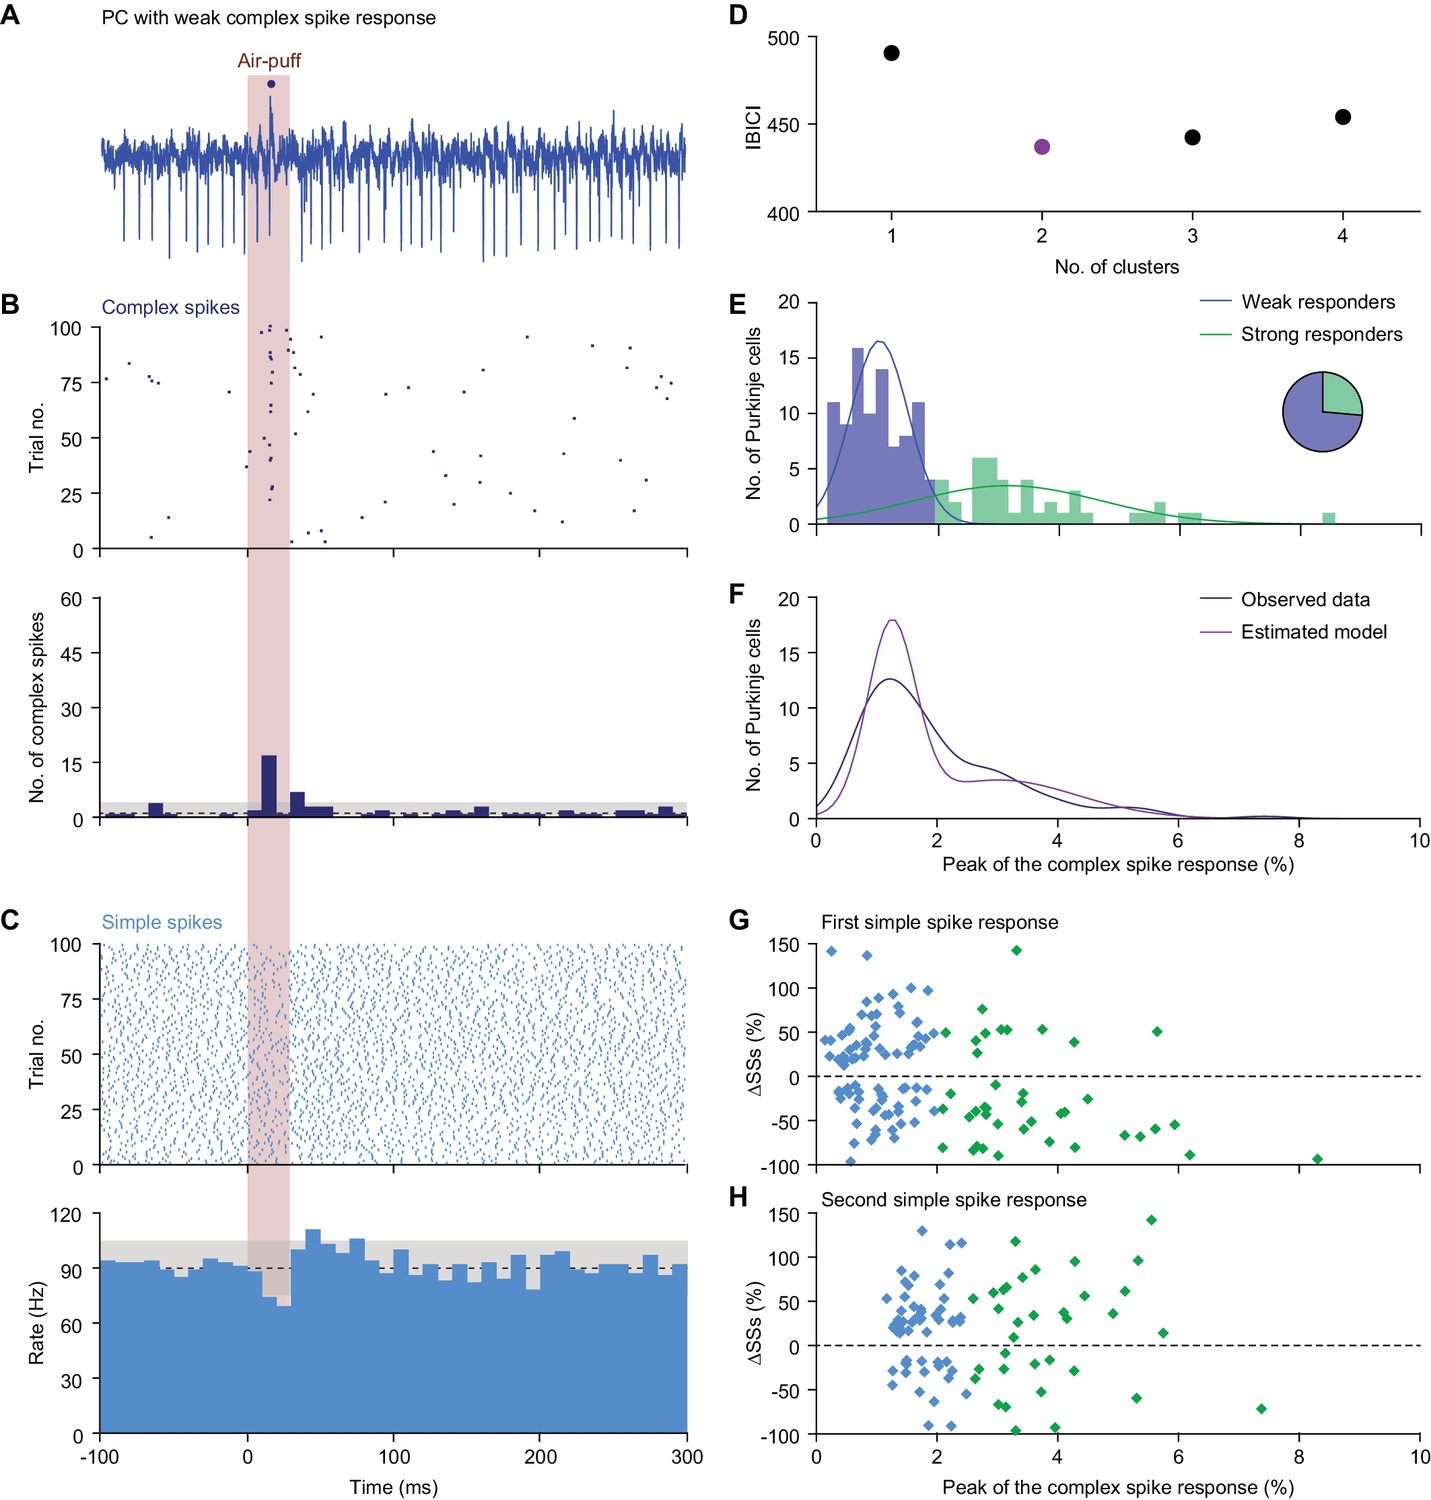
(A) Single trial of a PC showing a relatively weak complex spike response to air-puff stimulation of the ipsilateral whisker pad. The dark blue dot indicates a complex spike. (B) Raster plot and peri-stimulus time histogram (PSTH) of the complex spikes of the same neuron as in (A). Note that although the initial response is relatively weak, being present only in about 15% of the trials, this is still much more than could be expected based on the frequency during the inter-trial intervals. The dashed line indicates the average complex spike rate in between trials with the grey area representing ±3 s.d.. (C) The same for the simple spike response. This PC has a bimodal simple spike response, first a decrease and then an increase in simple spike activity. (D) Based upon the complex spike response probability, defined as the peak of the complex spike response in the convolved PSTH, clustering the PCs into two clusters yielded the smallest Bayesian information criterion (BIC) value. (E) The majority (66%) of the PCs could be classified as ‘weak responders’ and the minority (34%) as ‘strong responders’ (see pie diagram). This classification was obtained using a univariate Gaussian mixture model (blue and green lines, representing the two clusters). (F) Comparison of the distribution of the observed complex spike responses and that expected by our model. (G) The strength of the complex spike response and the first peak or trough (cf. panel C) in the simple spike (SS) response were not significantly correlated. Only the PCs with a very strong complex response tended to have a decrease in the simple spike response. (H) The same applied for the second extremum of the simple spike response. For this later phase, the complex spike and the simple spike responses were even less correlated.
Figure 2—figure supplement 2
Anatomy of the whisker region in the cerebellar hemispheres.
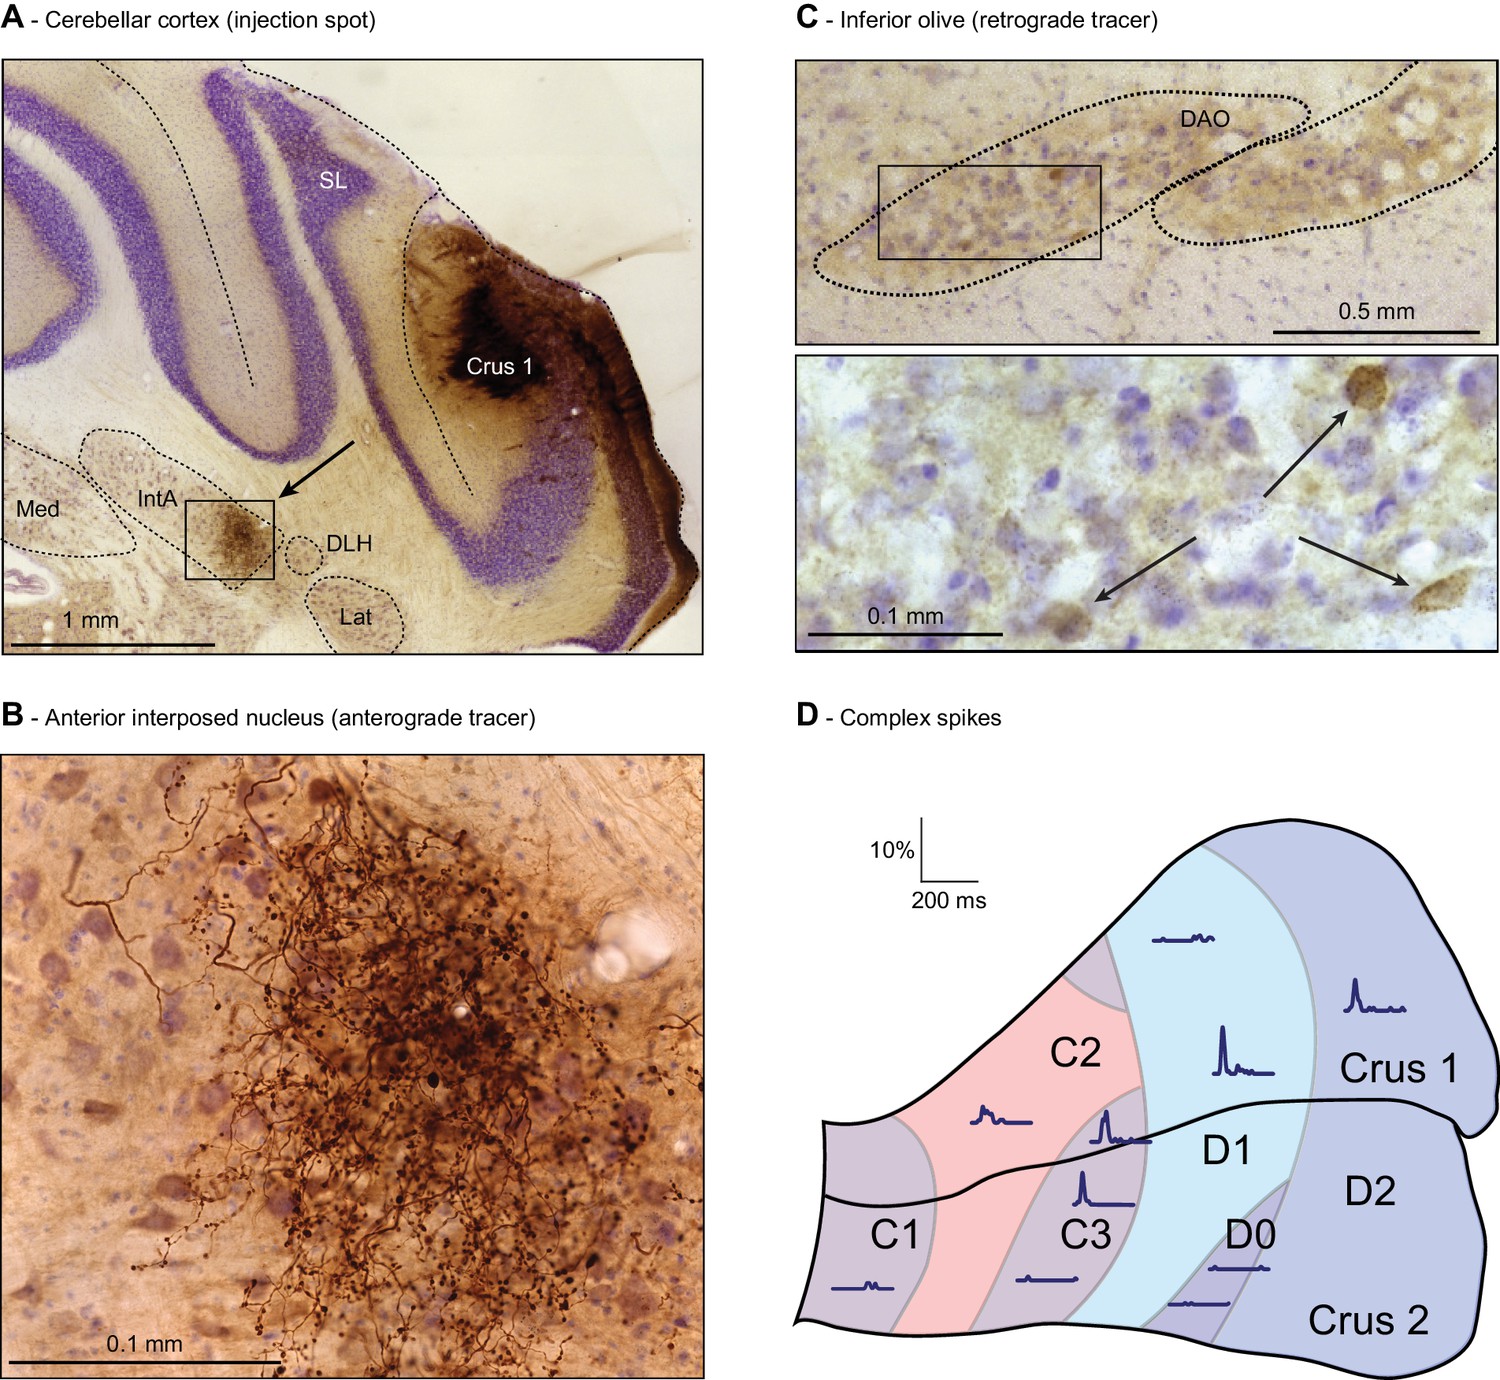
(A) PC locations could be retrieved by neural tracer injection (BDA 3000) after completion of the recording. In this example, tracer was found in the anterior interposed nucleus (IntA) (see arrow, area enlarged in (B). SL = simple lobule; Med = medial nucleus; Lat = lateral nucleus; DLH = dorsolateral hump. Anterograde staining was observed in the cerebellar nuclei (B) and retrograde staining in the inferior olive (C) after a survival period of around 1 week. The rectangle in the top micrograph of C indicates the area enlarged in the lower micrograph. (D) A map is shown of the approximated locations of the recorded PCs. The names of the cerebellar zones are indicated. The response kinetics of complex spikes are shown as convolved peri-stimulus time histograms. In these traces, the left-most point represents the onset of the air-puff. Note that strong complex spike responses were observed in C3, D1 and D2 zones. DAO = dorsal accessory olive.
Figure 3 with 2 supplements
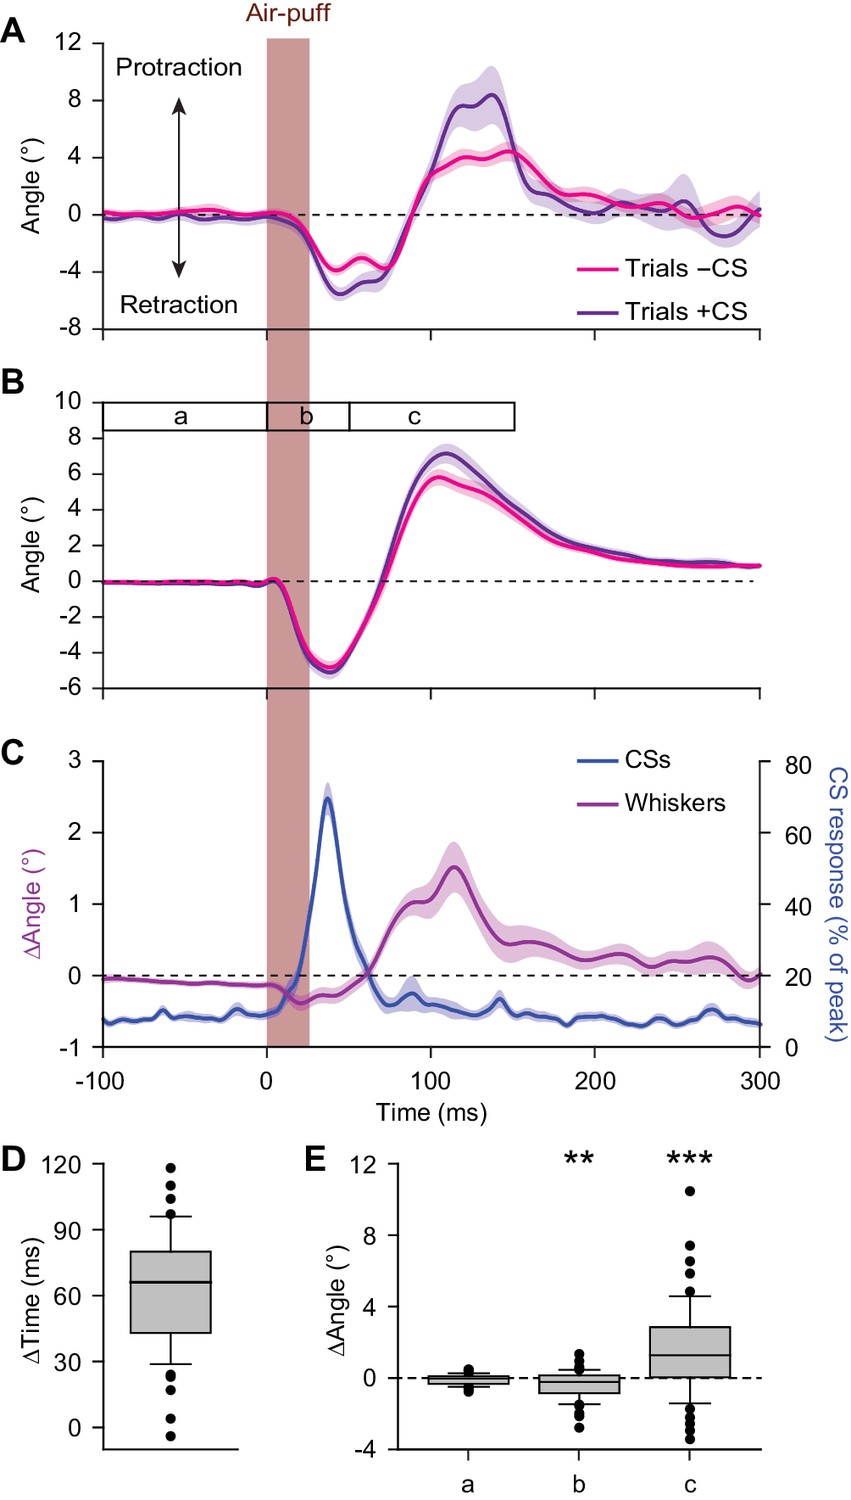
Large reflexive whisker protractions are preceded by complex spikes.
(A) Upon sorting the whisker traces based on the presence (violet) or absence (magenta) of a complex spike (CS) produced by a simultaneously recorded PC in the first 100 ms after stimulus onset, it is apparent that the trials with a complex spike tended to have a stronger protraction. (B) This observation was confirmed in the population of PCs with a significant complex spike response to air-puff stimulation (n = 55). (C) Averaged convolved peri-stimulus time histograms of complex spikes (blue) and the averaged difference in whisker position (purple) between trials with and without complex spikes. Complex spikes precede the observed differences in movement. Shaded areas indicate s.d. (A) or SEM (B and C). (D) Time intervals between the peak of the complex spike response and the moment of maximal difference in whisker position between trials with and without complex spikes, indicating that the complex spikes lead the whisker movement by approximately 60 ms. (E) Changes in average whisker angle before stimulation (period a; see time bar in panel B), in maximal retraction (period b) and in maximal protraction (period c) between trials with and without a complex spike in the 100 ms after an air-puff. *p<0.05; **p<0.01; ***p<0.001 (Wilcoxon matched pairs tests (with Bonferroni correction for multiple comparisons in E)). See also Source Data file.
-
Figure 3—source data 1
Data for Figure 3.
- https://doi.org/10.7554/eLife.38852.013
Figure 3—figure supplement 1

Correlation between complex spike firing and whisker protraction is especially strong in the D2 zone.
(A) There was no obvious correlation between the strength of the complex spike response of any given PC and the difference in touch-induced whisker protraction in trials with and without a complex spike. (B) Indeed, and with the exception of the lateral most portion of crus 1, the predictive value of the occurrence of a complex spike was quite evenly distributed over crus 1 and crus 2. Together with the findings of (A), this implies that the extent of stronger protraction in trials with a complex spike does not depend on the response characteristics of a PC. In other words, the predictive value of a complex spike is similar whether it originates from a weak or from a strong responder. However, as the PCs in the lateral zones display more complex spikes, their overall impact on whisker protraction is larger (C). Thus, complex firing in the D2 zone had the strongest predictive value for increased touch-induced whisker protraction.
Figure 3—figure supplement 2
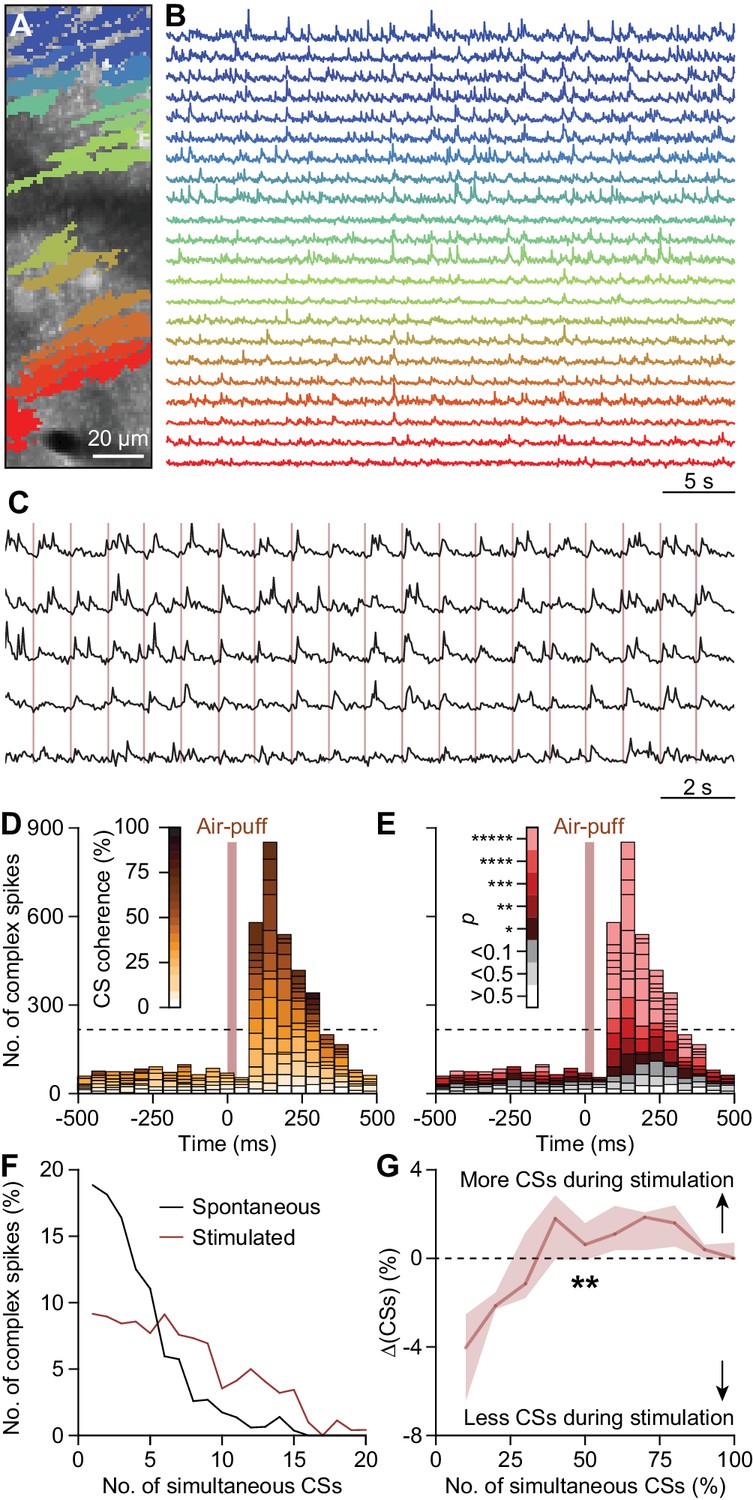
Coherent complex spike firing is specifically enhanced by whisker pad stimulation.
(A) Field of view of a piece of crus 1 recorded using two-photon Ca2+ imaging in an awake mouse. The colored areas indicate 22 regions of interest, corresponding to PC dendrites. The accompanying fluorescent traces show Ca2+ transients, which are most likely complex spikes (B); cf. Schultz et al., 2009. In the absence of tactile stimulation coherent activity of groups of PCs is rare. (C) Following air-puff stimulation of the whisker pad (brown vertical lines), complex spike coherence occurs often as illustrated by five responsive PCs recorded simultaneously. (D) Aggregate peri-stimulus time histogram of all PCs in the field of view shown in panel (A). The colors represent the coherence of PC firing, defined as the fraction of PCs active during each frame of 40 ms. Complex spike coherence is relatively rare during inter-trial intervals, but strongly enhanced following air-puff stimulation. (E) The same peri-stimulus histogram as in (D), but with colors indicating the chance of occurrence of the level of coherence found based upon Poisson distribution of all complex spikes in this recording, emphasizing that coherence occurred more than expected, mainly during the sensory response. Indeed, during 1 Hz air-puff stimulation, complex spikes were observed to be produced by large ensembles. In the absence of tactile stimulation, ensemble sizes tended to be smaller (F). The data presented in panels (D–F) come from the field of view shown in panel (A). (G) There was a shift from complex spikes fired by a single or a few Purkinje cells toward complex spikes fired by larger ensembles when introducing air-puff stimulation. Presented are the median and the inter-quartile range of the differences between the two histograms as illustrated for an example experiment in panel (F) (n = 10). The increase in coherence directly after stimulation was highly significant (p=0.001; Fr = 28.878; df = 9; Friedman’s two-way ANOVA). *p<0.05; **p<0.01, ***p<0.001, ****p<0.0001, *****p<0.00001.
Figure 4 with 1 supplement
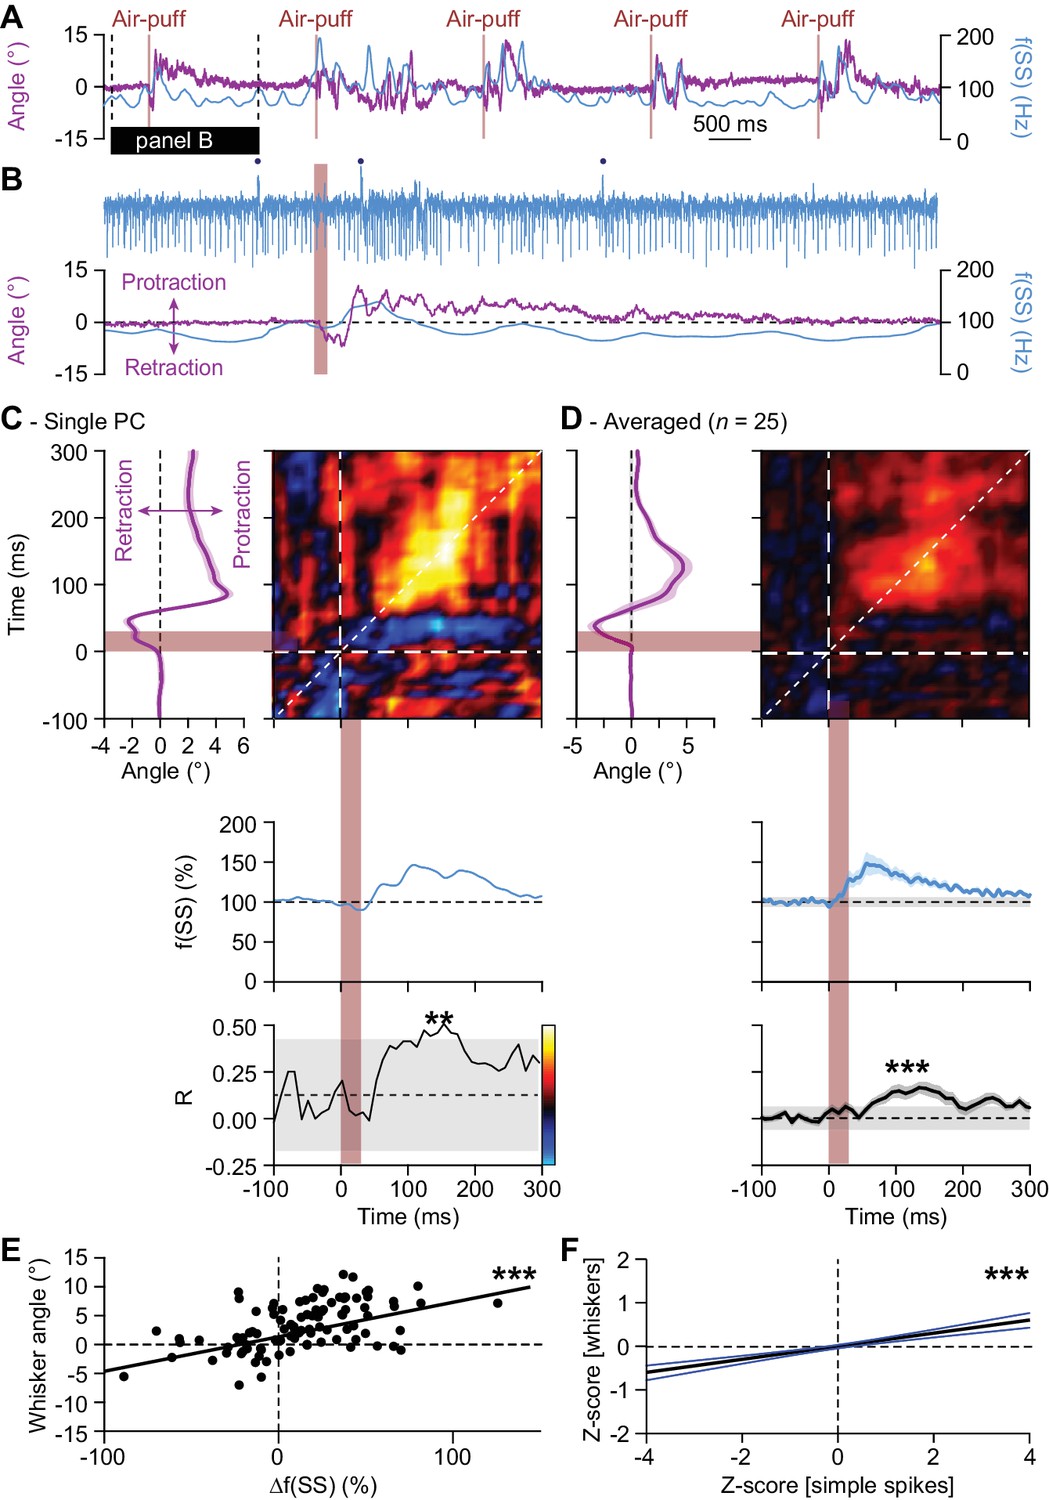
Instantaneous simple spike firing correlates with whisker protraction during reflex.
(A) Changes in the instantaneous simple spike (SS) firing rate (convolved with a 6 ms Gaussian kernel; blue) correlate roughly with whisker movement (purple). This is illustrated with a representative recording of a PC. Vertical brown lines indicate the moments of air-puff stimulation to the (ipsilateral) whisker pad. The horizontal black line designates the interval expanded in (B). Blue dots mark complex spikes. (C) Correlation matrix showing a clear positive correlation of simple spike firing (blue trace at the bottom shows convolved peri-stimulus time histogram triggered on air-puff stimulation) and whisker protraction (red trace at the left; indicated is the mean ±SEM of the whisker position) based on a trial-by-trial analysis. The correlation coefficient (R) over the dashed 45° line is shown at the bottom, together with the 99% confidence interval (grey area). These data correspond to the example PC shown in (A–B). Averaged data from all 25 PCs that displayed a significant correlation between simple spike rate and whisker position are shown in (D-E). Scatter plots with linear regression lines show a positive correlation between whisker protraction and instantaneous simple spike firing as illustrated here for the PC represented in (C) (R = 0.517; p<0.001; Pearson correlation). Data are taken from the moment with the strongest correlation (150–160 ms after the onset of the air-puff for both parameters). (F) For all PCs with a significant correlation between whisker angle and simple spike rate, this correlation turned out to be positive when evaluating 100 trials for each of the 25 Purkinje cells (R = 0.199; p<0.001; Pearson correlation). Shown a the linear regression line (black) and the 95% confidence intervals (blue). The experiments are normalized based upon their Z-score. Data are taken from the moment with the strongest correlation (120–130 ms (whiskers) vs. 140–150 ms (simple spikes)). Thus, increased simple spike firing correlates with whisker protraction. **p<0.01; ***p<0.001.
Figure 4—figure supplement 1
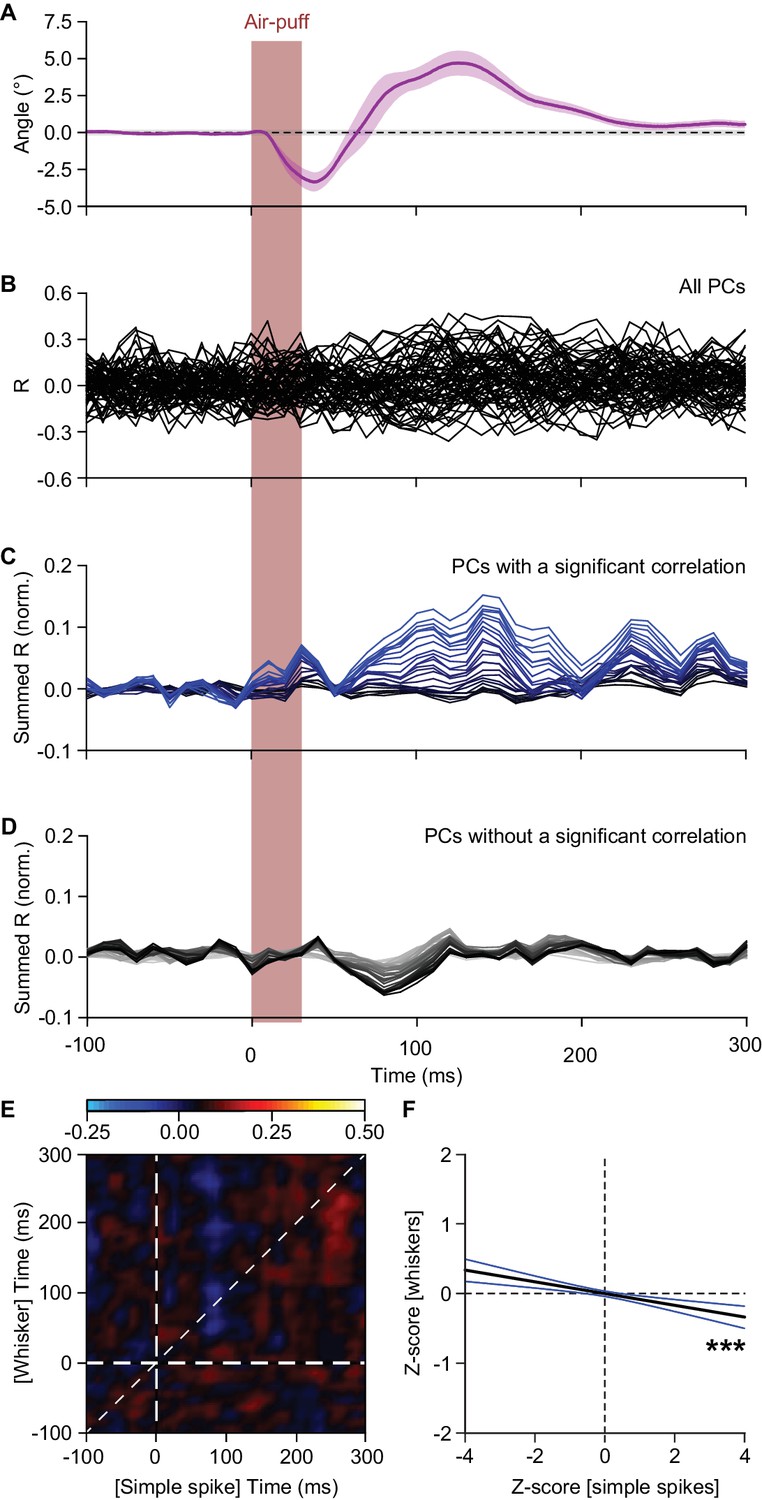
Simple spike firing is predominantly associated with protraction.
(A) The average whisker response to air-puff stimulation (for reference, copied from Figure 4D). (B) Overlaid plots of the correlation between whisker angle and instantaneous simple spike frequency based on a trial-by-trial analysis of all 56 PCs measured in this way (see Figure 4). The correlation values are based upon the zero-lag correlation (thus along the ‘45° line’ in Figure 4C,D). (C) Stacked line plot of the 25 PCs with a significant correlation between whisker angle and simple spike firing. The cells are ordered based upon their correlation value and scaled so that the brightest line corresponds to the average. (D) As in C, but now of the 31 PCs that did not show a significant correlation between their simple spike firing and the whisker position. Although the correlation is not significant when regarded per cell, overall there is a negative correlation between simple spike firing and whisker position. The darkest line corresponds to the average. (E) Correlation matrix showing the correlation between whisker protraction (on the y axis) and instantaneous simple spike frequency (on the x-axis) of the 31 PCs that did not have a significant correlation between these two parameters. The heatmap represent the average R value for each bin (n = 31 PCs). The lookup table shows the color coding for the R values. (F) Despite the lack of correlation at the single-cell level, at the population level these PCs correlated weakly but significantly in a negative manner (R = −0.067; p<0.001; Pearson correlation), implying that they correlated more with retraction than with protraction. The black line indicates the linear regression line and the blue lines the 95% confidence interval. ***p<0.001.
Figure 5 with 4 supplements
4 Hz air-puff stimulation leads to acceleration of the simple spike response and to stronger protraction of the whiskers.
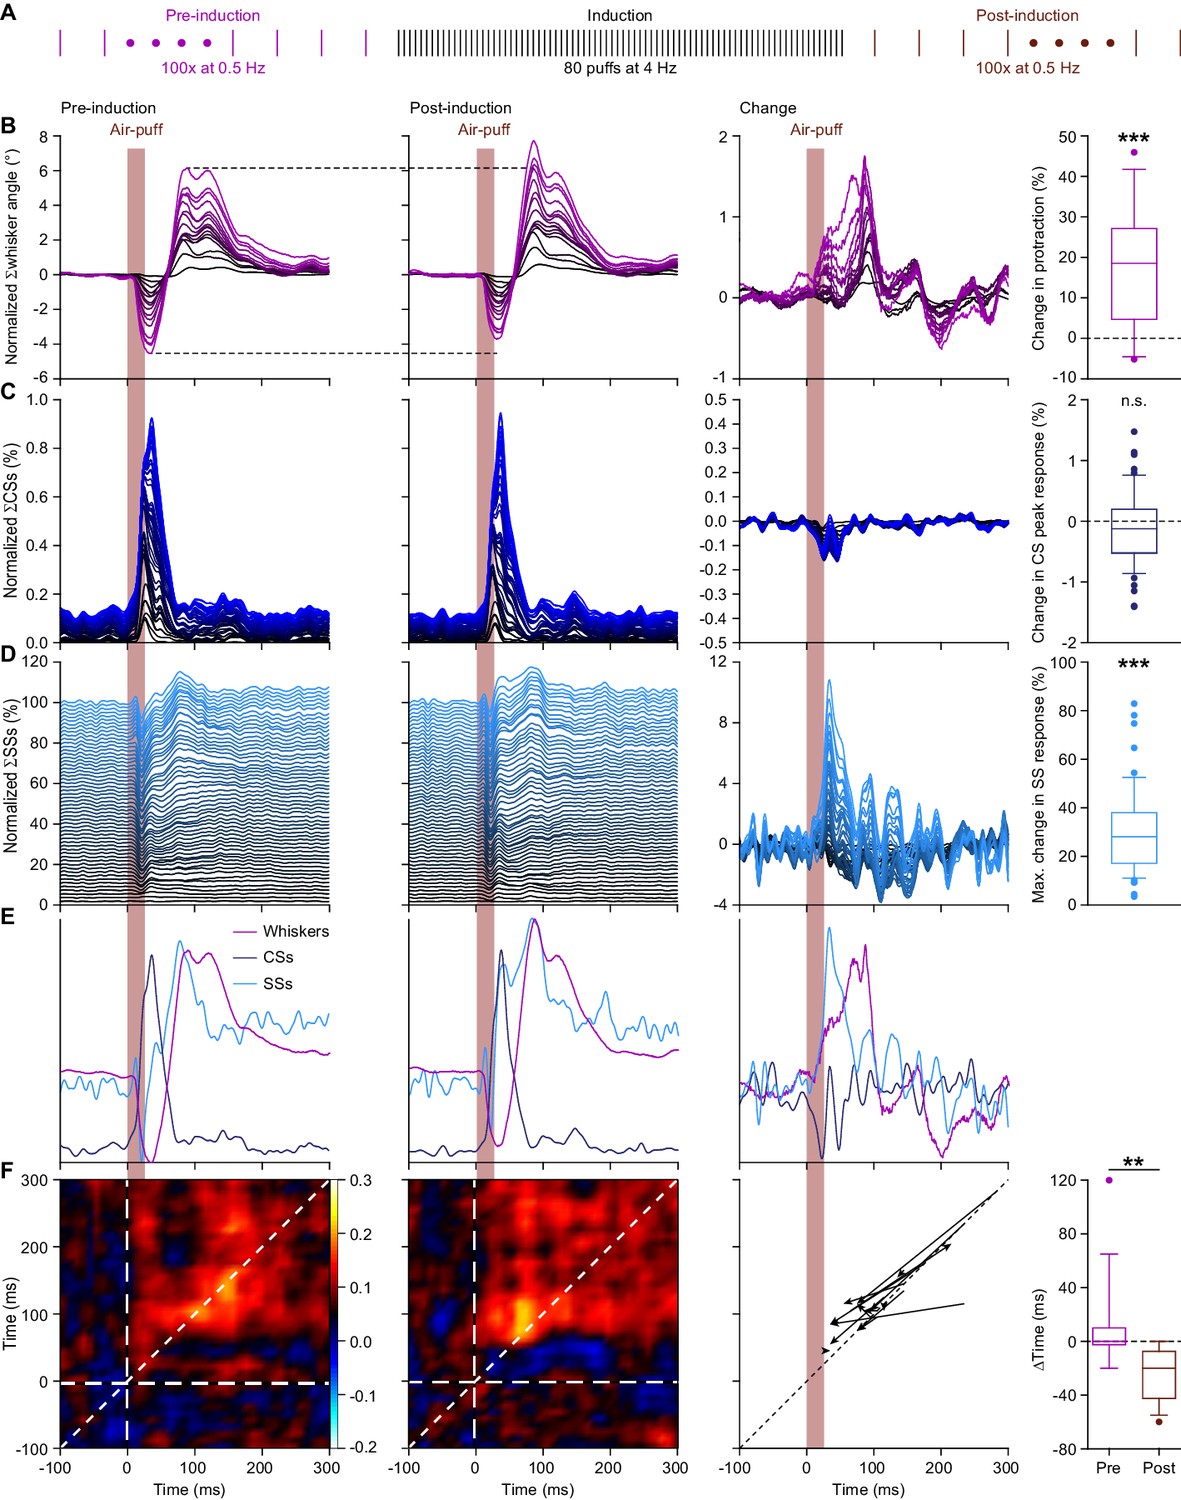
(A) Induction protocol: air-puff stimulation at 0.5 Hz is used to characterize the impact of a brief period (20 s) of 4 Hz air-puff stimulation. (B) Stacked line plots showing the averaged whisker responses before (1st column) and after (2nd column) 4 Hz air-puff stimulation. The plots are sorted by the increase of the touch-induced whisker protraction (3rd column). Each color depicts one mouse. Plots are normalized so that the most intense color represents the average of 16 mice. 4 Hz air-puff stimulation leads to a stronger touch-induced whisker protraction (4th column). Similar plots for complex spikes (C), showing little change, and simple spikes (D), showing a clear increase in firing, especially during the early phase of the response. For comparison, the averages are superimposed in (E) (for y-scaling and variations refer to B–D). Trial-by-trial analysis of 14 Purkinje cells before and after 4 Hz air-puff stimulation (cf. Figure 4C–D) highlighting the anticipation of simple spike firing (F). The x-axis is based upon the instantaneous simple spike firing frequency and the y-axis upon the whisker angle. The moment of maximal correlation between simple spike firing and whisker movement anticipated after induction, as can be seen by the change in position of the yellow spot between the correlation plots in the 1st and 2nd column (see also Figure 5—figure supplement 1A–B). After induction, the maximal correlation implied a lead of the simple spikes, as illustrated for each PC in the graph of the 3rd column. Every arrow indicates the shift of the position of the maximal correlation between before and after induction. Overall, the difference in timing between the maximal correlation changed from around 0 ms pre-induction to an approximate lead of 20 ms of the simple spikes after induction (4th column). **p<0.01; ***p<0.001. See also Supplementary file 1B and Source Data File.
-
Figure 5—figure supplement 1—source data 1
Data for Figure 5—figure supplement 1.
- https://doi.org/10.7554/eLife.38852.018
-
Figure 5—source data 1
Data for Figure 5.
- https://doi.org/10.7554/eLife.38852.025
Figure 5—figure supplement 1
Simple spike response anticipates after 4 Hz air-puff stimulation.
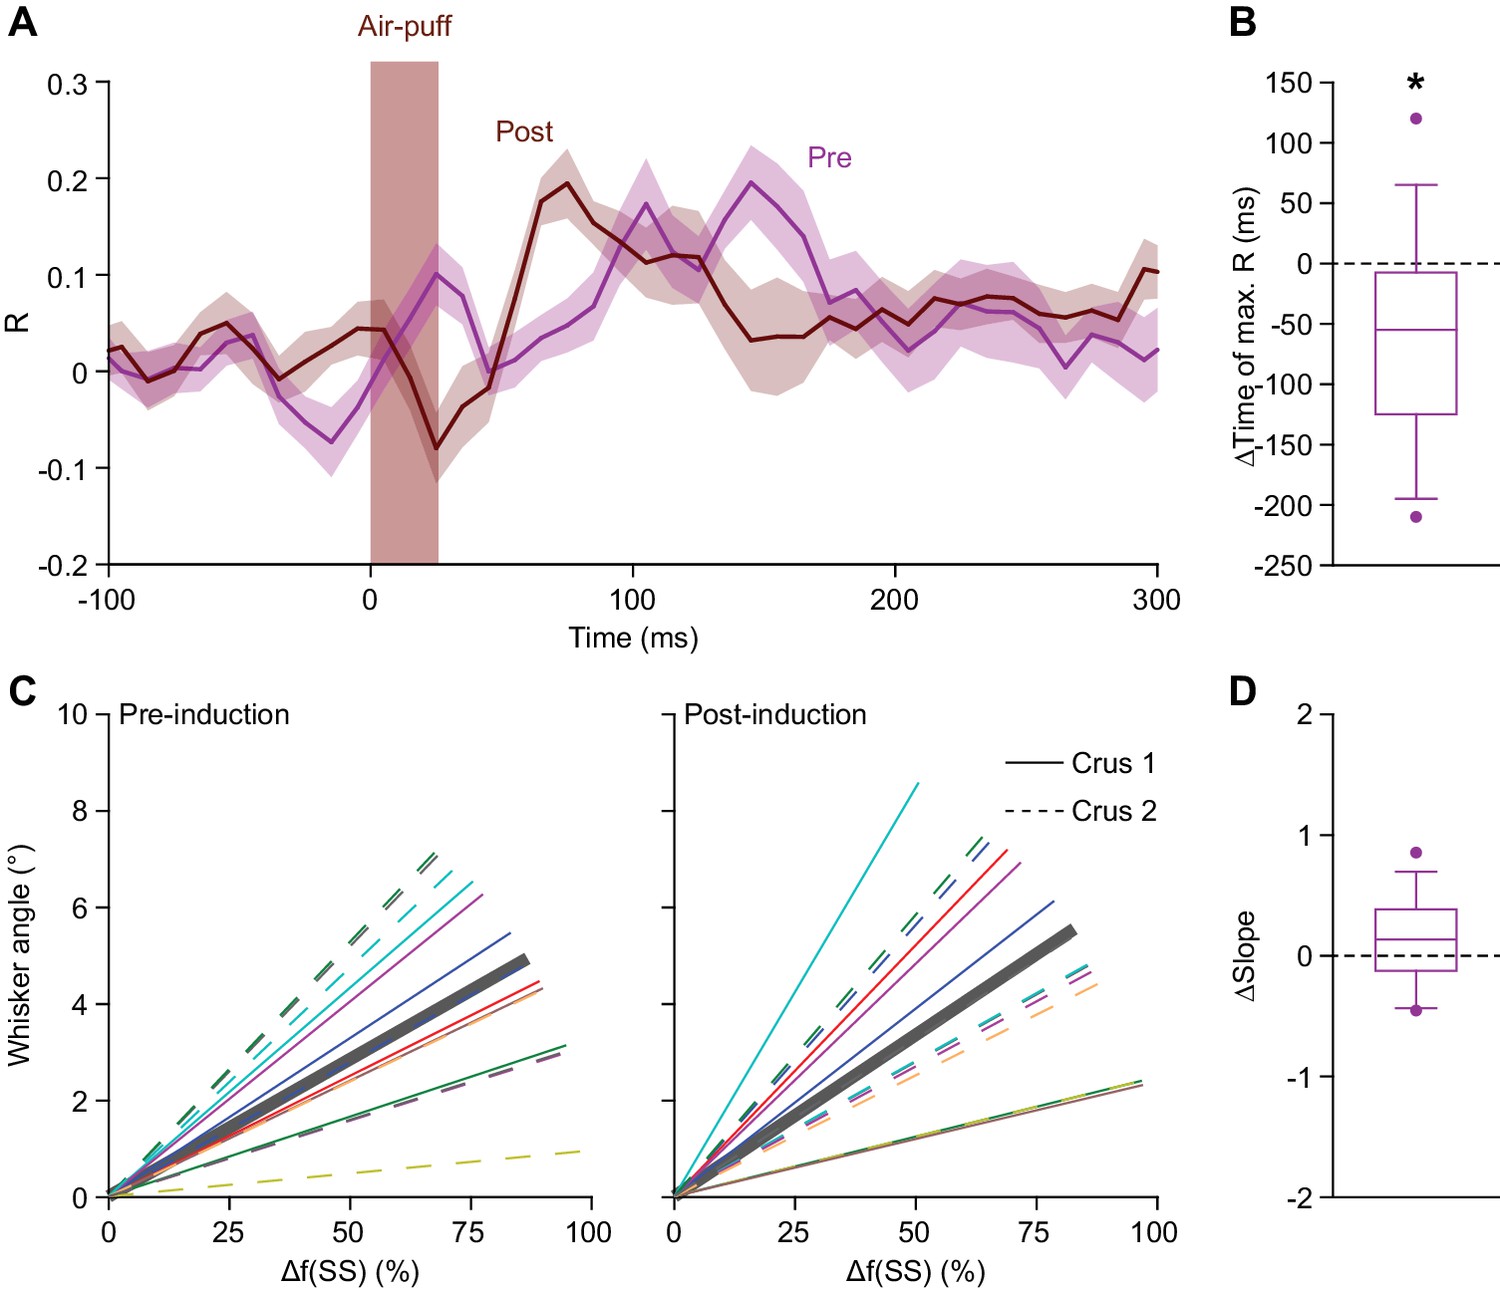
(A) Averaged zero-lag correlation (across the 45° line in Figure 5F) of the instantaneous simple spike rate and whisker position before (magenta) and after (brown) 4 Hz air-puff stimulation, highlighting the faster achievement of the moment of maximal correlation after induction. This shift (again, along the 45° line) is further quantified and illustrated with a box plot (B). *p<0.05. (C). The slopes of the correlations between instantaneous simple spike firing rate and the angle of the whisker are shown before and after 4 Hz air-puff stimulation for the 14 individual PCs that showed significant correlation. Despite the cells with the highest R correlation values were located in lateral crus 2, no clear difference was observed between the slope of the correlation of the PCs of crus 1 (solid lines) and PCs of crus 2 (dashed lines). (D). No slope change was observed after 4 Hz air-puff stimulation. This indicates that the plasticity induction did not change the amount of movement that corresponded to a certain number of spikes. See also Source Data file.
Figure 5—figure supplement 2
Purkinje cell responses during 4 Hz air-puff stimulation.
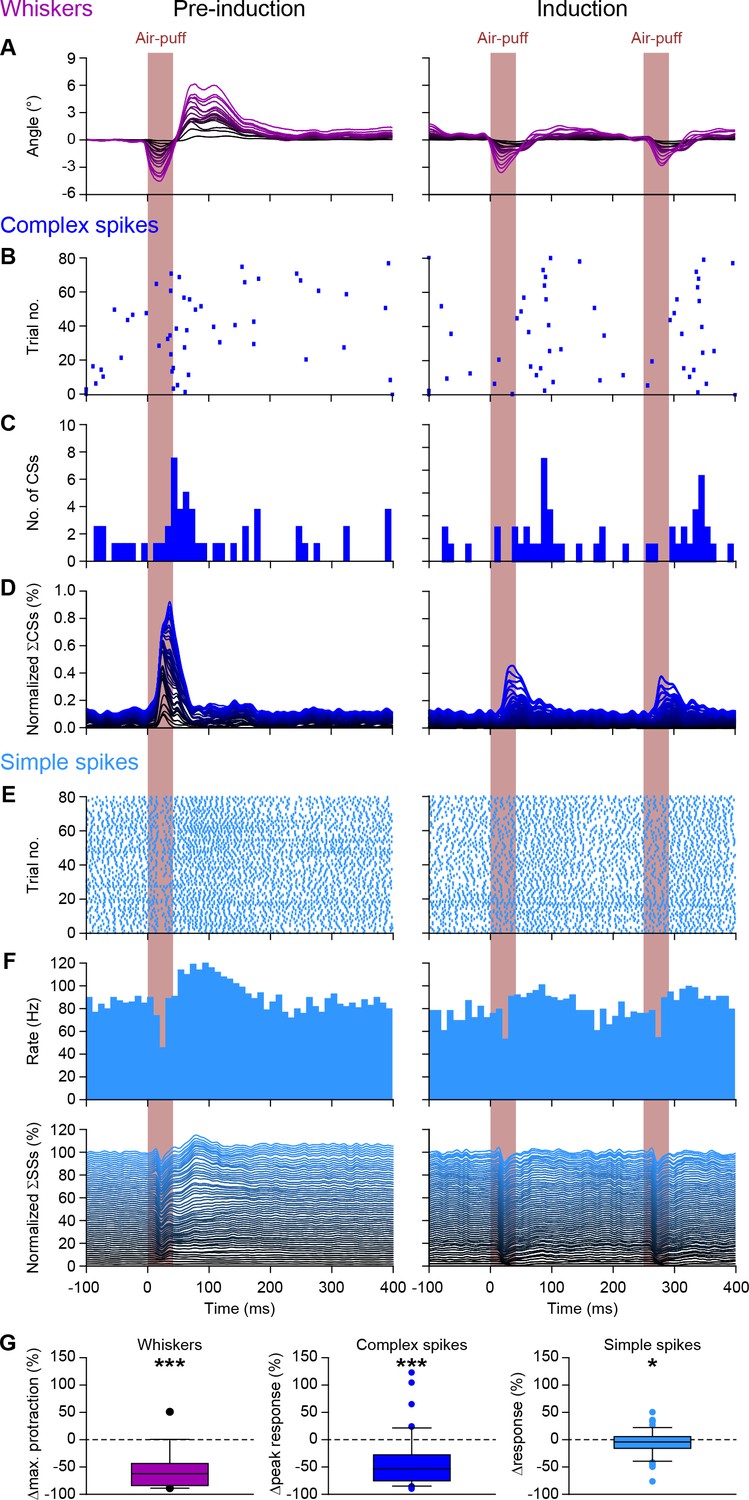
(A) Normalized stacked line plots showing the whisker movement in 16 mice during the pre-induction block (100 trials; left) and during the induction block (80 trials; right). The retraction caused by the air flow is largely intact, but the subsequent touch-induced whisker protraction is largely reduced during 4 Hz stimulation as compared to 0.5 Hz stimulation during the pre-induction block. (B) Raster plots of the complex spike responses to whisker pad air-puff stimulation during the first 80 trials of a pre-induction block and during the 80 trials of the induction block with the accompanying peri-stimulus time histograms (C). (D) Normalized stacked line plots show that the rate of complex spike responses is reduced upon a higher stimulation frequency (n = 55). (E–F) The same plots depicted for the simple spike response. (G) Box plots showing the decreased whisker, complex spike peak response and simple spike modulation during the first 200 ms after puff onset. *p<0.05; ***p<0.001 (Wilcoxon matched-pairs test). See also Source Data File.
-
Figure 5—figure supplement 2—source data 1
Data for Figure 5—figure supplement 2.
- https://doi.org/10.7554/eLife.38852.020
Figure 5—figure supplement 3
Contralateral whisker pad stimulation induces stronger whisker protraction and stronger simple spike responses.
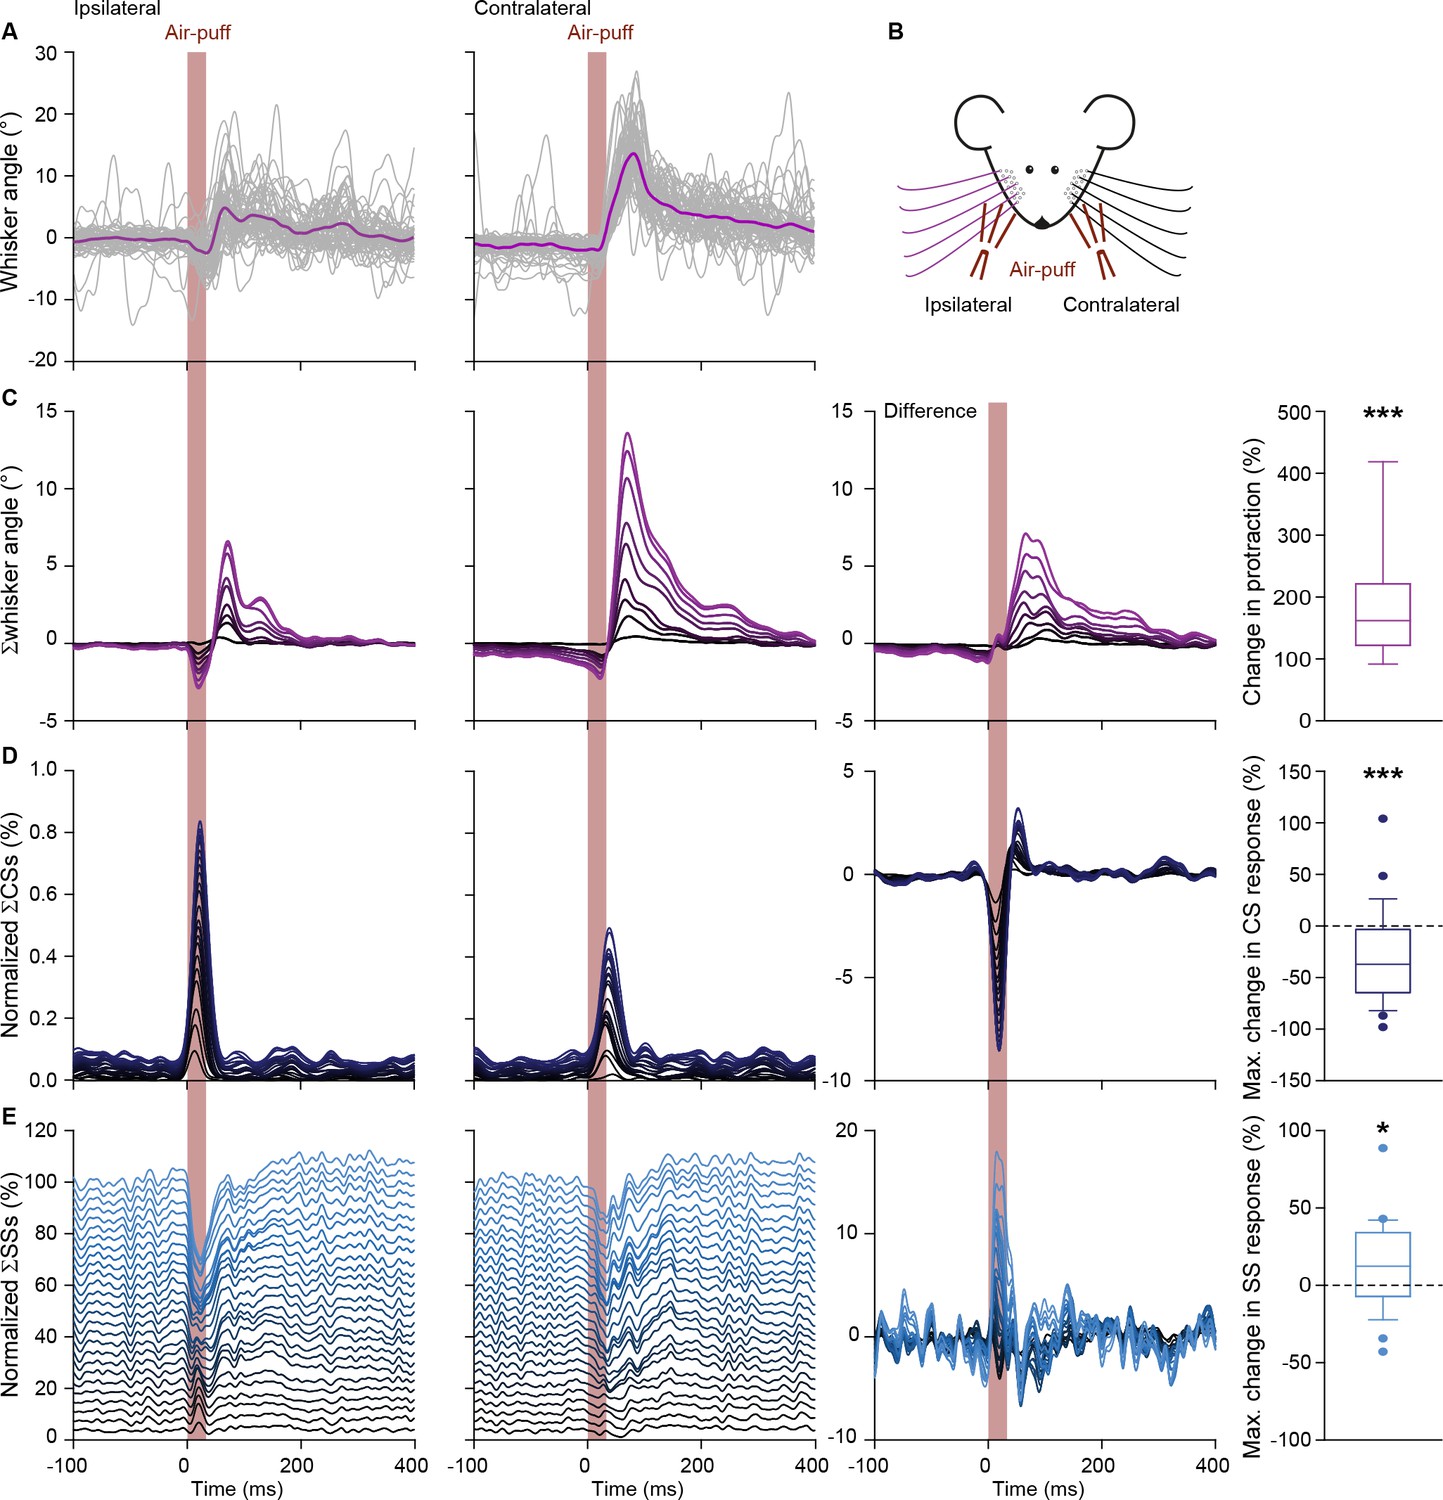
(A) Whisker traces of a representative mouse following air-puff stimulation of the ipsilateral (left panel) and contralateral (right panel) whisker pad (see scheme in B). Despite a similar strength of stimulation, the protraction of the whiskers was larger upon contralateral stimulation (cf. Figure 1—figure supplement 2). (C) Stacked line plots of the averaged whisker traces of 9 mice with the difference between the contralateral and ipsilateral stimulation depicted in the third column. (D) Complex spike responses, on the other hand, were more prominent upon ipsilateral stimulation. (E) The observation that increased simple spike firing correlates to enhanced whisker protraction (cf. Figure 4) was confirmed under these experimental conditions. *p<0.05; ***p<0.001. See also Data Source File.
-
Figure 5—figure supplement 3—source data 1
Data for Figure 5—figure supplement 3.
- https://doi.org/10.7554/eLife.38852.022
Figure 5—figure supplement 4
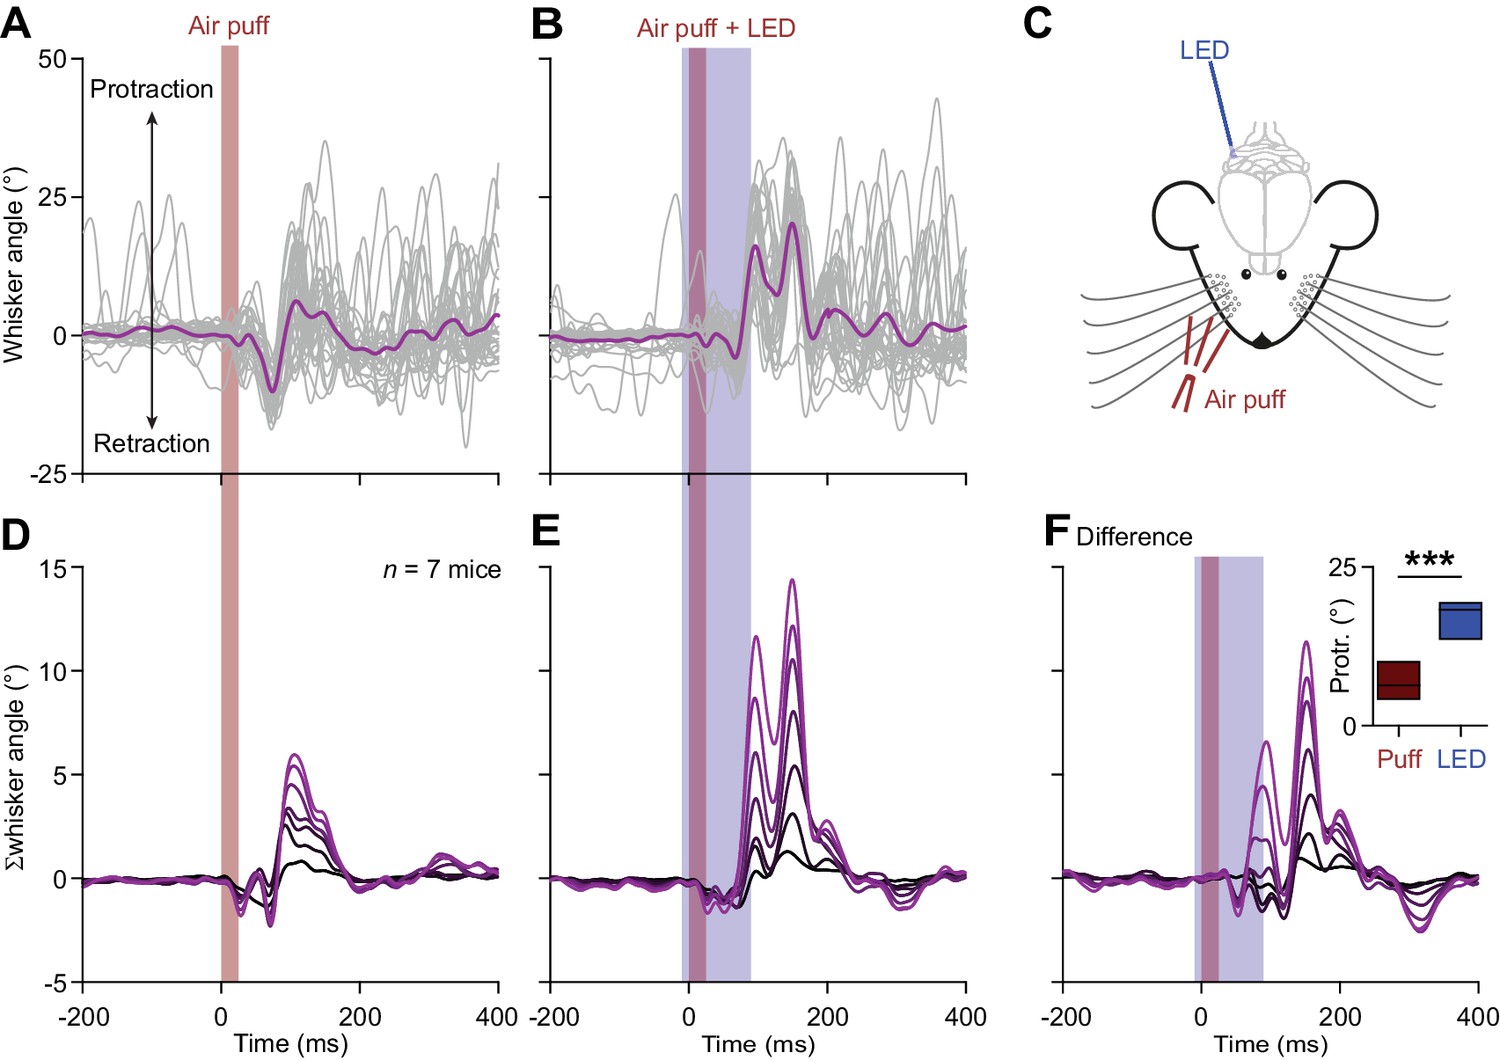
Optogenetic stimulation of Purkinje cells increases whisker protraction following air-puff stimulation.
(A) Air-puff stimulation of the whisker pad induces reflexive touch-induced whisker protraction. (B) This protraction is enhanced when the sensory stimulus is paired with optogenetic stimulation of PCs. These two panels show whisker traces from a Pcp2-Ai27 mouse that expresses ChR2 specifically in its PCs. An optic fiber with a diameter of 400 μm was placed on the surface of the cerebellum centrally at the fissure between crus 1 and crus 2 (C). Optogenetic stimulation of these mice results in increased simple spike firing. Stacked line plots of the whisker traces of 7 mice tested in this way following air-puff stimulation alone (D) and in combination with PC stimulation (E). (F) The increased PC activity correlated with stronger protraction as evidenced by the differential traces. The inset shows a comparison of the maximal protraction (Protr.) under the two stimulus conditions; ***p<0.001 (paired t test). See also Source Data File.
-
Figure 5—figure supplement 4—source data 1
Data for Figure 5—figure supplement 4.
- https://doi.org/10.7554/eLife.38852.024
Figure 6 with 2 supplements
Complex spikes inhibit increased simple spike firing.
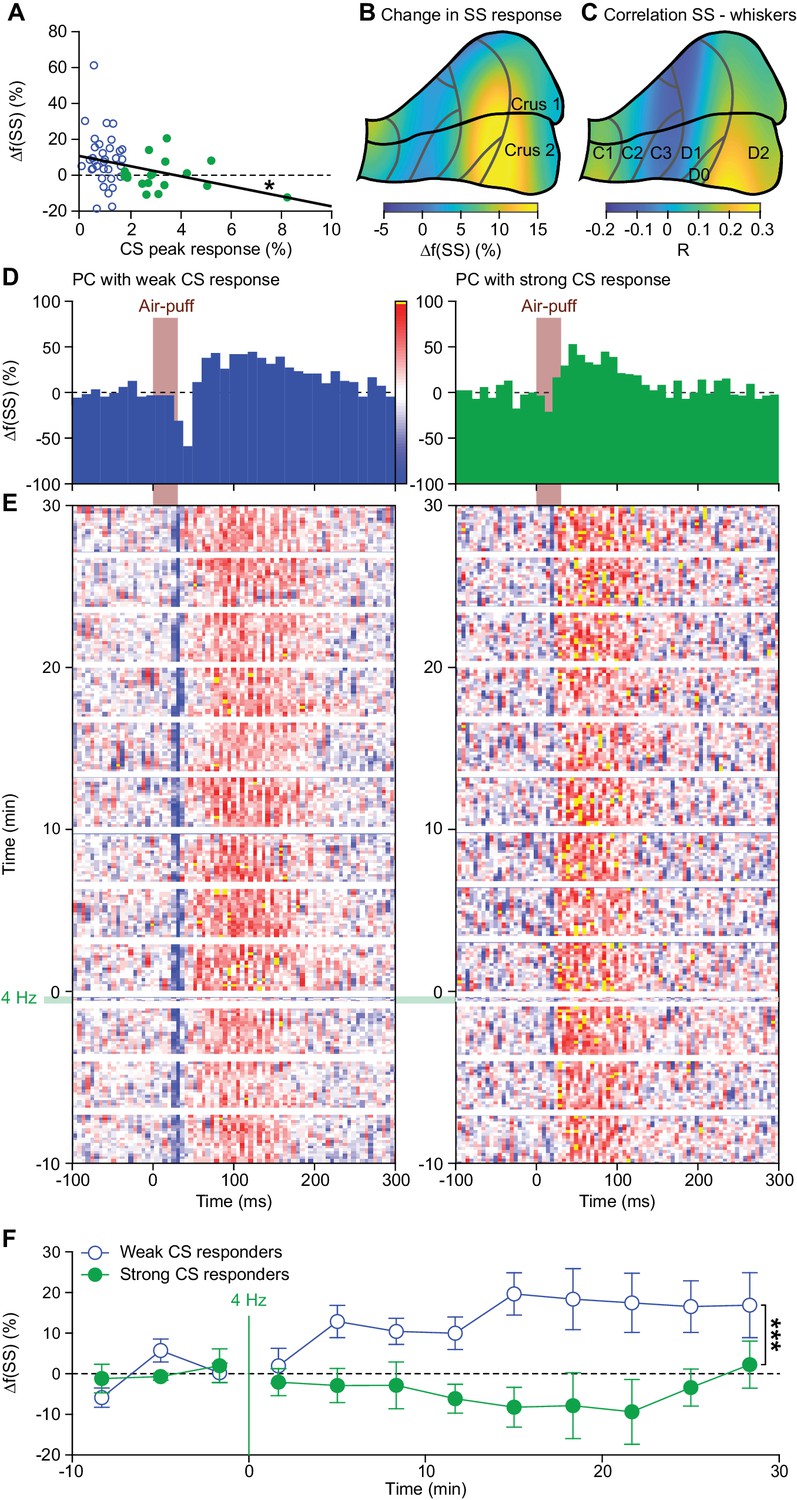
(A) Repeated sensory stimulation induced an increase in simple spike (SS) response to whisker pad stimulation (see Figure 5). This increase in simple spike responses was, however, not observed in all PCs: there was a clear negative correlation between the strength of the complex spike (CS) response and the potentiation of the simple spike response. Overall, the simple spike potentiation was larger in the PCs with a weak complex spike response than in those with a strong complex spike response (cf. Figure 2—figure supplement 1). (B) Heat map showing the anatomical distribution of the strength of the simple spike increase projected on the surface of crus 1 and crus 2. The 55 PCs were attributed to a rectangular grid. The average simple spike response strength was calculated per grid position and averaged between each grid position and its neighbor. The grey lines indicate the borders to the cerebellar zones (see Figure 2—figure supplement 2D). (C) Heat map of the distribution of PCs cells based upon the correlation of their simple spike rate and whisker position (cf. Figure 4D). Note that the strongest increase of simple spike responses after 4 Hz air-puff stimulation occurred in the region that also displayed the strongest correlation between instantaneous simple spike rate and whisker position. (D) Example PSTHs of the simple spike response to whisker pad air-puff stimulation of representative PCs and how they changed over time, depicted as heat maps of the instantaneous simple spike frequency (E); see scale bar in (D). The left column displays the data from a PC with a weak complex spike response, the right column of one with a strong complex spike response. The induction period is indicated with ‘4 Hz’. (F) The number of simple spikes following an air-puff stimulation increased in weakly responding Purkinje cells and this increase remained elevated until the end of the recording (at least 30 min). In contrast, this increase was not found in Purkinje cells with strong complex spike responses. *p<0.05; **p<0.01; ***p<0.001.
Figure 6—figure supplement 1

Complex spike rates are negatively correlated with sensory-induced potentiation.
(A) Scatter plots with linear regression lines between complex spike (CS) (left) and simple spike (SS) frequency (right) during the pre-induction (top) and the induction (bottom) period with the percentage of change in simple spike response between post- and pre-induction. The complex spike firing rate was negatively correlated with the change in simple spike responses in those PCs that had weak complex spike responses (see Figure 2—figure supplement 1) – both during the pre-induction and during the induction interval. However, no such significant correlation was found in the strong complex spike responders. The simple spike rate did not have a significant correlation with simple spike responses. (B) In contrast to the absolute firing rate, the difference in complex spike firing during the pre-induction versus the induction block did not show a clear correlation with changes in simple spike responsivity (left). Increased simple spike firing during the induction block, however, correlated well with increased sensory simple spike responses during the post-induction block. Thick lines indicate significant linear correlations (p<0.002).
Figure 6—figure supplement 2
4 Hz air-puff stimulation enhances reflexive whisker protraction for at least 30 min.
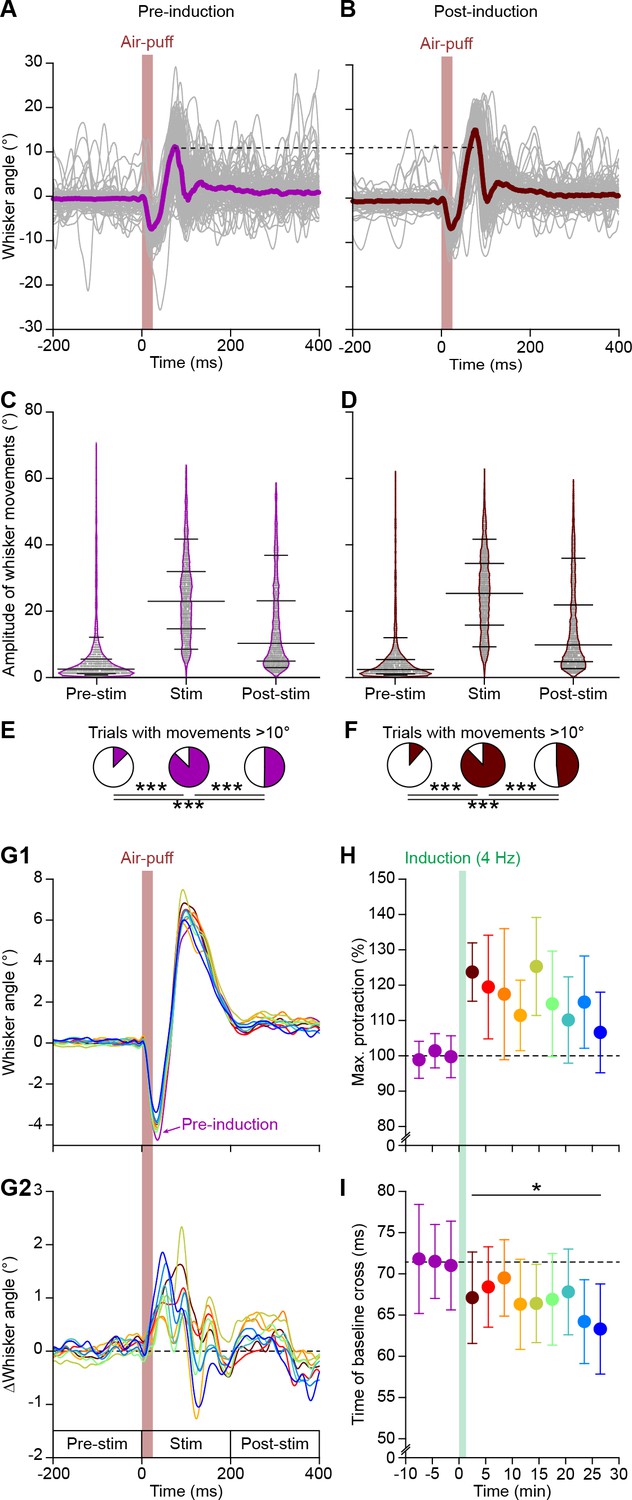
(A) The variability in whisker movements is illustrated by superimposing the average whisker angle during the 100 trials before 4 Hz air-puff stimulation. The thick line indicates the median. (B) The first 100 trials after induction of the same experiment as in (A), showing a clear increase in whisker protraction. Violin plots showing the amplitudes (differences between maximal retraction and maximal protraction in the indicated 200 ms intervals; see G2) of individual trials before (C) and after (D) induction. Obviously, the most prominent whisker movements were observed in the period between 0 and 200 ms after whisker pad air-puff stimulation, as compared to the 200 ms intervals before and after this period (n = 16 mice). Horizontal lines denote the 10th, 25th, 50th, 75th and 90th percentiles. Fractions of trials with movements exceeding 10° before (E) and after (F) induction. Especially the active protraction during the first 200 ms after the stimulus is clearly enhanced. Note that the panels (A), (C) and (E) are the same as in Figure 1—figure supplement 1 and are displayed here to illustrate the impact of 4 Hz stimulation on whisker movements. (G1) Averaged whisker traces (ordered per 100 trials) of seven mice where video data were available for the whole recording, showing less retraction and more protraction after induction. For clarity, only the average of the last 100 trials pre-induction is plotted. Color codes as in panel (H). (G2) Differential traces show that whiskers remain further protracted, but that over time this became faster. (H) 4 Hz air-puff stimulation caused increased whisker protraction during the whole recording (30 min). The switch from retraction to protraction (calculated as the time at which the whisker were back at the resting position after the initial retraction) remained faster throughout the recording (I). *p<0.05; ***p<0.001.
Figure 7 with 1 supplement

Expression of PP2B in Purkinje cells is required for increased protraction and simple spike firing following 4 Hz air-puff stimulation.
(A) Schematic representation of the principal pathways regulating bidirectional plasticity at the parallel fiber (PF) to Purkinje cell (PC) synapses. The direction of PF-PC plasticity depends on the intracellular Ca2+ concentration ([Ca2+]i) that is largely determined by climbing fiber (CF) activity. Following CF activity, [Ca2+]i raises rapidly and activates a phosphorylation cascade involving α-Ca2+/calmodulin-dependent protein kinase II (CaMKIIA) and several other proteins eventually leading to internalization of AMPA receptors and consequently to long-term depression (LTD). PF volleys in the absence of CF activity, on the other hand, result in a moderate increase in [Ca2+]i, activating a protein cascade involving protein phosphatase 2B (PP2B, encoded by Ppp3r1) that promotes the insertion of new AMPA receptors into the postsynaptic density, thereby leading to long-term potentiation (LTP) of the PF-PC synapse. GluA3 subunits are part of the postsynaptic AMPA receptors. (B) Example of a representative mouse with the averaged whisker movements before and after 4 Hz air-puff stimulation, showing a stronger protraction afterwards, as evidenced by the differences between post- and pre-induction compared to a bootstrap analysis on the normal variation in whisker movements (C); shade: 99% confidence interval). Variations in whisker protraction in Pcp2-Ppp3r1 mutants did generally not exceed the expected variability (right). (D) Stacked line plots of whisker movement differences between post- and pre-induction for all mice highlighting the absence of increased touch-induced whisker protraction in Pcp2-Ppp3r1 mutant mice. The plots are normalized so that the brightest line indicates the average per genotype (n = 16 WT and n = 13 Pcp2-Ppp3r1 KO mice). (E) The average maximal protraction before and after induction for each mouse confirms the increase in WT, but not in Pcp2-Ppp3r1 mutant mice. The colored symbols indicate the average per genotype. (F) In contrast to simple spike responses in WT mice, those in Pcp2-Ppp3r1 KO mice could not be potentiated by our 4 Hz air-puff stimulation protocol. This effect was stable, also during longer recordings. For this analysis, we selected those with weak complex spike responses, as the PCs with a strong complex spike response did not show increased simple spike firing after four air-puff stimulation (see Figure 6A). *p<0.05; **p<0.01; ***p<0.001.
Figure 7—figure supplement 1
Also in Pcp2-Ppp3r1 KO mice, complex spike rates are negatively correlated with sensory-induced potentiation.
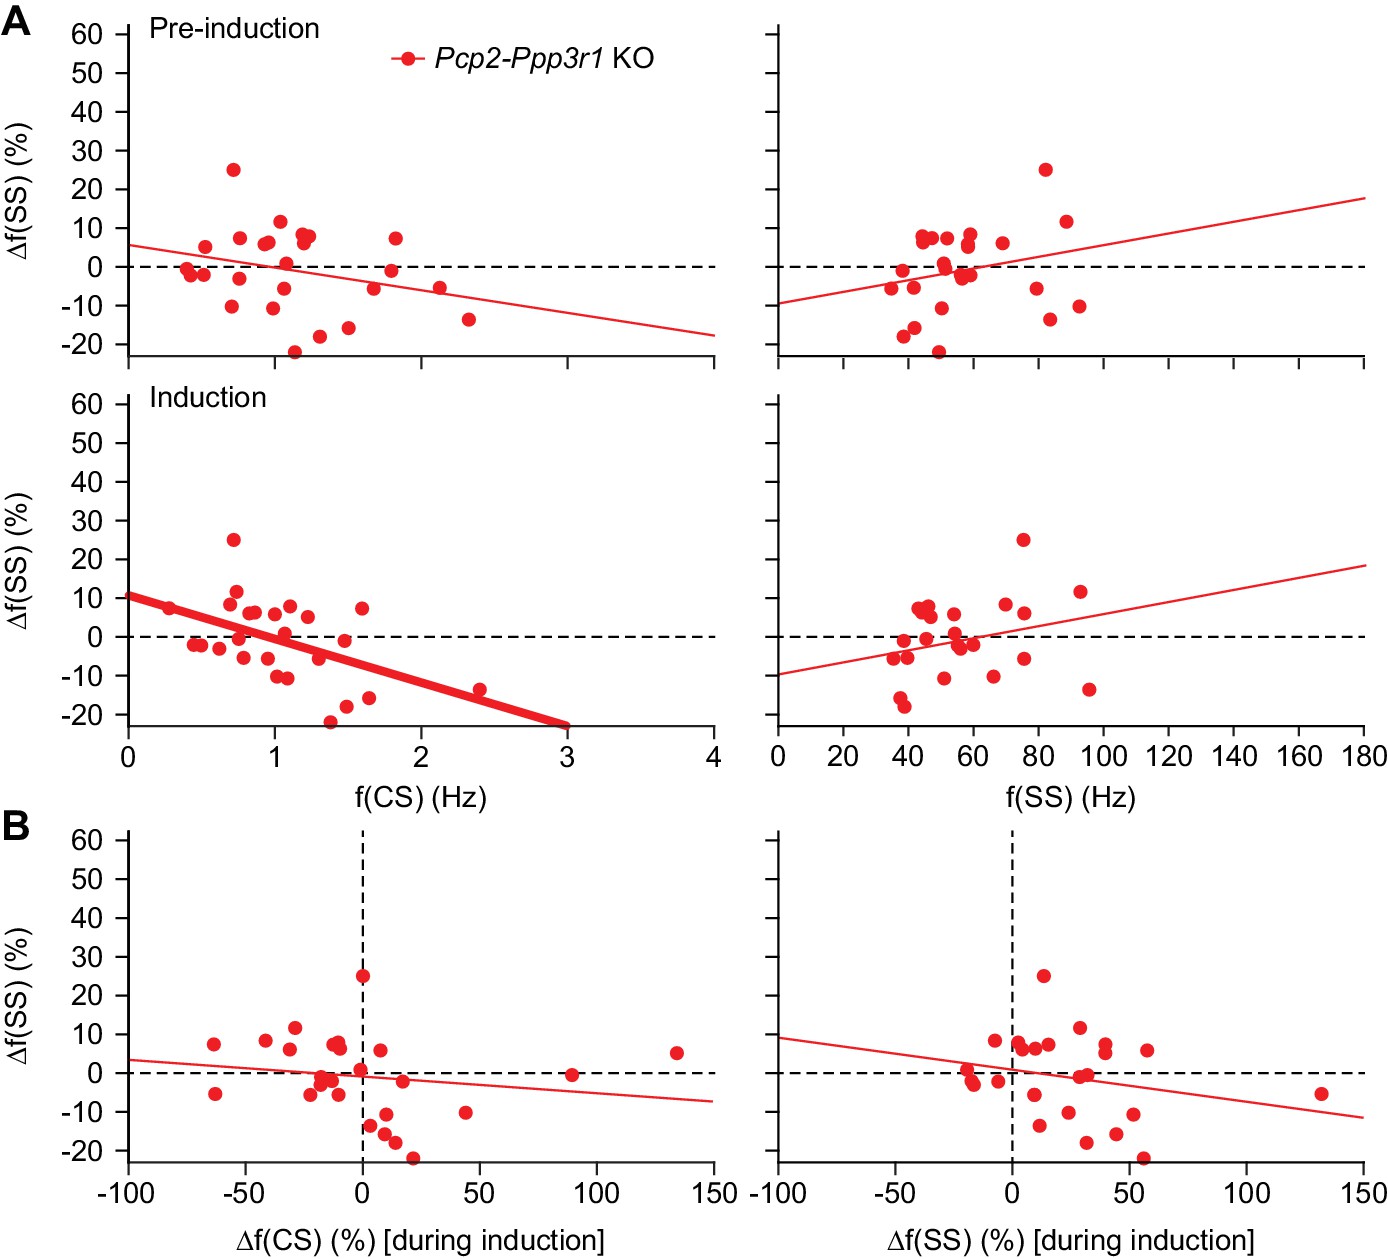
(A) Scatter plots with linear regression lines between complex spike (CS) (left) and simple spike (SS) frequency (right) during the pre-induction (top) and the induction (bottom) period with the percentage of change in simple spike response between post- and pre-induction in Pcp2-Ppp3r1 KO mice (see Figure 6—figure supplement 1 for the results of the WT littermates). The complex spike firing rate was negatively correlated with the change in simple spike responses, in particular during the induction interval. The simple spike rate did not have a significant correlation with simple spike responses. (B) In contrast to the absolute firing rate, the difference in complex spike firing during the pre-induction versus the induction block did not show a clear correlation with changes in simple spike responsivity (left). In this mutant, a correlation between CS firing (during induction) and changes in simple sensitivity was still observed, possibly reflected the fact that parallel fiber LTD is still intact in these mice. Thick lines indicate significant linear correlations (p<0.002).
Figure 8 with 2 supplements
Expression of AMPA receptor GluA3 subunits in Purkinje cells is required for increased protraction and simple spike firing following 4 Hz air-puff stimulation.
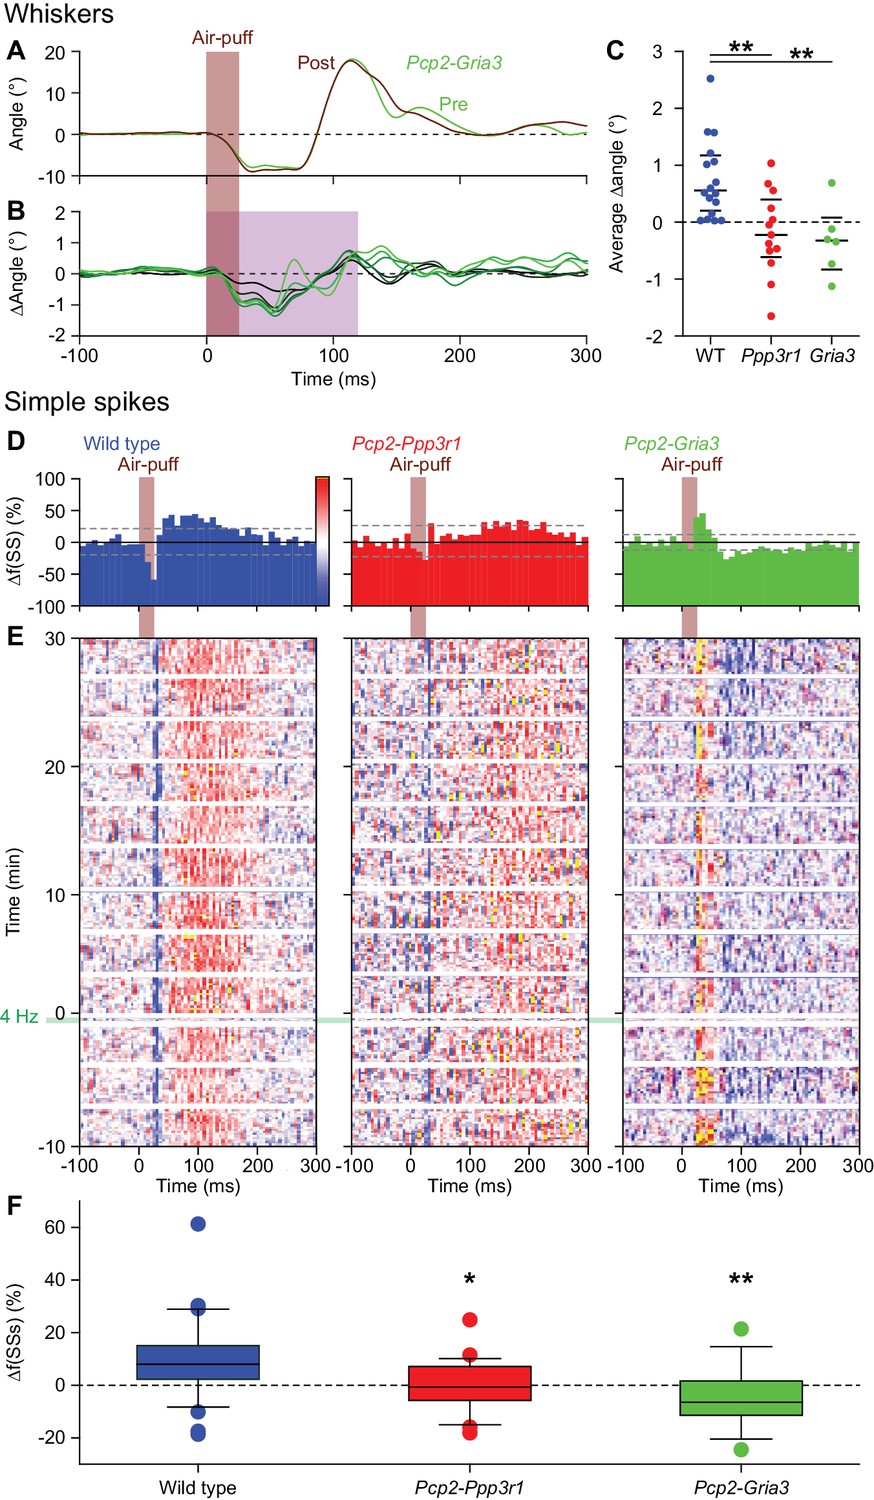
(A) Example of a representative Pcp2-Gria3 mutant mouse that is deficient for the GluA3 subunit with the averaged whisker movements before and after 4 Hz air-puff stimulation, showing similar degrees of protraction. (B) Overall, 4 Hz air-puff stimulation did not result in stronger whisker protraction in Pcp2-Gria3 mutant mice as observed in WT mice (see Figure 7). This is illustrated with a stacked line plot. (C) Comparison of the average change in whisker angle over the 120 ms following the onset of the air-puff shows enhanced protraction in WT (n = 16), but not in LTP-deficient mice - neither in Pcp2-Ppp3r1 (n = 13) nor in Pcp2-Gria3 (n = 6) mutants, pointing towards a central role for parallel fiber-to-Purkinje cell LTP for the enhanced protraction in WT mice following a brief period of 4 Hz air-puff stimulation. The horizontal lines indicate the medians and the 1st and 3rd quartiles. The lack of change in whisker protraction following 4 Hz air-puff stimulation was reflected in the lack of change in simple spike responses as illustrated in three representative PCs (cf. Figure 6D–E). On top are the peri-stimulus time histograms (D) followed by heat maps illustrating the instantaneous firing rate over time (E). The induction period is indicated with ‘4 Hz’. (F) Overall, WT PCs (n = 35) showed increased simple spike firing after 4 Hz stimulation, while those in Pcp2-Ppp3r1 (n = 21) or Pcp2-Gria3 (n = 13) mutant mice did not. For this analysis, we restricted ourselves to the PCs with weak complex spike responses as the PCs with strong complex spike responses did not show potentiation in the WT mice (see Figure 6A) and to the first 100 trials after induction. *p<0.05; **p<0.01. See also Source Data File.
-
Figure 8—figure supplement 1—source data 1
Data for Figure 8—figure supplement 1.
- https://doi.org/10.7554/eLife.38852.033
-
Figure 8—figure supplement 2—source data 1
Data for Figure 8—figure supplement 2.
- https://doi.org/10.7554/eLife.38852.035
-
Figure 8—source data 1
Data for Figure 8.
- https://doi.org/10.7554/eLife.38852.036
Figure 8—figure supplement 1
Purkinje cell responses to whisker pad stimulation in Pcp2-Ppp3r1 and Pcp2-Gria3 mice.
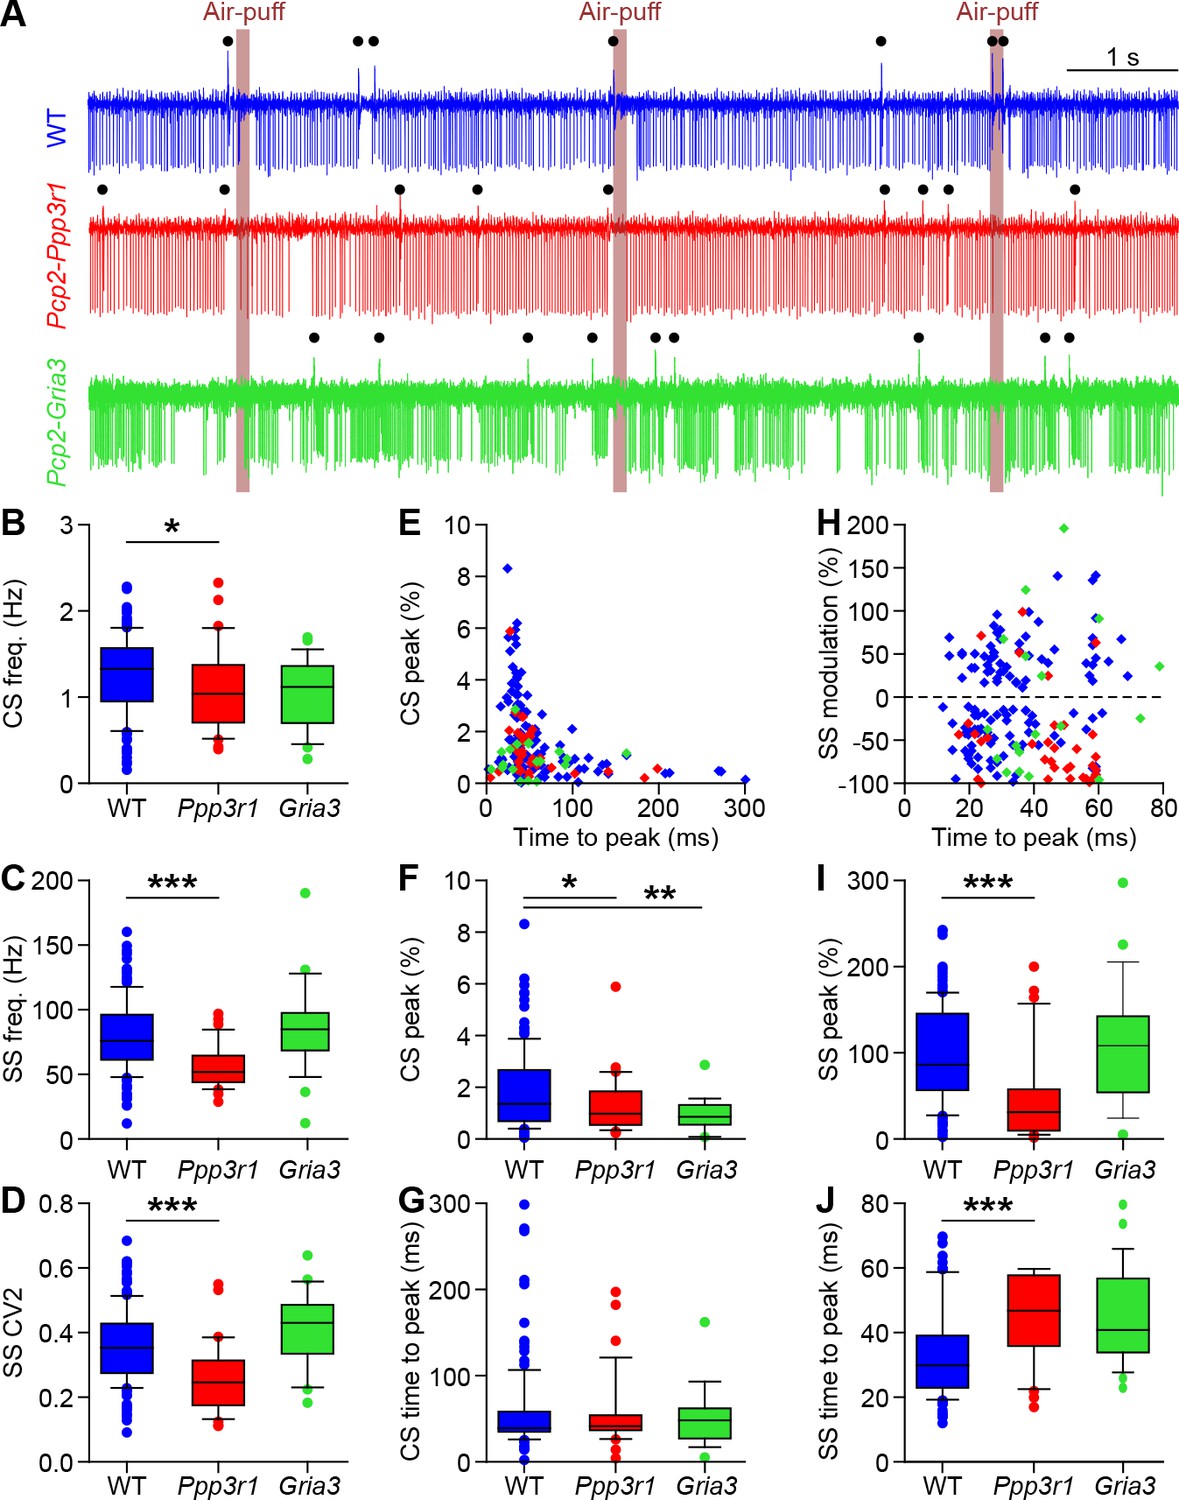
(A) Example recordings of Purkinje cell activity in a wild-type (WT) (top), a Pcp2-Ppp3r1 deficient (middle) and a Pcp2-Gria3 deficient mouse (bottom). The timing of air-puffs to the whisker pad is indicated with light brown lines and that of the complex spikes with black dots above the traces. Compared to their WT littermates, Pcp2-Ppp3r1 mice had a mildly reduced complex spike rate (B), as well as fewer simple spikes (C) that on top were fired more regularly (lower CV2; D). In contrast, the Pcp2-Gria3 mice showed firing patterns that were more similar to their WT littermates. For clarity, the two WT groups are pooled for visualization, but statistics were performed between mutants and their respective control littermates. (E) Complex spike responses to air-puff stimulation were quite similar in the three groups, although the mutants tended to have lower peak responses (F) with normal timing (G). (H) Simple spike responses to air-puff stimulation were similar between WT and Pcp2-Gria3 mice, but Pcp2-Ppp3r1 mice showed more inhibition upon stimulation (I) with a longer latency (J). *p<0.05; **p<0.01; ***p<0.001. See also Supplementary file 1C and Source Data File.
Figure 8—figure supplement 2
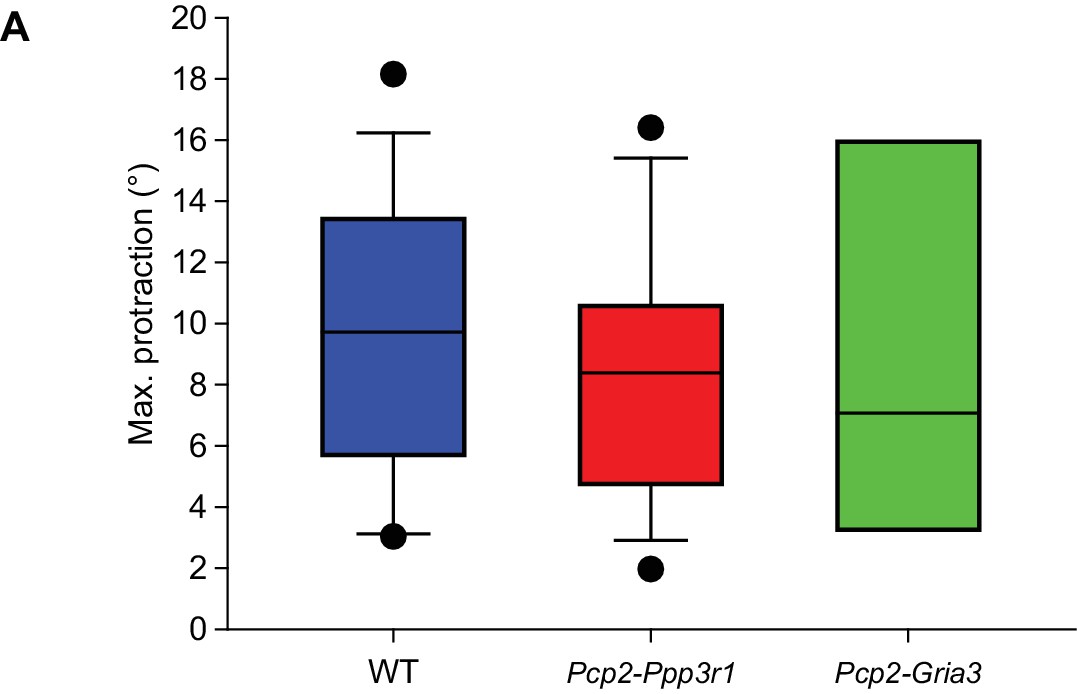
Before induction, touch-induced whisker protraction is not affected by Pcp2-Ppp3r1 and Pcp2-Gria3 mutations.
The maximal touch-induced whisker protraction is similar between wild-type (n = 16), Pcp2-Ppp3r1 (n = 13) and Pcp2-Gria3 (n = 6) mutant mice, indicating that the amplitude of the reflex itself is not affected by any of the mutations involved. p=0.860, F = 0.152, ANOVA. See also Source Data file.
Tables
Key resources table
| Reagent type (species) or resource | Designation | Source or reference | Identifiers | Additional information |
|---|---|---|---|---|
| Strain, strain background (Mus musculus) | Tg(Pcp2-cre)2Mpin; Ppp3r1tm1Stl | (Schonewille et al., 2010) | C57BL/6J background | |
| Strain, strain background (M. musculus) | Tg(Pcp2-cre)2Mpin;Gria3tm2Rsp | (Gutierrez-Castellanos et al., 2017) | C57BL/6J background | |
| Strain, strain background (M. musculus) | C57BL/6J mice | Charles Rivers | IMSR_JAX:000664 | |
| Strain, strain background (M. musculus) | Tg(Pcp2-cre)2Mpin; Gt(ROSA)26Sortm27.1(CAG-OP4*H134R/ tdTomato)Hze | (Witter et al., 2013) | C57BL/6J background | |
| Chemical compound, drug | Dextran, Biotin, 3000 MW, Lysine Fixable (BDA-3000) | Thermo Fisher Scientific | D7135 | |
| Chemical compound, drug | Paraform aldehyde | Merck | 1.040005.1000 | |
| chemical compound, drug | Thionine | Sigma | T-3387 | |
| Chemical compound, drug | Gelatin | J.T.Baker | 2124–01 | |
| software, algorithm | MATLAB v2012a-v2017a | Mathworks | ||
| Software, algorithm | LabVIEW (for video acquisition) | National Instruments | ||
| Software, algorithm | BWTT Toolbox (for whisker tracking) | http://bwtt.sourceforge.net; https://github.com/MRIO/BWTT_PP |
Additional files
-
Supplementary file 1
This file contains tables with statistical evaluations of data represented in some of the figures.
(A) Overview of statistical tests on whisker movements – belonging to Figure 1—figure supplement 2. (B) Overview of statistical tests – belonging to Figure 5. (C) Overview of statistical tests – belonging to Figure 8—figure supplement 1.
- https://doi.org/10.7554/eLife.38852.037
-
Transparent reporting form
- https://doi.org/10.7554/eLife.38852.038
Download links
A two-part list of links to download the article, or parts of the article, in various formats.
Downloads (link to download the article as PDF)
Open citations (links to open the citations from this article in various online reference manager services)
Cite this article (links to download the citations from this article in formats compatible with various reference manager tools)
Potentiation of cerebellar Purkinje cells facilitates whisker reflex adaptation through increased simple spike activity
eLife 7:e38852.
https://doi.org/10.7554/eLife.38852


