The aryl hydrocarbon receptor and interferon gamma generate antiviral states via transcriptional repression
- The Rockefeller University, United States
- Emory University, United States
- Kyung Hee University, South Korea
Figures
Figure 1 with 2 supplements
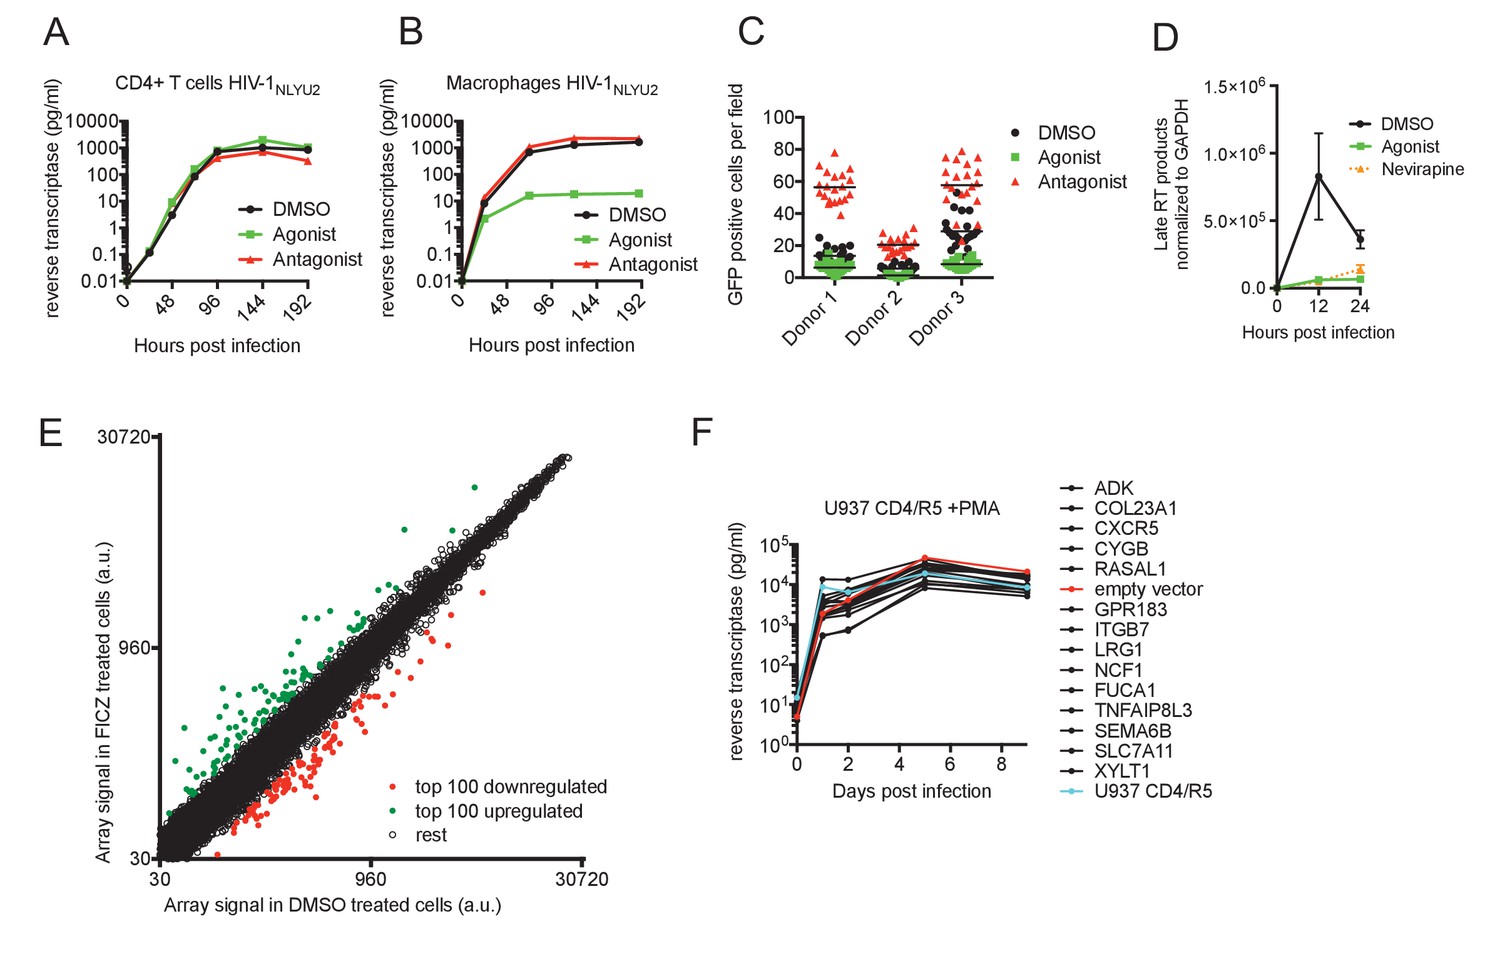
AhR activation inhibits HIV-1 replication in macrophages.
(A and B) HIV-1NLYU2 replication in CD4+ T cells (A) or macrophages (B) treated with AhR agonist or antagonist. Representative of at least three different donors. (C) Numbers of infected macrophages after HIV-1NLYU2-GFP single-round infection. Each symbol represents a single field in which numbers of infected cells were counted. (D) Quantitative PCR analysis of late HIV-1 DNA (late reverse transcript (RT)) abundance in macrophages. Error bars represent standard deviation, n = 4. (E) Microarray analysis of RNA extracted from macrophages treated with AhR agonist or control. The array signal is plotted in arbitrary units (a.u.). (F) HIV-1NLYU2 replication in a PMA-differentiated monocytic cell line (U937 CD4/R5) transduced with a lentiviral vectors (CSIB) expressing the indicated genes that were upregulated in response to the AhR agonist (from panel (E)). Representative example of 2 independent experiments.
Figure 1—figure supplement 1
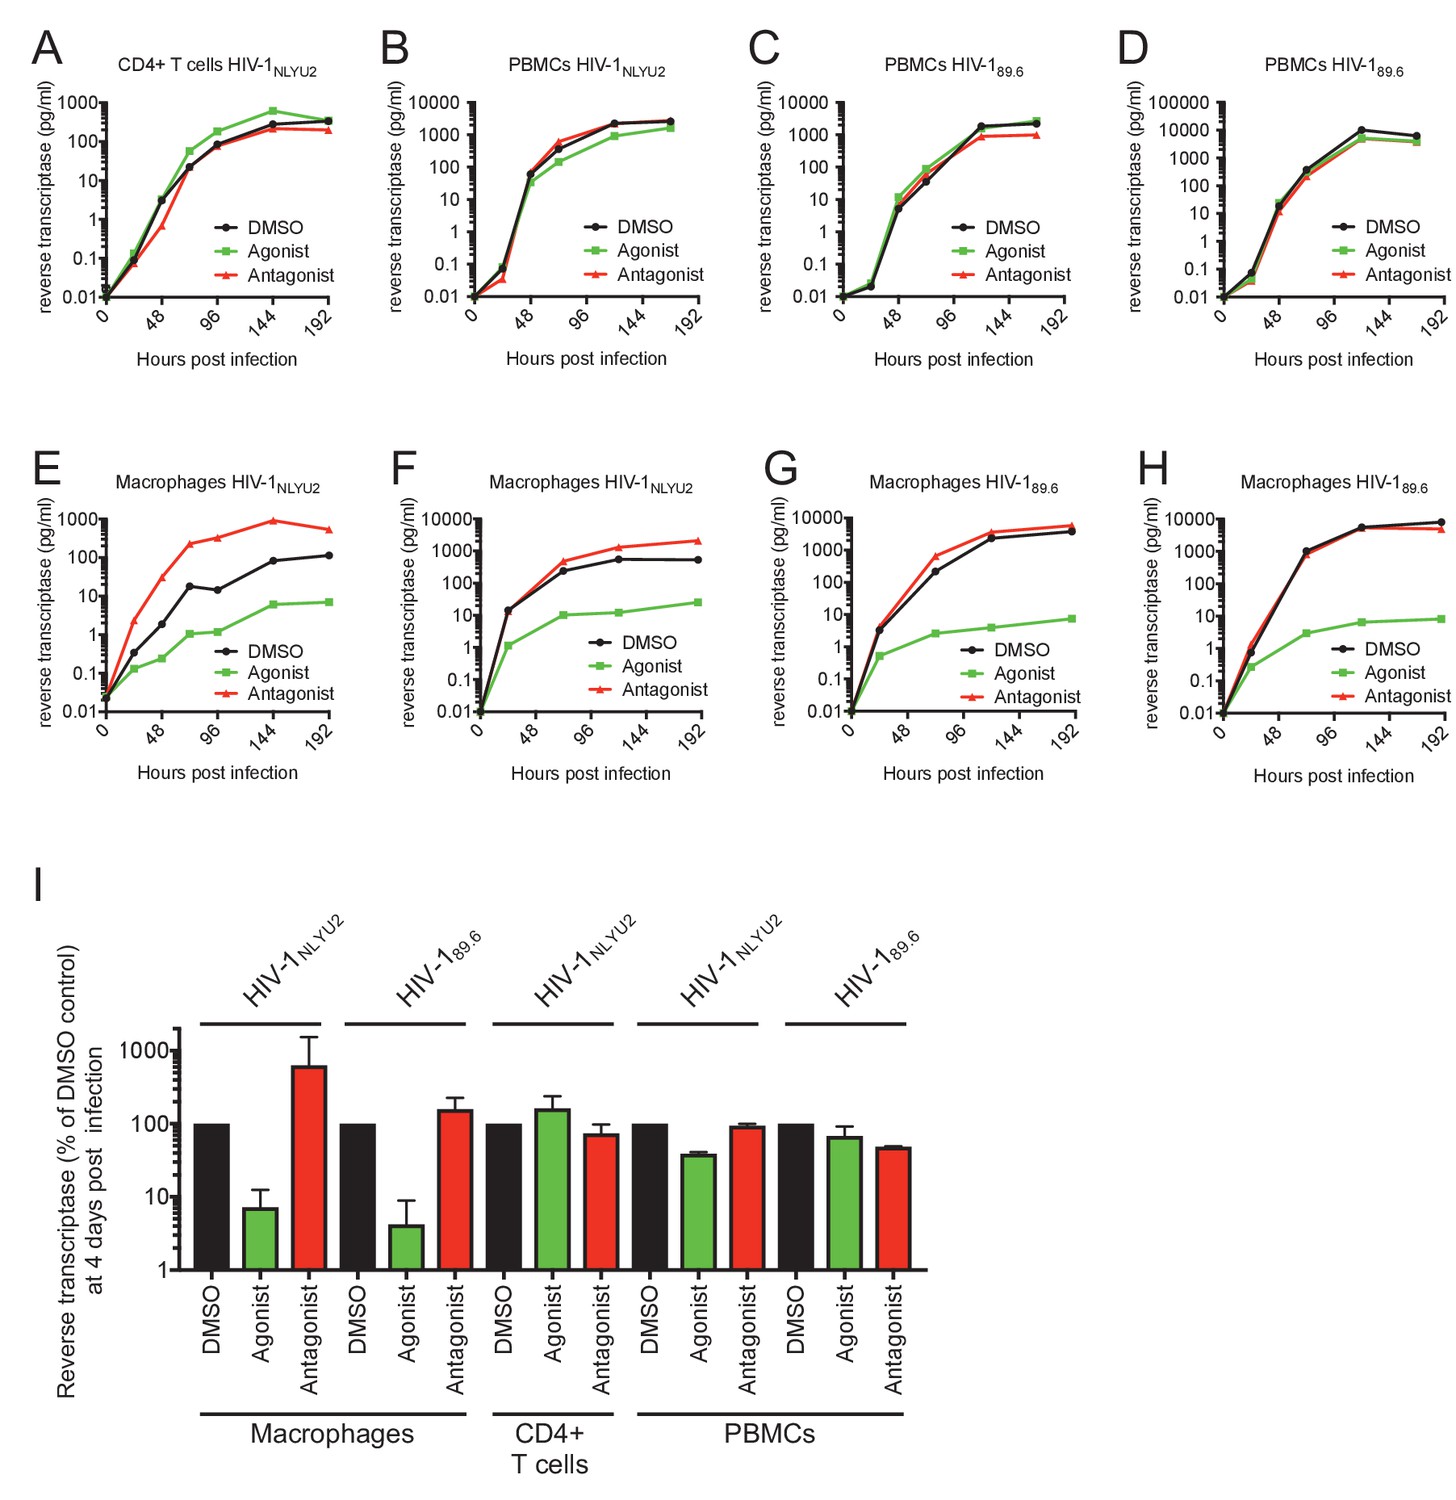
Effect of AhR activation on HIV-1 replication.
(A–H) HIV-1 replication in CD4+ T cells (A) PBMCs (B–D) or macrophages (E–H), using strain HIV-1NLYU2 or HIV-189.6, as indicated. (I) Comparison of HIV-1 supernatant reverse transcriptase levels, at four days after infection in infected macrophages, CD4+ T cells or PBMCs treated with AhR agonist or antagonist. Error bars represent standard deviation of data from at least two different donors.
Figure 1—figure supplement 2
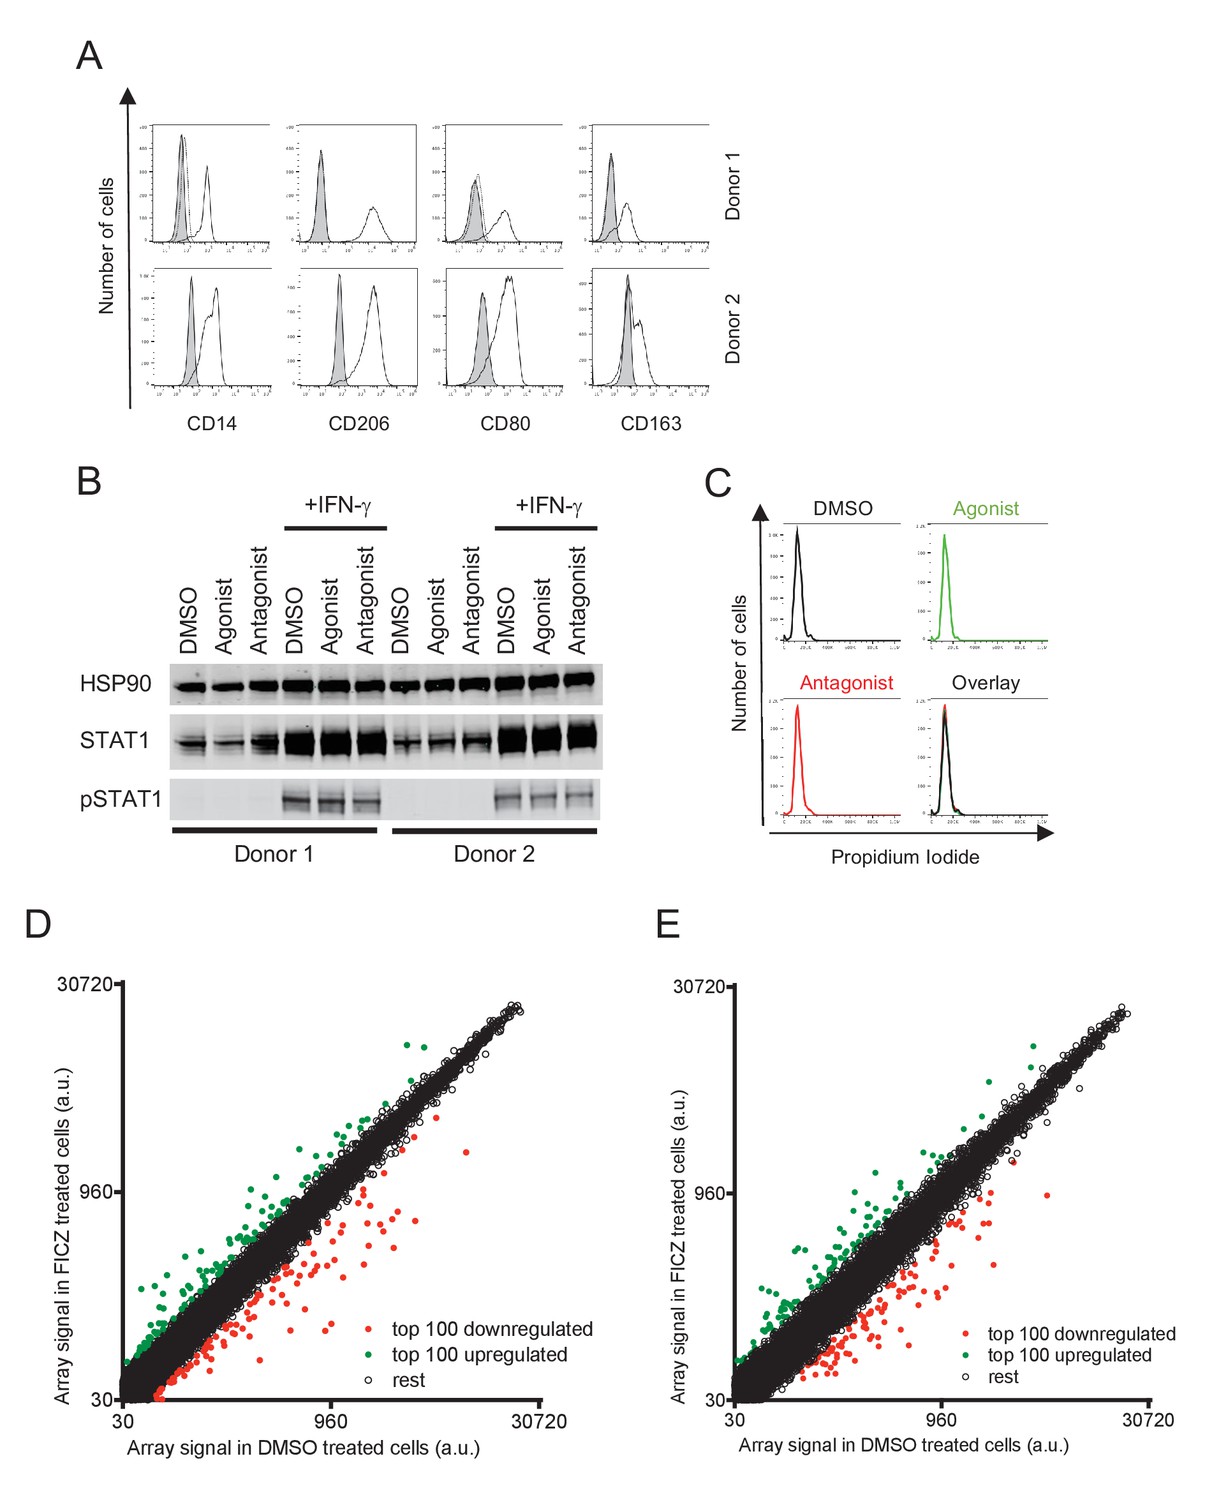
Effect of AhR activation on STAT1, cell-cycle and gene expression in macrophages.
(A) FACS analysis of macrophages stained for classical macrophage markers (CD14, CD208) and M1 and M2 macrophage markers (CD80 and CD168, respectively). The shaded histograms represents unstained macrophages and the dotted line represents isotype controls. (B) Western blot analysis of STAT1 and phosphorylated STAT1 protein levels in macrophages treated with AhR agonist or antagonist and IFN-γ. (C) FACS analysis of macrophages stained with propidium iodide to reveal DNA content distribution following treatment with the AhR agonist or antagonist. Representative of 3 different donors. (D and E) Additional examples of microarray analysis of RNA extracted from macrophages from two different donors treated with AhR agonist or control. The array signal is plotted in arbitrary units (a.u.).
Figure 2 with 1 supplement
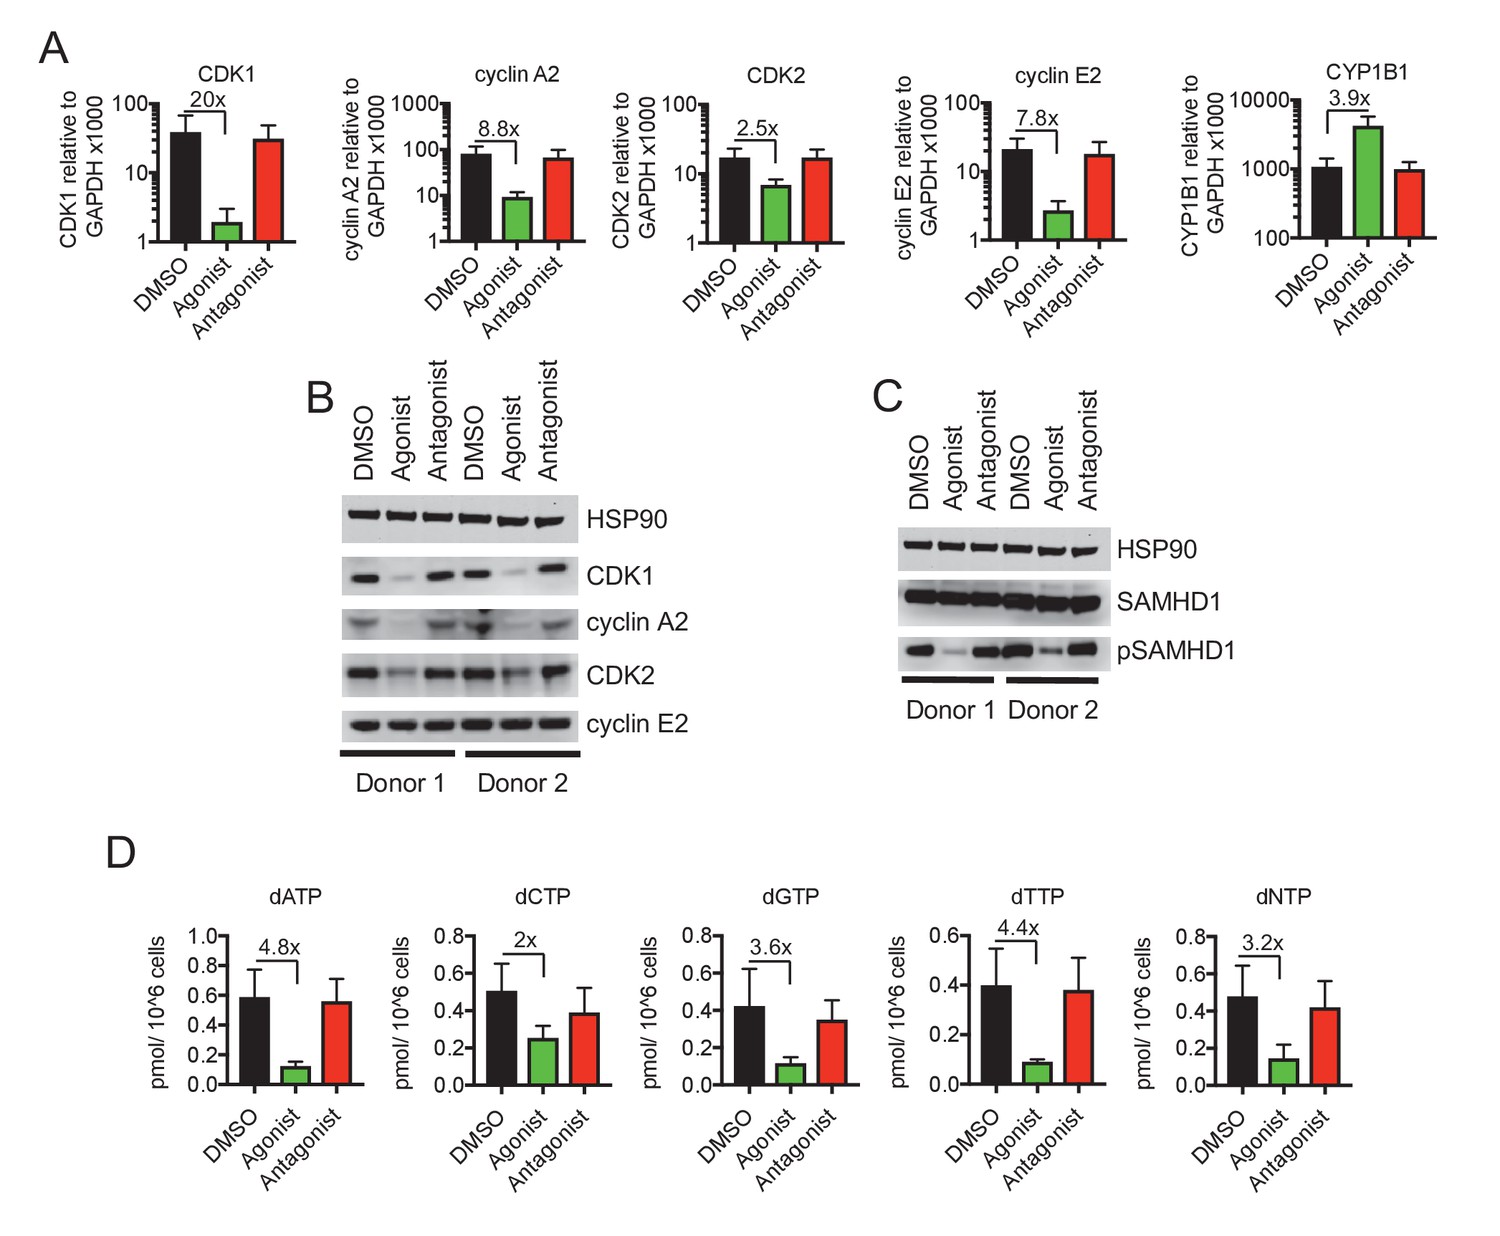
Reduced CDK/cyclin, phospho-SAMHD1 and dTNP levels in macrophages following activation of AhR.
(A) Quantitative PCR analysis of CDK1, cyclin A2, CDK2, cyclin E2 and CYP1B1 mRNA levels in macrophages treated with carrier (DMSO), AhR agonist or AhR antagonist. Values indicate fold-change, error bars represent standard deviation of data from five different donors. (B) Western blot analysis of HSP90 (loading control) CDK1, cyclin A2, CDK2, cyclin E2 protein levels in macrophages treated with carrier (DMSO), AhR agonist or antagonist. (C) Western blot analysis of HSP90 (loading control), total SAMHD1 levels, and phosphorylated SAMHD1 levels in macrophages treated with carrier (DMSO), AhR agonist or antagonist. (D) Analysis of dNTP levels in macrophages treated with AhR agonist or antagonist. Error bars represent standard deviation of data from three different donors, numbers indicate fold change.
Figure 2—figure supplement 1
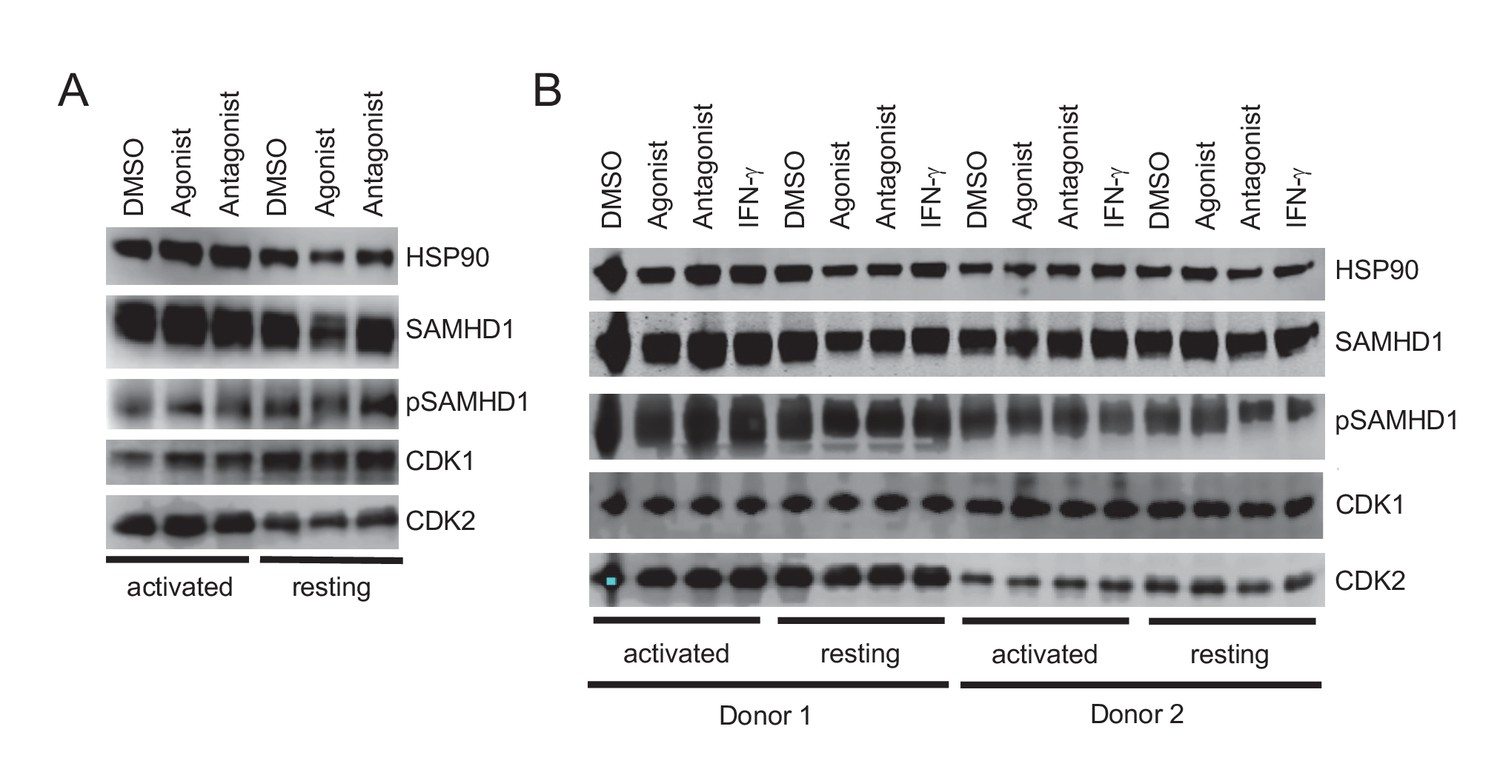
Effects of AhR activation in PBMC and purified CD4+ T cells.
(A) Levels of SAMHD1, phosphorylated SAMHD1, CDK1 and CDK2 proteins in activated or unsimulated, unfractionated PBMCs treated with carrier, AhR agonist or antagonist. (B) Levels of SAMHD1, phosphorylated SAMHD1, CDK1 and CDK2 proteins in activated or unstimulated purified CD4+ T cells treated with carrier, AhR agonist or antagonist.
Figure 3 with 1 supplement
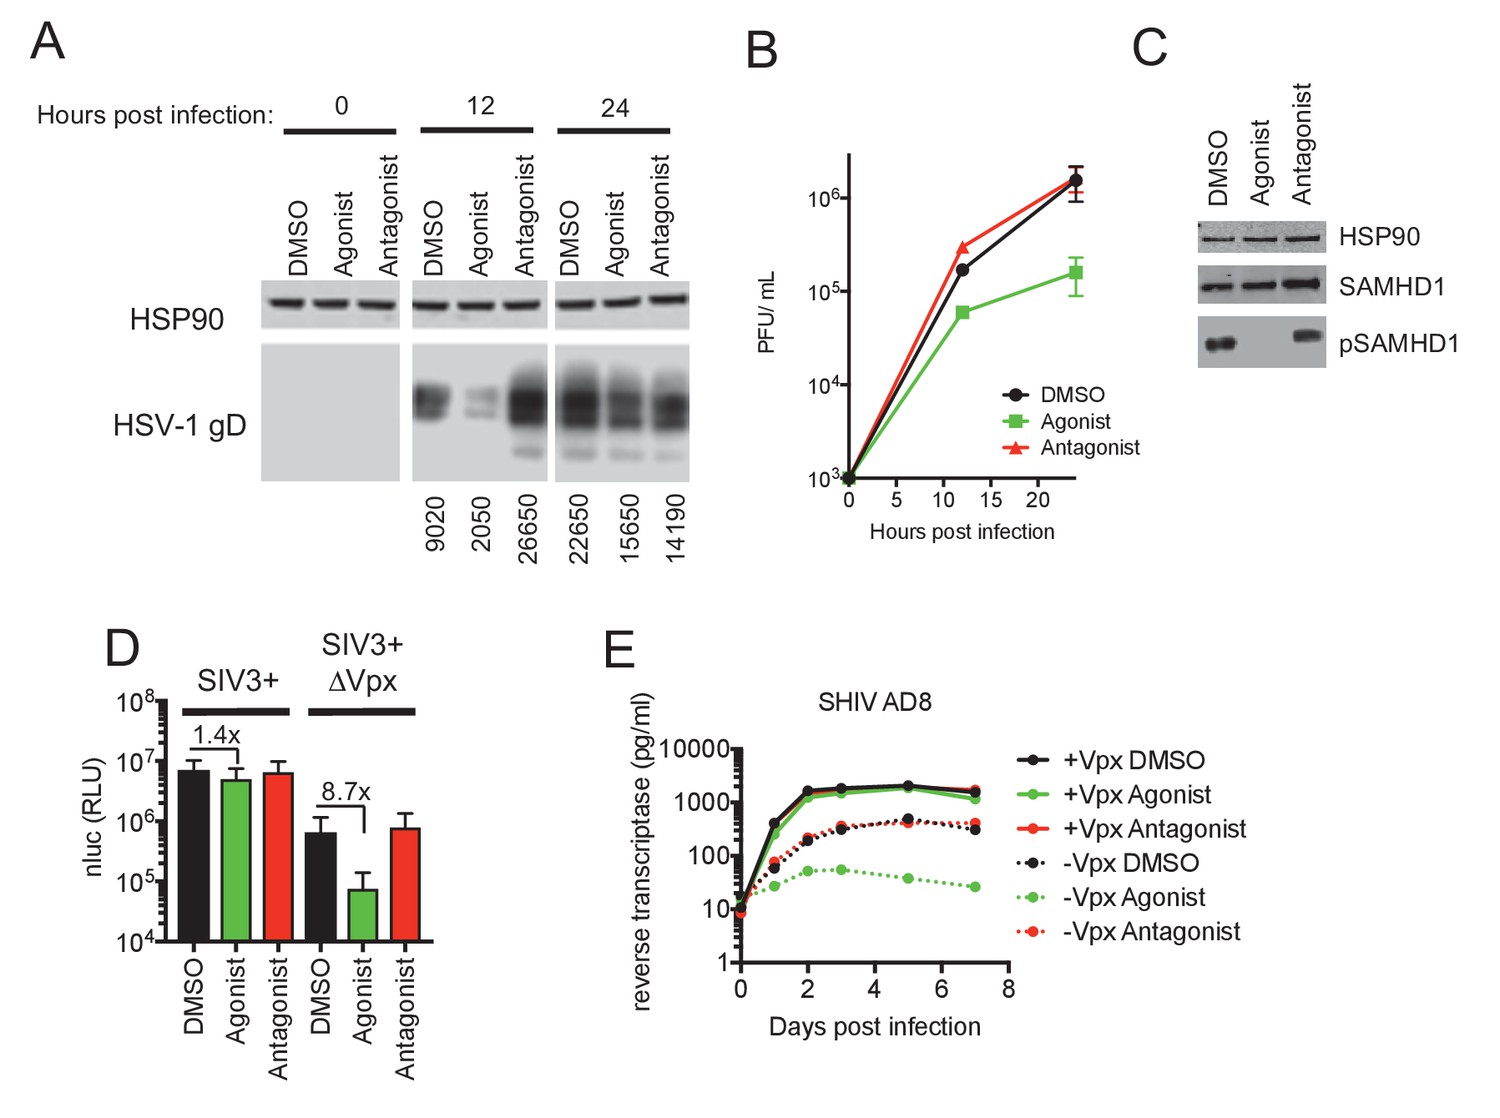
AhR activation inhibits HIV-1, and HSV-1 replication, but SIVmac Vpx confers resistance.
(A) Western blot analysis of HSV-1 glycoprotein D (gD) levels over time in infected macrophages treated with AhR agonist or antagonist. Numbers represent relative band intensities. Representative of 2 different donors. (B) HSV-1 infectious virion yield during replication in macrophages treated as in (A). Error bars represent standard deviation, n = 2. (C) Western blot analysis of SAMHD1 and phospho-SAMHD1 levels in HSV-1 infected macrophages treated with AhR agonist or antagonist. Representative of 2 different donors. (D) Single round virus replication in macrophages treated with SIV3+ or SIV3+ ΔVpx virus like particles and AhR agonist or antagonist before infection with HIV-1NLYU2-nluc. Error bars represent standard deviation of data from six different donors, numbers indicate fold change. (E) Supernatant reverse transcriptase levels in macrophages treated with AhR agonist or antagonist and infected with chimeric SHIV AD8 expressing or not expressing the Vpx protein. Representative of 3 different donors.
Figure 3—figure supplement 1
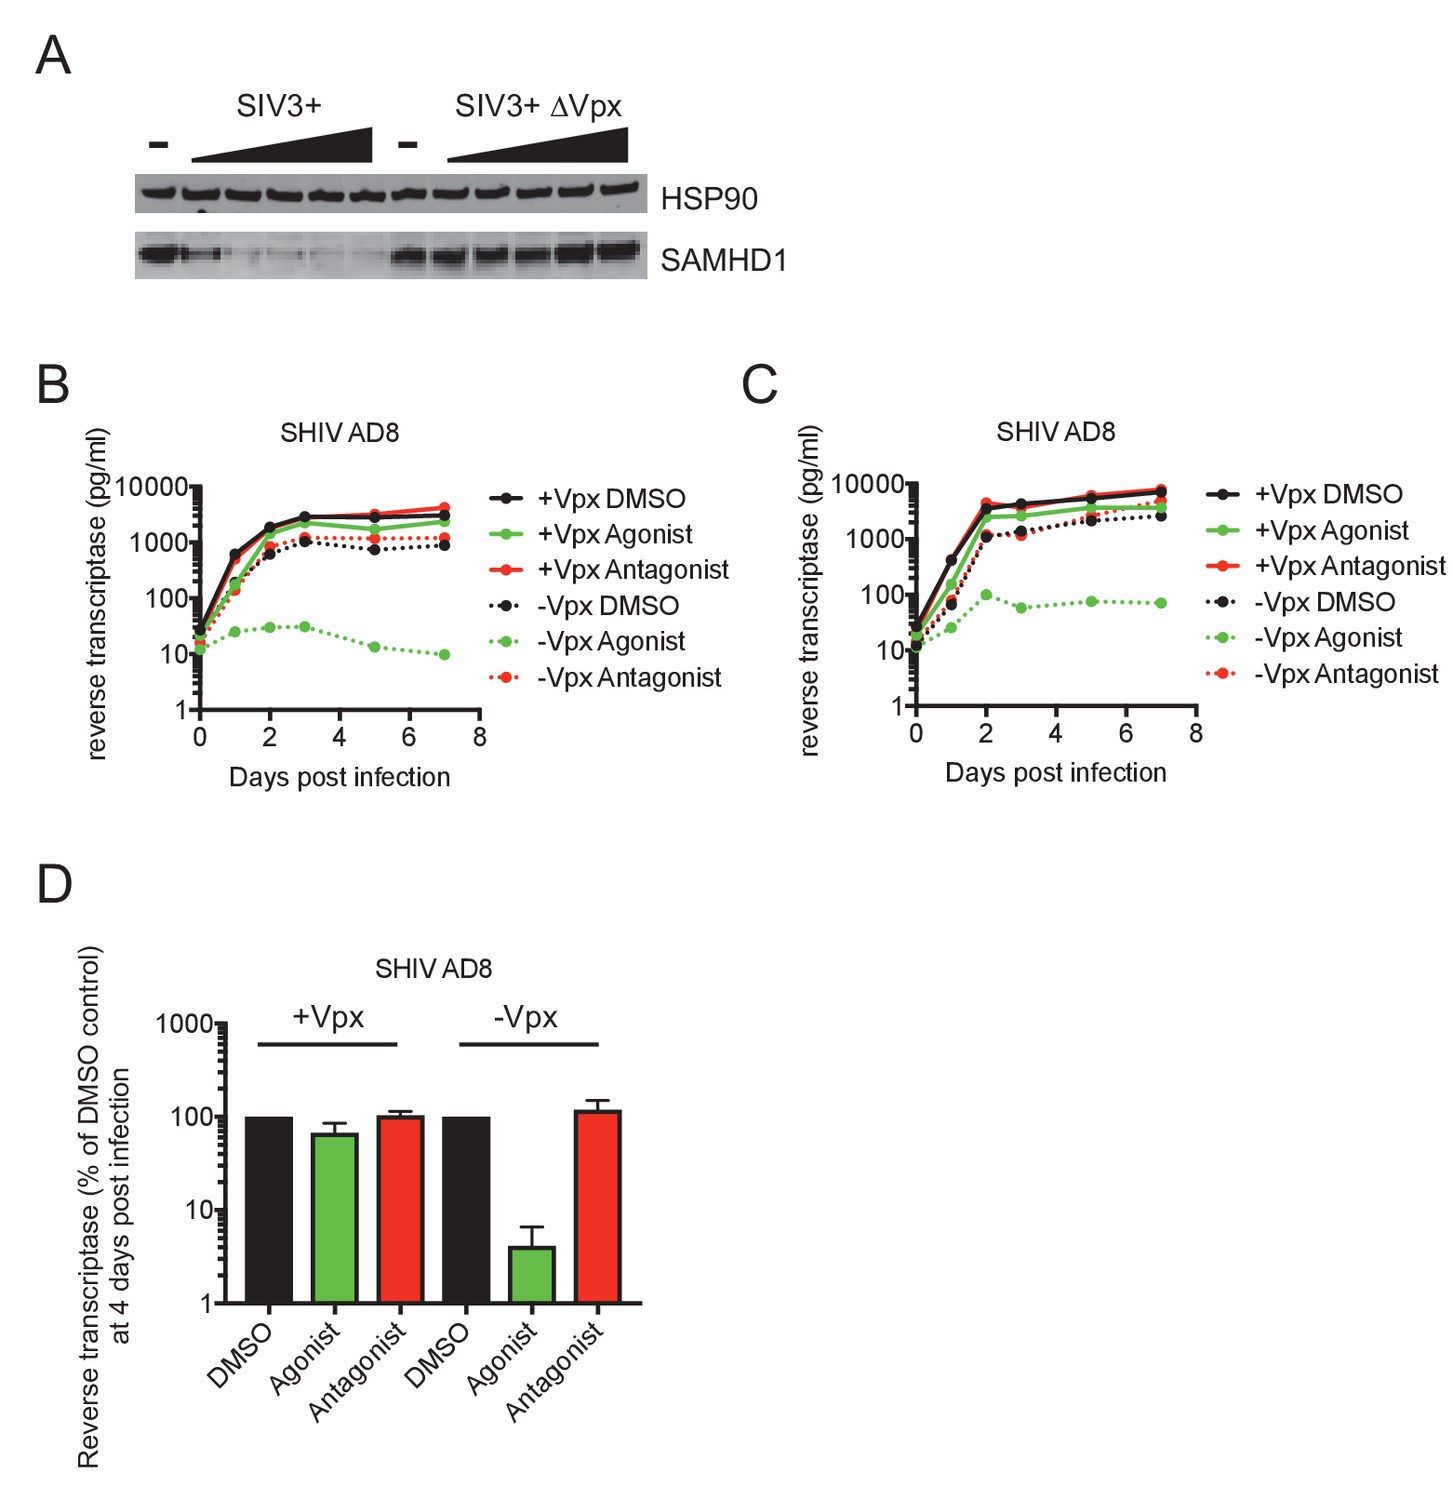
Vpx-induced degradation of SAMHD1 abolishes AhR-mediated inhibition in macrophages.
(A) Western blot analysis of SAMHD1 and phosphorylated SAMHD1 in macrophages treated with increasing concentrations of SIV3+ or SIV3+ ΔVpx virus like particles. (B and C) Virus replication assays in macrophages, from two different donors, treated with AhR agonist or antagonist and infected with chimeric SHIV AD8 virus expressing or not expressing the Vpx protein. (D) Comparison of HIV-1 supernatant reverse transcriptase levels, at four days after infection of macrophages with SHIV AD8 expressing, or not expressing, the Vpx protein. Macrophages were treated with AhR agonist or antagonist. Error bars represent standard deviation of data from four different donors.
Figure 4 with 2 supplements
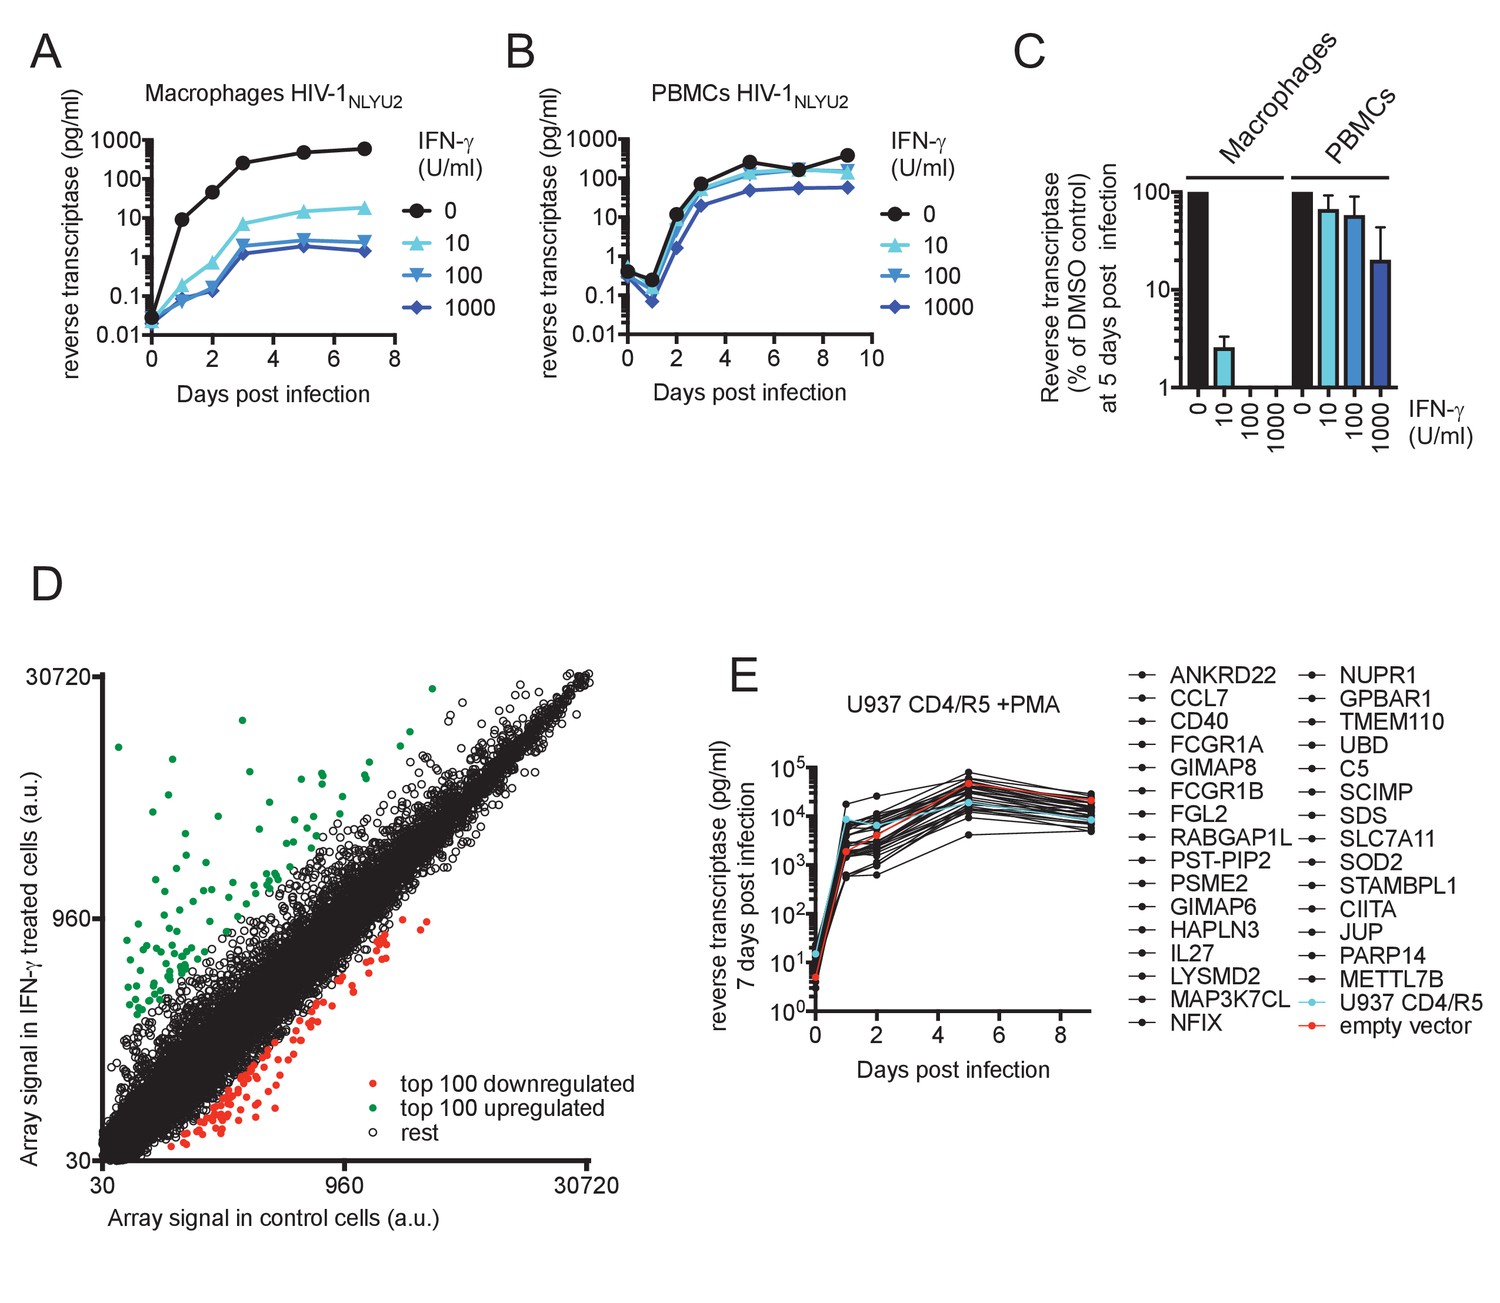
IFN-γ inhibits HIV-1 replication in macrophages.
(A and B) HIV-1NLYU2 replication in macrophages (A) or PBMCs (B) treated with increasing concentrations of IFN-γ. Representative of 3 different donors. (C) Comparison of HIV-1 supernatant reverse transcriptase levels, at five days after infection of macrophages or PBMCs treated with increasing concentrations of IFN-γ from (A and B). Error bars represent standard deviation of data from at least three different donors. (D) Microarray analysis of RNA extracted from macrophages treated with IFN-γ or control. The array signal is plotted in arbitrary units (a.u.). (E) HIV-1NLYU2 replication in a PMA treated monocytic cell line (U937 CD4/R5) transduced with lentiviral vectors (CSIB) expressing the indicated upregulated genes from (D). Representative example of 2 independent experiments.
Figure 4—figure supplement 1
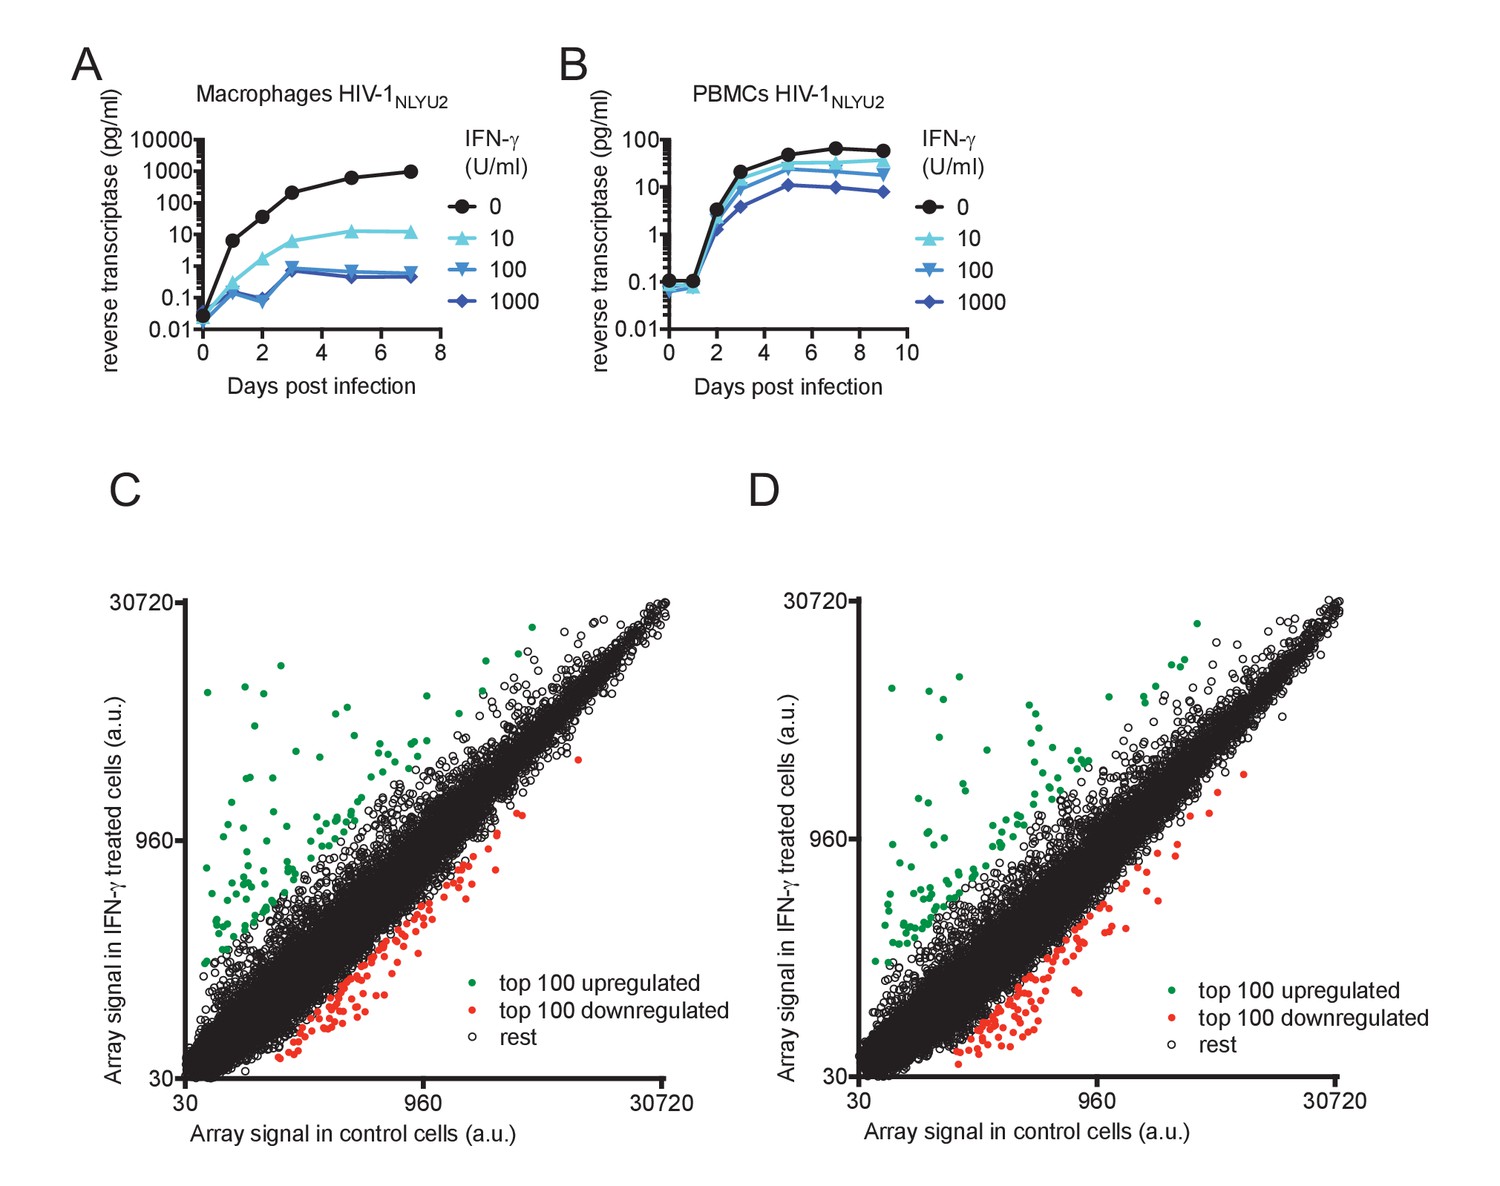
Effect of IFN-γ on HIV-1 replication and microarray analysis of IFN-γ-induced changes in mRNA levels.
(A and B) HIV-1NLYU2 replication in macrophages or PBMCs treated with increasing concentrations of IFN-γ. (C and D) Microarray analysis of RNA extracted from macrophages, from two different donors, untreated or treated with IFN-γ. The array signal is plotted in arbitrary units (a.u.).
Figure 4—figure supplement 2
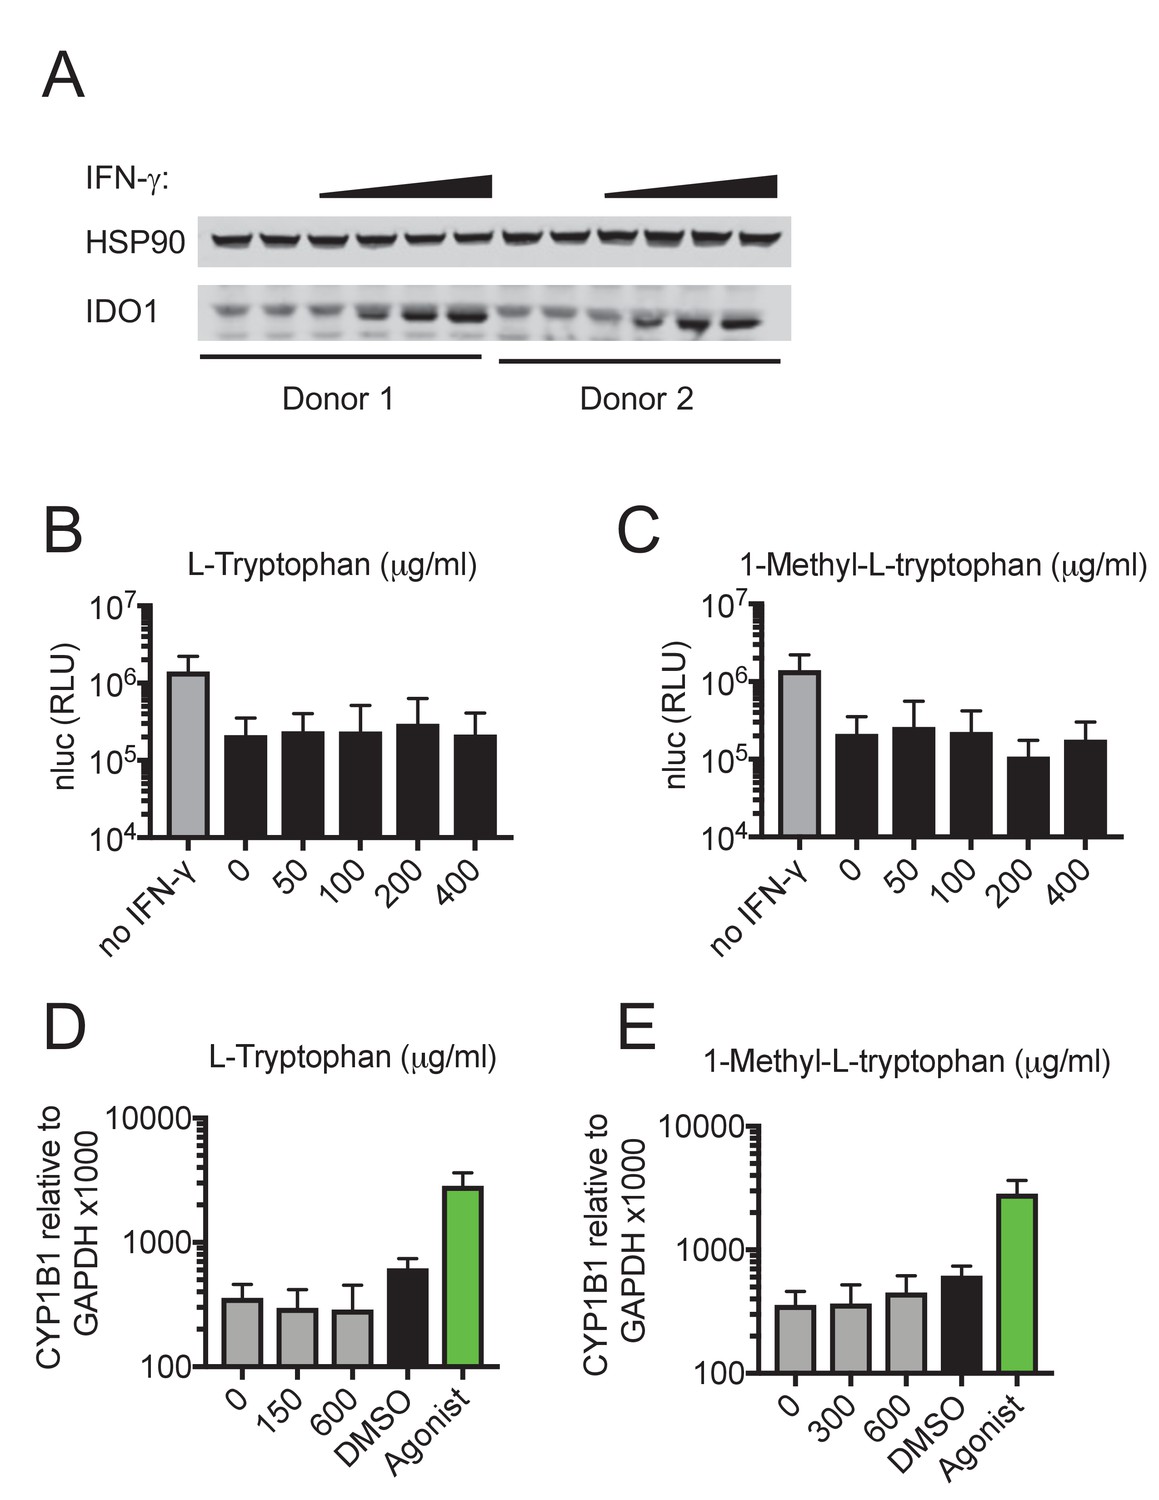
IDO1-mediated Tryptophan catabolism does not mediate the IFN-γ induced replication block.
(A) Western blot analysis of HSP90 (loading control) and IDO1 expression in IFN-γ treated macrophages. (B, C) Single round infection in macrophages treated with increasing concentrations of L-Tryptophan (B), 1-Methyl-L-tryptophan (C) respectively, and treated with 10 U/ml IFN-γ before infection with HIV-1NLYU2-nluc. Error bars represent standard deviation of data from two different donors. (D, E) Quantitative PCR analysis of CYP1B1 in aforementioned macrophages treated with L-Tryptophan (D), 1-Methyl-L-tryptophan (E) and 10 U/ml IFN-γ. Error bars represent standard deviation of data from two different donors.
Figure 5
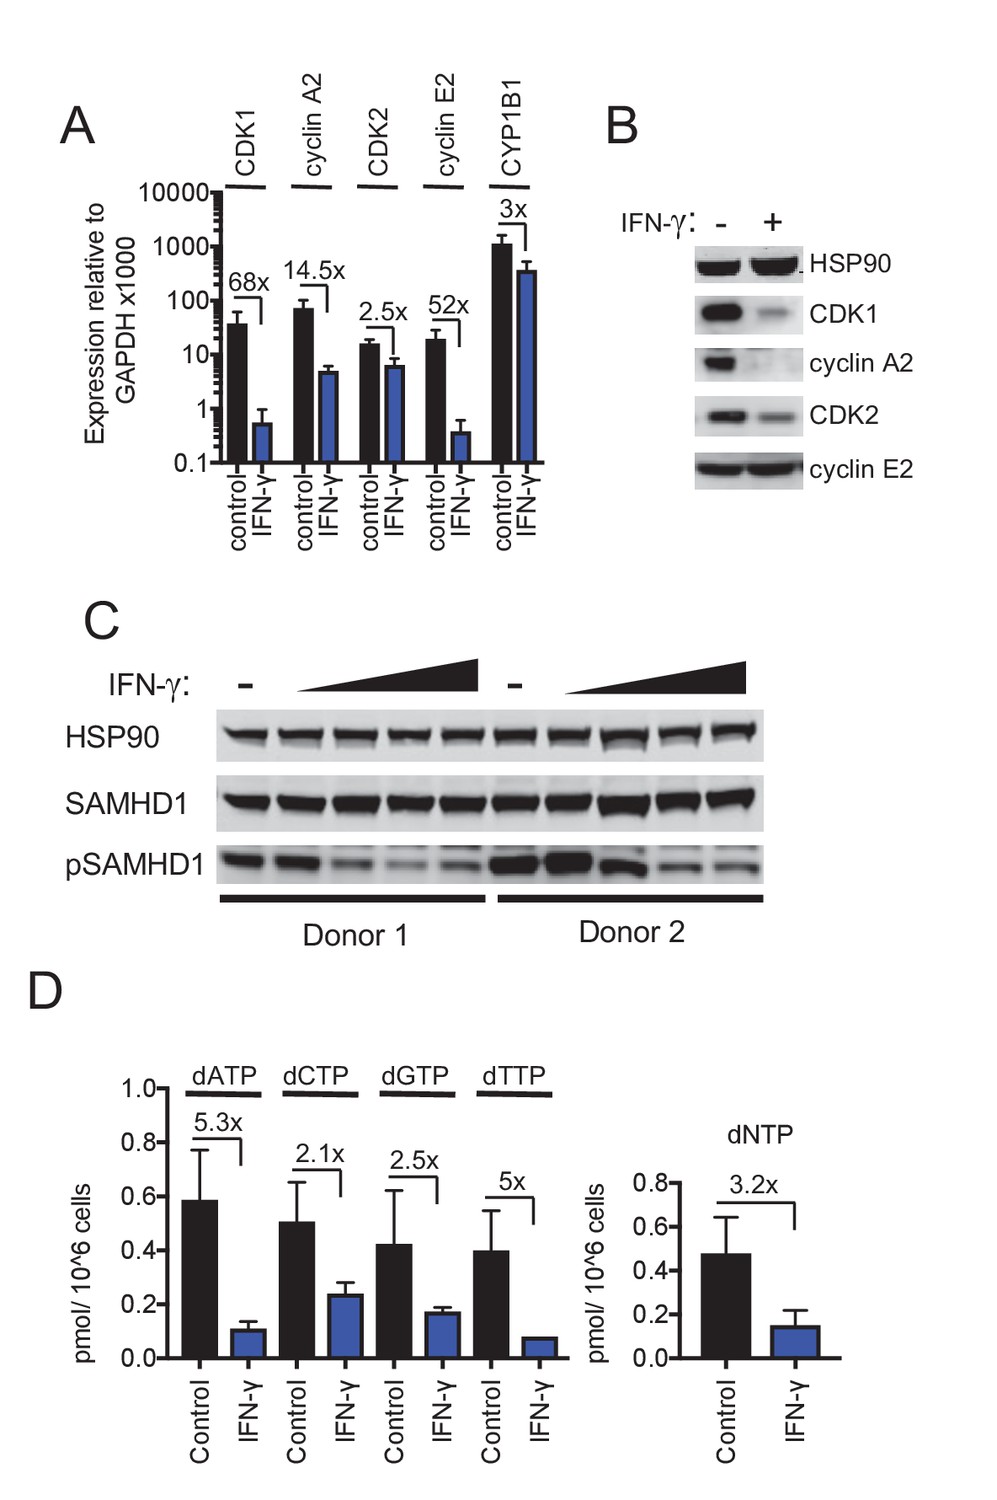
IFN-γ-mediated inhibition of viral replications is mechanistically similar to AhR.
(A) Quantitative PCR analysis of CDK1, cyclin A2, CDK2, cyclin E2 and CYP1B1 mRNA levels in macrophages that were untreated or treated with IFN-γ. Numbers indicate fold-change, error bars represent standard deviation of data from five different donors. (B) Western blot analysis of HSP90 (loading control) CDK1, cyclin A2, CDK2, cyclin E2 protein levels in macrophages treated with carrier (DMSO), AhR agonist or antagonist. (C) Western blot analysis of HSP90 (loading control), total SAMHD1 levels, and phosphorylated SAMHD1 levels in macrophages treated with increasing concentrations of IFN-γ. Representative of 3 different donors. (D) Analysis of dNTP levels in macrophages treated with IFN-γ. Error bars represent standard deviation of data from three different donors. Numbers indicate fold change.
Figure 6

IFN-γ inhibits HIV-1 and HSV-1 replication, but SIVmac Vpx confers resistance.
(A) Western blot analysis of HSV-1 glycoprotein D (gD) over time in infected macrophages that were either untreated or treated with IFN-γ. (B) HSV-1 infectious virion yield during replication in macrophages treated as in (A). Error bars represent standard deviation of two independent experiments. (C) Single round infection in macrophages treated with SIV3+ or SIV3+ ΔVpx virus like particles and IFN-γ before infection with HIV-1NLYU2-nluc. Numbers indicate fold change. Error bars represent standard deviation of data from three different donors. (D) SHIV AD8 and SHIV AD8 ΔVpx reverse transcriptase levels in infected macrophages treated with increasing concentrations of IFN-γ. Error bars represent standard deviation of data from two different donors.
Figure 7
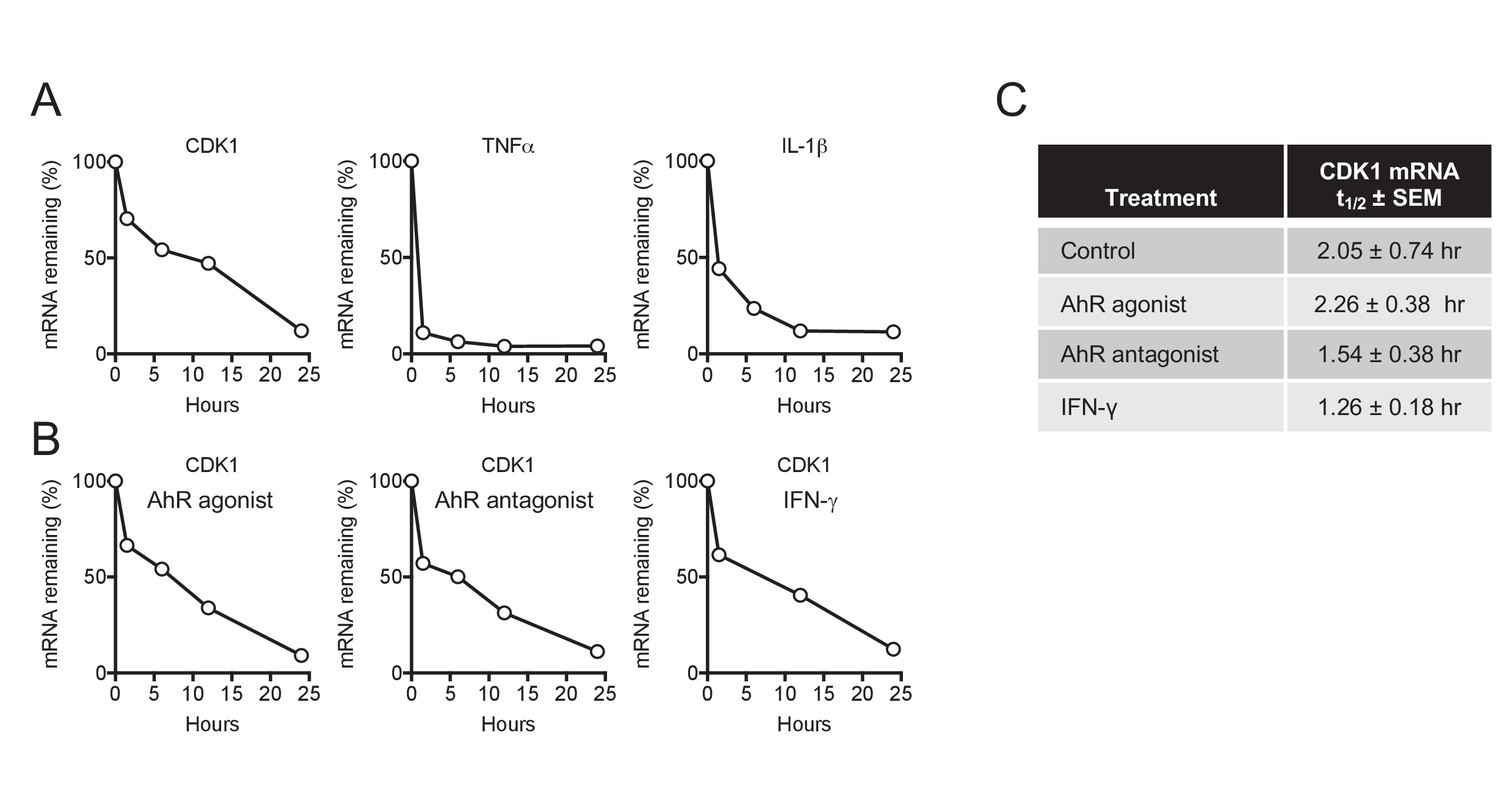
CDK1 mRNA stability is not affected by AhR and IFN-γ.
(A) Decay of CDK1, TNFα and IL-1β following transcriptional blockage with actinomycin D, monitored over time by qPCR and normalized to GAPDH. Representative example from three different donors. (B) Decay rate of CDK1 mRNA following transcriptional blockage with actinomycin D in the presence of AhR agonist, antagonist or IFN-γ. CDK1 mRNA was monitored over time by qPCR and normalized to GAPDH. Representative example from three different donors. (C) Mean CDK1 mRNA half-life (t1/2)±SEM for three different macrophage donors.
Figure 8
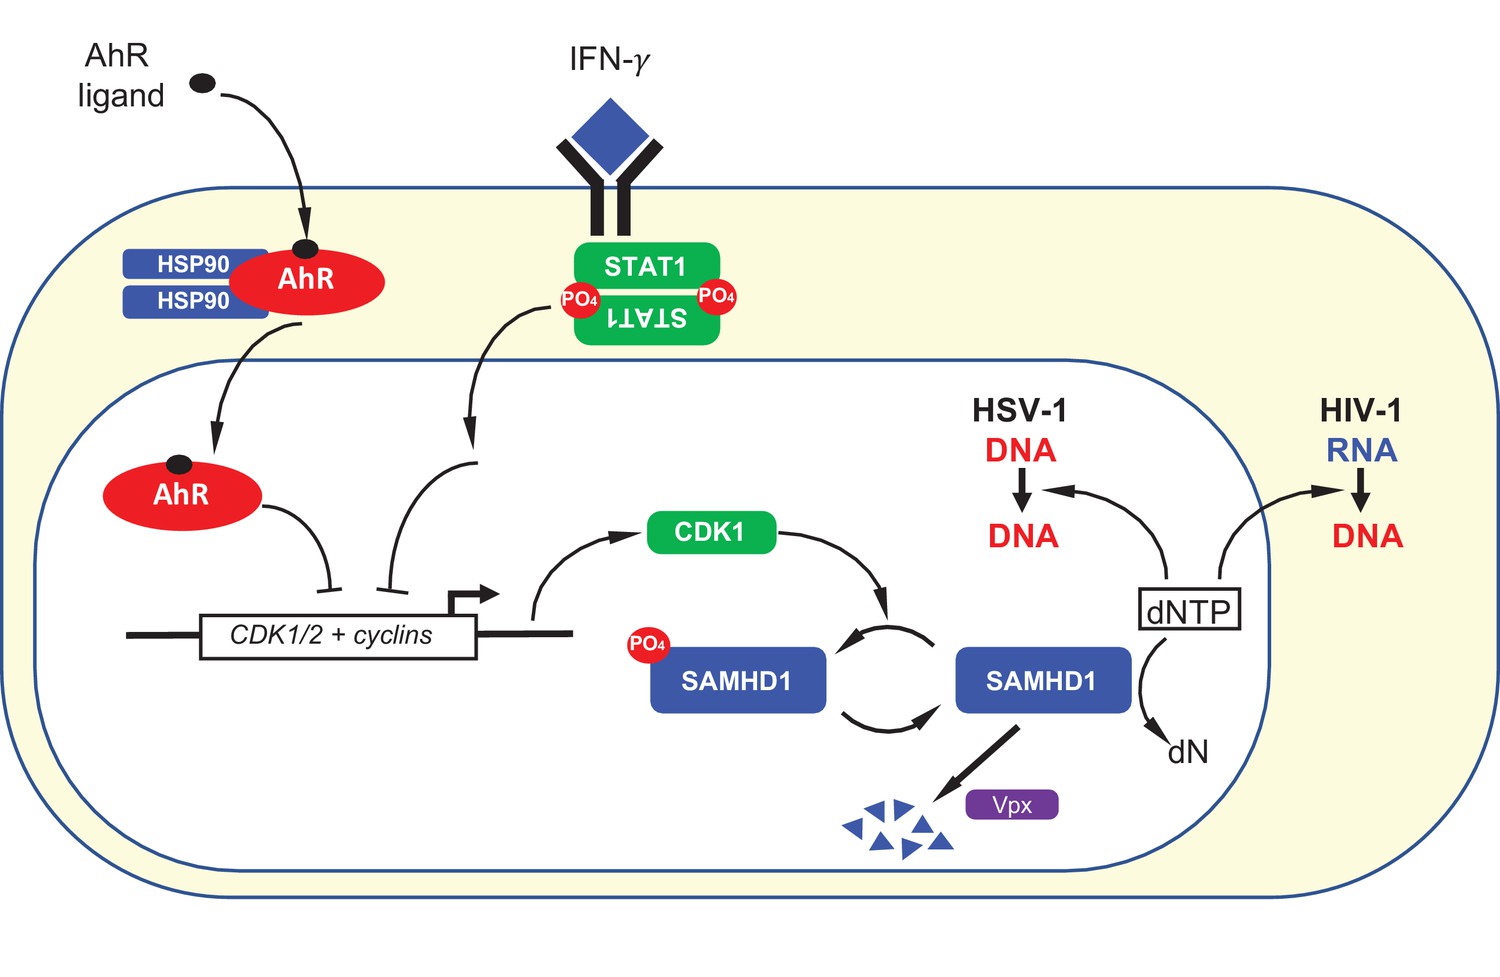
Summary depiction of the convergent mechanisms by which AhR agonists and IFN-γ inhibit on HIV-1 and HSV-1 replication.
AhR agonist and IFN-γ mediated signaling both cause transcriptional repression of CDK1/2 and associated cyclins. This repression results in a reduction in SAMHD1 phosphorylation and, therefore, increased SAMHD1 catalytic activity. Catalytically active SAMHD1 reduces dNTP levels, thereby reducing HIV-1 and HSV-1 DNA synthesis. The SIV Vpx protein causes SAMHD1 degradation, ameliorating the antiviral effects of AhR ligands and IFN-γ.
Additional files
-
Supplementary file 1
Top 100 upregulated genes in AhR activated macrophages.
The fold change in mRNA levels, relative to carrier treated cells, for the top 100 AhR-activation-induced genes is given.
- https://doi.org/10.7554/eLife.38867.016
-
Supplementary file 2
Top 100 downregulated genes in AhR activated macrophages.
The fold change in mRNA levels, relative to carrier treated cells, for the top 100 AhR-activation-repressed genes is given.
- https://doi.org/10.7554/eLife.38867.017
-
Supplementary file 3
Pathway analysis of top 100 downregulated genes in (i) AhR activated macrophages and (ii) IFN-γ stimulated macrophages
- https://doi.org/10.7554/eLife.38867.018
-
Supplementary file 4
Top 100 upregulated genes in IFN-γ treated macrophages.
The fold change in mRNA levels, relative to carrier treated cells, for the top 100 IFN-γ-induced genes is given.
- https://doi.org/10.7554/eLife.38867.019
-
Supplementary file 5
Top 100 downregulated genes in IFN-γ treated macrophages.
The fold change in mRNA levels, relative to carrier treated cells, for the top 100 IFN-γ-repressed genes is given.
- https://doi.org/10.7554/eLife.38867.020
-
Transparent reporting form
- https://doi.org/10.7554/eLife.38867.021
Download links
A two-part list of links to download the article, or parts of the article, in various formats.
Downloads (link to download the article as PDF)
Open citations (links to open the citations from this article in various online reference manager services)
Cite this article (links to download the citations from this article in formats compatible with various reference manager tools)
The aryl hydrocarbon receptor and interferon gamma generate antiviral states via transcriptional repression
eLife 7:e38867.
https://doi.org/10.7554/eLife.38867


