A plant chitinase controls cortical infection thread progression and nitrogen-fixing symbiosis
- Aarhus University, Denmark
- University of Copenhagen, Denmark
- The James Hutton Institute, United Kingdom
- Kazusa DNA Research Institute, Japan
- National Agriculture and Food Research Organization, Japan
Figures
Figure 1 with 4 supplements
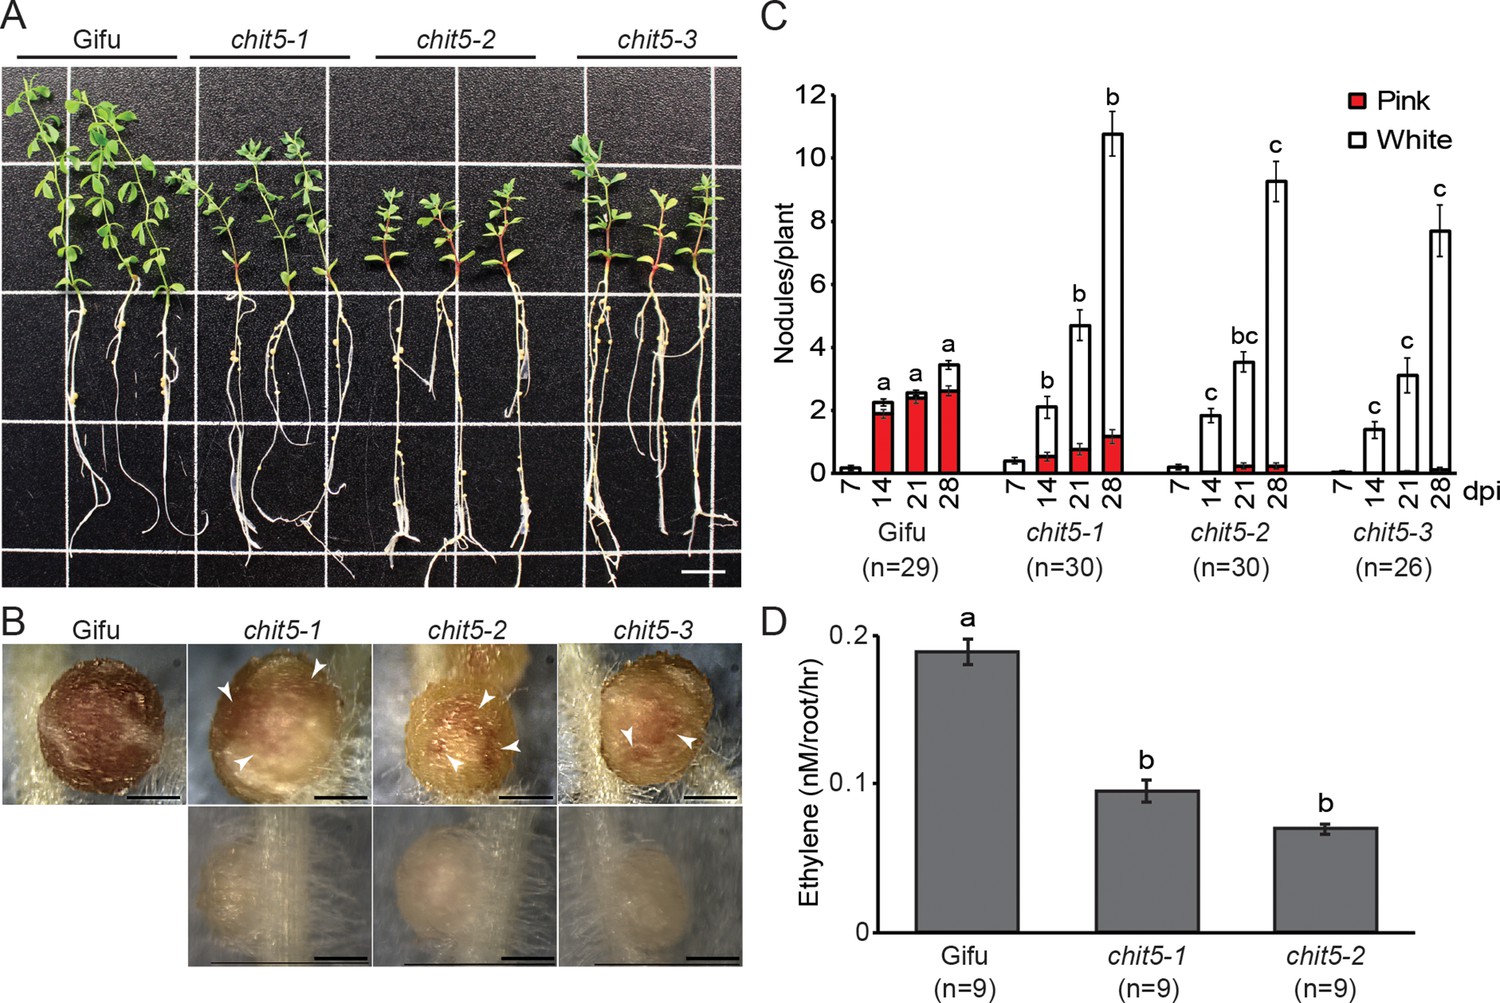
chit5 mutants are defective in nitrogen-fixing symbiosis.
(A) Three representative plants of wild-type Gifu and chit5 mutant alleles 6 weeks post-inoculation with M. loti R7A. Scale bar is 1 cm. (B) Gifu plants form pink nodules whilst chit5 mutants form mainly small white nodules, and occasionally pink-spotted (white arrows) nodules. Scale bars are 0.5 cm. (C) Average number of pink and white nodules formed by M. loti R7A over 4 weeks. (D) Nitrogenase activity measured as the amount of ethylene produced from acetylene in nodules of Gifu and chit5 mutants inoculated with M. loti R7A. (C) and (D) Error bars represent SEM and statistical comparisons of the number of pink nodules formed between genotypes at each time point are shown using ANOVA and Tukey post hoc testing with p values < 0.01 as indicated by different letters.
-
Figure 1—source data 1
Bacterial strains used in this study.
- https://doi.org/10.7554/eLife.38874.007
-
Figure 1—source data 2
Primers used for RT-qPCR analyses.
- https://doi.org/10.7554/eLife.38874.008
Figure 1—figure supplement 1
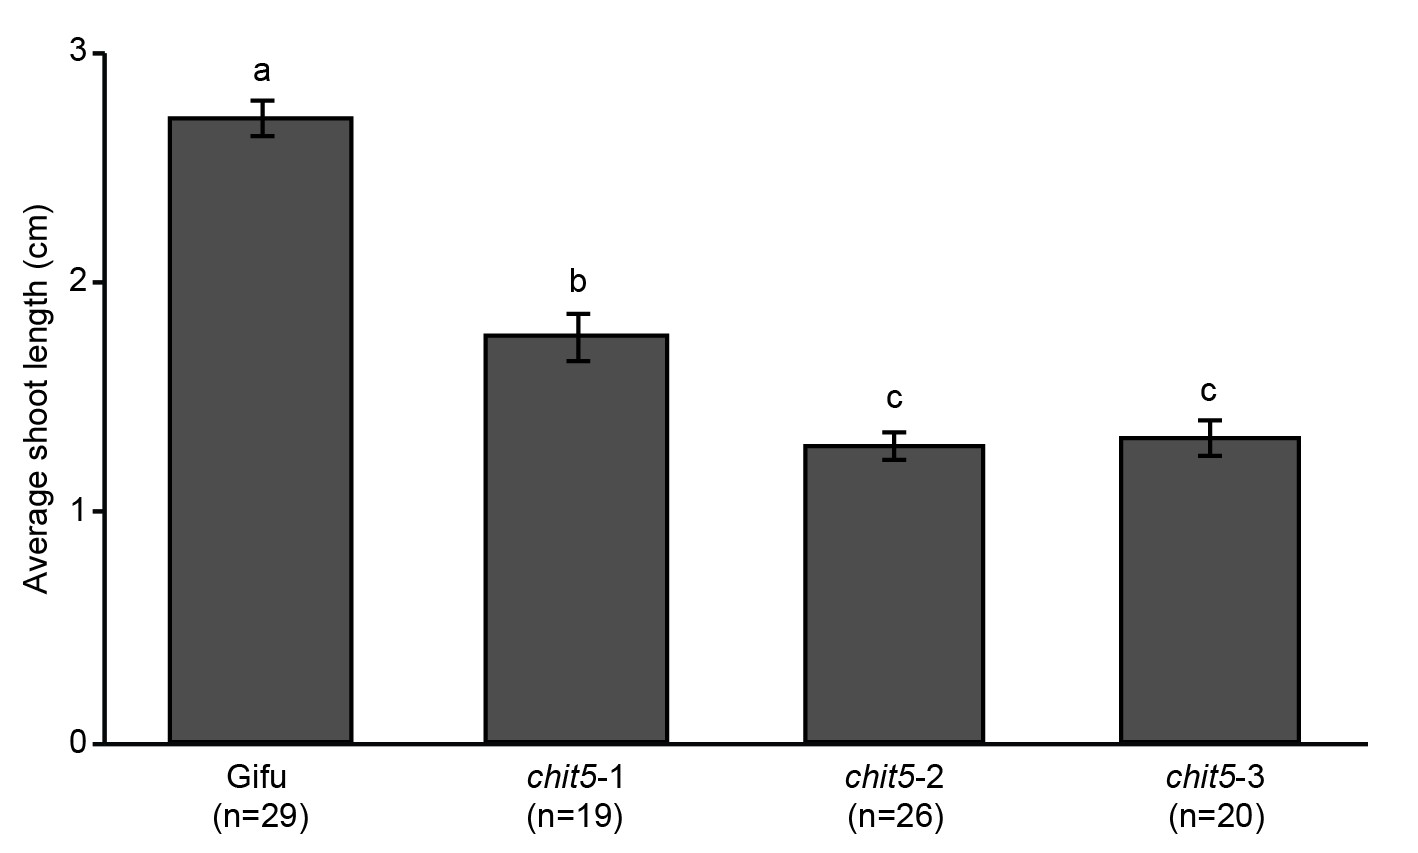
Shoot length of Gifu and chit5 mutants following inoculation with M.loti R7A.
Average shoot lengths of the indicated genotypes were measured 4 weeks post-inoculation with M. loti R7A. Error bars represent SEM and statistical comparisons of shoot lengths between genotypes are shown using ANOVA and Tukey post hoc testing with p values < 0.01 as indicated by different letters.
Figure 1—figure supplement 2
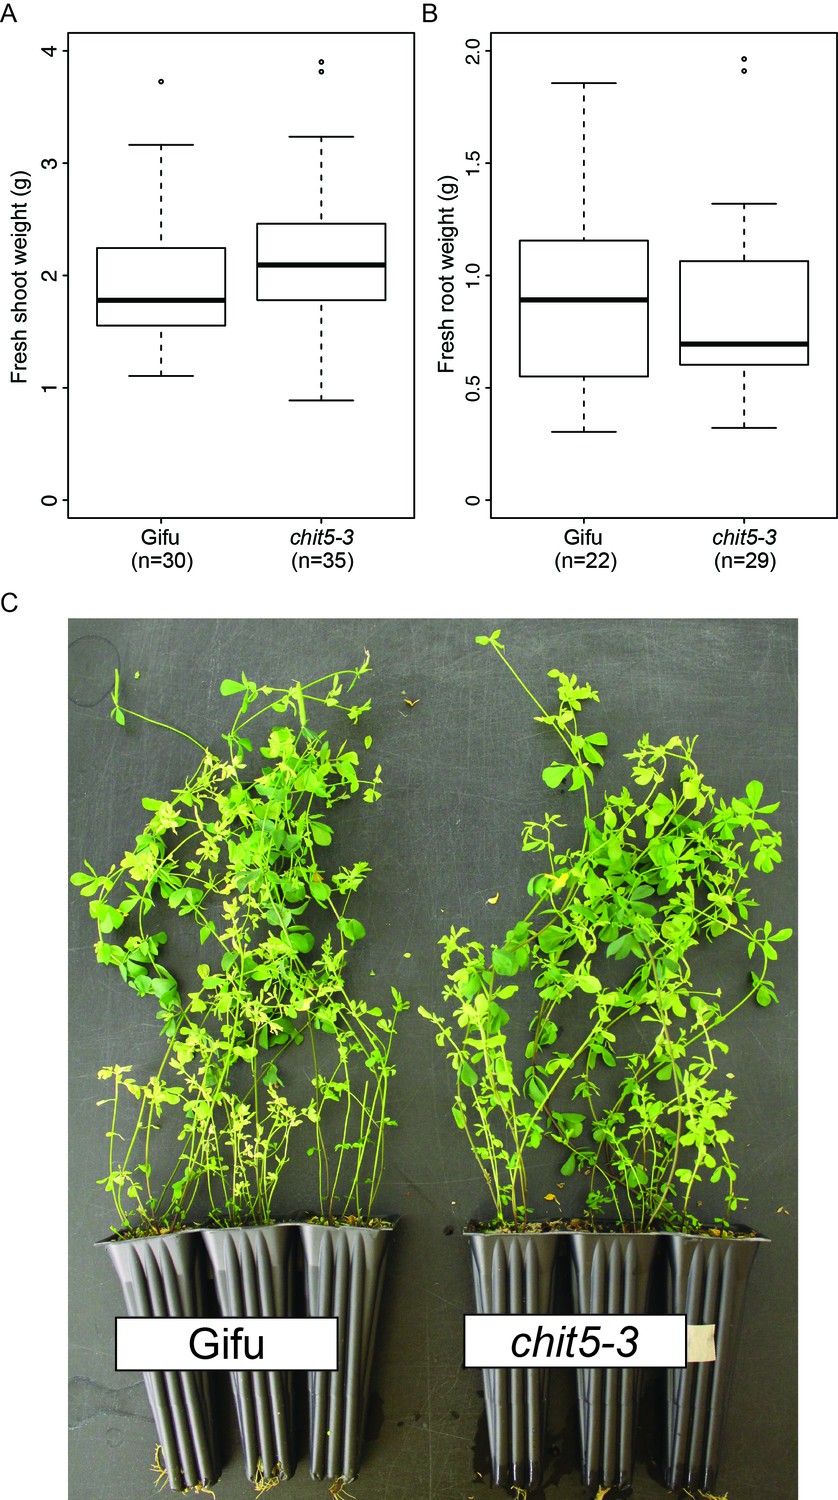
Wild-type and chit5-3 mutant show similar phenotype when grown in nitrogen-supplemented soil.
Shoot weight (A) and root weight (B) of plants after 7 weeks growth in soil +10 mM KNO3. (C) Plant growth of representative plants as indicated. For (A) and (B) error bars represent SEM and statistical comparisons between the genotypes are shown using ANOVA and Tukey post hoc testing with p values < 0.01. No significant difference was detected between wild-type and chit5-3 plants.
Figure 1—figure supplement 3
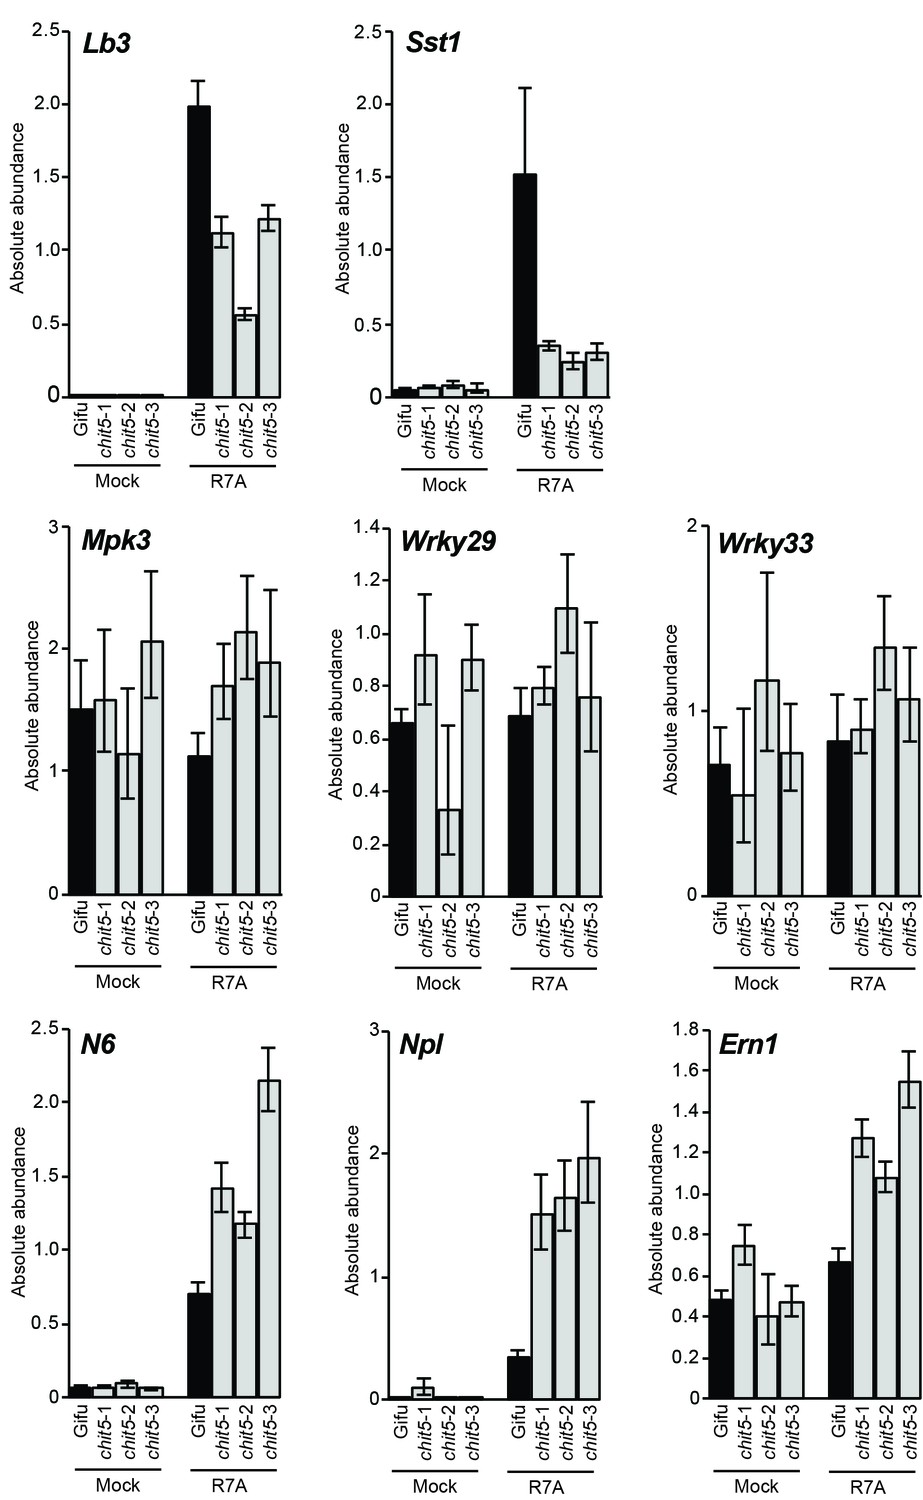
RT-qPCR analysis of symbiotic and defense gene expression in whole roots.
Expression of the indicated symbiotic and defense genes was analysed in Gifu and chit5 mutant whole roots 21 dpi with M. loti R7A or mock-inoculation. Results are from biological and technical triplicates. Error bars represent SEM.
Figure 1—figure supplement 4
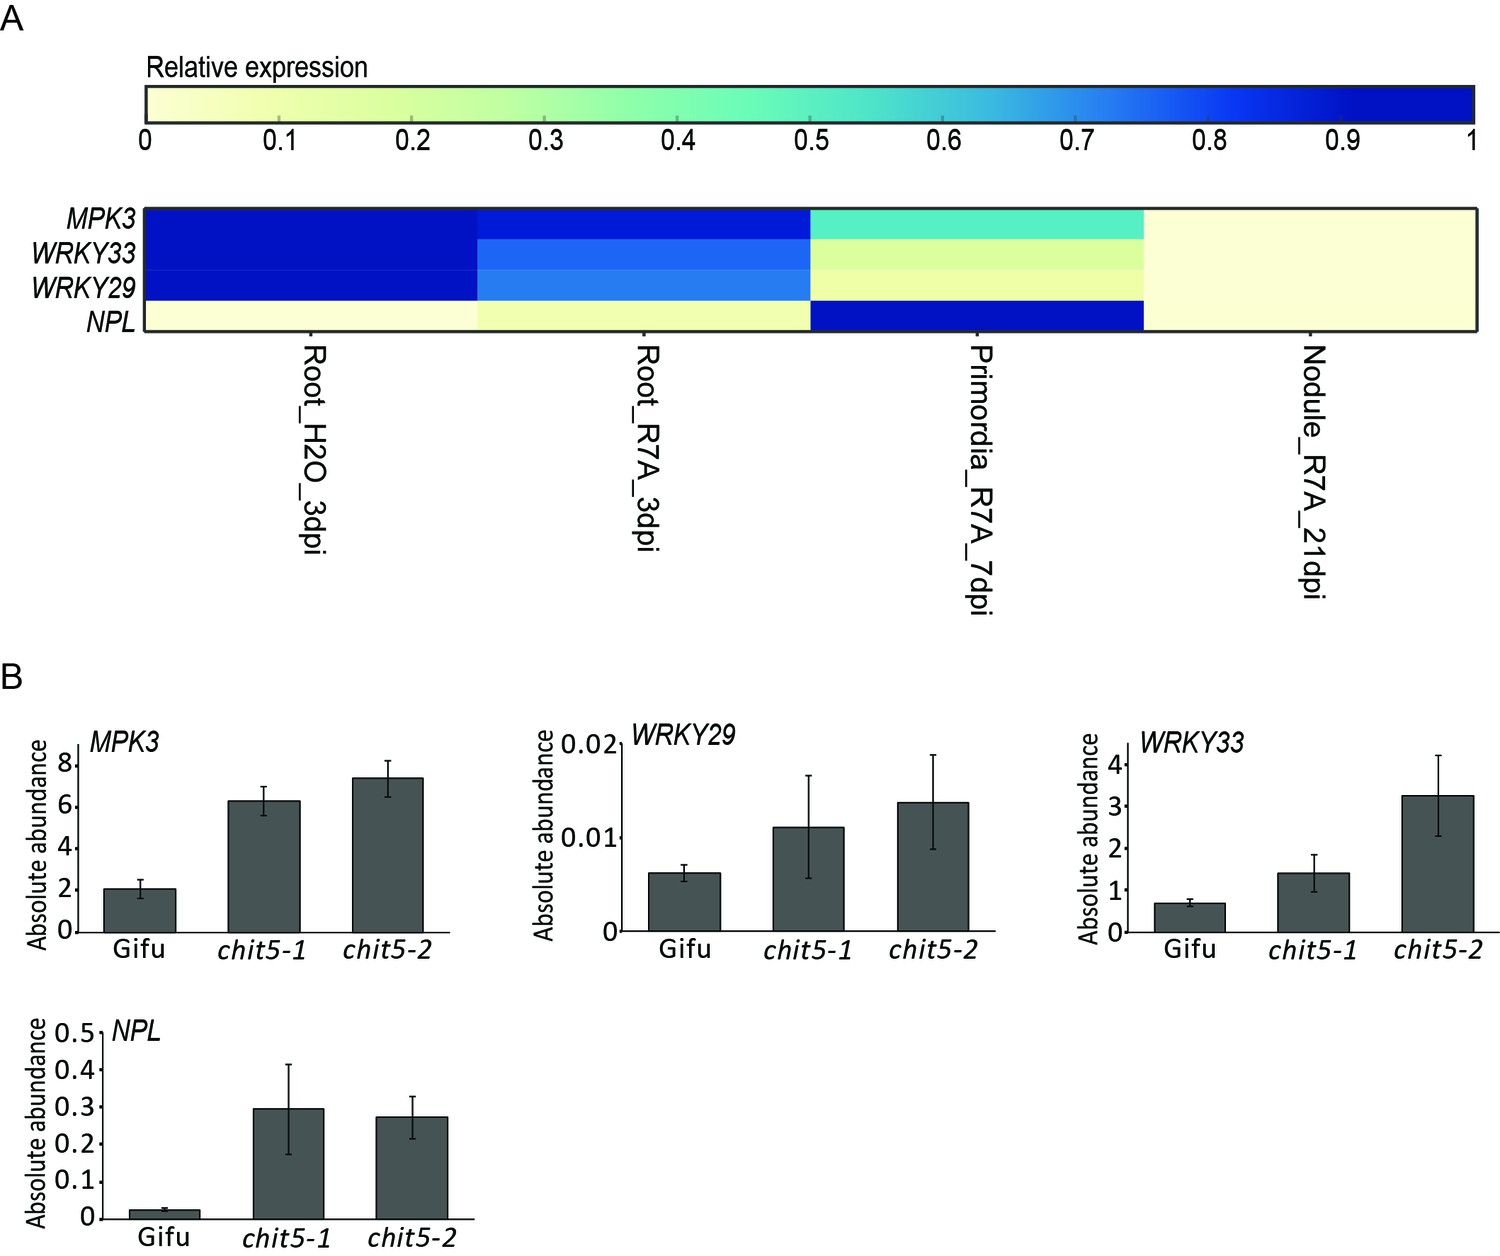
Expression of symbiotic and defense gene during symbiosis (A) and in wild-type and chit5 nodules (B).
(A) Expression heatmap of the analysed genes as found in Kelly et al., 2018a. (B) Expression of the indicated symbiotic and defense genes was analysed by RT-qPCR in Gifu and chit5 mutant nodules at 21 dpi with M. loti R7A. Results are from biological and technical triplicates. Error bars represent SEM.
Figure 2 with 1 supplement
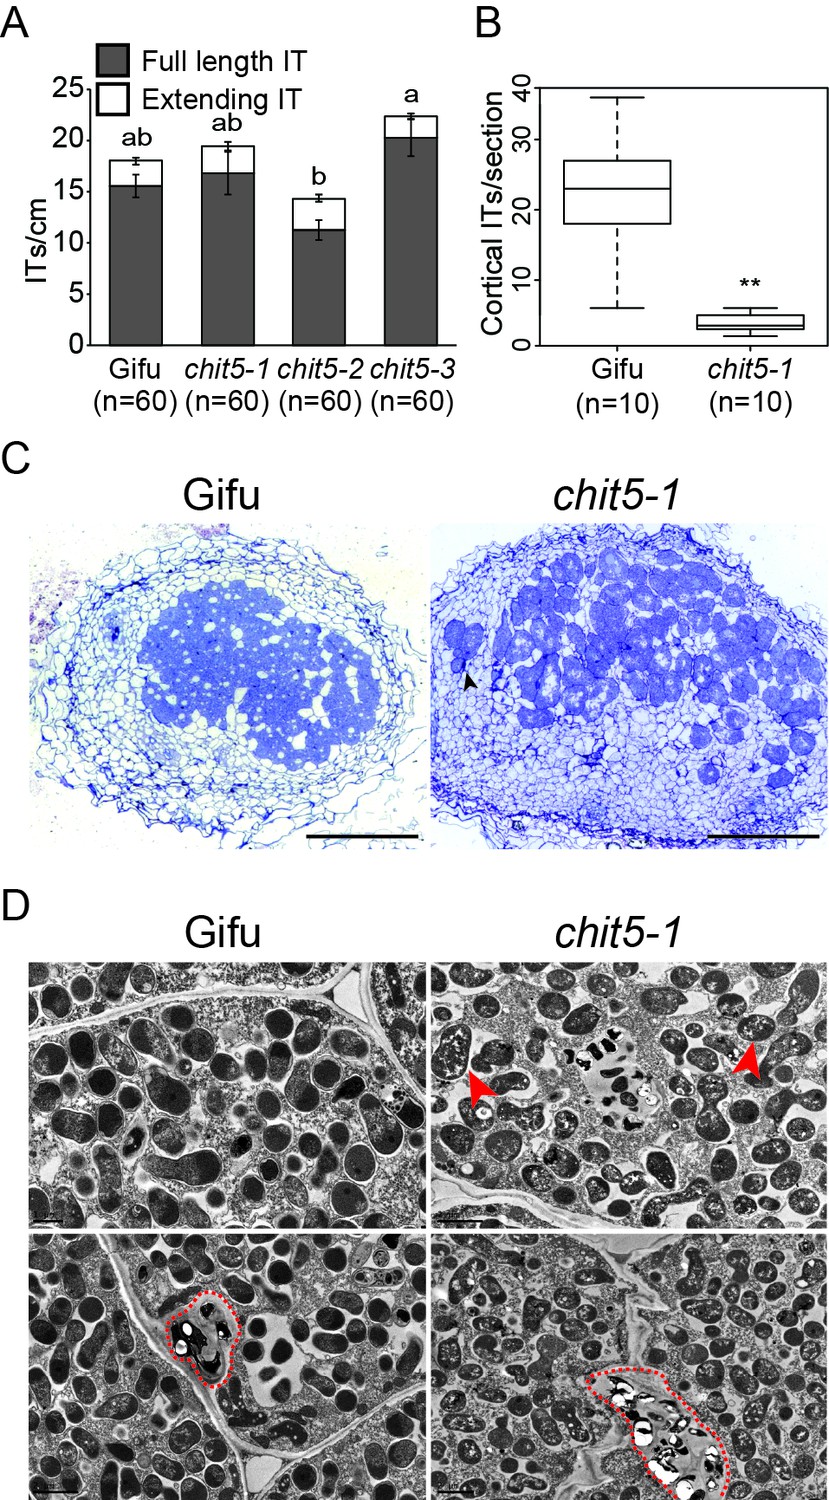
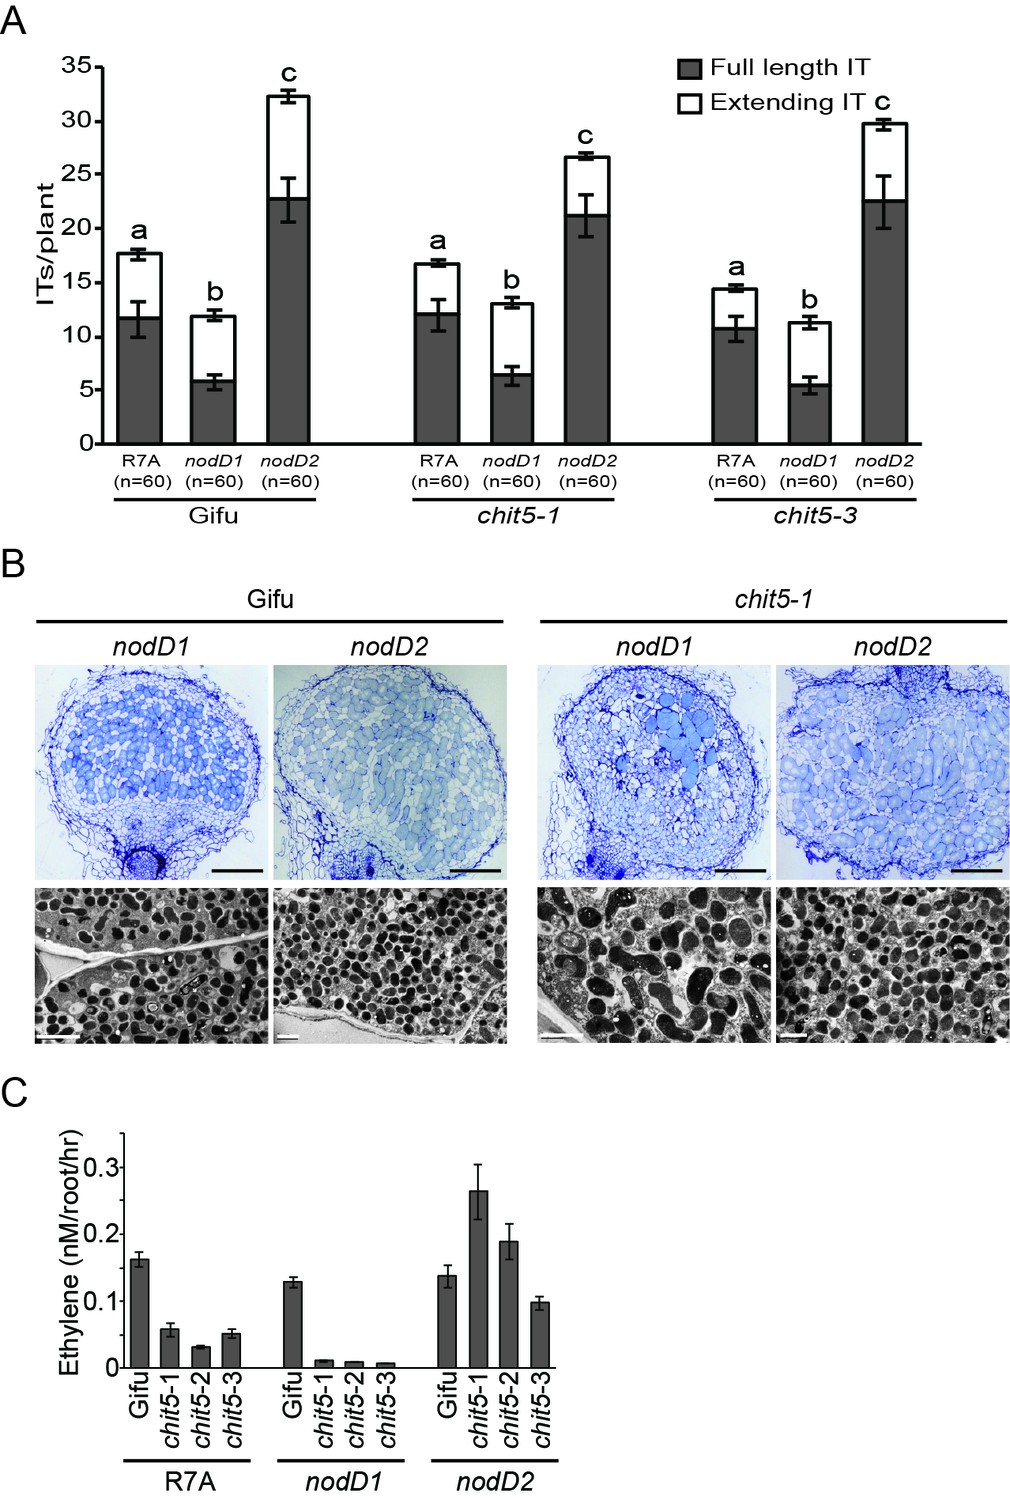
chit5 mutants have a defective nodule infection phenotype.
(A) Infection threads induced by M. loti + DsRed in Gifu and chit5 mutant root hair at 10 dpi . Error bars represent SEM and statistical comparisons of the number of full length infection threads formed between genotypes at each time point are shown using ANOVA and Tukey post hoc testing with p values < 0.01 as indicated by different letters. (B) Box plot of cortical infection thread counts performed on Gifu and chit5-1 nodule sections. t test p values are indicated by asterisks (**<0.01). (C) Light microscopy of nodule sections from the indicated plant genotypes 4 wpi stained with toluidine blue. Black arrows indicate bacteria between nodule cells. Scale bars are 200 µm (D) Transmission electron microscopy of nodule sections from the indicated plant genotypes 4 wpi. Red arrows point out bacteroids of stressed appearance with accumulated white spots, red dashed lines outline infection threads or invagination from the intercellular space. Note the difference between PHB bodies (large, white spots) characteristic for Mesorhizobium when present inside infection threads (red dashed outlines), and the small white spots present in the symbiosomes formed in the chit5 mutant nodules (red arrows). Scale bars are 2 µm. Corresponding images of chit5-2 and chit5-3 are in Figure 2—figure supplement 1.
Figure 2—figure supplement 1
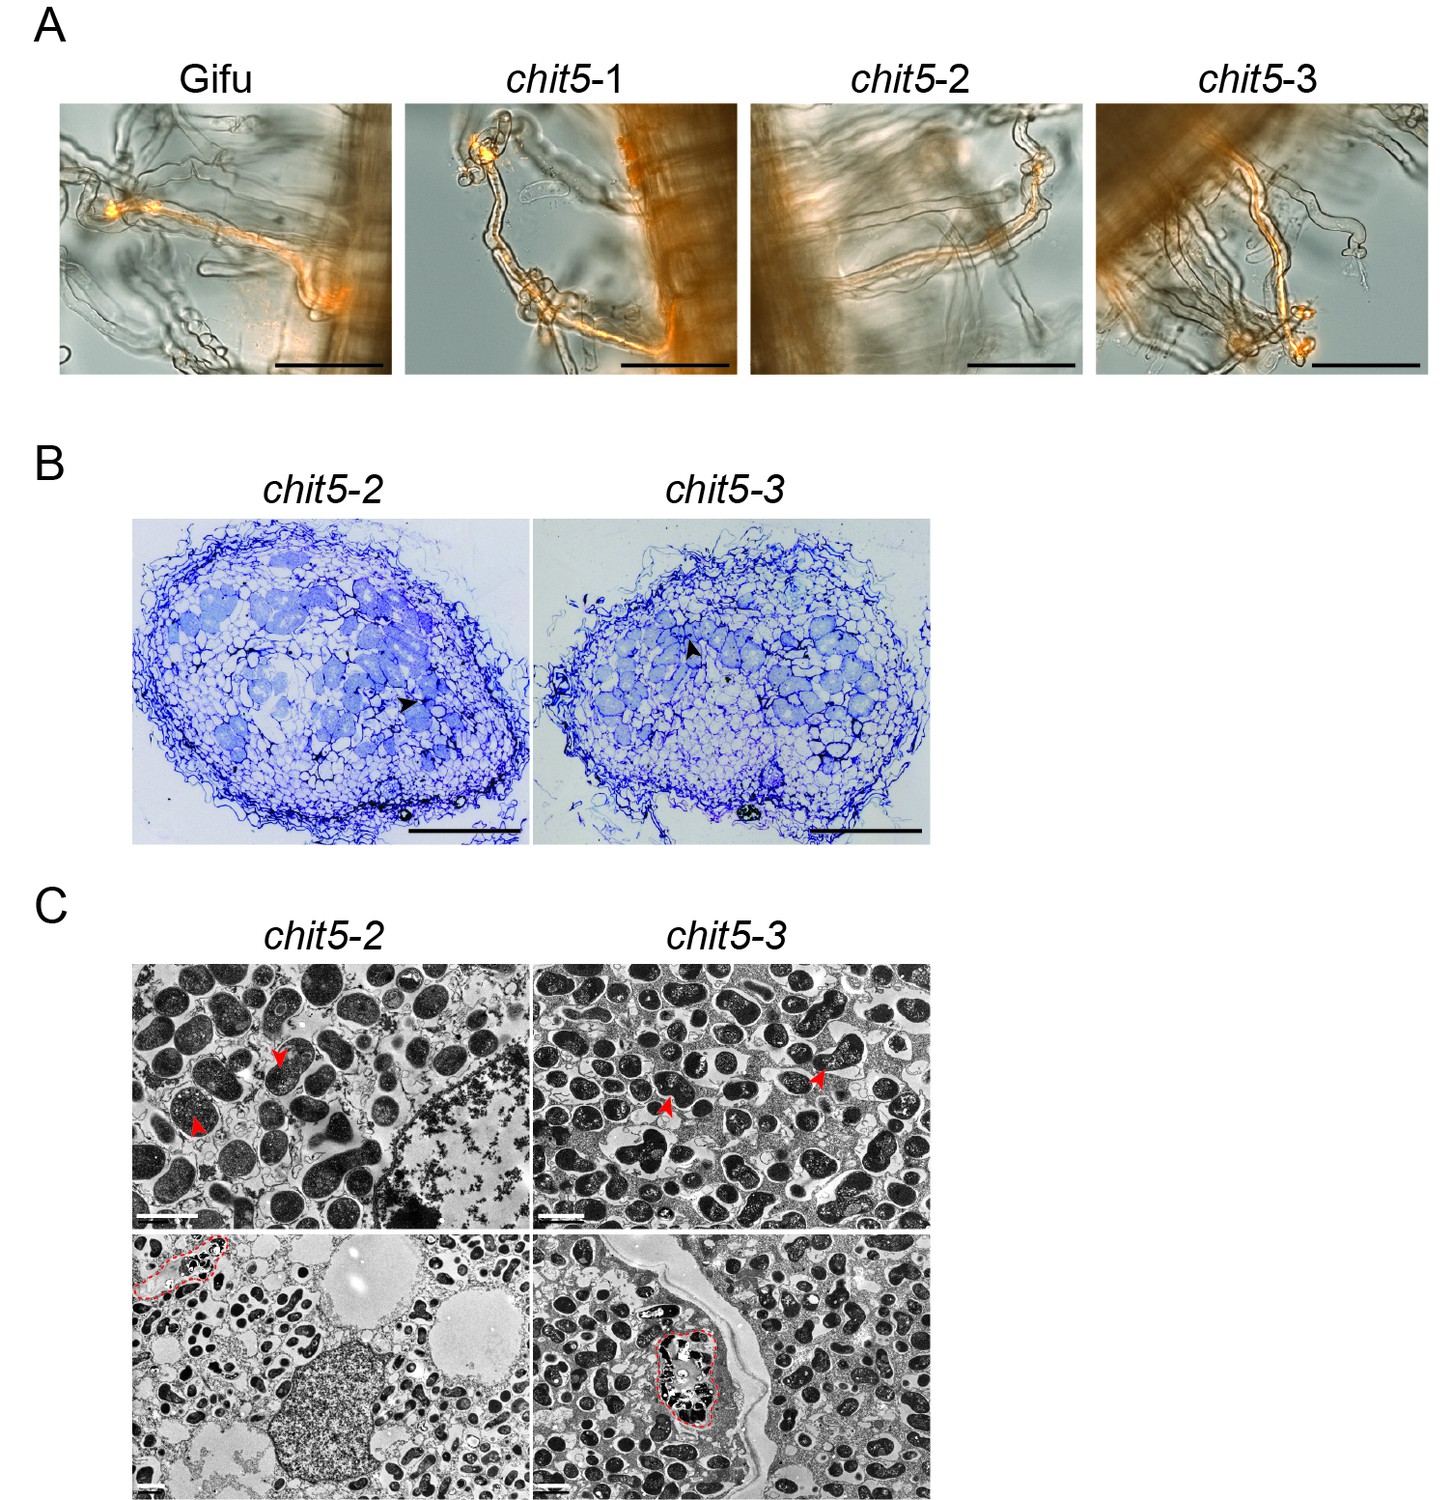
Infection phenotype of wild-type and chit5 mutants.
Representative images of full length root hair infection threads formed by M. loti R7A + DsRed 10 dpi on the indicated genotypes. Scale bars are 100 μm. (B) Light microscopy of nodule sections from the indicated plant genotypes 4 wpi stained with toluidine blue. Black arrows indicate bacteria between nodule cells. Scale bars are 200 µm (C) Transmission electron microscopy of nodule sections from the indicated plant genotypes 4 wpi. Red arrows point out bacteroids of stressed appearance with accumulated white spots, red dashed lines outline infection threads or invagination from the intercellular space. Note the difference between PHB bodies (large, white spots) characteristic for Mesorhizobium when present inside infection threads (red dashed outlines), and the small white spots present in the symbiosomes formed in the chit5 mutant nodules (red arrows). Scale bars are 2 µm.
Figure 3 with 7 supplements

Chit5 encodes a root expressed class V chitinase with Nod factor hydrolase activity.
(A) Chit5 gene structure. Mutation in chit5-2 allele is shown. Chit5 gene is deleted in chit5-1 and chit5-3 alleles. (B) Chit5 promoter activity was monitored in Gifu roots transformed with a Chit5 promoter-tYFP-NLS (green nuclei) in uninoculated and M. loti R7A + DsRed inoculated roots. White arrows highlight examples of uninfected cells showing Chit5 promoter activity. Scale bars are 200 µm. (C) ROS induced by exudates of CO-VI-treated plants. (D) Absence of ROS induction by exudates of M. loti R7A Nod factor-treated plant exudates. (E) M. loti R7A Nod factor hydrolysis in the presence of the indicated plant genotypes measured by HPLC-MS. The average relative percentage of LCO-V and LCO-II fractions from two biological replicates (Figure 3—source data 1) determined from peak-peak integration is indicated in brackets. The peak eluting near 4.1 min is present in all plant treated samples but was not detected in the control sample. It lacks the characteristic fragmentation pattern of LCOs, and appears to be an aromatic, small molecule unrelated to chitinase activity.
-
Figure 3—source data 1
HPLC-MS analysis of Nod factor isolated after exposure to roots of wild-type Gifu or chit5 mutants.
- https://doi.org/10.7554/eLife.38874.017
Figure 3—figure supplement 3
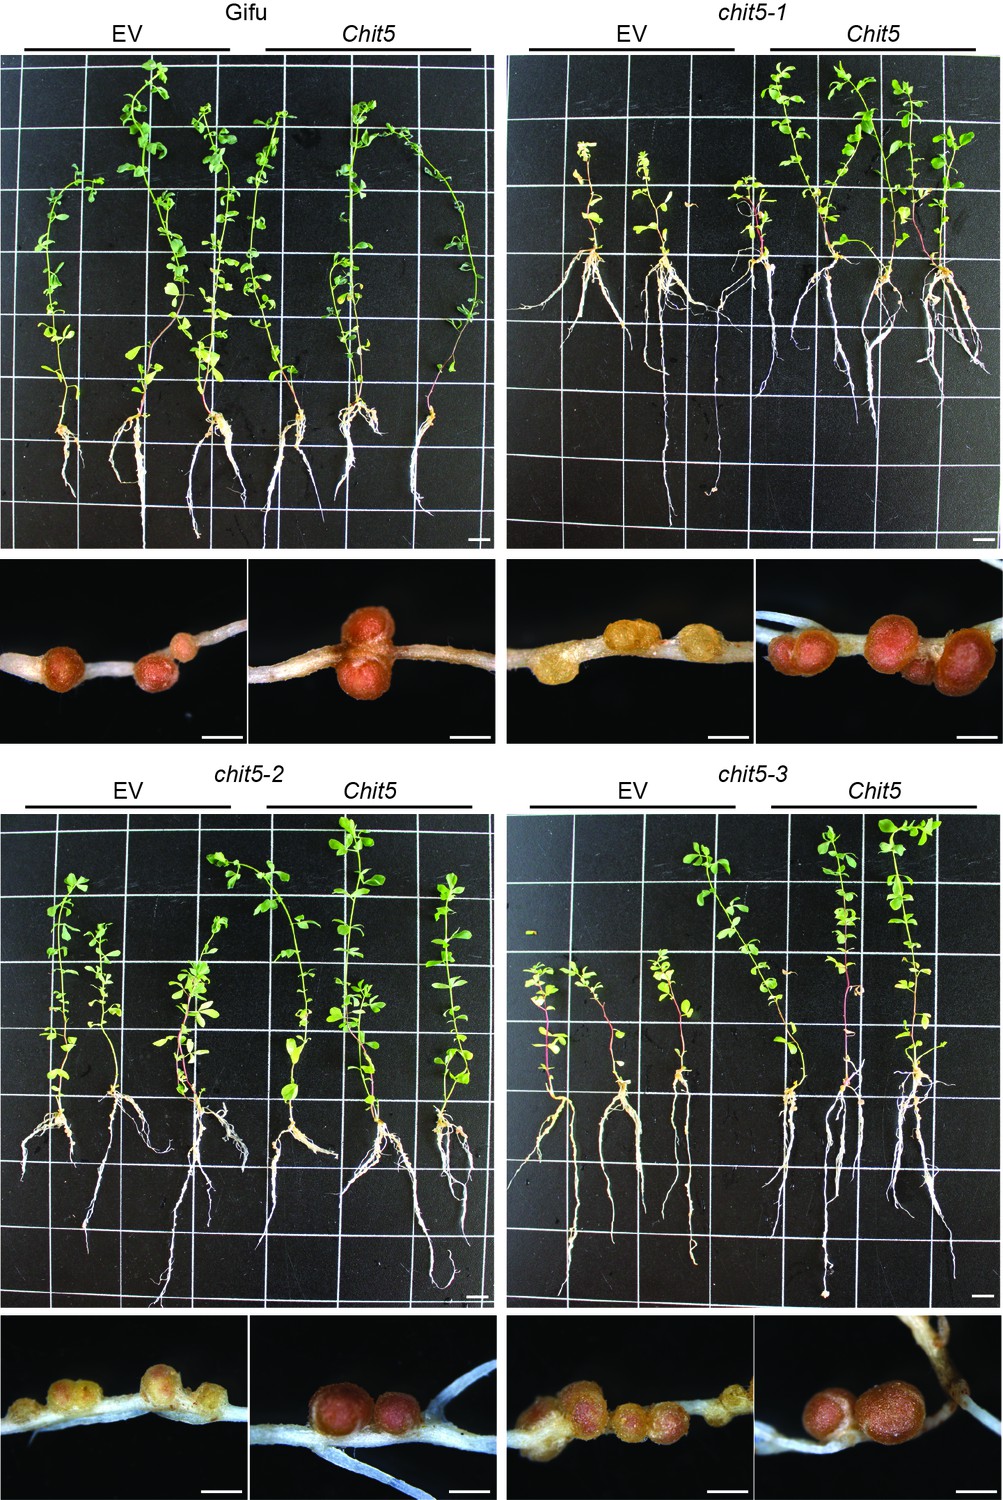
Complementation of chit5 mutant alleles with Chit5.
Gifu (A) and chit5 mutant plants (B–D) were transformed with an empty vector (EV) control or Chit5 expressed from its native or Ljubiquitin promoter. Plants were harvested 6 weeks post-inoculation with M.loti R7A. Similar results were obtained using the two promoters and images show three representative plants and examples of the nodules formed. Scale bars are 1 cm for plant images and 1 mm for nodules.
Figure 3—figure supplement 4
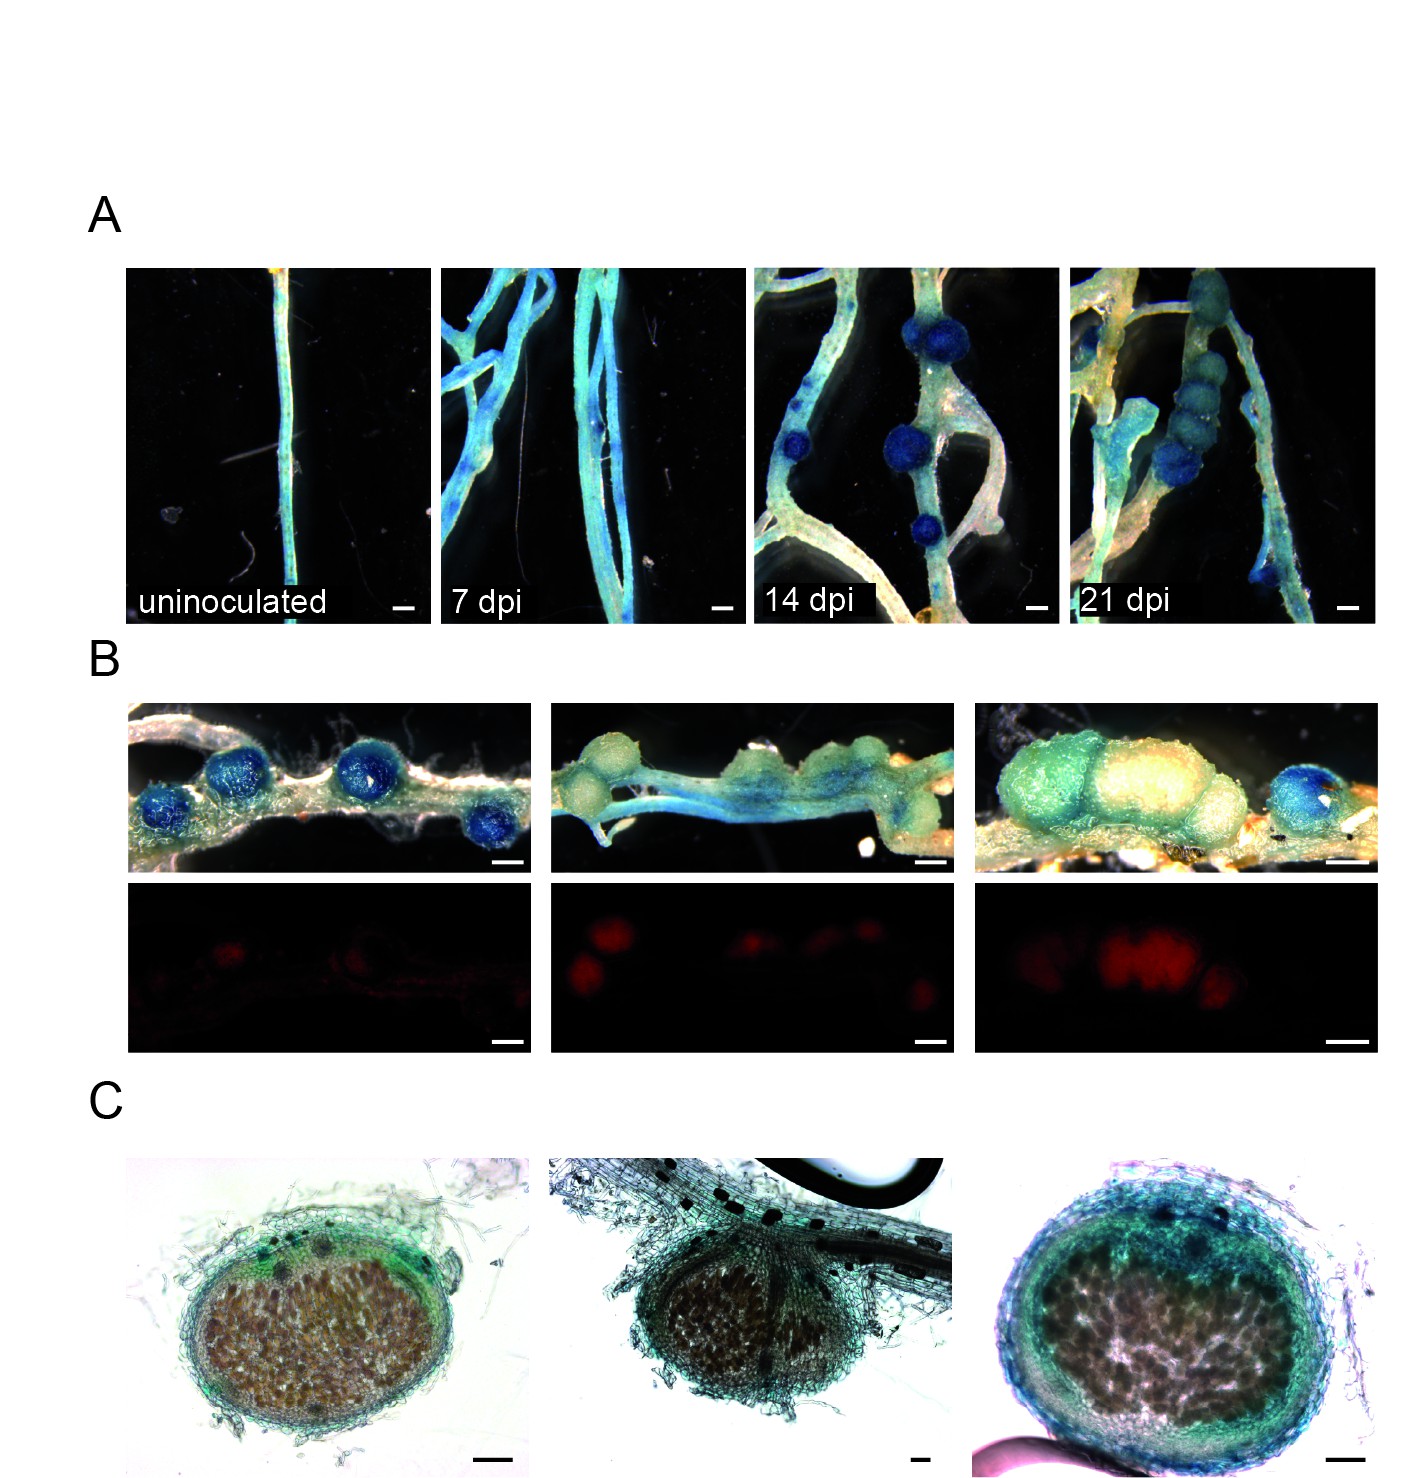
Chit5 promoter-GUS reporter analysis .
Gifu plants transformed with a Chit5 promoter-GUS reporter construct were analysed after inoculation with M. loti R7A + DsRed. (A) Chit5 promoter activity in transformed roots uninoculated or inoculated with M. loti R7A + DsRed at the indicated time points. Scale bars are 0.5 mm. (B) Upper panel shows light microscopy of GUS-reporter staining in nodules at different developmental stages and the lower panel shows M. loti R7A + DsRed colonization state of these same nodules Note the increase in DsRED fluorescence in the nodules with reduced GUS activity. Scale bars are 0.5 mm. (C) Sections of mature nodules show that Chit5 promoter activity is restricted to non-colonized nodule cells. Scale bars are 200 μm.
Figure 3—figure supplement 5
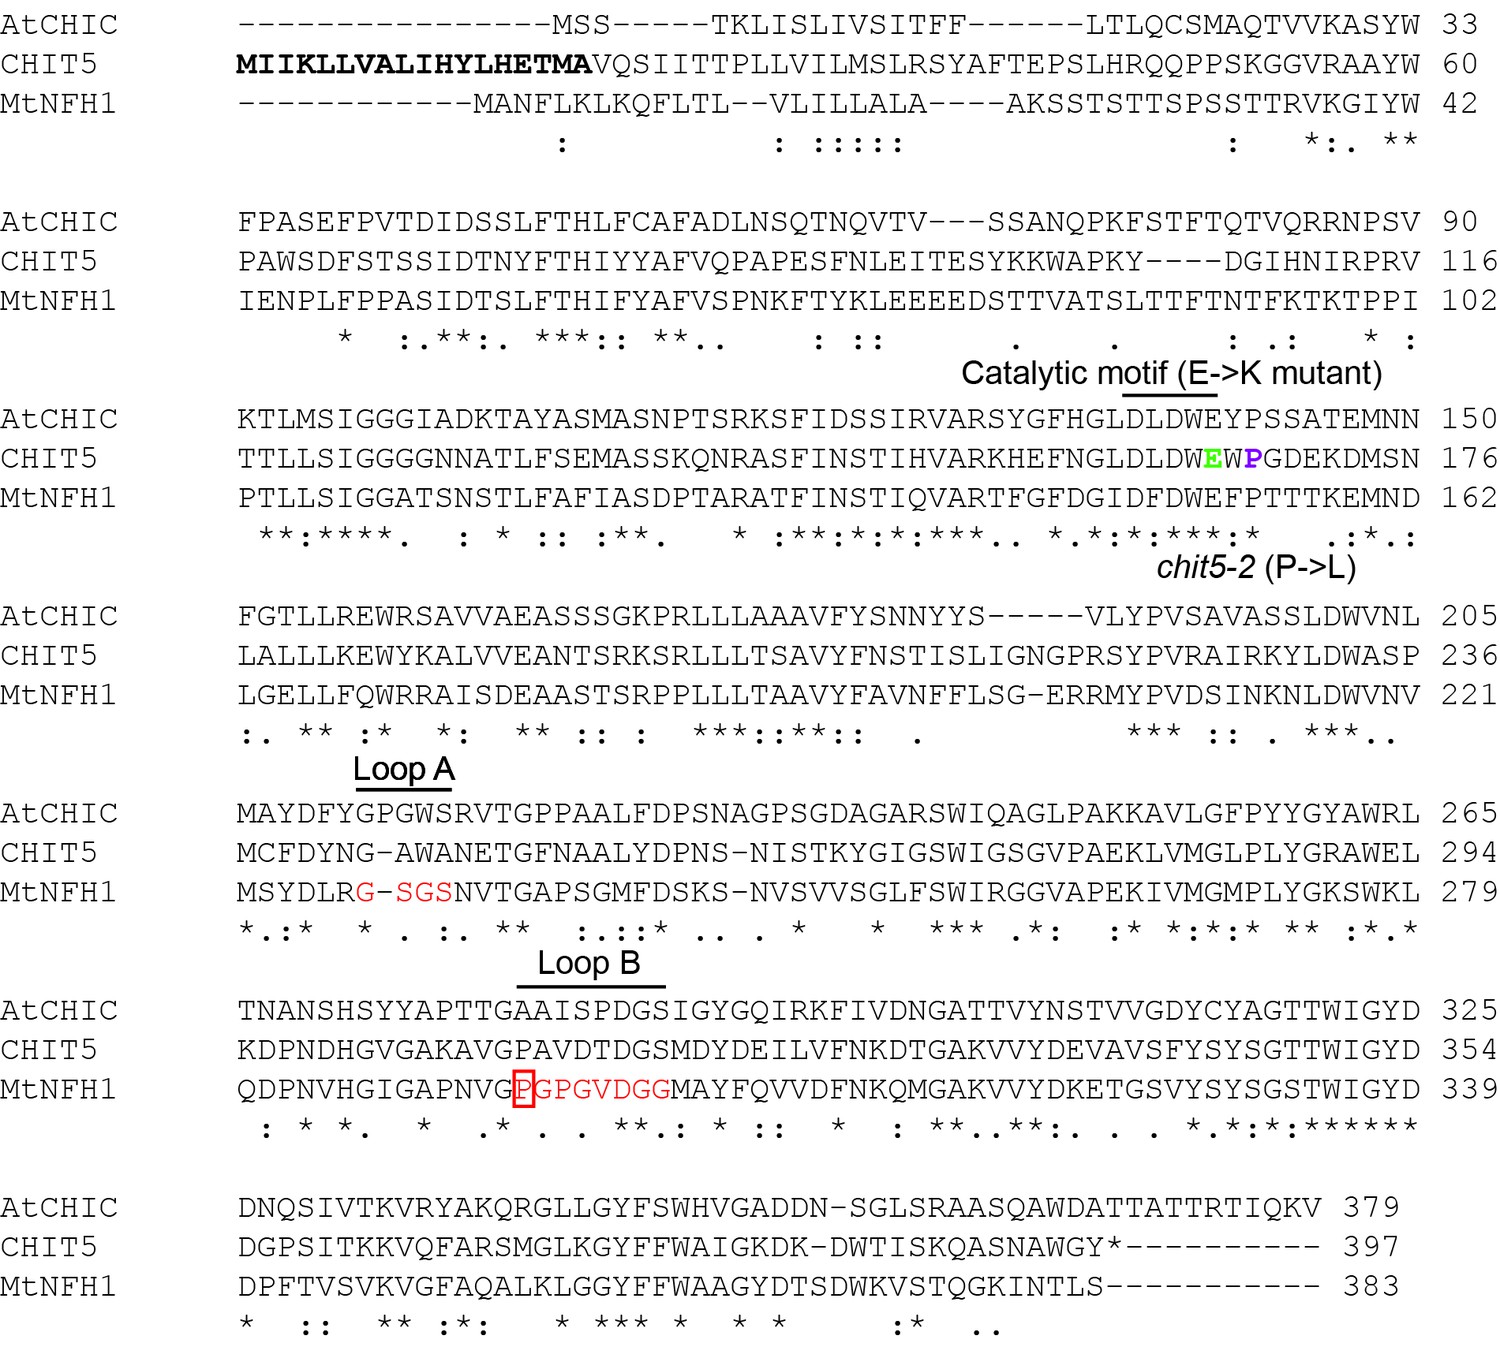
Amino acid alignment of CHIT5, AtCHIC, MtNFH1.
Amino acid sequence alignment of Lotus japonicus CHIT5, Medicago truncatula NFH1 (KC833515) and Arabidopsis thaliana CHIC (NP_193716). (*) indicates a conserved residue, (:) indicates strongly similar properties, (.) indicates weakly similar properties, (-) indicates gaps. A predicted signal peptide is indicated in bold for CHIT5. The conserved catalytic motif DxDxE is indicated as is the position of the E-K mutation (green) introduced to produce an inactive CHIT5 construct. The position of the P-L substitution in chit5-2 is indicated (magenta). The position of A and B loops (in red) and of the proline residue (red box) identified as important for Nod factor hydrolase activity of MtNFH1 are indicated.
Figure 3—figure supplement 6
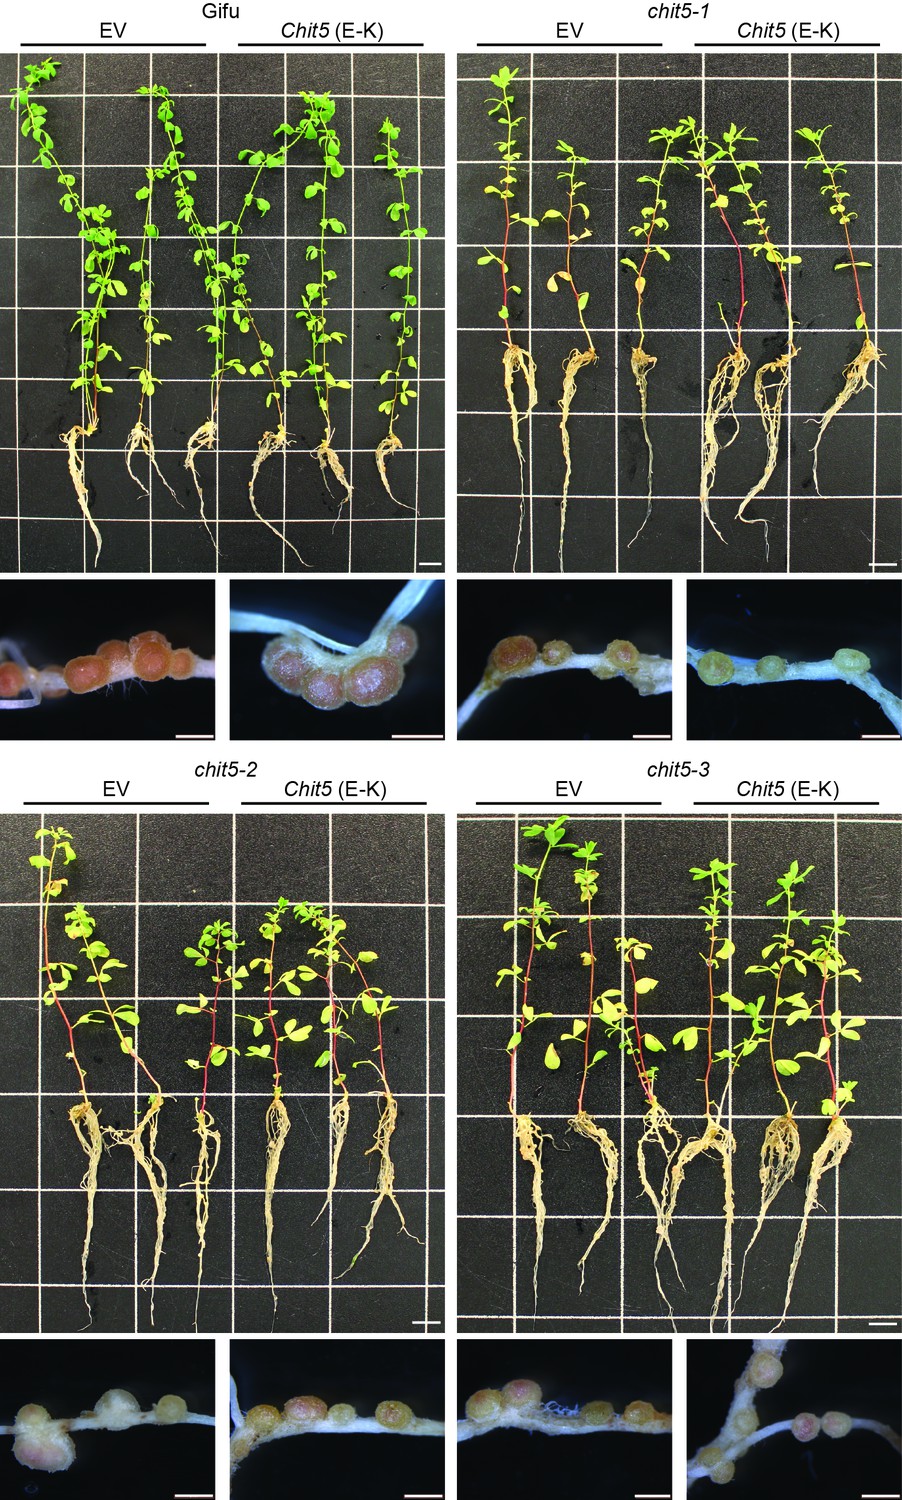
Complementation of chit5 mutant alleles with Chit5 (E166–K).
Gifu (A) and chit5 mutant plants (B–D) were transformed with an empty vector (EV) control or an active site mutant version of Chit5 (E to K) expressed from its native promoter. Plants were harvested 6 weeks post-inoculation with M. loti R7A. Images show three representative plants for each transformation construct and examples of the nodules formed. Scale bars are 1 cm for plant images and 2 mm for nodules.
Figure 3—figure supplement 7

Several Lotus japonicus chitinase genes are expressed in roots.
(A) Phylogenetic analysis of protein sequences of annotated chitinases or glycosyl hydrolases from Lotus genome v3.0. (B) Log10 total counts from RNA-seq analysis performed on Gifu roots and shoots 3 dpi with water or M.loti R7A from Lotus base (www.lotus.au.dk). Chit5 (as assigned in v3.0) is highlighted in red.
Figure 3—figure supplement 2
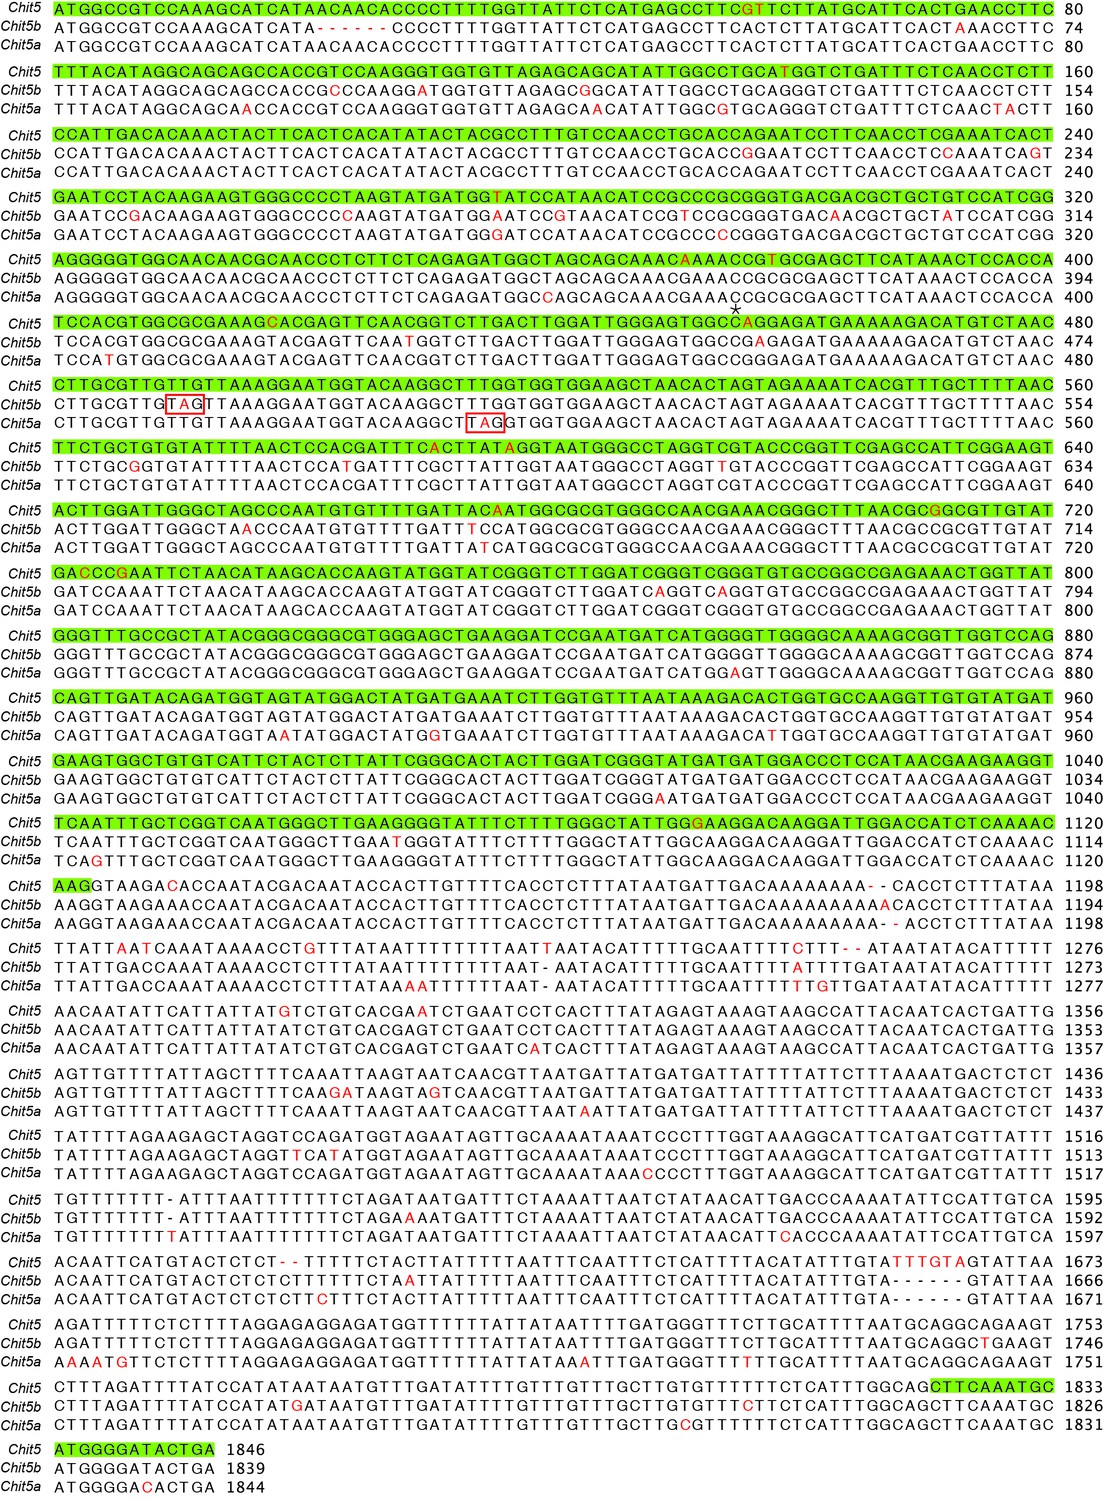
Alignment of Chit5 paralogs.
Nucleotide sequence alignment of Chit5 and its two paralogs (start to stop codons). Exons are highlighted in green and nucleotide polymorphisms are shown in red. The premature stop codons in the paralogs are highlighted by red boxes and the position of the C to T point mutation in chit5-2 is indicated with an asterisk.
Figure 3—figure supplement 1
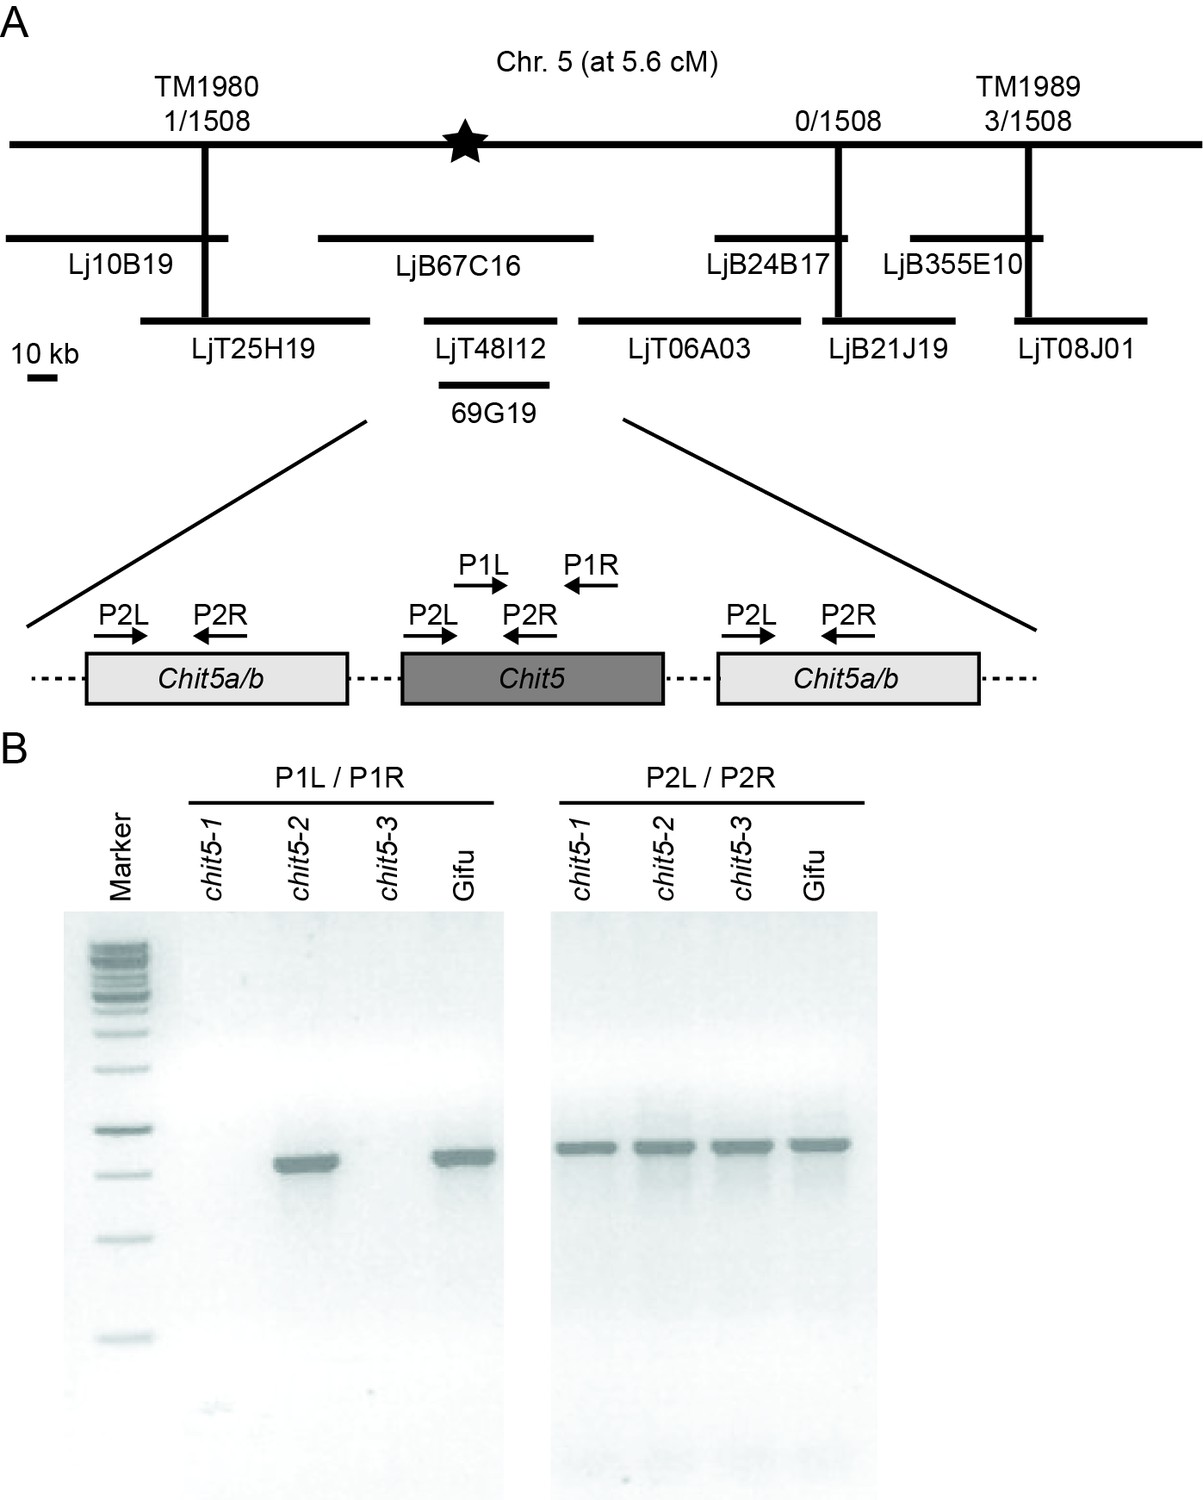
Map-based cloning of Chit5 gene.
(A) Positions of bacterial artificial chromosome (BAC) and transformation-competent artificial chromosome (TAC) clones from L. japonicus MG20 and BAC clone 69G19 from L. japonicus Gifu are shown. The closest markers with the number of informative recombinations delimiting the Chit5 locus are indicated. A schematic representation of the three Chit5 paralogs within the delimited region is shown with PCR primer binding sites indicated. (B) Amplicon detection in the indicated genotypes using primers specific for Chit5 (P1L/P1R) and common for the three Chit5 paralogs (P2L/P2R).
Figure 4 with 7 supplements
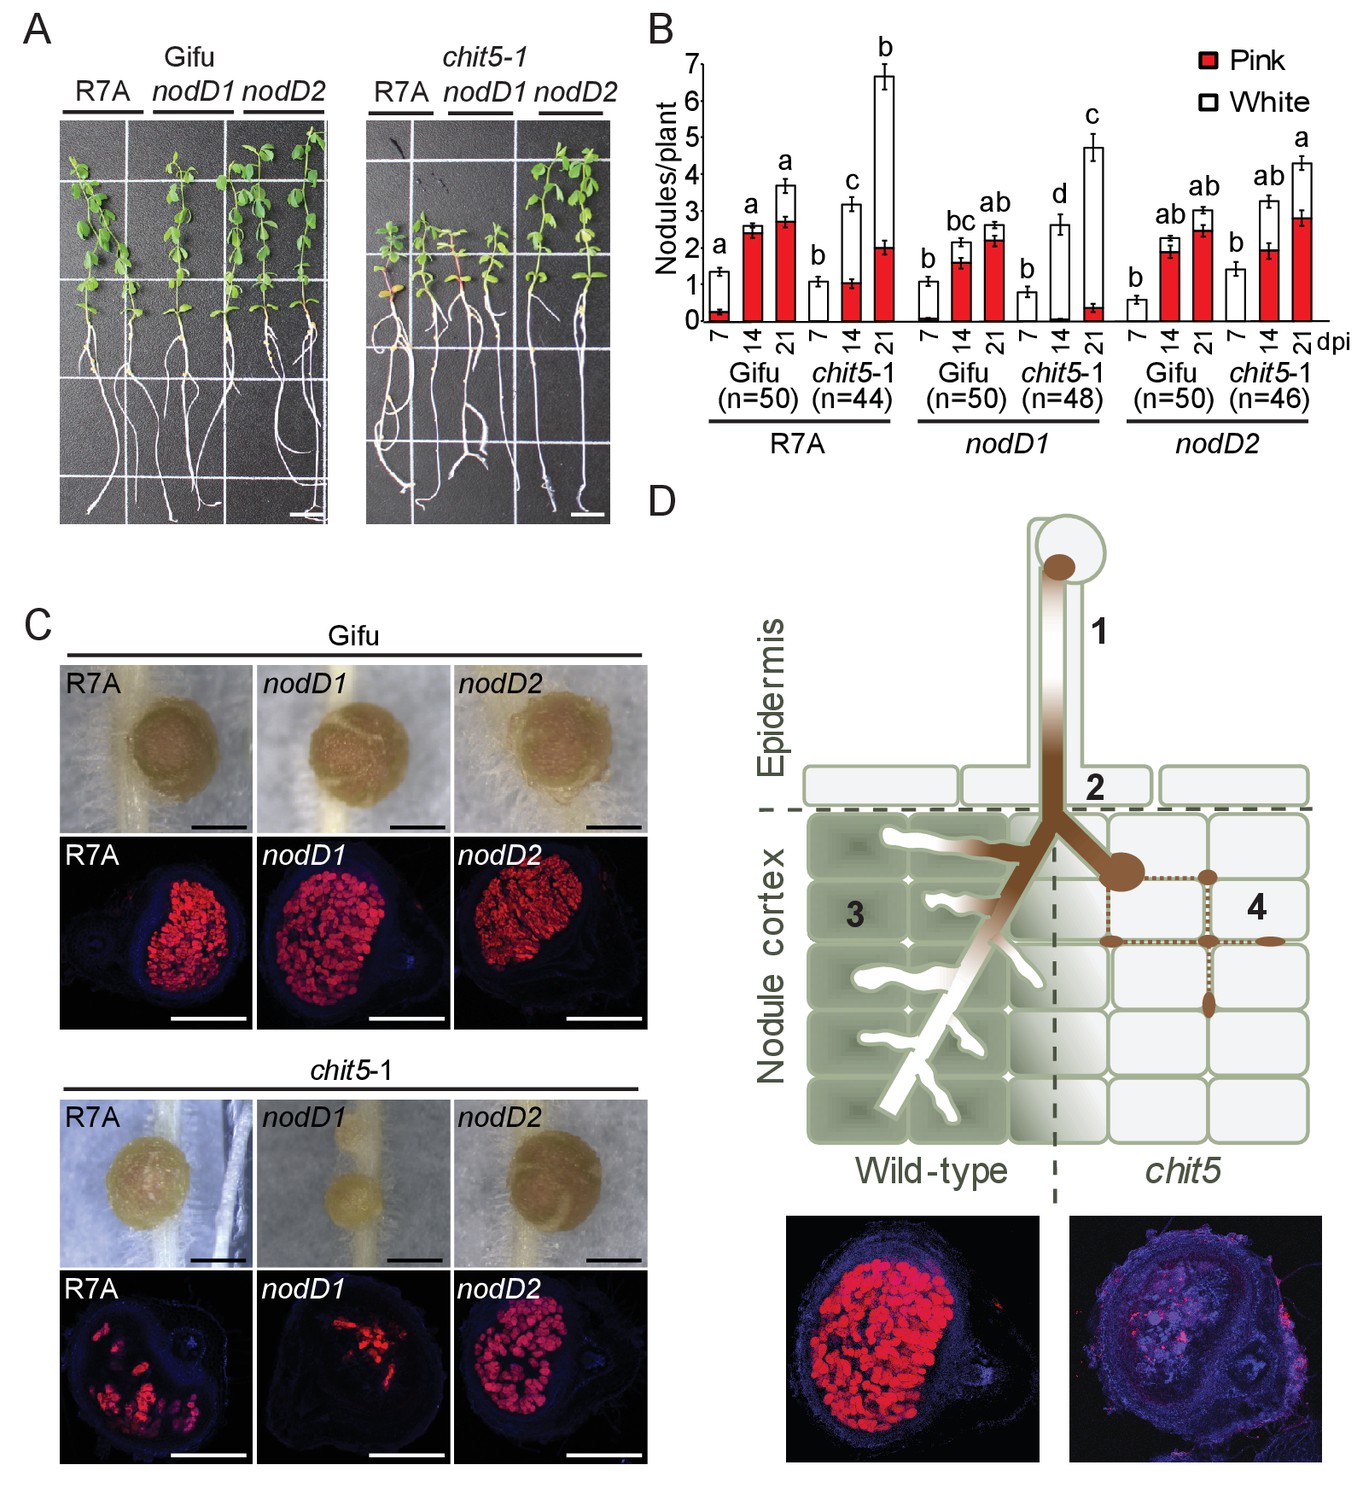
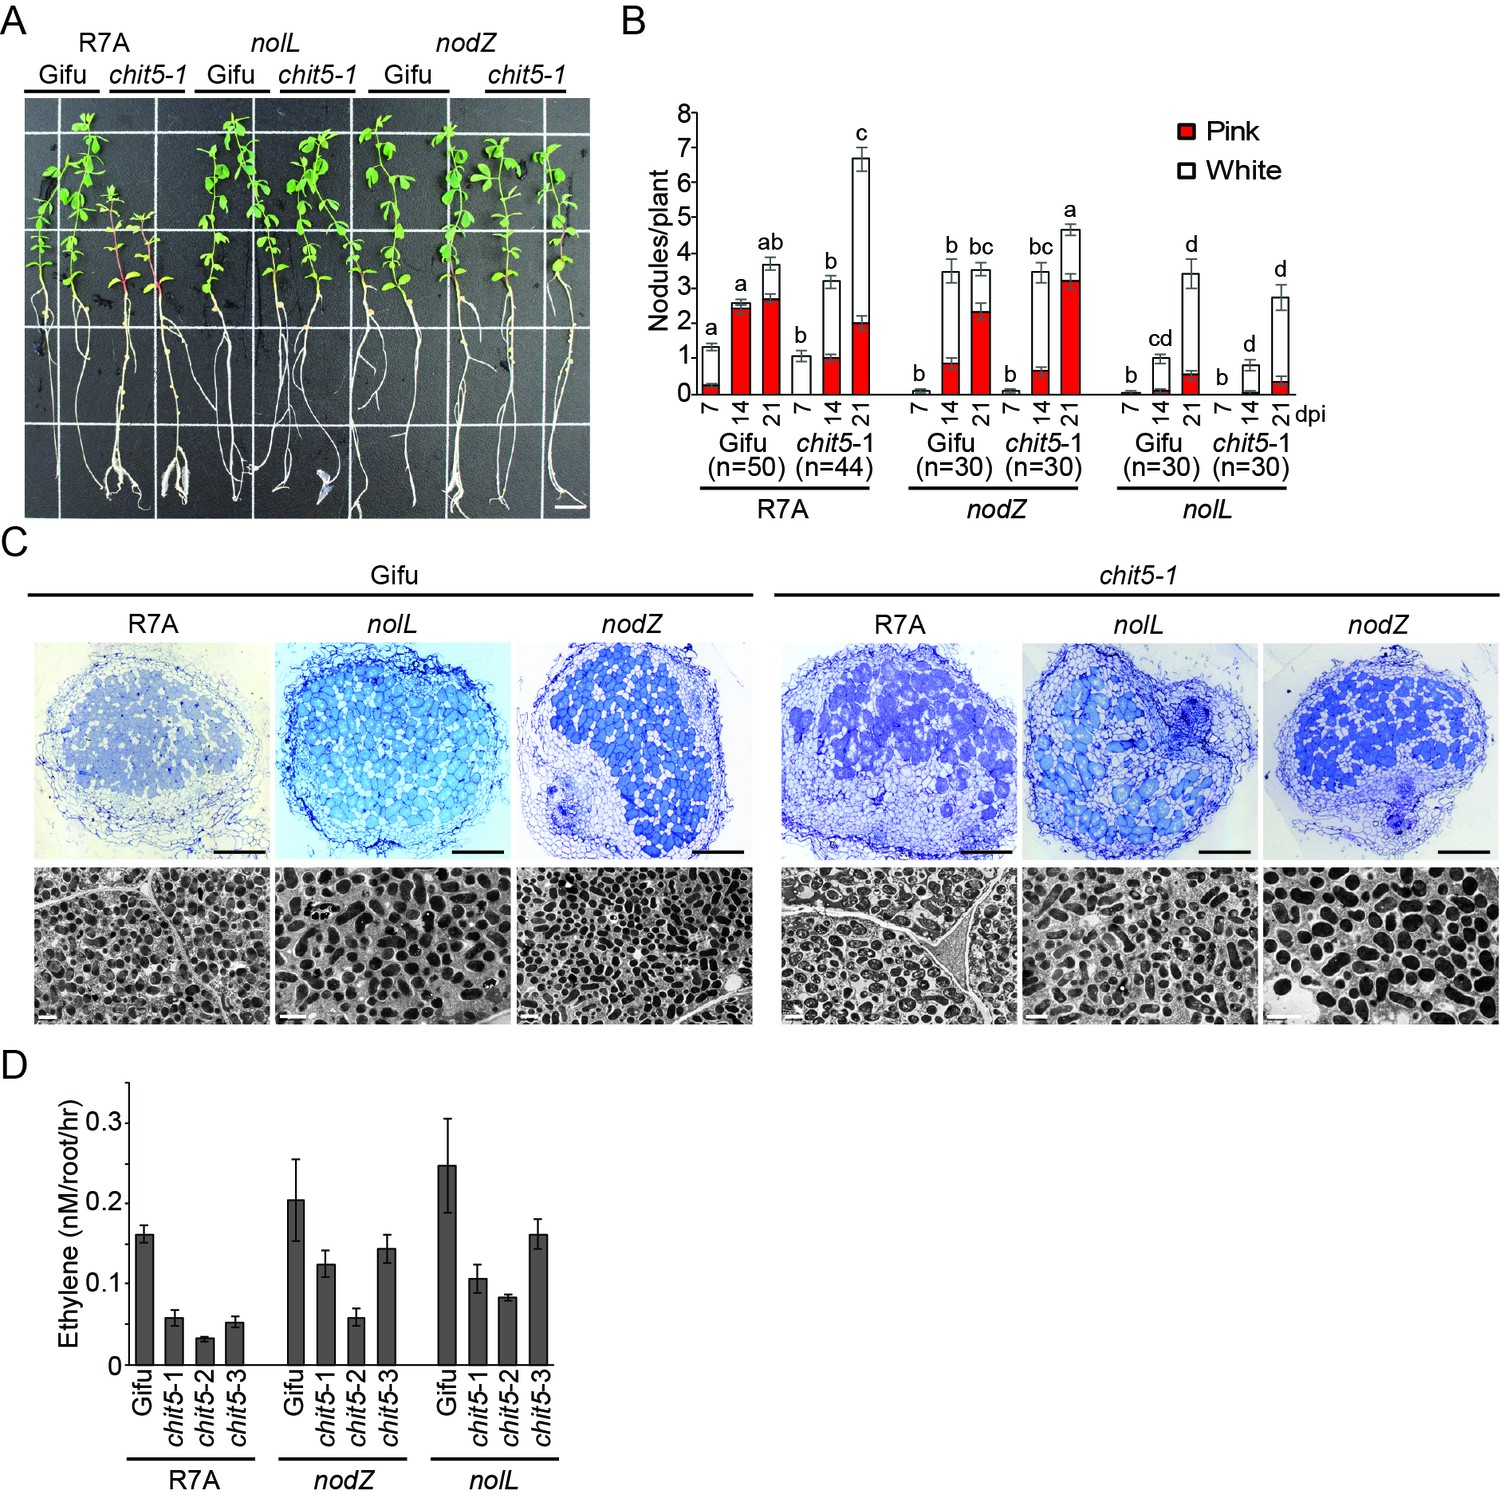
The symbiotic impairment of chit5 mutants can be overcome by an M.loti R7A mutant affected in the regulation of Nod factor biosynthesis.
(A) Representative images of Gifu and chit5-1 plants inoculated with the indicated M. loti R7A strains 7 wpi. Scale bars are 1 cm. (B) Average number of pink and white nodules formed on Gifu and chit5-1 by the indicated M. loti R7A strains over 3 weeks. Error bars represent SEM and statistical comparisons of the number of pink nodules formed between strains on each genotype at each time point are shown using ANOVA and Tukey post hoc testing with p values < 0.05 as indicated by different letters. (C) Light microscopy of whole nodules 3 wpi and confocal images of nodule sections from Gifu and chit5-1 plants inoculated with the indicated strains tagged with DsRed. Scale bars are 0.5 cm. (D) Proposed model of CHIT5 activity and representative nodule images of wild-type and chit5 mutant illustrating the observed phenotype. (1) Bacteria maintain a low level of Nod factors within root hair-traversing ITs by preferential activity of NodD1. (2) and (3) Bacterial amplification inside ITs, coupled with the switch for preferential activity of NodD2 leads to higher levels of fully decorated pentameric Nod factors (LCO-V). Chit5 expression (green filled cells in wild-type) is crucial for maintaining a balanced Nod factor level enabling IT extension inside primordia, efficient bacterial endocytosis and, ultimately, development of the nitrogen-fixing organ (3). (4) In the chit5 mutants (light grey filled cells) higher levels of Nod factors (LCO-V) impede IT elongation and branching inside primordia leading to bacteria accumulation in between the cells (dotted brown line) and scattered infection.
Figure 4—figure supplement 1
chit5 mutant phenotypes with M.loti R7A mutants affected in the regulation of Nod factor biosynthesis.
(A) Root hair infection thread formation on the indicated genotypes with M. loti R7A strains. 20 plant roots were cut into 1 cm pieces and 60 of these were analysed per condition. Error bars represent SEM and statistical comparisons of the number of full length infection threads formed across genotypes by the different M. loti R7A strains are shown using ANOVA and Tukey post hoc testing with p values < 0.01 as indicated by different letters. (B) Light microscopy and transmission electron microscopy of nodule sections from Gifu and chit5-1 inoculated with the indicated strains. Scale bars are 200 μm for light microscopy images and 2 μm for TEM. (C) Nitrogenase activity measured as the amount of ethylene production from acetylene incubated nodules of Gifu and chit5 mutant alleles inoculated with the indicated M. loti R7A strains.
Figure 4—figure supplement 2
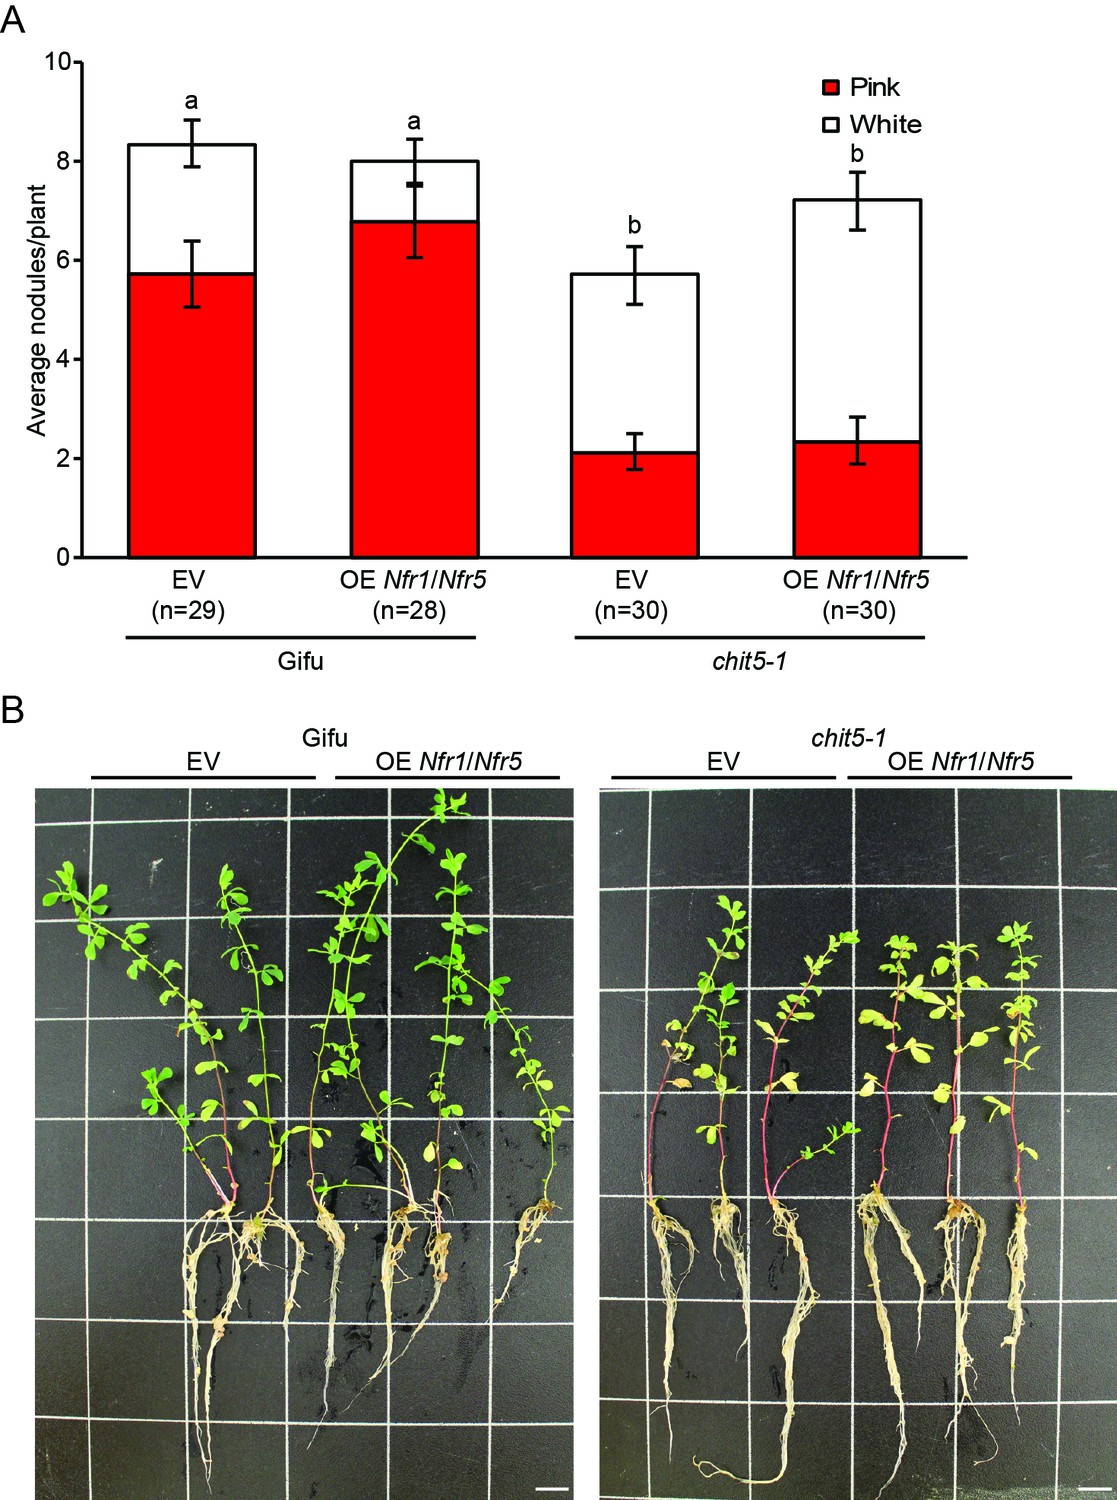
Overexpression of Nfr1 and Nfr5 does not rescue the symbiotic impairment of chit5-1.
(A) Nodule counts on Gifu and chit5-1 plants transformed with an empty vector control or the Nfr1/Nfr5 over-expression construct 6 weeks post-inoculation with M. loti R7A. Error bars represent SEM and statistical comparisons of pink nodules formed are shown using ANOVA and Tukey post hoc testing with p values < 0.01 as indicated by different letters. (B) Representative images of Gifu and chit5-1 plants transformed with an empty vector control or the Nfr1/Nfr5 over-expression construct 6 weeks post-inoculation with M. loti R7A. Scale bars are 1 cm.
Figure 4—figure supplement 3
chit5 mutant phenotypes with M.loti R7A mutants affected in the biosynthesis of fully decorated Nod factor.
(A) Representative images of Gifu and chit5-1 plants inoculated with the indicated strains 7 wpi. Scale bars are 1 cm. (B) Average number of pink and white nodules formed on Gifu and chit5-1 by the indicated M. loti R7A strains over 3 weeks. Error bars represent SEM and statistical comparisons of the number of pink nodules formed between strains on each genotype at each time point are shown using ANOVA and Tukey post hoc testing with p values < 0.05 as indicated by different letters. (C) Light microscopy and transmission electron microscopy of nodule sections from Gifu and chit5-1 inoculated with the indicated strains. Scale bars are 200 μm for light microscopy images and 2 μm for TEM. (D) Nitrogenase activity measured as the amount of ethylene production from acetylene incubated nodules of Gifu and chit5 mutant alleles inoculated with the indicated M. loti R7A strains.
Figure 4—figure supplement 4
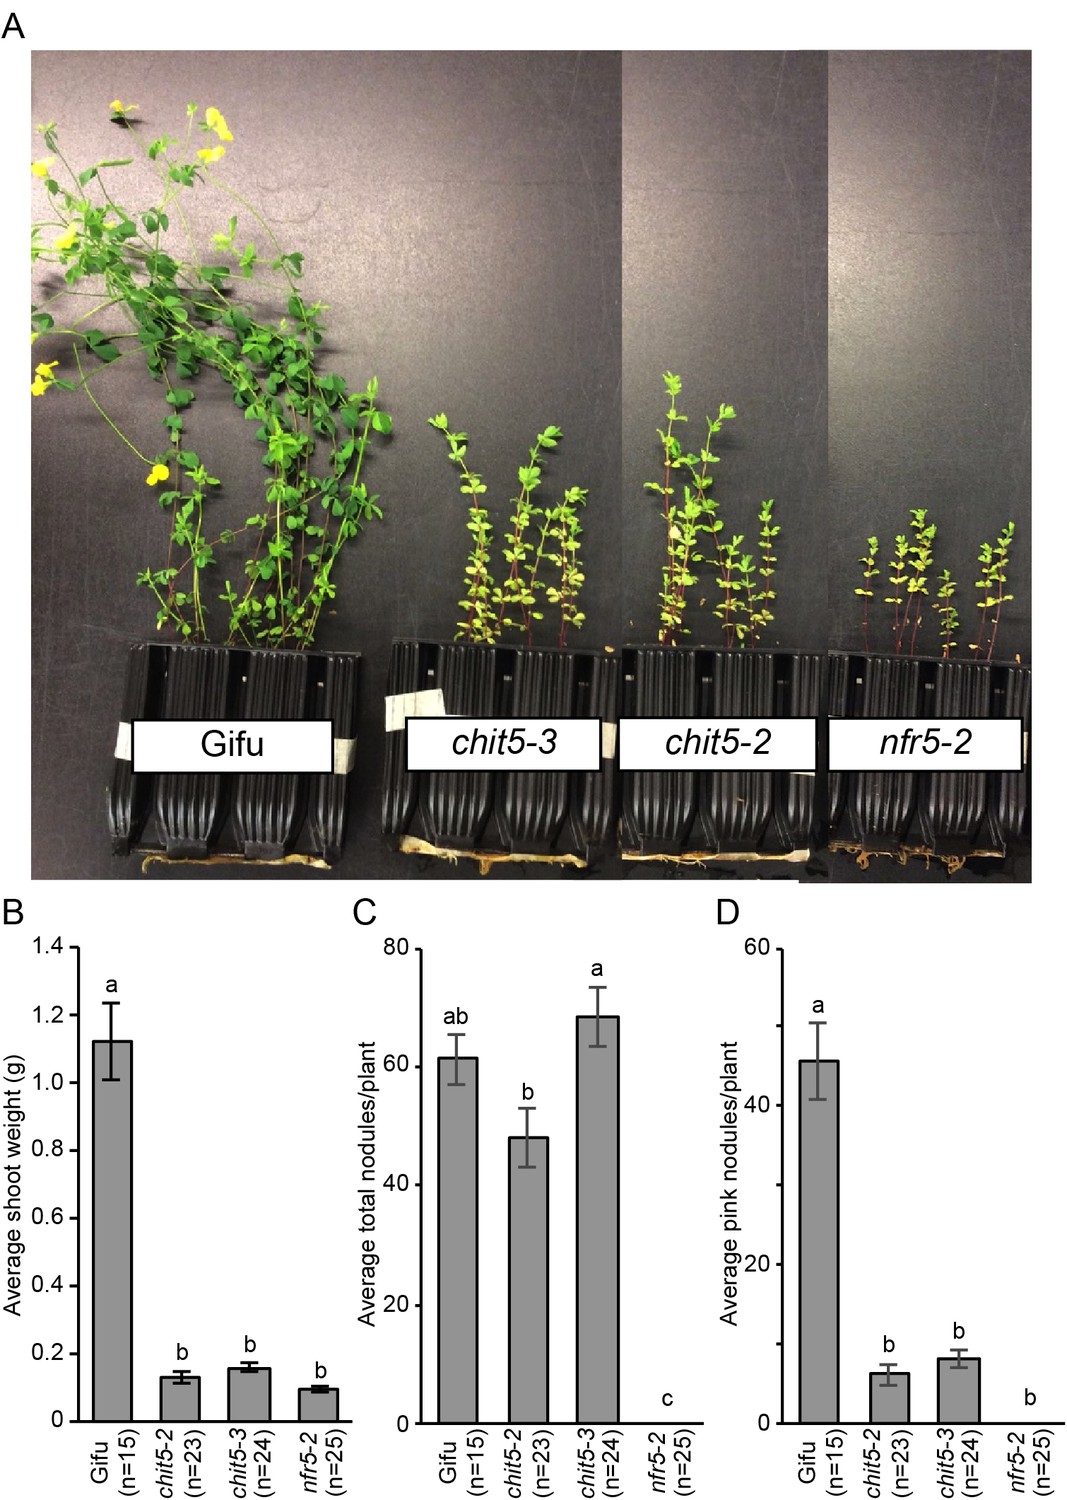
chit5 mutants show a nitrogen-deficient phenotype when grown in soil.
(A) Plant growth of the indicated genotypes when grown in soil containing its native microbiota for 9 weeks. (B) Shoot weight of plants after 7 weeks growth in soil. (C) Counts of total nodules formed on the soil grown plants. (D) Number of pink nodules formed on the soil-grown plants. For (B), (C) and (D) error bars represent SEM and statistical comparisons between the genotypes are shown using ANOVA and Tukey post hoc testing with p values < 0.01 as indicated by different letters.
Figure 4—figure supplement 5
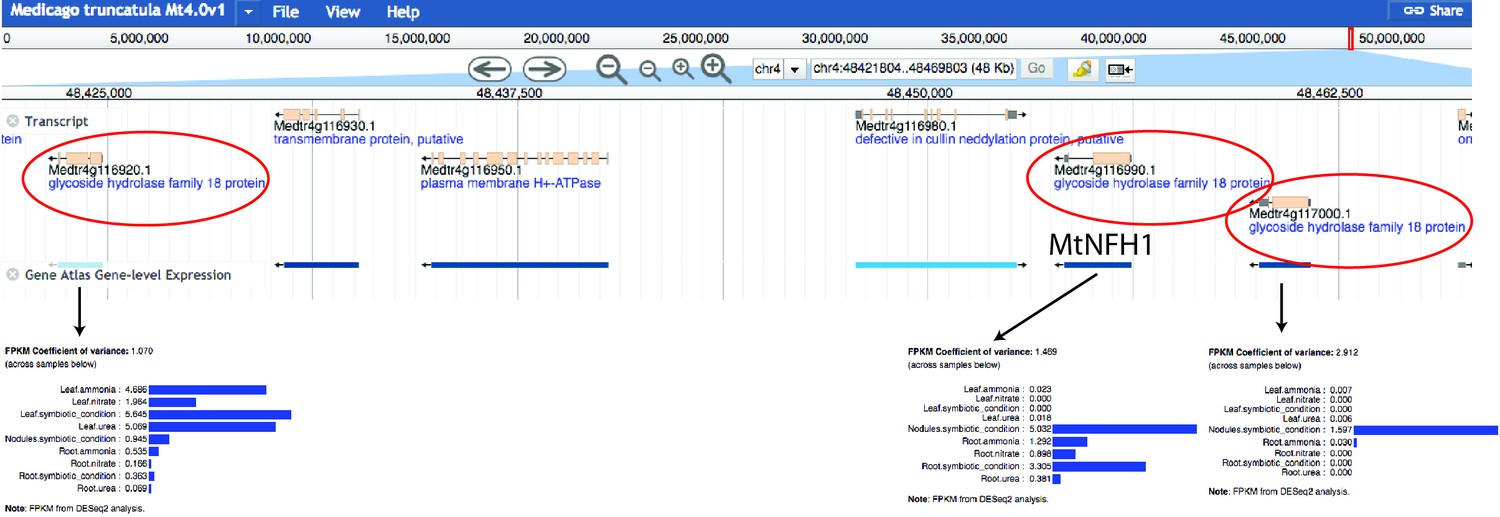
Genomic location and expression pattern of MtNfh1 and the two close-located paralogs.
The genomic information available on Phytozome 12 (https://phytozome.jgi.doe.gov) is given according to Medicago truncatula Mt4.0v1 version of the genome, and their expression level according to Gene Atlas expression tool. The three GH18 coding genes are marked (red circle) and their expression pattern is shown.
Figure 4—figure supplement 6
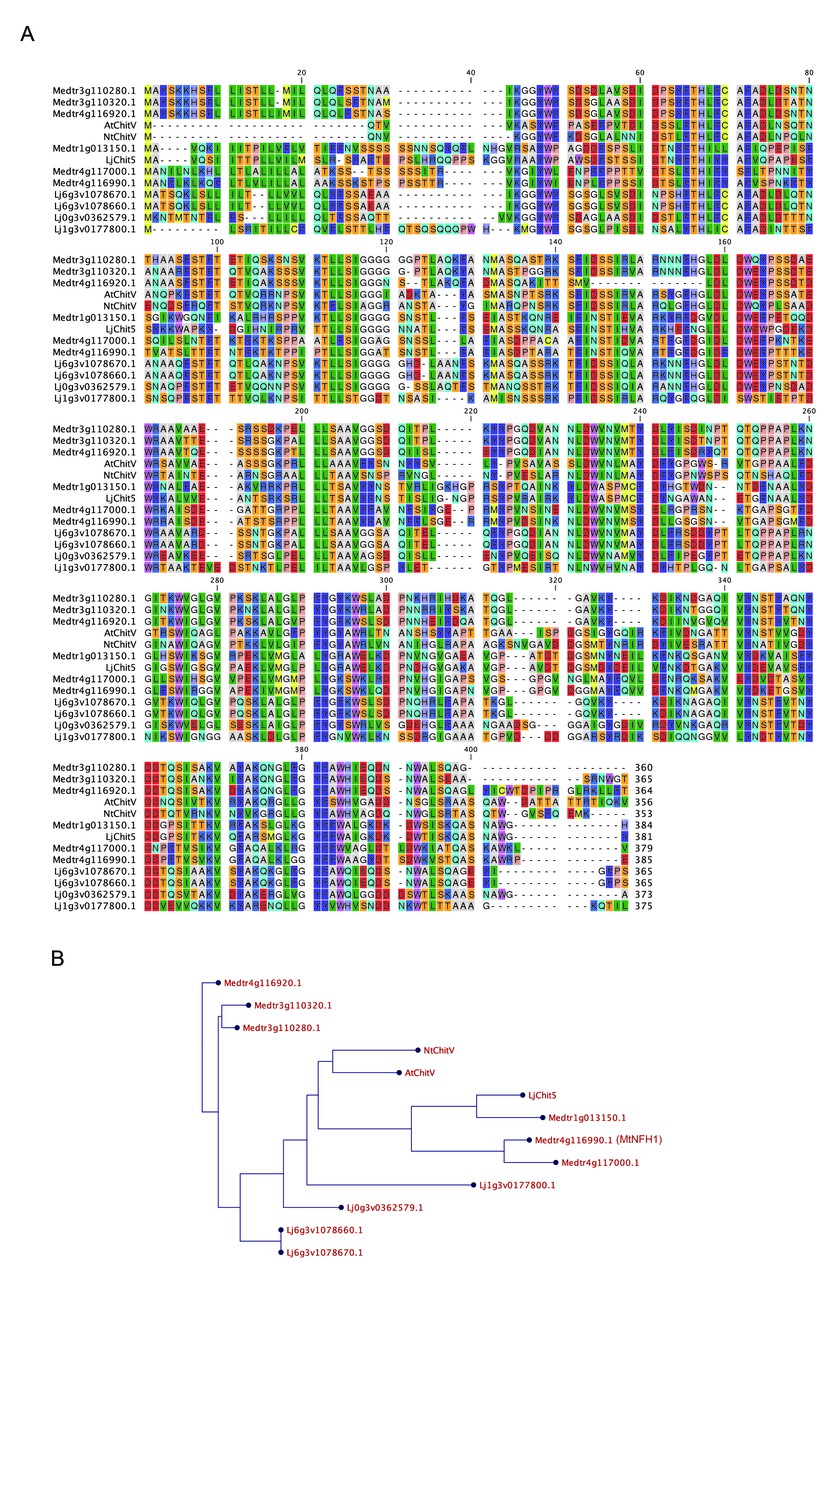
GH18 proteins from M.truncatula and L.japonicus.
Alignment (A) and phylogenetic tree (B) of Lotus and Medicago proteins along with CHIT5 from Arabidopsis (AT4G19810.1) and Nicotiana tabaccum (XP_016468204.1). Protein sequences were obtained from https://phytozome.jgi.doe.gov, and https://lotus.au.dk/.
Figure 4—figure supplement 7
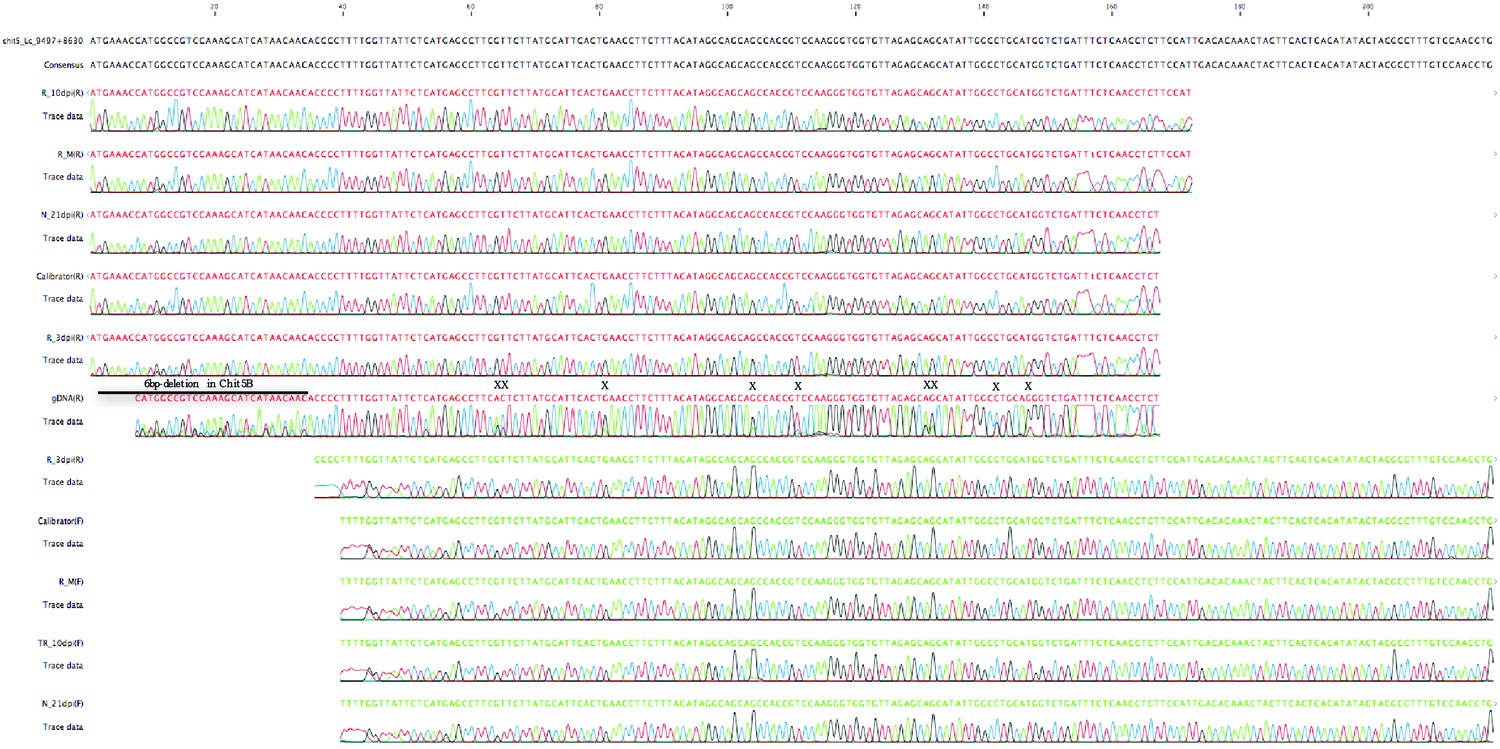
Sequencing traces from PCR products using genomic DNA (gDNA), cDNA from water treated roots (R_M), M.loti inoculated roots-3dpi (R_3dpi),−10dpi (R_10dpi) and nodules-21 dpi (N_21dpi) as template.
Calibrator template contains a mixture of L. japonicus cDNAs from various organs and M.loti infected roots and nodules. The PCR products were sequenced with forward (F) or reverse primer (R). Note that sequences from gDNA have double peaks in the regions with nucleotide polymorphisms between chitinase paralogs (X and line), while the cDNA sequences have only one variant corresponding to Chit5.
Additional files
-
Transparent reporting form
- https://doi.org/10.7554/eLife.38874.028
Download links
A two-part list of links to download the article, or parts of the article, in various formats.
Downloads (link to download the article as PDF)
Open citations (links to open the citations from this article in various online reference manager services)
Cite this article (links to download the citations from this article in formats compatible with various reference manager tools)
A plant chitinase controls cortical infection thread progression and nitrogen-fixing symbiosis
eLife 7:e38874.
https://doi.org/10.7554/eLife.38874


