Structural basis of tubulin recruitment and assembly by microtubule polymerases with tumor overexpressed gene (TOG) domain arrays
- University of California, United States
Figures
Figure 1 with 3 supplements
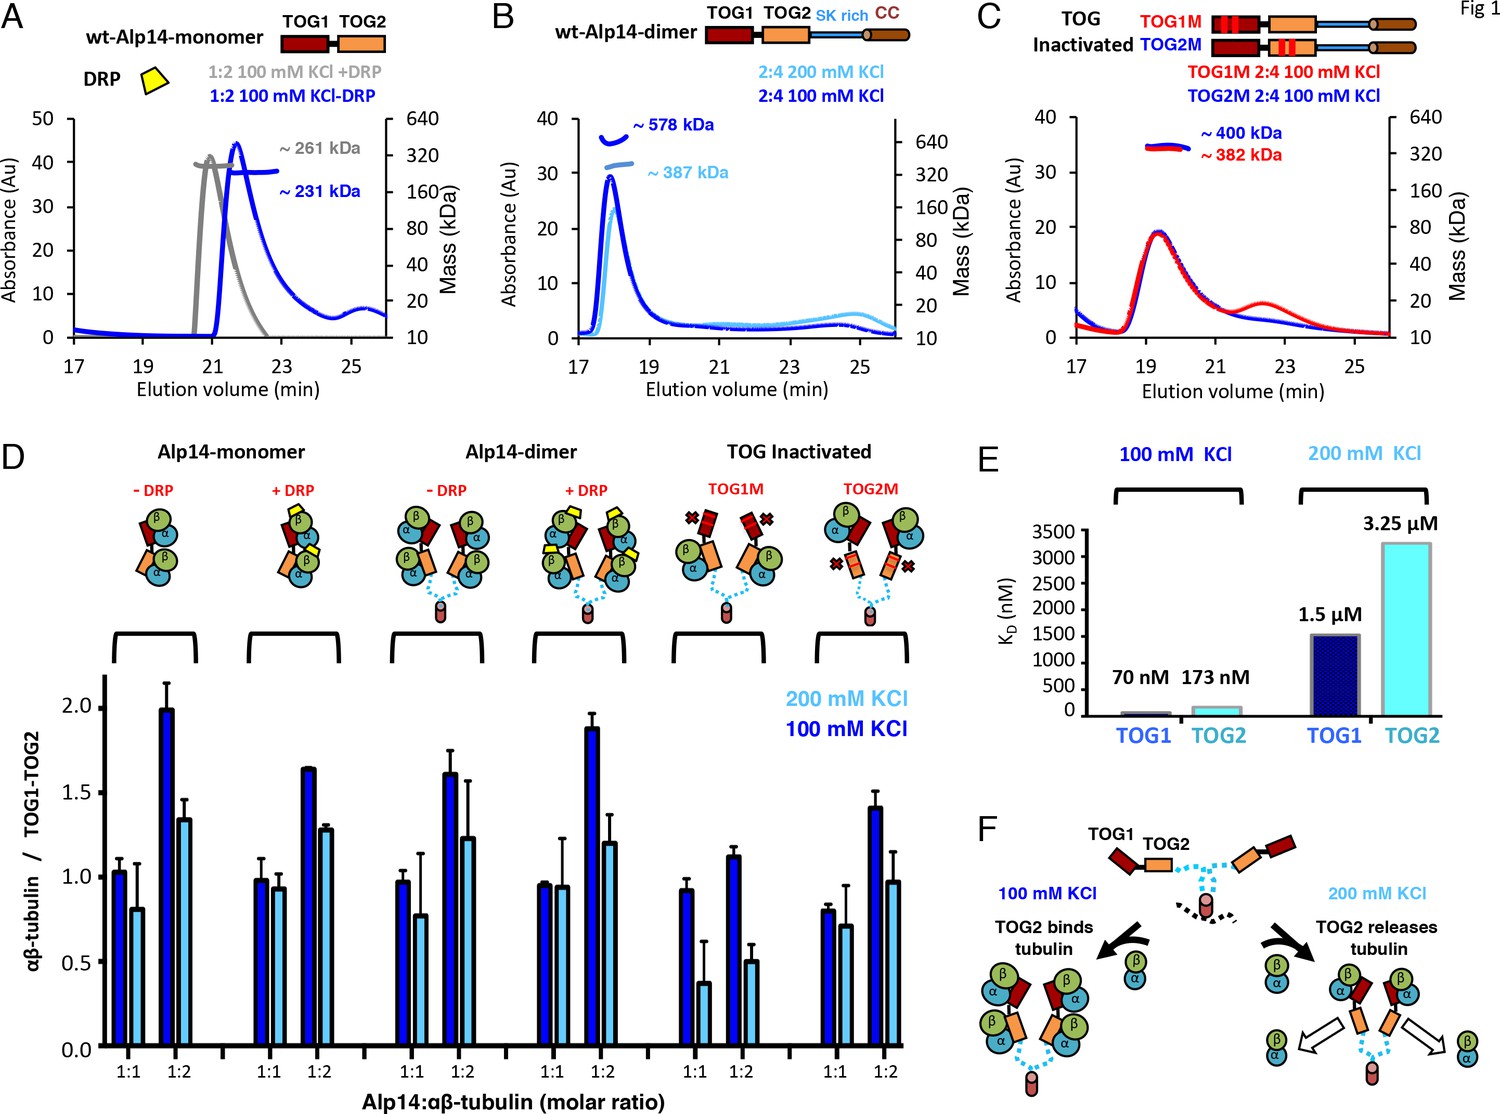
TOG1 and TOG2 domains bind αβ-tubulins and exchange them at different rates, within Alp14 TOG arrays.
(A) Top, domain organization of Alp14-monomer. Bottom, SEC-MALS for wt-Alp14-monomer at 100 mM KCl with and without DRP, revealing two αβ-tubulins bound in a non-polymerized state. (B) Top, domain organization of Alp14-dimer. Bottom, SEC-MALS for wt-Alp14-dimer in αβ-tubulin complex at 2:4 stoichiometry at 100 mM and 200 mM KCl, revealing that four αβ-tubulins bind dimeric-Alp14 with four TOG domains and two αβ-tubulins dissociate upon increase of ionic strength (masses reported in Table 2). (C) Top, organization of TOG-inactivated Alp14-dimer (C: TOG1M, TOG2M). Bottom, SEC-MALS of 4:2 TOG1M- and TOG2M-αβ-tubulin at 100 mM KCl revealing half of the αβ-tubulin binding stoichiometry compared to wt-Alp14-dimer (shown in B). (D) SEC-based titration measured through analyses of masses from SDS-PAGE (Figure 1—figure supplement 1; Materials and methods) of Alp14-monomer, Alp14-dimer, and TOG1M and TOG2M with and without DRP binding, reveals the binding capacities of TOG1 and TOG2 domains in these constructs and their non-equivalence in αβ-tubulin exchange at 200 mM KCl. DRP binding to αβ-tubulin does not influence αβ-tubulin binding to TOG arrays. Details are described in Figure 1—figure supplement 1–2. (E) Isothermal titration calorimetery (ITC) reveals TOG1 and TOG2 exchange αβ-tubulin with non-equivalent rates at 200 mM KCl. At 100 mM KCl, TOG1 and TOG2 both slowly dissociate from αβ-tubulin with KD = 70 nM and KD = 173 nM, respectively. At 200 mM KCl, TOG1 dissociates from αβ-tubulin slowly with a KD = 1.50 μM while TOG2 mostly dissociates from αβ-tubulin with a KD = 3.25 μM. ITC binding curves are shown in Figure 1—figure supplement 3. (F) Model for non-equivalent activities of TOG1 and TOG2 within TOG array for recruiting αβ-tubulins.
Figure 1—figure supplement 1
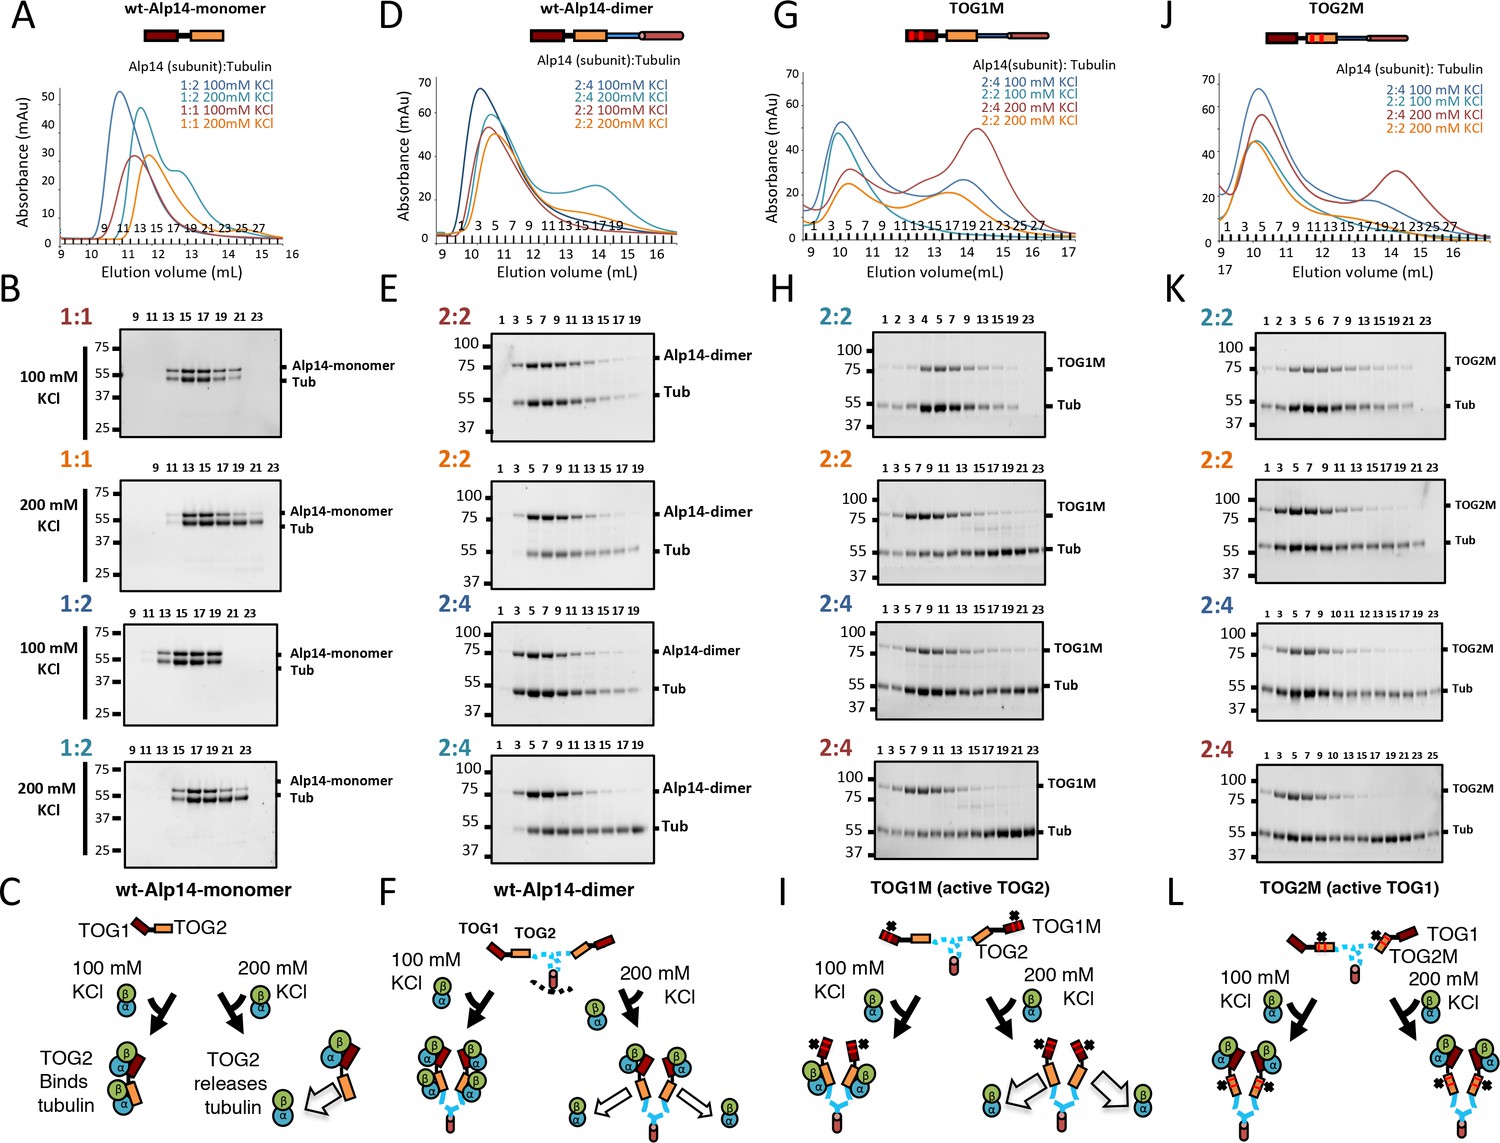
The Alp14 TOG array:αβ-tubulin binding capacities reveal non-equivalent behavior of TOG1 and TOG2 in different conditions.
We determined the molar ratio for four Alp14 constructs (described in Figure 1) in binding to soluble αβ-tubulins at 100 and 200 mM KCl conditions using quantitative-size exclusion chromatography (SEC). Values for molar ratios are reported in Figure 1D and Table 1 revealing the molar ratios of αβ-tubulin bound to these Alp14 constructs. In each condition, 1 μmol of each Alp14 construct was mixed with a defined αβ-tubulin amount (1 μmol per Alp14 subunit) in each condition, and then analyzed by SEC as shown in A, D, G, and J. The SDS-PAGE results for fractions are shown in B, E, H, and K. (A, D, G, J) Top, models for Alp14 constructs studied for tubulin binding using SEC: (A) Alp4-monomer (residues 1–510), (B) wt-Alp14-dimer (residues 1–690), (C) TOG1M (TOG1-inactivated Alp14-dimer mutant), and (D) TOG2M (TOG2-inactivated Alp14-dimer mutant). Bottom, SEC-elution profiles for these constructs in complex with αβ-tubulin at 80–100 and 200 mM KCl at the ratios of TOG array subunit:αβ-tubulin described for each condition. Note that the largest Alp14:αβ-tubulin complexes are observed at 100 mM KCl in 1:2 molar ratio for Alp14-monomer, and 2:4 molar ratio for wt-Alp14-dimer constructs. Molar ratios are shown and colored according to each SEC trace. (B, E, H, K) Compositions of SEC fractions shown in each panel above (A, D, G, and J) using SDS-PAGE. Molar ratios for Alp14:αβ-tubulin are shown in the same colors as the traces above. The SDS-PAGE analyses reveal that αβ-tubulin dissociates at 200 mM KCl, forming a second peak due to dissociation at 200 mM KCl. Note that TOG1M fully dissociates from αβ-tubulin at 200 mM, while TOG2M remains mostly bound to αβ-tubulin at 200 mM KCl. Molar ratios of Alp14 to αβ-tubulin were determined using quantitative densitometry at those conditions and reported in Table 1 and Figure 1D. (C, F, I, L) Schematic models, similar to Figure 1F, for Alp14-monomer, wt-Alp14-dimer, TOG1M, and TOG2M in binding αβ-tubulins at 100 mM and 200 mM KCl, revealing the non-equivalent behavior of TOG1 and TOG2 domains in binding and releasing αβ-tubulins in response to different ionic strengths.
Figure 1—figure supplement 2
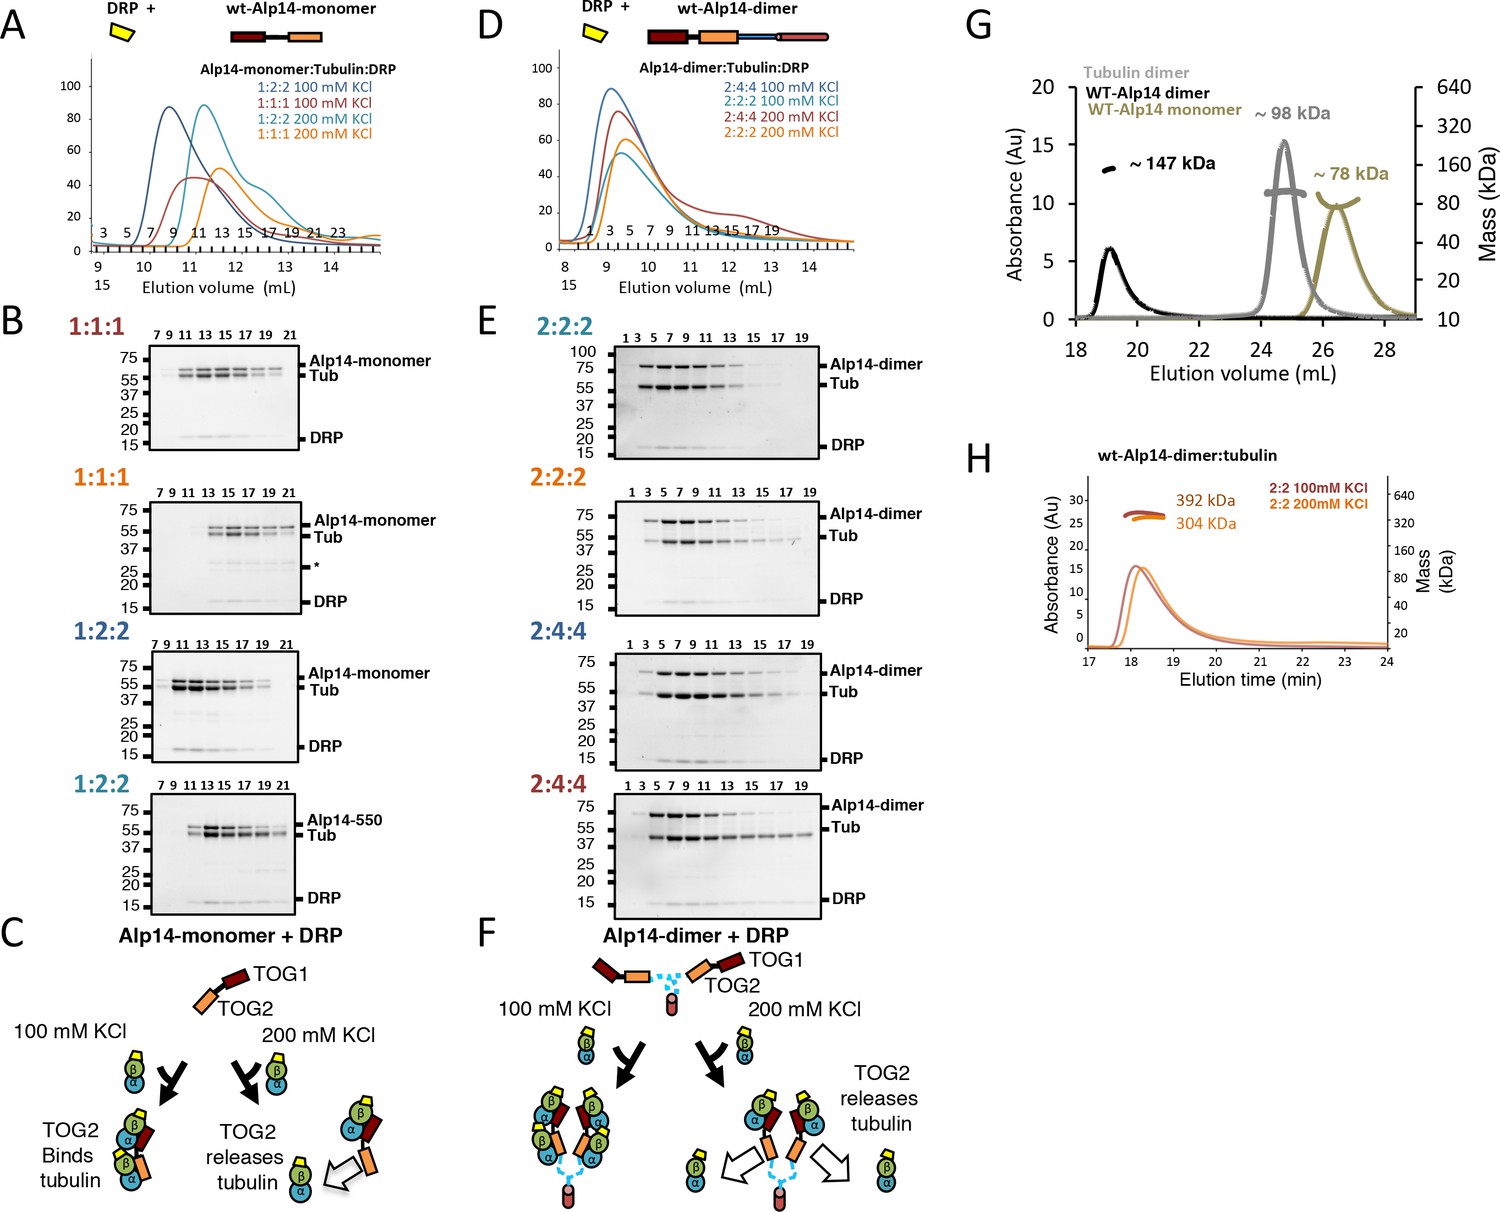
Molar ratios of Alp14 constructs binding to αβ-tubulin binding in the presence of Darpin-D1 (DRP) show no change in stoichiometry, and control SEC-MALS traces.
For each condition, 1 μmol of each Alp14 construct (described in Figure 1) was mixed with defined molar amount of soluble αβ-tubulin (1–2 μmol moles per Alp14 subunit) and Darpin-D1 (DRP). (A, D) Top shows models for DRP (yellow) binding to Alp14 constructs: (A) Alp14-monomer (1-510) and (D) wt-Alp14-dimer (residues 1–690). Bottom, SEC elution profiles for Alp14 constructs in complex with αβ-tubulin at 80–100 and 200 mM KCl at two molar ratios described for each condition. Molar ratios are shown and colored according to each SEC trace. Colors for each of the traces match the ratios reported at the top left of each SDS-PAGE panel described below. Note that αβ-tubulin dissociates into a second peak in the 200 mM KCl condition, similar to conditions without DRP described in Figure 1—figure supplement 1 (Figure 1—figure supplement 1). (B, E) SDS-PAGE of the four SEC traces shown in A and D, respectively: Alp14 monomer:αβ-tubulin (B) and Alp14-dimer:αβ-tubulin complexes (E). Top left corner shows the molar ratio in the same color as the trace above. Note that DRP binds αβ-tubulins in each Alp14:αβ-tubulin complex, and that its stoichiometry matches αβ-tubulin. Note the dissociation of αβ-tubulin-DRP from Alp14 constructs, which forms a second peak at 200 mM KCl. (C, F) Schematic models for Alp14-monomer and Alp14-dimer in binding αβ-tubulins at 80–100 mM and 200 mM KCl, revealing the non-equivalent behavior of TOG1 and TOG2 domains in releasing αβ-tubulins. DRP can access each β-tubulin interface, suggesting that TOG arrays maintain αβ-tubulins in a non-polymerized state upon binding. To find the effect of DRP binding to Alp14: β-tubulin complex, we determined the molar ratios for two Alp14 constructs binding to αβ-tubulins at 100 and 200 mM KCl conditions in the presence of DRP by quantitative-SEC using panels B and F. The values for molar ratios are reported in Figure 1D and Table 1, revealing molar ratios of αβ-tubulin bound to two Alp14 constructs were not influenced by DRP binding to αβ-tubulin. This finding suggests that αβ-tubulin binds to TOG arrays in a dimeric and non-polymerized state initially. (G) SEC-MALS traces for isolated Alp14-monomer, αβ-tubulin, and wt-Alp14-dimer revealing their masses at 200 mM KCl. These data are summarized in Table 2. Alp14-monomer is indeed monomeric, while wt-Alp14-dimer is homodimeric and αβ-tubulin is a heterodimer. SEC-MALS measured masses are reported in Table 2. (H) SEC-MALS traces for Alp14-dimer binding to αβ-tubulin at a 2:2 molar ratio with 100 mM KCl or 200 mM KCl, respectively. These data are summarized in Table 2.
Figure 1—figure supplement 3
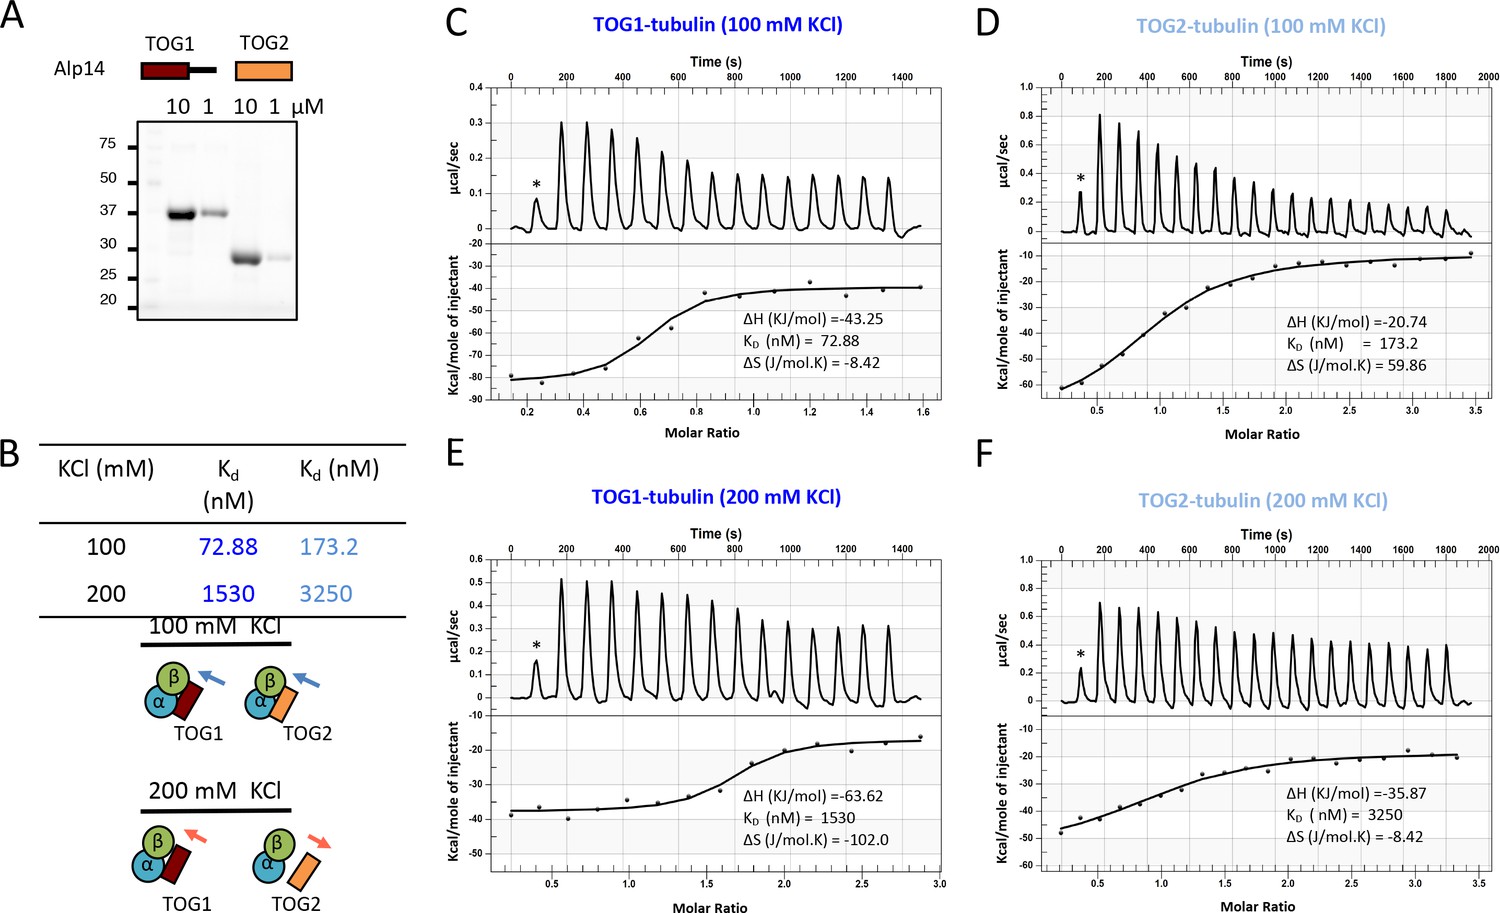
Isothermal titration calorimetry (ITC) reveals Alp14-TOG1 and TOG2 αβ-tubulin-binding affinities.
(A) Top and bottom panels: scheme for recombinant TOG1 and TOG2 domains studied and SDS-PAGE of purified 10 and 1 μM TOG1 and TOG2 domains, respectively. (B) Summary of measured αβ-tubulin binding affinities at 100 and 200 mM KCl. (C, E) ITC traces for TOG1 (blue) binding to αβ-tubulin showing enthalpy and entropy measured at 100 and 200 mM KCl. (D, F) Isothermal titration calorimetry traces for TOG2 (cyan) binding to αβ-tubulin showing enthalpy and entropy measured at 100 and 200 mM KCl.
Figure 2 with 2 supplements
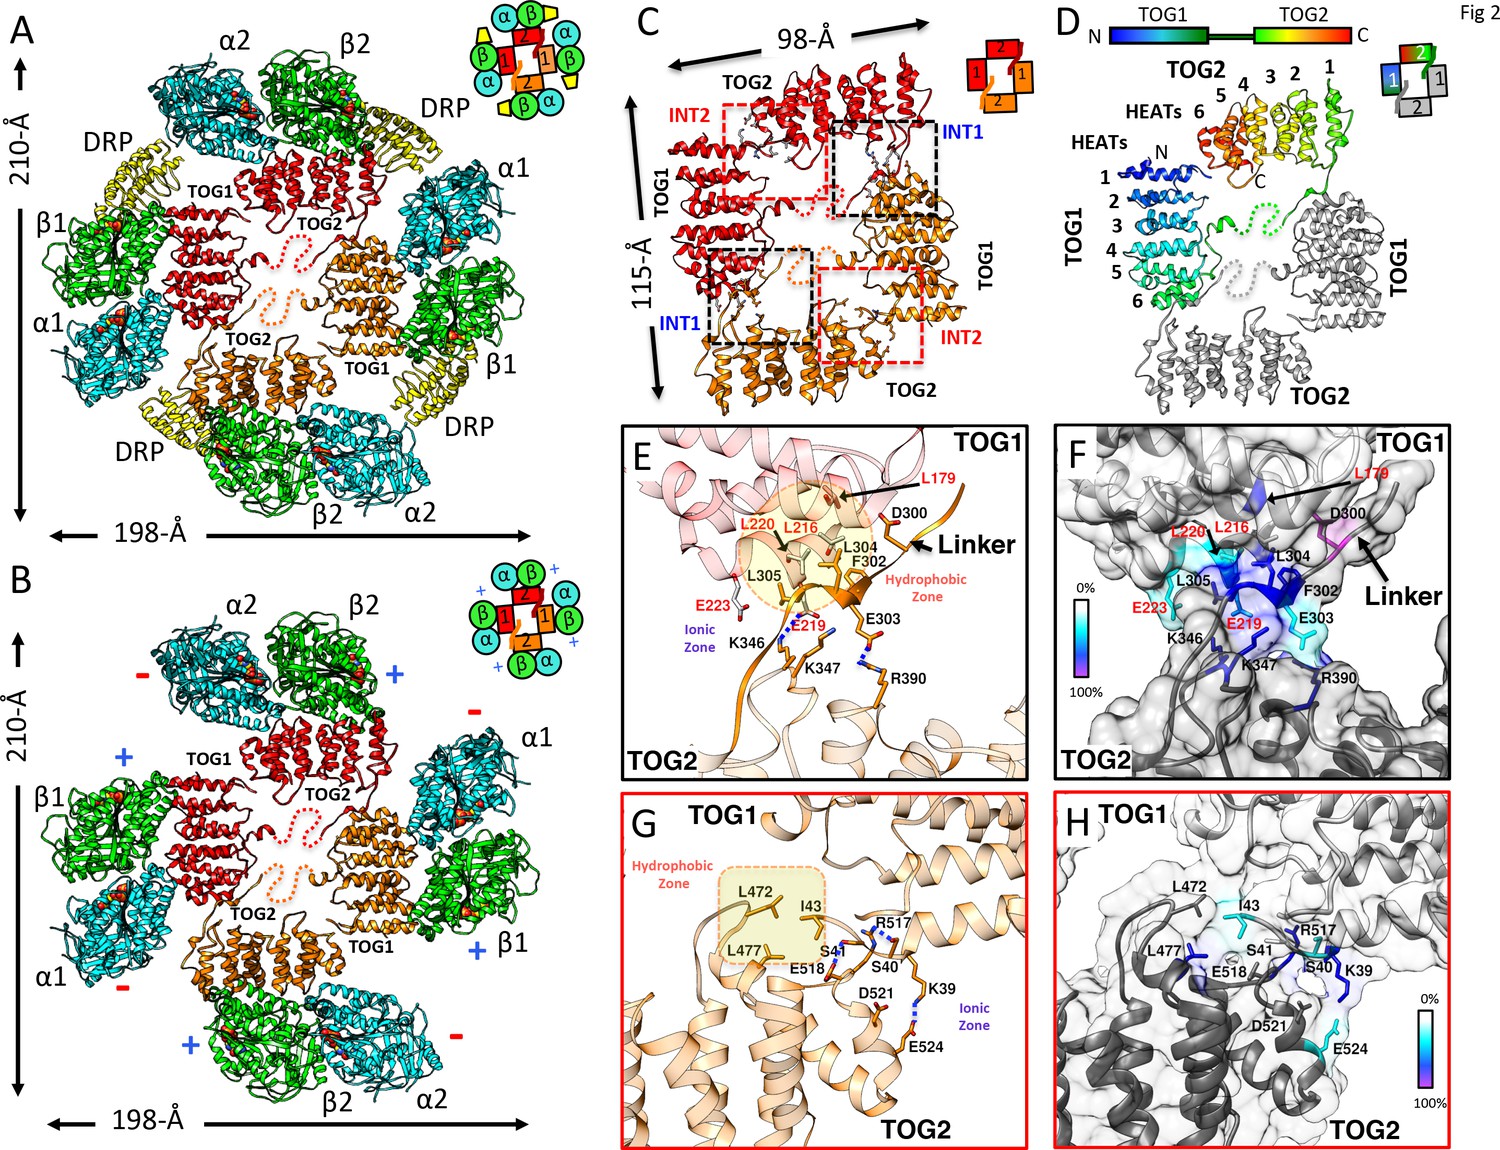
X-ray structures reveal αβ-tubulins bound in a wheel-like organization around a pseudo-dimeric TOG square complex.
(A–B) 3.6 Å X-ray crystal structure of the S. kluyveri 1:2:2 sk-Alp14:αβ-tubulin:DRP reveals pseudo-dimeric head-to-tail subunits (red and orange) in a TOG square assembly consisting of four TOG domains bound to four αβ-tubulins (α-tubulin shown in cyan and β-tubulin shown in green) in a wheel-like organization. (A) Structure with DRP (yellow) bound to each αβ-tubulin. (B) Structure with DRP computationally removed. Each αβ-tubulin (α1β1) is positioned 90° rotated from its polymer-forming interface on its neighboring αβ-tubulin (α2β2). (C) Pseudo-dimeric TOG1-TOG2 subunits, shown in orange and red, respectively, form a head-to-tail TOG square (inset). Interface 1 is formed by the N-terminus of TOG2 and the TOG1-TOG2 linker binding to the C-terminus of the TOG1 domain of a second subunit, forming a 90° corner. Interface 2 is formed by the N-terminus of TOG1 binding the C-terminus of TOG2 within the same subunit in a 90° corner (Figure 2—figure supplement 1I). (D) Rainbow view of TOG1-TOG2 with N- and C-termini displayed in a blue-to-red color gradient, while the other subunit is displayed in grey. Each TOG is composed of six HEAT repeats (numbered). (E) Close-up view of interface 1. A hydrophobic zone stabilizes interface1 (yellow and highlighted by red outline) involving Leu220 (L220) and Leu217 (L217) of the TOG1 inter-HEAT 5–6 loop, Leu179 (L179) of the HEAT 6 A-helix in TOG1 (red ribbon) stabilized by linker residues (solid orange) Phe302 (F302), Leu304 (L304), and Leu305 (L305). An ionic zone guides interface 1 involving Glu219 (E219) of TOG1 inter-HEAT 5–6 loop and Glu305 (E305) of the TOG1-TOG2 linker, forming salt bridges with Lys346 (K346) and Lys347 (K347) of the TOG2 (light orange) inter-HEAT 1–2 loop and Arg390 (R390) of the TOG2 HEAT 2,3 loop, respectively. (F) Close-up view of interface 1, as in C, displaying residue conservation based on the alignment shown in Figure 2—figure supplement 2. (G) Close-up view of interface 2. A hydrophobic zone stabilizes interface 1 involving Leu477 (L477) and Leu472 (L472) of the TOG2 inter-HEAT4-5 loop with Ile43 of the TOG1 inter-HEAT1-2 loop. Ionic zone selectively guides interface 2, involving Lys39 (K39) and Ser41 (S41) of the TOG1 inter-HEAT1-2 loop and helix 1B with Arg517 (R517), Glu518 (E518), Asp521 (D521), and Glu524 (E524) of the TOG2 inter-HEAT5-6 loop and A-helix. (H) Close-up view of interface 2, as in D, displaying reside conservation based on the alignment in Figure 2—figure supplement 2.
Figure 2—figure supplement 1
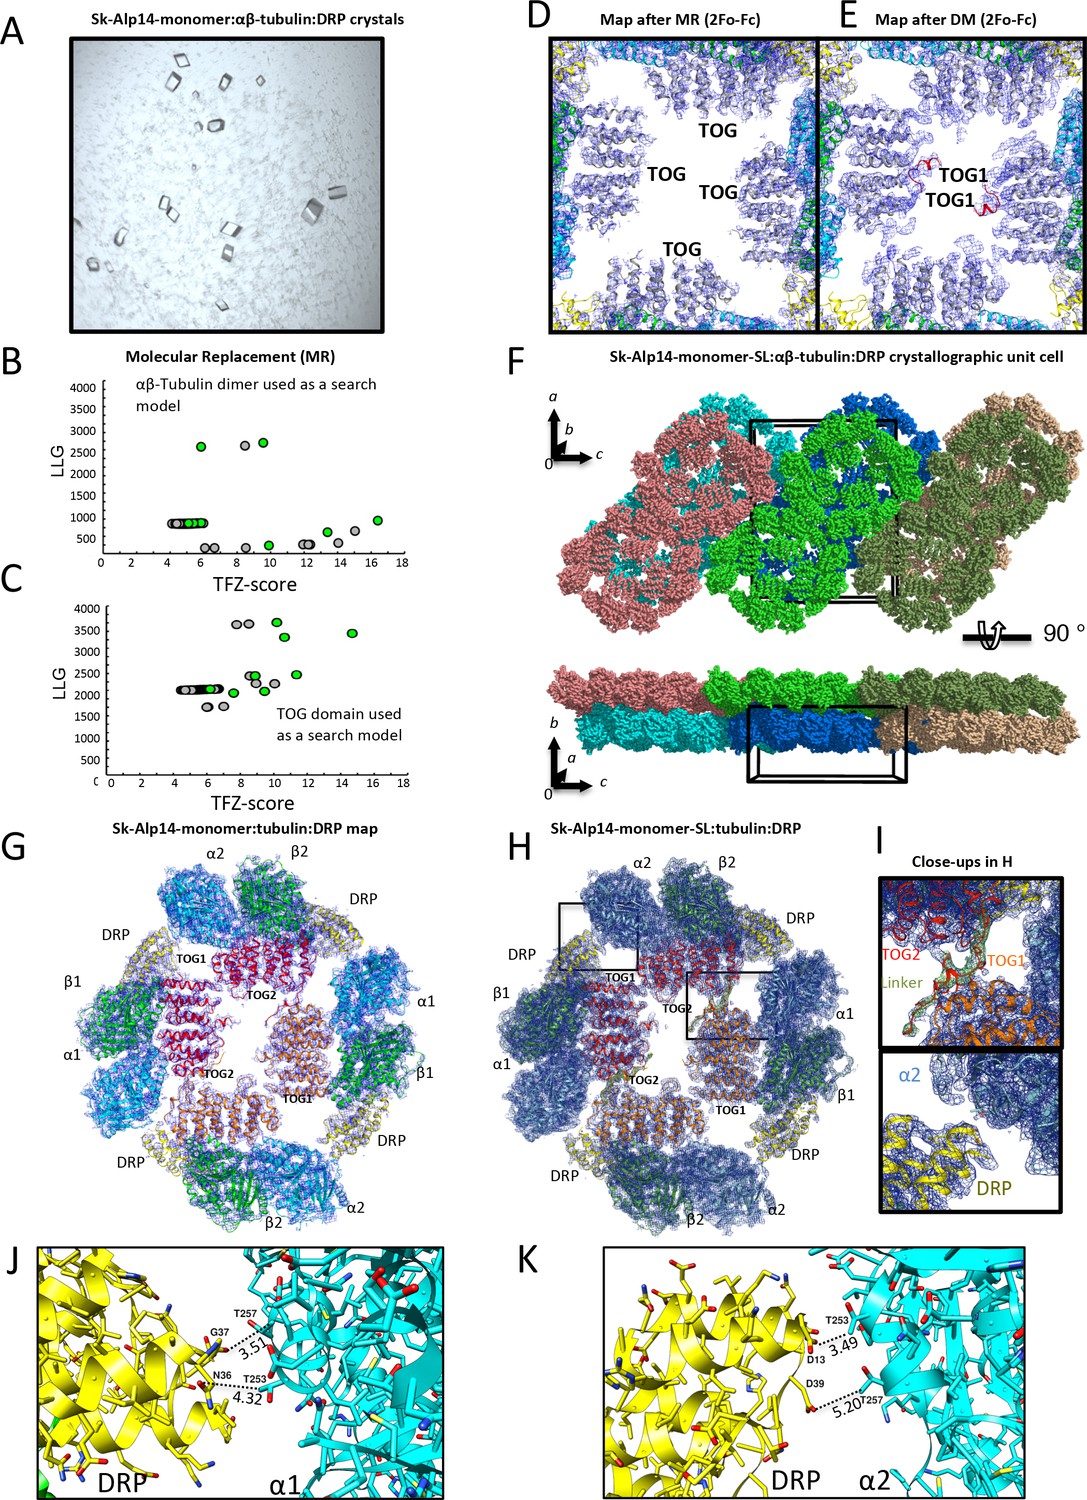
X-ray crystallography and structure determination of 2:4:4 Alp14-monomer:αβ-tubulin:DRP complexes.
(A) Images of square crystals of 1:2:2 sk-Alp14-monomer:αβ-tubulin:DRP assemblies. (B) Molecular replacement search results for αβ-tubulin placement in the asymmetric unit. Note the distinct solution that leads to initial positioning. (C) Molecular replacement search results for the TOG domain in the asymmetric unit. (D) Initial density map of electron density for the TOG square assembly after the placement of TOG domains based on initial molecular replacement. Note the presence of only the essential features of both TOG domains. (E) Density map of the TOG square assembly after one cycle of density modification. Note the appearance of density of the linker and associating interfaces. Density maps reveal TOG1 based on its C-terminal extension and jutting C-terminal α-helix. (F) Top view along b axis of the crystallographic unit cell revealing the packing arrangement of two 2:4:4 sk-Alp14-monomer:αβ-tubulin:DRP wheel-shaped complexes in the asymmetric unit, shown in multiple colors. Bottom, a 90° rotation of the view in F, revealing the unit cell packing showing 2D sheets of wheel-shaped complexes. (G) 4.4 Å resolution 2Fo-Fc electron density contoured at 1σ of the native 2:4:4 sk-Alp14-monomer:αβ-tubulin:DRP structure. (H) 3.6 Å resolution 2Fo-Fc electron density contoured at 1 σ of the 2:4:4 sk-Alp14-SL:αβ-tubulin:DRP structure. Both G and H show the organization of the assembly and the modeled subunits. (I) Detailed close-up views of the electron-density map in H. Top, view of TOG1 (orange)-TOG2 (red) in interface 1. The linker sequence is depicted as red with green density (difference Fourier map). Bottom, detailed view of DRP (yellow) in proximity to the α-tubulin of a neighboring TOG-bound αβ-tubulin (blue). Note the lack of interactions between DRP and α-tubulin. (J) View of DRP proximity to the α-tubulin of the neighboring tubulin dimer. Note that the distances of residues are beyond 3.5 Å in most cases, showing no pattern of direct interactions. (K) View of second DRP of a non-crystallographic symmetry mate in the same orientation as shown in I.
Figure 2—figure supplement 2
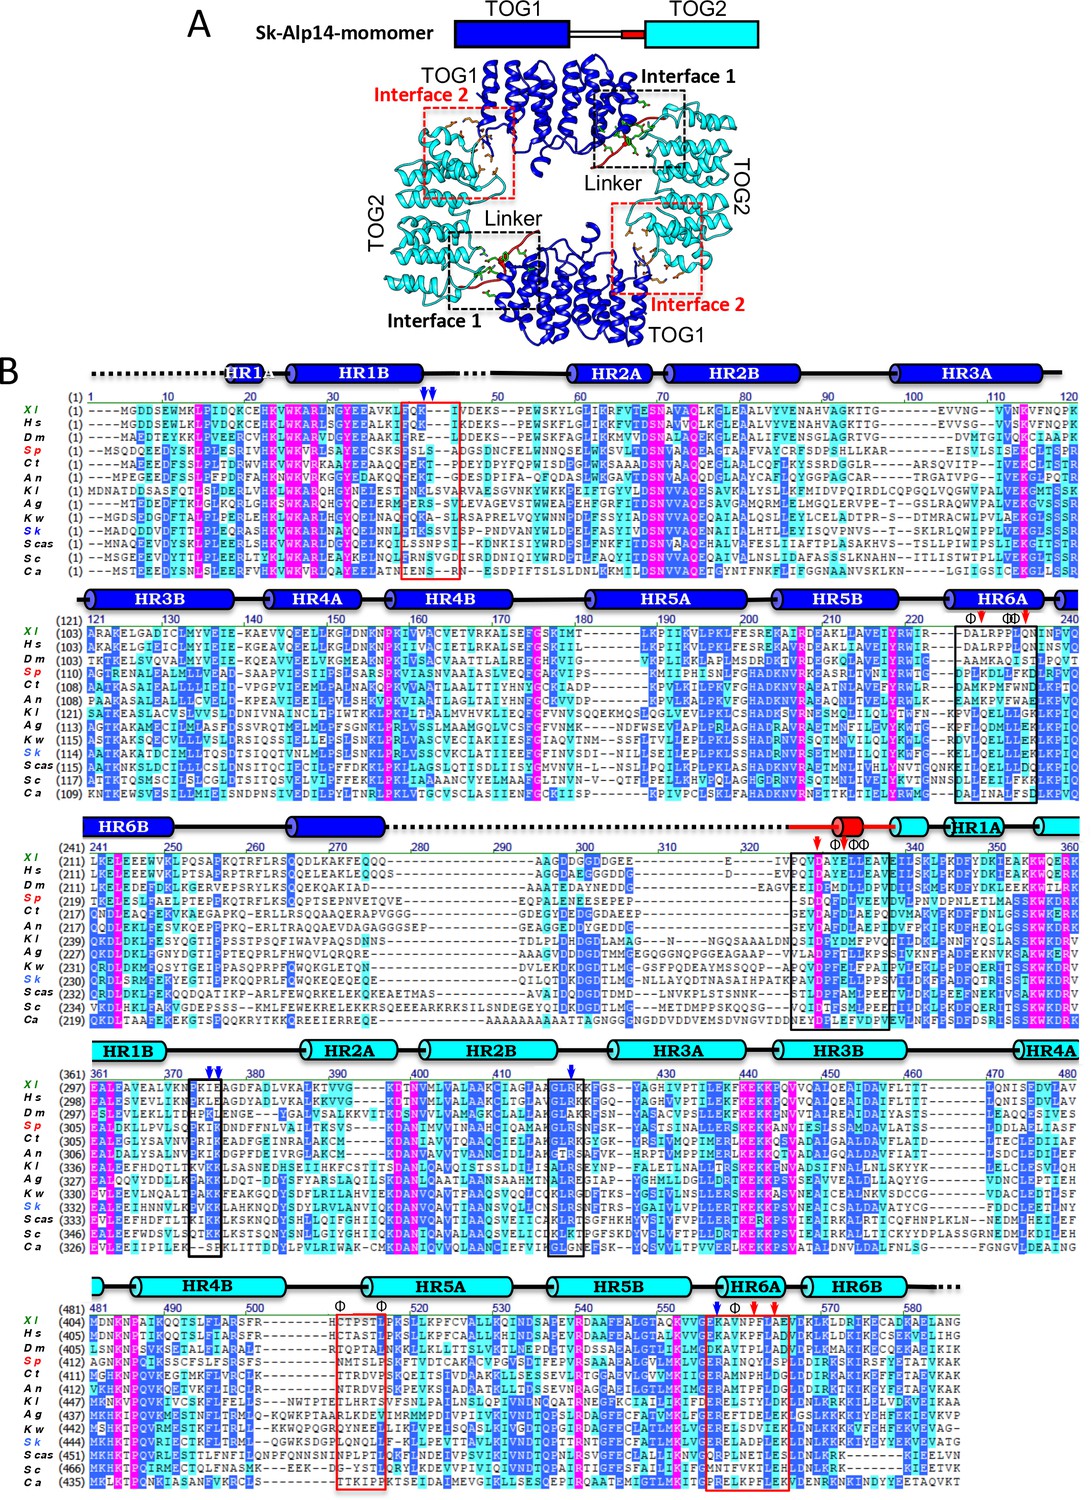
Sequence conservation in TOG square interfaces across each TOG1 and TOG2 domain.
(A) Top scheme for Alp14, TOG1, TOG2, and linker sequence. Bottom, structure of TOG square with two TOG1 (blue) and two TOG2 (cyan) domains forming interfaces via inter-HEAT repeat elements with the TOG1-TOG2 linker sequence (red). (B) Sequence alignment of TOG1-TOG2 across multiple species with the invariant residues shown in purple, highly conserved residues in blue, weakly conserved residues in cyan, and non-conserved residues in black. The secondary structures (Cylinders, α-helices; lines, random coil; and dashed lines, disordered segments) are described above the sequences. Interfaces 1 and 2 are highlighted in black and red boxes, respectively. XI, Xenopus laveis (marked green); Hs, Homo sapiens; Dm, Drosophila melanogaster; Sp, S. pombe (marked red); Ct, Chaetomium thermophilum; An, Aspergillus nidulans; KI, Kluyveromyces lactis; Ag, Ashbya gossypii; Kw, Kluyveromyces waltii; Sk, Saccharomyces kluyveri (marked blue); Scas, Shorea crassa; Sc, S. cerevisiae; Ca, Candida albicans.
Figure 3 with 1 supplement
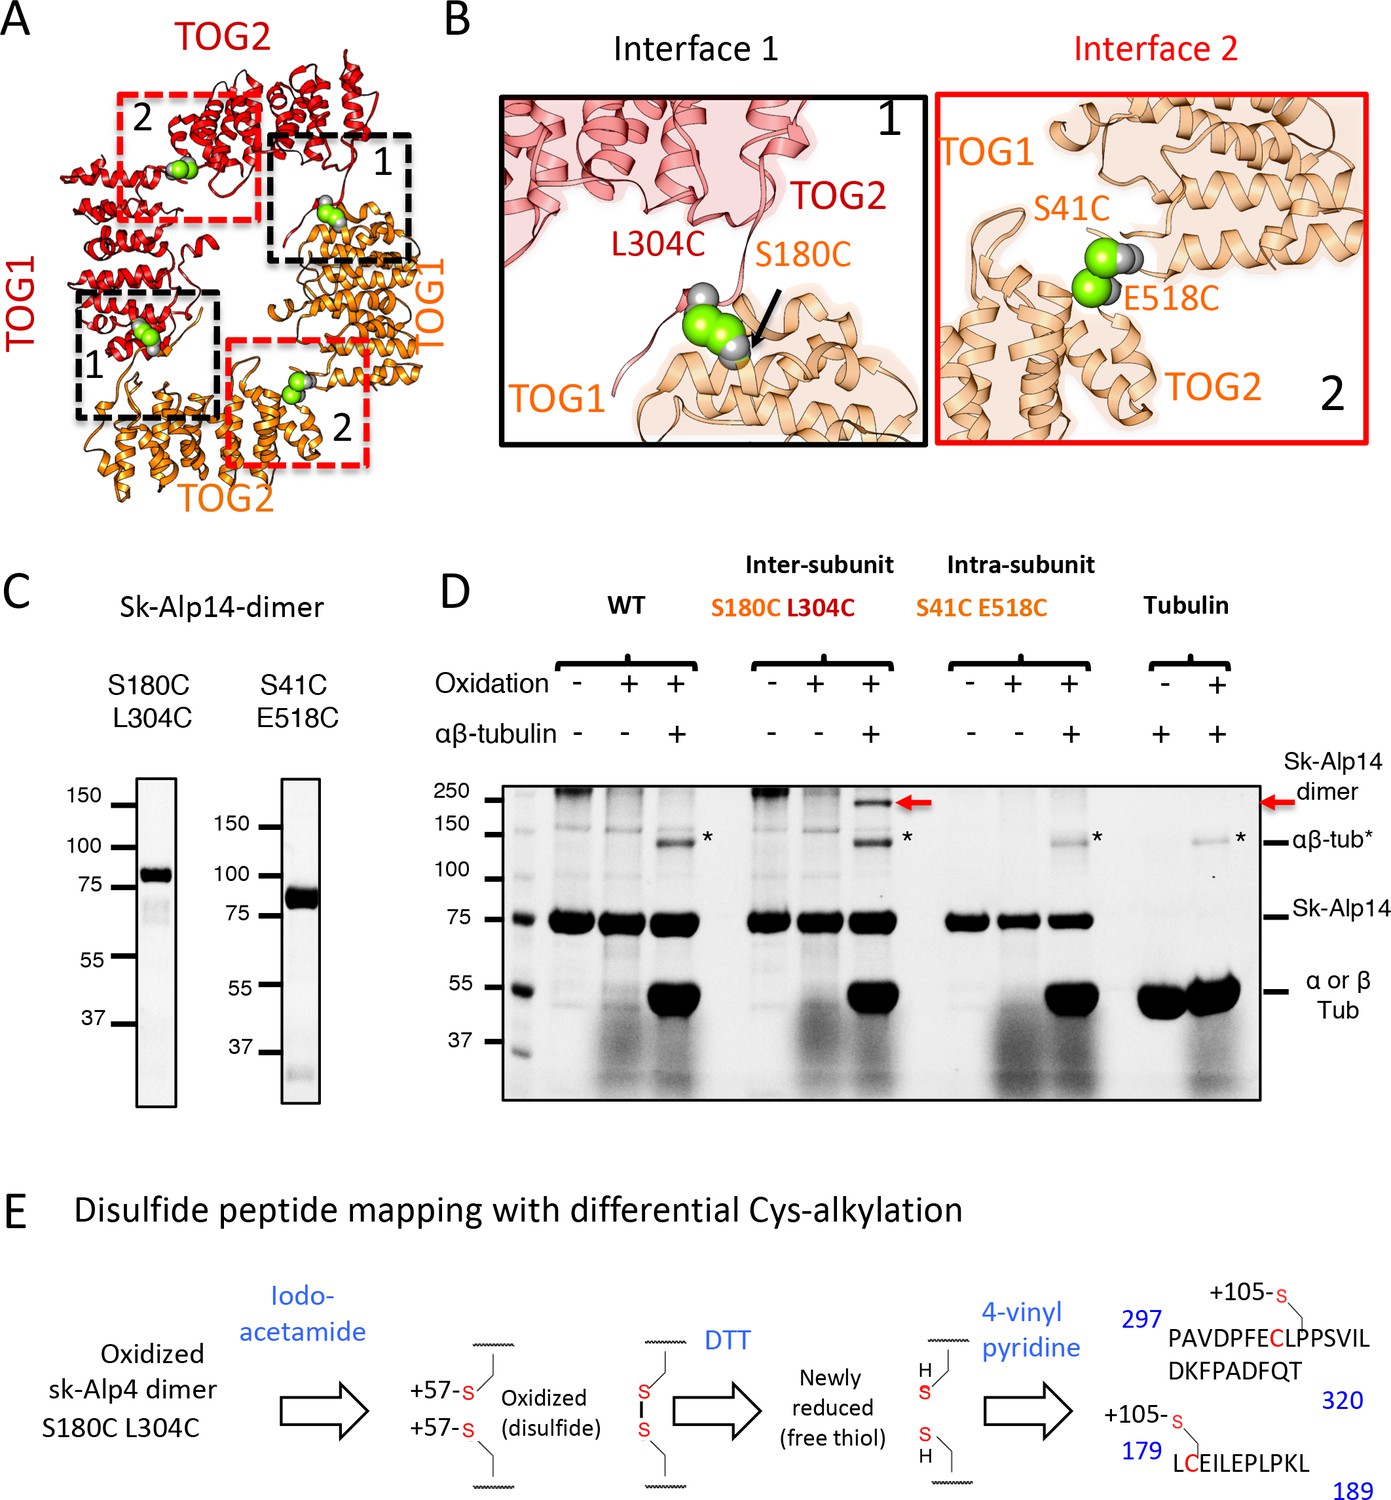
Cysteine mutagenesis/crosslinking and mass spectrometry-based peptide-mapping reveal that dimeric sk-Alp14 forms TOG square conformations in solution.
(A) TOG square structure showing two cysteine pairs (green space fill) mutated in interfaces 1 (black-dashed lines) and 2 (red-dashed lines). (B) Close-up views of interfaces 1 (left) and 2 (right) showing the S180C-L304C and E518C-S41C residue pairs, respectively (green space fill), in sk-Alp14. (C) SDS-PAGE of SEC-purified sk-Alp14 S180C-L304C and E518C-S41C. (D) Crosslinking studies of cysteine structural-based mutants using oxidizing conditions and αβ-tubulin binding, as denoted by (+) and (–). The αβ-tubulins form an intermediate in oxidizing conditions observed in all conditions that include αβ-tubulin (marked ‘*’). S180C-L304C sk-Alp14 forms a dimeric 170 kDa intermediate upon oxidization and αβ-tubulin binding (red arrow). In contrast, wt-Alp14 or sk-Alp14 E518C-S41C do not form this intermediate. (E) Disulfide peptide mapping of cysteines in sk-Alp14 S180C-L304C using differential alkylation and LC/MS-MS. We used mass spectrometry (LC/MS-MS) after a differential alkylation strategy (Figure 3—figure supplement 1D) to map peptides with disulfides. Briefly, oxidized sk-Alp14 S180C-L304C (170 kDa) SDS-PAGE-purified bands were subjected to proteolysis and treated with iodoacetamide. Under these conditions, 57 Da in mass is added to peptides with reduced cysteines (free thiols), without affecting disulfides. Dithiothreitol was then used to reduce peptides with disulfides, which were then treated with 4-vinyl pyridine, which added 105 Da in mass to peptides with newly formed free thiols. Using LC/MS-MS, peptides with modified cysteines were identified based on added mass. Details provided in Figure 3—figure supplement 1D.
Figure 3—figure supplement 1

Yeast dimeric TOG arrays form a TOG square assembly in solution as measured by cysteine crosslinking and mass spectrometry.
(A) Mass-spectrometry-based strategy for disulfide peptide mapping for the sk-Alp14 S180C L304C mutant reveals that sequences of peptides in interface 1 form crosslinked disulfides, confirming that the conformation of interface 1 is observed in solution. Top, chemical modification strategy for differential alkylation to modify cysteines and detect disulfides. (B) LC/MS-MS traces for two peptides showing the mass units identifying these peptides with cysteines modified by alkylation with a mass of 105 Da.
Figure 4 with 2 supplements
Inactivation of interfaces 1 and 2 destabilizes TOG square organization without affecting αβ-tubulin binding.
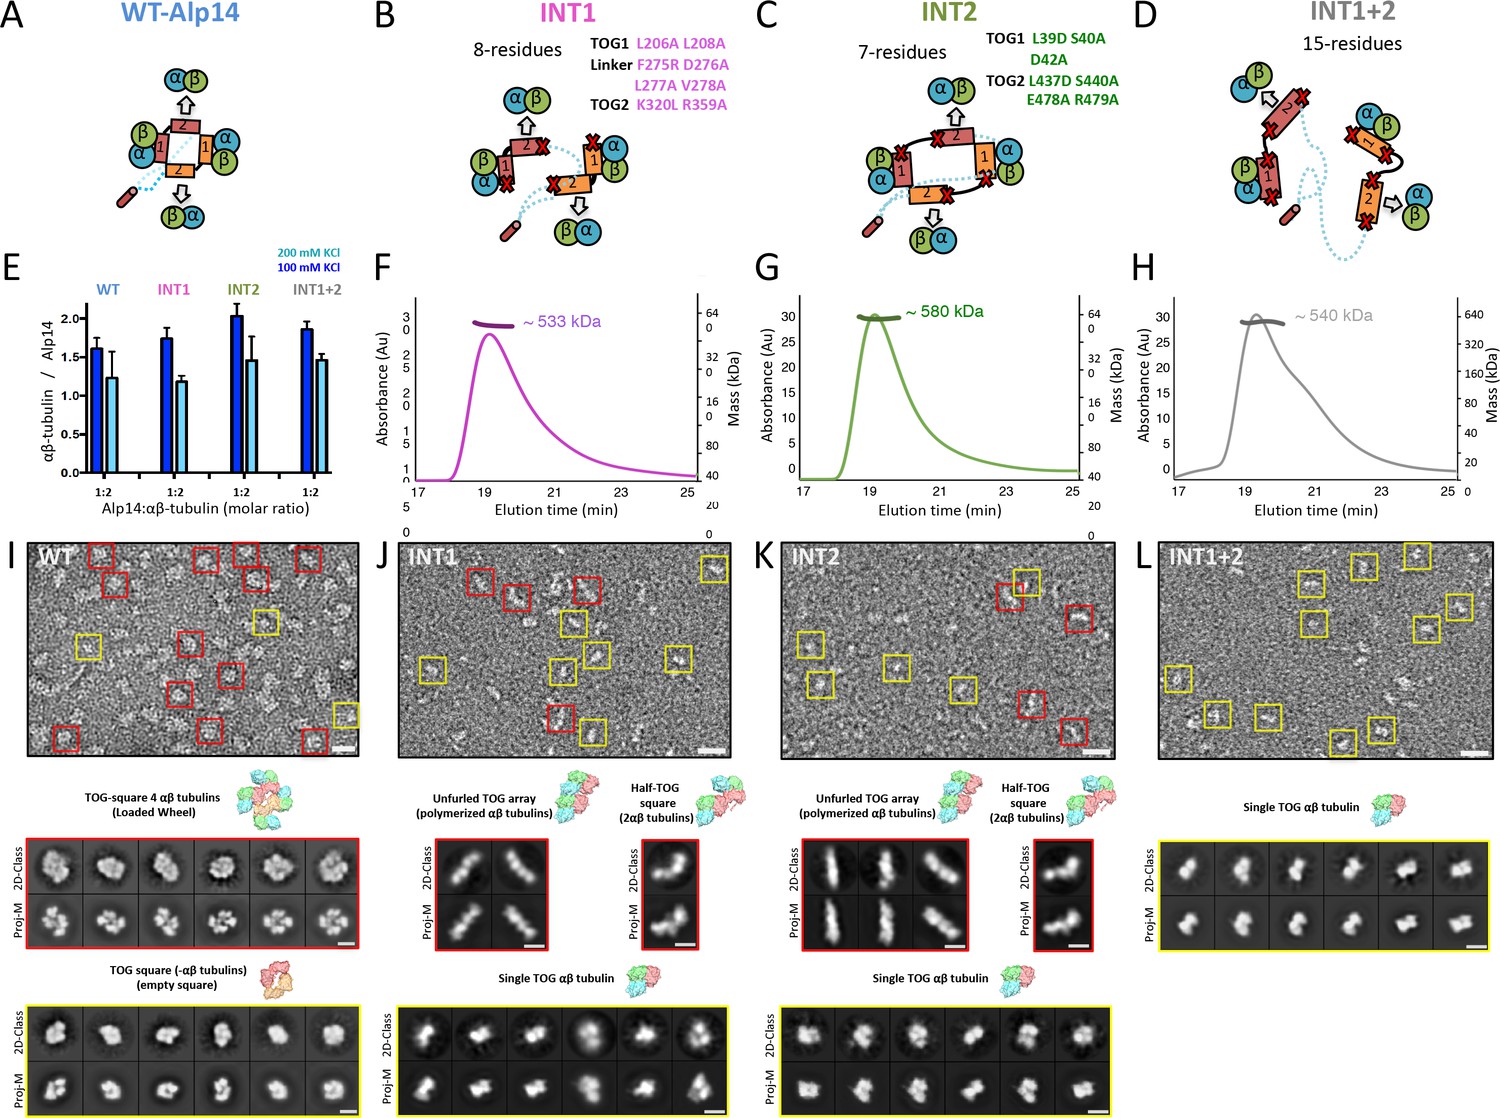
(A–D) Generation of structure-based TOG square assembly-defective mutants using wt-Alp14-dimer (A) through inactivation of interface 1 in the INT1 mutant (B: INT1, pink; eight mutant residues), interface 2 in the INT2 mutant (C: INT2, green; seven mutant residues), or both interfaces 1 and 2 in the INT1 +2 mutant (D: INT1 +2, grey; 15 mutant residues). (E) Summary of SEC-measured αβ-tubulin-binding molar ratios of INT1, INT2, and INT1 +2 compared to wt-Alp14-dimer as described for Figure 1D suggests no defects in αβ-tubulin binding at 100 mM KCl (blue) and a similar decrease in αβ-tubulin binding upon 200 mM KCl ionic strength increase (cyan). Additional information is described in Figure 4—figure supplement 1. (F–H) SEC-MALS of INT1:αβ-tubulin (F), INT2:αβ-tubulin (G), and INT1 +2: αβ-tubulin (H) complexes at 2:4 stoichiometry at 100 mM KCl (masses reported in Table 1). SEC-MALS reveals similar mass to wt-Alp14-dimer complexes with αβ-tubulin which are reported Table 2. (I) Top, raw negative stain EM image of wt-Alp14-dimer:αβ-tubulin at 100 mM KCl reveals wheel-shaped assemblies that are 15–19 nm in diameter as previously described for Stu2-αβ-tubulin complexes (Al-Bassam et al., 2006). Middle panel, 2D-classes reveal 19 nm wheel-shaped particles that match the 2D-projection of 30 Å resolution-filtered 2:4 TOG-square:αβ-tubulin complex (shown above the panel). These classes match the organization observed in the structure described in Figure 2. Bottom panel, second group of 2D-classes reveal small diamond-shaped particles that match the 2D-projection of a 30 Å resolution-filtered model of the TOG square without αβ-tubulins (shown above the panel). (J) raw image of INT1:αβ-tubulin reveals elongated conformations with either bent-conformations composed of bent-particles with two 8 nm densities at 90-degree angles or 16 nm filament-like particles. Middle panel, 2D-classes reveal 16 nm elongated classes that match the 2D-projection of either 30 Å resolution-filtered TOG1-TOG2 bound to two polymerized tubulins (shown above the second row) as described structurally in the next section. Left panel, 90-degree bend class averages that match 2D-projections of a resolution-filtered model of one TOG1-TOG2 subunit of the TOG square bound to two tubulins at 90 degrees (as shown above). Bottom panel, 2D-classes reveal 8 nm lengths, which match 2D-projections of low-resolution-filtered TOG-αβ-tubulin complexes (PDB ID: 4FFB shown above the panel). (K) INT2 forms extended necklace shaped or extended 16 nm minifilaments. Middle panel, 2D-class averages reveal either 16 nm filament-like particles match 2D-projections of TOG1-TOG2 bound to two polymerized αβ-tubulins (left) or bent particles that match 2D-projections of a bend TOG1-TOG2 subunit bound to two non-polymerized αβ-tubulins, as observed in half a TOG square complex (right). (L) INT1 +2:αβ-tubulin complexes form only dissociated assemblies with randomly interconnected 8 nm assemblies. Bottom panel, 2D-classes reveal 8 nm lengths, which match 2D-projections of low-resolution-filtered TOG-αβ-tubulin complexes (PDB ID:4FFB shown above the panel). Additional information can be found in Figure 4—figure supplement 1.
Figure 4—figure supplement 1
Inactivating interfaces 1 and 2 destabilizes the TOG square organization but does not influence αβ-tubulin-binding activity.
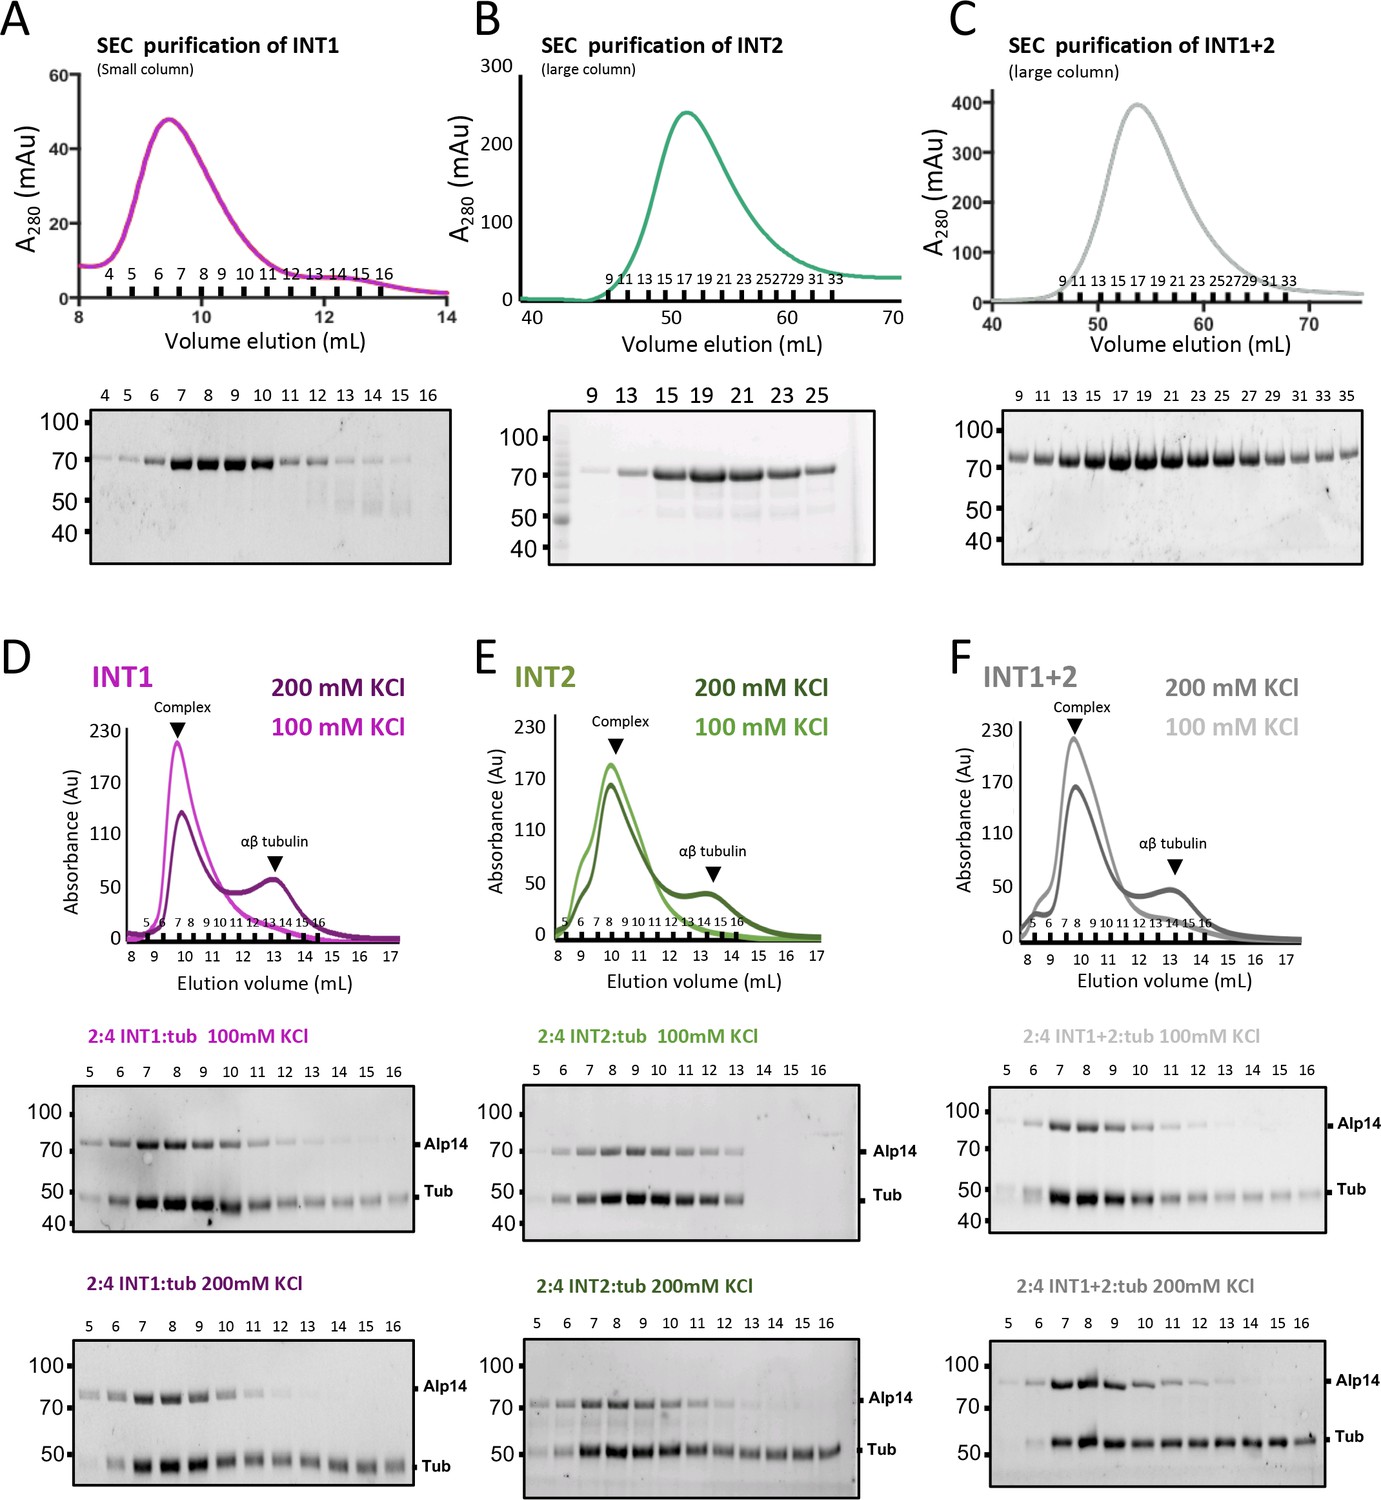
(A) Purification of INT1 mutant. Top, SEC-elution profile and trace for INT1 showing that it behaves homogenously similarly to wt-Alp14-dimer. Bottom panel show SDS-PAGE for SEC purified fractions. (B) Purification of INT2 mutant. Top, SEC-elution profile and trace for INT2 showing that it behaves homogenously similarly to wt-Alp14-dimer. Bottom panel shows SDS-PAGE of SEC purified fractions. (C) Purification of INT1 +2 mutant. Top, SEC-elution profile and trace for INT1 +2 showing that it behaves homogenously similarly to wt-Alp14-dimer. Bottom panel shows SDS-PAGE of SEC purified fractions. (D) SEC traces for INT1:αβ-tubulin complexes at 100 (light pink) and 200 mM KCl (dark pink) at 2:4 molar ratio showing that inactivating the TOG square assembly has little effect on αβ-tubulin binding. Note that roughly half the αβ-tubulin dissociates at 200 mM KCl due to rapid exchange by TOG2. SDS-PAGE for fractions are shown below. (E) SEC traces for INT2:αβ-tubulin complexes at 100 (light green) and 200 mM KCl (dark green) at 2:4 molar ratio showing that inactivating the TOG square assembly has little effect on αβ-tubulin binding. Note that roughly half the αβ-tubulin dissociates at 200 mM KCl due to rapid exchange by TOG2. SDS-PAGE for fractions are shown below. (F) SEC traces for INT1 +2:αβ-tubulin complexes at 100 (light grey) and 200 mM KCl (dark grey) at 2:4 molar ratio showing that inactivating the TOG square assembly has little effect on αβ-tubulin binding. Note that roughly half the αβ-tubulin dissociates at 200 mM KCl due to rapid exchange by TOG2. SDS-PAGE for fractions are shown below.
Figure 4—figure supplement 2
Negative stain EM micrographs and class averages for the TOG square and its inactivated assemblies.
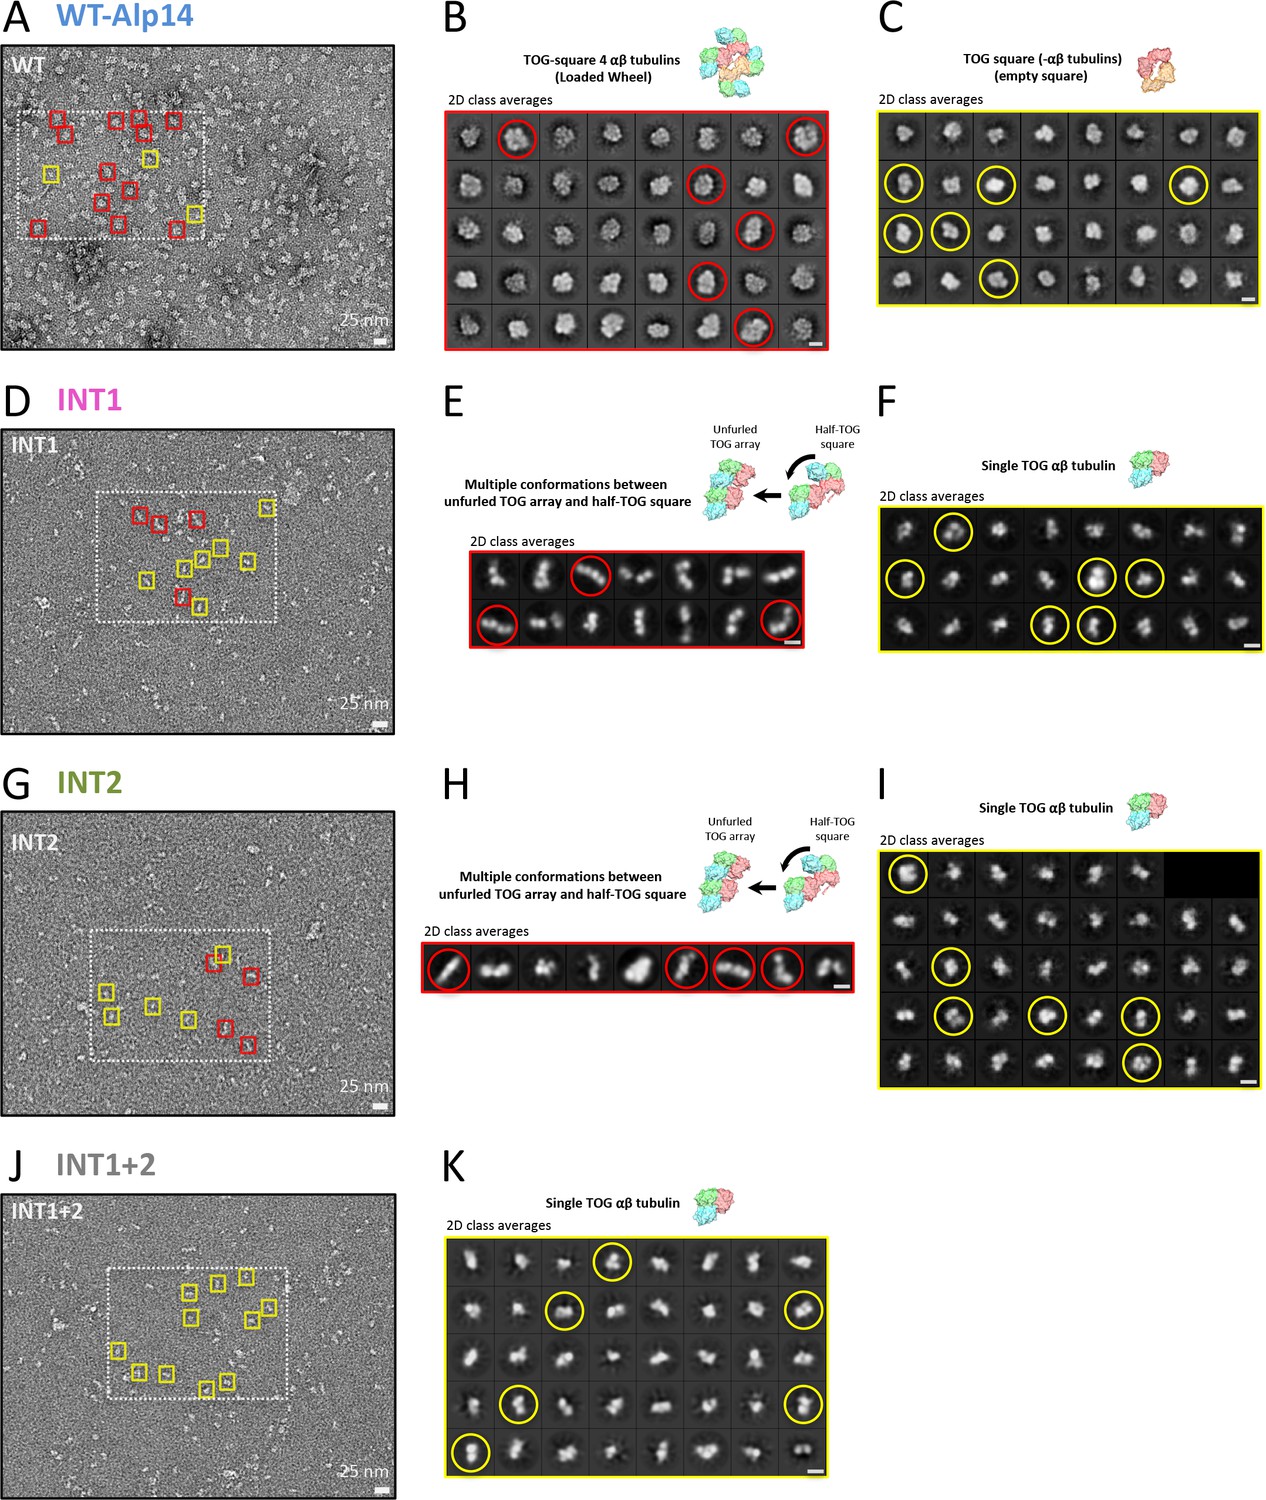
(A), (D), (G), and (J) Raw negative stain EM micrographs of WT-Alp14-dimer:αβ-tubulin, INT1, INT2, and INT1 +2, respectively. Note that the highlighted rectangle regions are shown in Figure 1. Boxes (yellow and red) indicate representative examples of wheel-shaped, TOG-square, unfurled TOG-array, and single TOG: αβ-tubulin assemblies, respectively. (B) and (C) Class averages of negatively stained WT-Alp14-dimer:αβ-tubulin complex as calculated by CryoSparc, confirming that wheel-shaped (red circle) and TOG square (yellow circle) assemblies exist in solution. (E) and (F) Class averages of negatively stained INT1:αβ-tubulin complex as calculated by CryoSparc, revealing multiple conformations of INT1:αβ-tubulin complex (Unfurled TOG array or half-TOG square, red circle; single TOG:αβ-tubulin, yellow circle). (H) and (I) Class averages of negatively stained INT2:αβ-tubulin complex as calculated by CryoSparc, revealing multiple conformations of INT2:αβ-tubulin complex (Unfurled TOG array or half-TOG square, red circle; single TOG:αβ-tubulin, yellow circle). (K) Class averages of negatively stained INT1 +2:αβ-tubulin complex as calculated by CryoSparc. This finding shows only single TOG:αβ-tubulin conformations (yellow circle), suggesting that interfaces 1 and 2 are required for higher order assemblies. Bars shown at the lower right hand corner for panels A, D, G, and J are 25 nm; while bars for panels B, C, E, F, H, I, and K are 10 nm.
Figure 5 with 2 supplements
X-ray structure of 1:2:1 TOG-array:αβ-tubulin:DRPΔN reveals unfurled TOG1-TOG2 array bound to two polymerized αβ-tubulins.
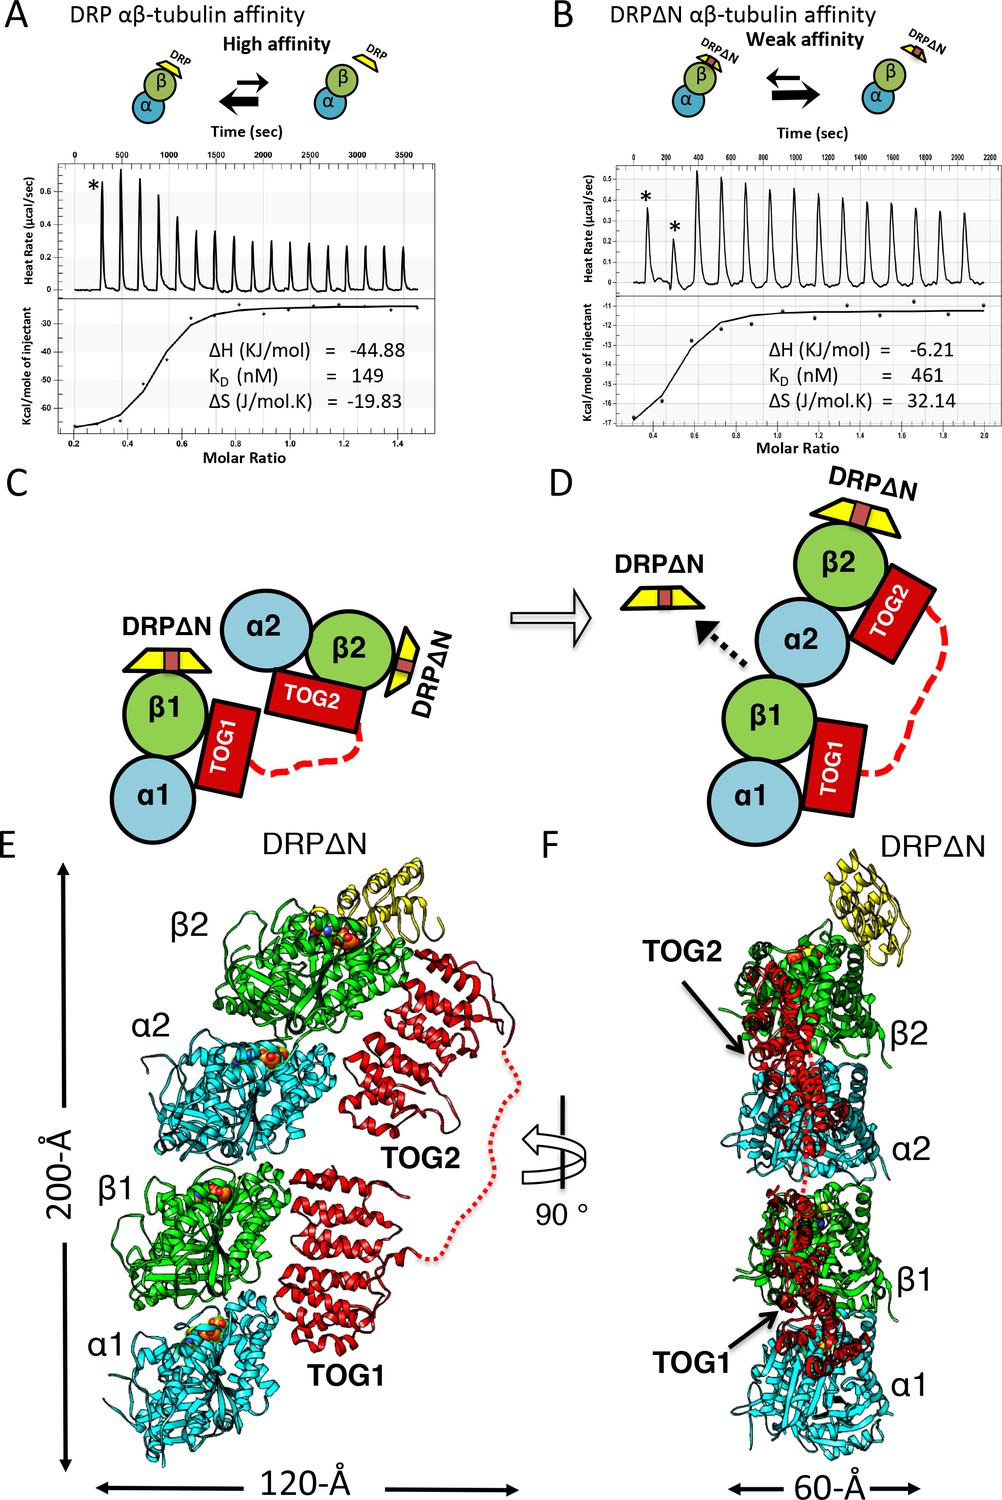
(A, B) Top, schemes of DRP and DRPΔN binding to αβ-tubulin. DRP shifts the equilibrium toward dissociation from αβ-tubulin. Bottom, isothermal titration calorimetery studies reveal a three-fold decrease in affinity of DRPΔN binding to αβ-tubulin (461 nM) compared to DRP (149 nM). (C, D) Two schematic views of the TOG1-TOG2 αβ-tubulin complex transition from the TOG square (only half is shown) to the unfurled conformation upon DRPΔN dissociation. (E, F) Two orthogonal views of the 3.2 Å X-ray structure of 1:2:1 sk-Alp14 (red):αβ-tubulins (cyan and green):DRPΔN (yellow) complex, indicating a polymerized protofilament state. TOG2 and TOG1 are bound to the upper (α2β2) tubulin and lower (α1β1) tubulin, respectively.
Figure 5—figure supplement 1

Strategy to promote αβ-tubulin polymerization using DRPΔN and the structural comparison of DRP and DRPΔN interfaces with αβ-tubulin.
(A) SEC trace for the purified DRPΔN mutant. (B) SEC trace of 1:2:2 TOG1-TOG2:αβ-tubulin:DRPΔN complex (blue) in comparison to DRPΔN (red) and αβ-tubulin (black). (C) and (D) SDS-PAGE fractions shown in A and B, respectively. (E) Models of the DRPΔN (orange) and DRP (yellow). Comparison of their binding interfaces with αβ-tubulin dimer reveals 20% decrease interface size. (F) View of αβ-tubulin binding interfaces of DRPΔN (orange) and DRP (yellow). Note the decrease in interface surface at the first ankyrin repeat.
Figure 5—figure supplement 2

X-ray crystallographic structure determination of 1:2:1 Sk-Alp14-monomer:αβ-tubulin:DRPΔN complex.
(A) View of rectangular 1:2:1 TOG1-TOG2:αβ-tubulin:DRPΔN crystals formed in the same conditions as crystals in Figure Figure 2—figure supplement 1. (B) Top, molecular replacement solution to identify positions for αβ-tubulin in the in the asymmetric unit. Bottom, molecular replacement solution to identify positions for TOG domains in the asymmetric unit. (C) 3.2 Å resolution refined 2Fo-Fc density map with 1 σ contour of the native 1:2:1 TOG1-TOG2:αβ-tubulin:DRPΔN assembly showing the organization of the extended assembly and the modeled protein subunits. (D) Top, top-end view of the unit cell packing arrangement of 1:2:1 TOG1-TOG2: αβ-tubulin:DRPΔN extended complexes (shown in multiple colors). Bottom, 90° rotation with extended packing leads to side view of the unit cell arrangement. (E) The TOG1-TOG2 polymerized αβ-tubulin (red) structure is highly curved compared to most known αβ-tubulin polymers, such as assemblies of stathmin/RB3 complexes (GDP in cyan and GTP in yellow) and straight MT protofilaments (green). An analysis similar to that previously published (Brouhard and Rice, 2014) was used to compare the protofilament curvatures. Data are also described in Table 4.
Figure 6
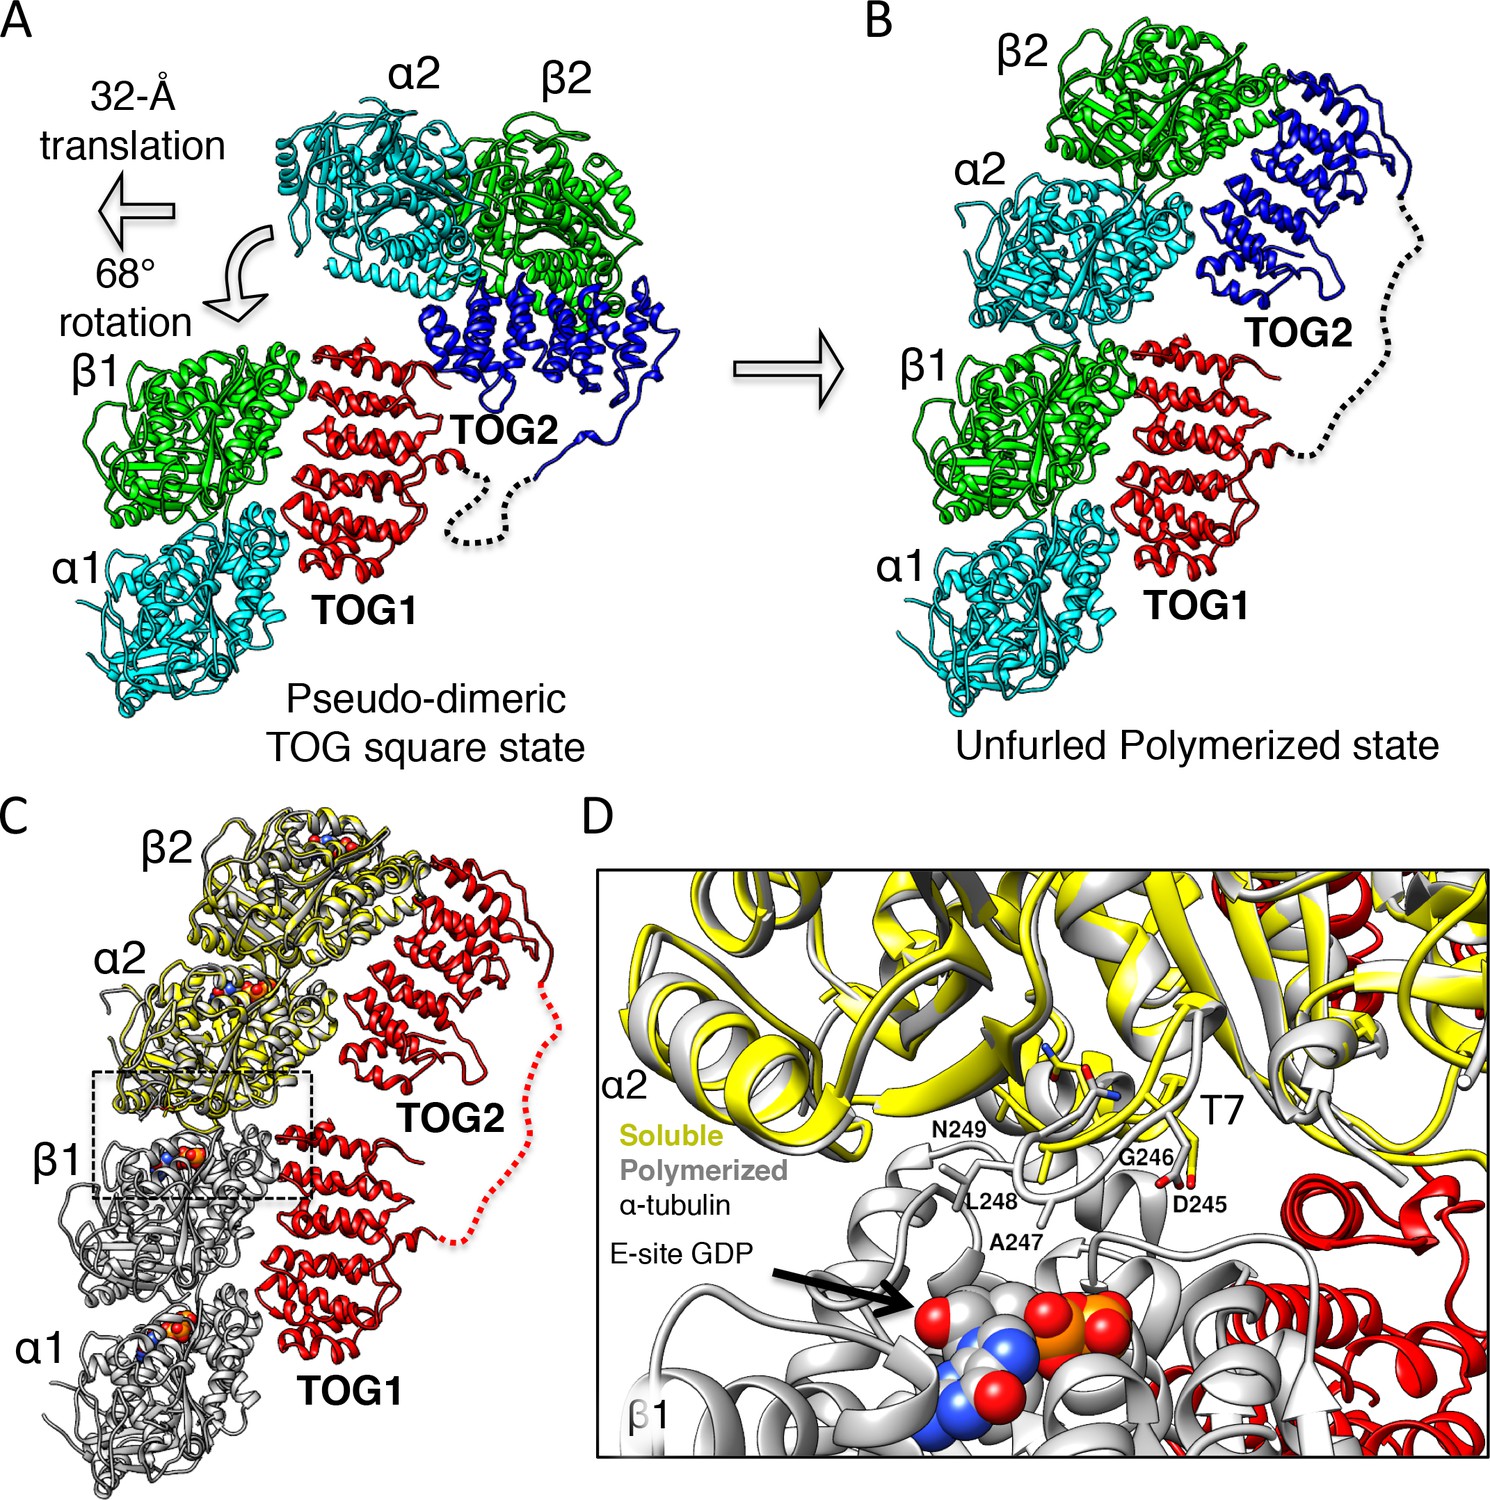
Unfurling the TOG array: TOG2 rotation around TOG1 promotes the bound αβ-tubulins to polymerize.
(A and B) Conformational change of TOG2 (blue) around TOG1 (red) while each is bound to αβ-tubulin (green and cyan) from a corner subunit in the wheel assembly (left) and in the extended conformation (right). TOG2 rotates 32° and translates 68 Å upon release to drive αβ-tubulin polymerization into a protofilament. (C) Superimposing unpolymerized αβ-tubulin (yellow) onto the α2β2-tubulin shows a conformational change in α-tubulin at the inter-dimer interface induced by polymerization. (D) Close-up view of the polymerized inter-dimer interface. Unpolymerized αβ-tubulin (yellow) is superimposed onto α2β2 (grey) of 1:2:1 structure. The α2-tubulin T7 loop and H8 helix engage the β1-tubulin GDP nucleotide through a T7 loop 5 Å translation and H8 helix 5° rotation involving residues Asp245 (D245), Gly246 (G246), Ala247 (A247), and Leu248 (L248).
Figure 7 with 1 supplement
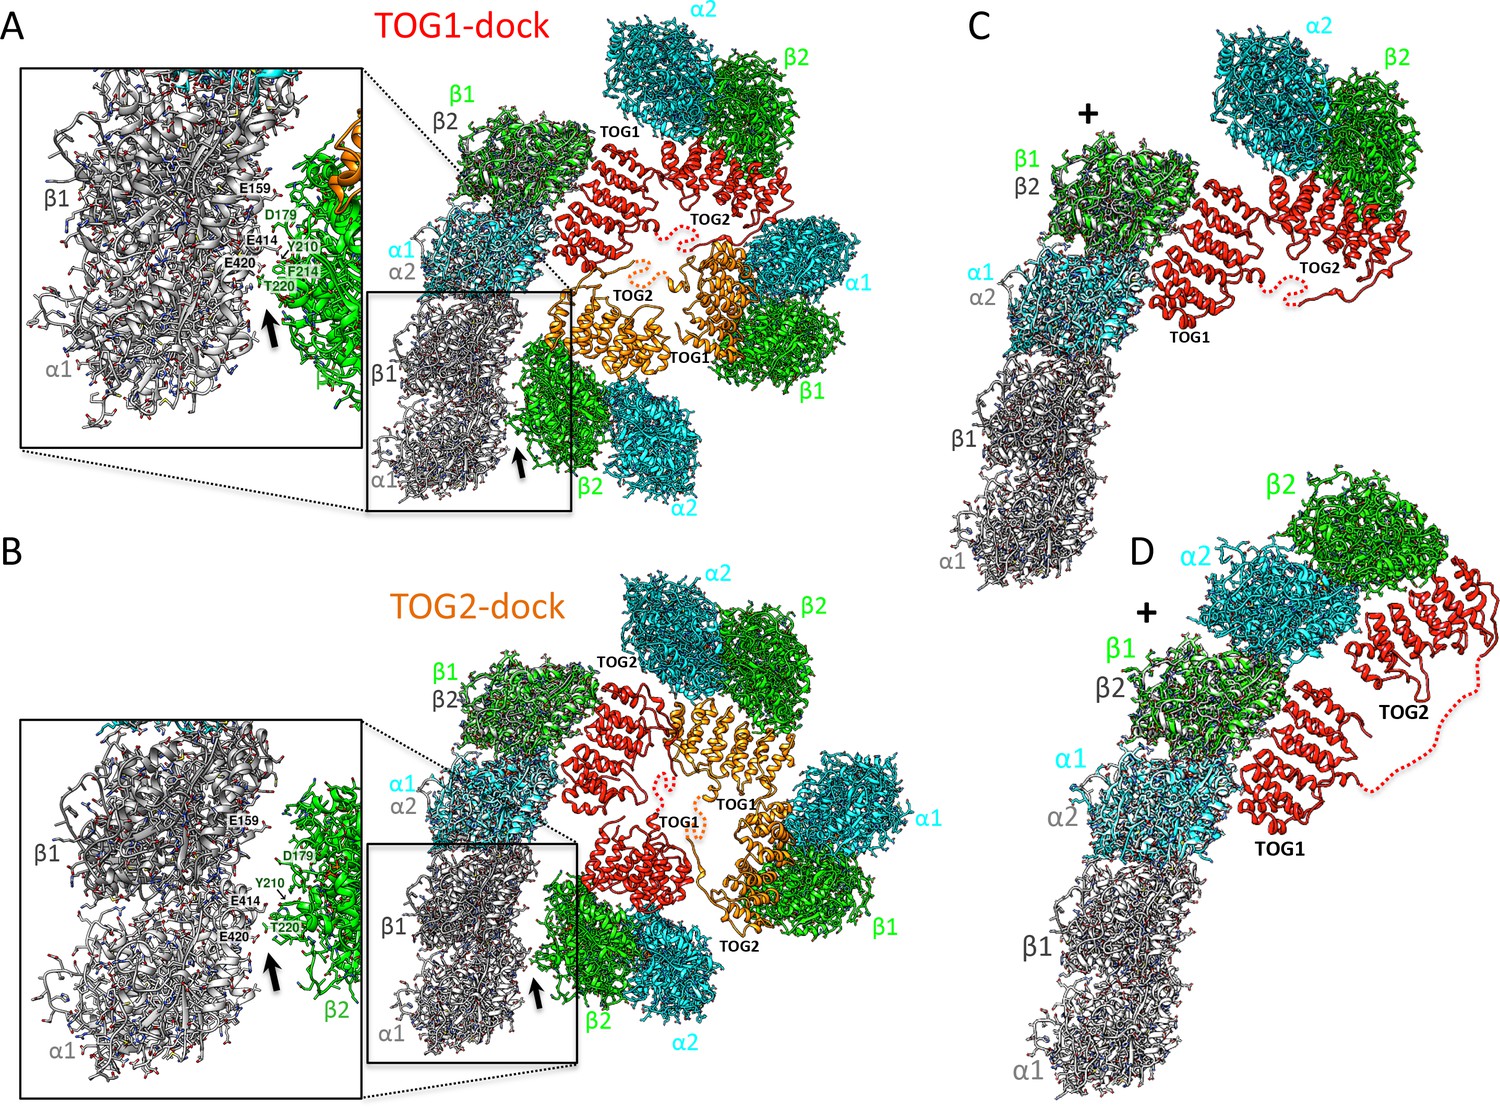
Docking of atomic structures onto protofilament ends reveals the molecular details of unfurling.
(A) Right, atomic model for four αβ-tubulin-bound TOG square X-ray structures (Figure 2) docked using αβ-tubulin bound to TOG1 at the terminal αβ-tubulin in a curved protofilament (PDB ID: 3RYH). Left, magnified view of the zone of steric contact between TOG2-αβ-tubulin in the second subunit and the penultimate αβ-tubulin of the protofilament below the polymerization site. (B) Right, atomic model for four αβ-tubulin-bound TOG square X-ray structure (Figure 2) docked using αβ-tubulin bound to TOG2 at the terminal αβ-tubulin in a curved protofilament (PDB ID: 3RYH). Left, magnified view of the zone shown in A between TOG1-αβ-tubulin in the second subunit and the penultimate αβ-tubulin of the protofilament. Details and overlay images are shown in Figure 7—figure supplement 1. (C) Docking the isolated TOG1-TOG2 two-αβ-tubulin assembly structure (extracted from the pseudo-dimer structure) onto the terminal αβ-tubulin of the curved protofilament. (D) Docking of the unfurled 1:2:1 unfurled assembly structure (Figure 5) to the curved protofilament revealing TOG1 to be positioned at the base of the new assembly while TOG2 is positioned at the outer end of the newly formed MT plus-end.
Figure 7—figure supplement 1

All-atom docking models for structures superimposed onto curved protofilament plus-ends.
(A) An all-atom model for a TOG square bound to four αβ-tubulins docked onto the protofilament plus-end by overlaying the terminal αβ-tubulin with the αβ-tubulin bound onto TOG1. Note some minor steric clashes between TOG2-αβ-tubulin from the second αβ-tubulin and penultimate αβ-tubulin in the protofilament (green arrows). These steric contacts may induce destabilization of the TOG square at interface 1 near the site of polymerization. (B) An all-atom model for a TOG square bound to four αβ-tubulins docked onto the protofilament plus-end by overlaying the terminal αβ-tubulin with the αβ-tubulin bound onto TOG2. Note the TOG1-αβ-tubulin from the second αβ-tubulin is retracted 10 Å away from the penultimate αβ-tubulin in the protofilament (green arrows). This finding suggests that TOG2-αβ-tubulin docking has no effect on destabilizing the TOG square. (C) An overlay of A and B is shown.
Figure 8
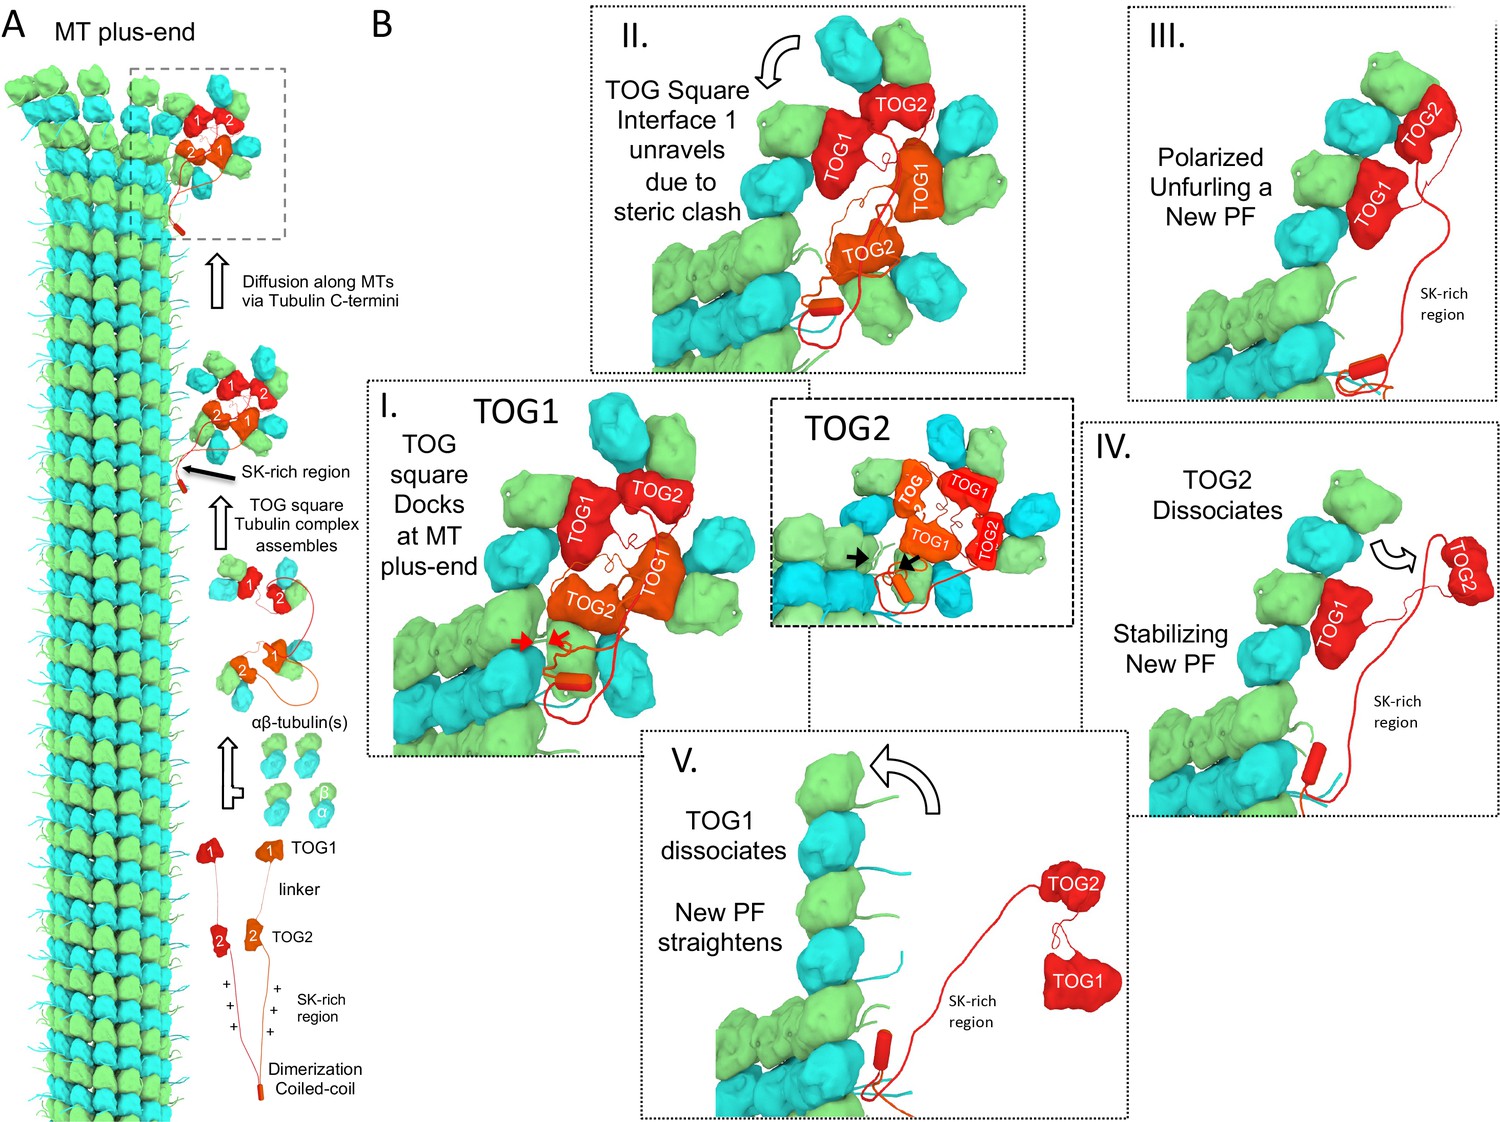
A polarized unfurling model for TOG arrays as MT polymerases.
An animation for this model is shown in Video 1. (A) Assembly of yeast MT polymerase dimeric TOG1-TOG2 subunits with four αβ-tubulins into an αβ-tubulin:TOG square. TOG squares diffuse along MT lattices modulated by tubulin C-termini interacting with SK-rich regions. (B) I. TOG square assemblies orient αβ-tubulins in wheel-shaped assemblies at MT plus-ends. II. These assemblies are destabilized upon TOG1-α-tubulin polymerizing onto the exposed β-tubulin at MT plus-ends, releasing TOG1-TOG2 subunits in corner conformations. III. The release of TOG2:αβ-tubulin allows free rotation around TOG1, driving two αβ-tubulins to polymerize. IV. TOG2 dissociates from the newly polymerized αβ-tubulin stabilizing protofilament at the plus-end while TOG1 anchors this αβ-tubulin onto the MT plus-end. V. Straightening of this new protofilament leads to the dissociation of TOG1. The rebinding of TOG1-TOG2 subunits to αβ-tubulins reforms the TOG square assembly and restarts the MT polymerase cycle. Atomic views for states I, II, and III are shown in Figure 7.
Videos
Video 1
Animation of the mechanism of polarized unfurling for multiple TOG domains in a yeast MT polymerase.
This animation describes the ‘polarized unfurling’ mechanism for multiple TOG domains in promoting MT polymerization. Briefly, Yeast MT polymerases are dimers with each subunit including TOG1 and TOG2 domains separated by a linker and followed by unstructured SK-rich and coiled-coil domains. Each MT polymerase binds four αβ-tubulins forming TOG square assemblies, as shown in the ribbon diagram (Figure 2). TOG2 exchanges αβ-tubulin due to its rapid exchange rate, while TOG square assemblies diffuse along MT lattices loaded with αβ-tubulins at MT plus-ends, as visualized in Figure 8. Docking of TOG square assemblies via TOG2 αβ-tubulin does not destabilize the TOG square as described in Figure 7. The polymerization of αβ-tubulin-TOG1 destabilizes TOG square complexes at interface 1 due to steric contact as described in Figure 7. The destabilization of the TOG square releases TOG2, promoting polarized unfurling of two soluble αβ-tubulins into one curved protofilament at the MT plus-end, as visualized in Figure 5. The newly formed protofilament is further stabilized by the rapid dissociation of TOG2 from the outermost αβ-tubulin, and forms corners to enhance direct αβ-tubulin polymerization at the MT plus-end. Other MT polymerase molecules promote delivery of αβ-tubulin dimers via the ‘polarized unfurling’ mechanism at polymerizing MT plus-ends. Individual steps for this model are shown in Figure 8.
Tables
Table 1
The stoichiometry for MT polymerases TOG1-TOG2 binding αβ-tubulin and DARPin (DRP)
https://doi.org/10.7554/eLife.38922.006| Protein complex | Expected Mass (kDa) | SEC-MALS Measured Mass (kDa) | SEC elution volume (mL) | Apparent Mass (kDa) |
|---|---|---|---|---|
| αβ-Tubulin | 100 kDa | 98 ± 0.323* | 12.9 | 104 |
| Alp14-dimer | 150 kDa | 143 ± 1.70 | 10.0 | 675 |
| 1 Alp14-dimer: 1 Tubulin 80 mM KCl | 350 kDa | 387 ± 2.74 | 9.27 | 463 |
| 1 Alp14-dimer: 2 Tubulin 80 mM KCl | 550 kDa | 578 ± 1.41 | 8.98 | 784 |
| 1 Alp14-dimer: 1Tubulin 200 mM KCl | 350 kDa | 304 ± 11.8 | 9.22 | 693 |
| 1 Alp14-dimer: 2 Tubulin 200 mM KCl | 350 kDa | 392 ± 9.66 | 9.67 | 549 |
| 1 Alp14-dimer-TOG1M: 1 Tubulin 80 mM KCl | 350 kDa | 400 ± 7.3 | 10.13 | 433 |
| 1 Alp14-dimer-TOG2M: 2 Tubulin 80 mM KCl | 350 kDa | 382 ± 14 | 9.76 | 524 |
| Alp14-monomer | 62 kDa | 77.8 ± 1.21 | 12.98 | 99 |
| 1 Alp14-monomer: 2 Tubulin 80 mM KCl | 262 kDa | 264 ± 1.31 | 11.17 | 253 |
| 1 Alp14-monomer: 2 Tubulin: 2 DRP 80mM KCl | 298 kDa | 312 ± 2.32 | 10.94 | 285 |
| 1 Alp14-dimer-INT1: 2 Tubulin 80mM KCl | 550 kDa | 533 ± 3.11 | 8.95 | 775 |
| 1 Alp14-dimer-INT2: 2 Tubulin 80mM KCl | 550 kDa | 580 ± 3.11 | 8.90 | 770 |
| 1 Alp14-dimer-INT1+2: 2 Tubulin 80mM KCl | 550 kDa | 540 ± 3.22 | 8.80 | 790 |
-
*Standard error is defined based on fitting data across peaks using Astra-software.
Table 2
Capacities of MT polymerase TOG1-TOG2 to bind αβ-tubulin, influenced by ionic strength
https://doi.org/10.7554/eLife.38922.010| Protein Complex (Alp14-monomer concentration 4.43 uM) | µM tubulin* bound | µM tubulin free | TOG1-TOG2 :αβ-tubulin |
|---|---|---|---|
| wt-Alp14-monomer (2 µM) | |||
| 1 Alp14-monomer: 1 Tub 100 mM KCl | 4.57 ± 0.08 | 0.43 ± 0.08 | 1.04 |
| 1 Alp14-monomer: 2 Tub 100 mM KCl | 8.82 ± 0.16 | 1.18 ± 0.16 | 2 |
| 1 Alp14-monomer: 1 Tub 200 mM KCl | 3.37 ± 0.27 | 1.63 ± 0.27 | 0.76 |
| 1 Alp14-monomer: 2 Tub 200 mM KCl | 5.97 ± 0.12 | 4.03 ± 0.12 | 1.35 |
| 1 Alp14-monomer:1 Tub:1 DRP 100 mM KCl | 4.33 ± 0.13 | 0.67 ± 0.13 | 0.98 |
| 1 Alp14-monomer:2 Tub:2 DRP 100 mM KCl | 7.23 ± 0.01 | 2.77 ± 0.01 | 1.64 |
| 1 Alp14-monomer:1 Tub:1 DRP 200 mM KCl | 4.13 ± 0.09 | 0.87 ± 0.09 | 0.94 |
| 1 Alp14-monomer: 2 Tub 2 DRP 200 mM KCl | 5.67 ± 0.03 | 4.34 ± 0.03 | 1.28 |
| wt-Alp14-dimer (1 µM) | |||
| 1 Alp14-dimer: 1 Tub 100 mM KCl | 4.31 ± 0.07 | 0.69 ± 0.07 | 0.98 |
| 1 Alp14-dimer: 2 Tub 100 mM KCl | 7.11 ± 0.14 | 2.89 ± 0.14 | 1.61 |
| 1 Alp14-dimer: 1 Tub 200 mM KCl | 3.44 ± 0.37 | 1.56 ± 0.37 | 0.78 |
| 1 Alp14-dimer: 2 Tub 200 mM KCl | 5.46 ± 0.34 | 4.55 ± 0.34 | 1.24 |
| 1 Alp14-dimer: 1 Tub: 2 DRP 100 mM KCl | 4.23 ± 0.02 | 0.78 ± 0.02 | 0.96 |
| 1 Alp14-dimer: 1 Tub: 2 DRP 100 mM KCl | 8.33 ± 0.09 | 1.67 ± 0.09 | 1.89 |
| 1 Alp14-dimer: 1 Tub: 1 DRP 200 mM KCl | 4.17 ± 0.29 | 0.83 ± 0.29 | 0.95 |
| 1 Alp14-dimer: 2 Tub: 2 DRP 200 mM KCl | 6.02 ± 0.17 | 3.99 ± 0.17 | 1.36 |
| TOG square Interface mutants (1 µM) | |||
| 1 INT1: 2 Tub 100mM KCl | 8.34 ± 0.07 | 1.66 ± 0.07 | 1.74 |
| 1 INT1: 2 Tub 200mM KCl | 5.67 ± 0.04 | 4.33 ± 0.04 | 1.18 |
| 1 INT2: 2 Tub 100mM KCl | 9.52 ± 0.3 | 0.48 ± 0.2 | 2.02 |
| 1 INT2: 2 Tub 200mM KCl | 6.82 ± 0.2 | 3.1 ±0.1 | 1.45 |
| 1 INT1+2: 2 Tub 100mM KCl | 8.44 ± 0.05 | 1.56 ± 0.05 | 1.86 |
| 1 INT1+2: 2 Tub 200mM KCl | 6.85 ± 0.04 | 3.15 ± 0.04 | 1.46 |
| Inactivated TOG mutants (1 µM) | |||
| 1 TOG1M: 1 Tub 100 mM KCl | 4.04 ± 0.07 | 0.97 ± 0.07 | 0.92 |
| 1 TOG1M: 2 Tub 100 mM KCl | 4.94 ± 0.06 | 5.06 ± 0.06 | 1.12 |
| 1 TOG1M: 1 Tub 200 mM KCl | 1.66 ± 0.25 | 3.34 ± 0.25 | 0.38 |
| 1 TOG1M: 2 Tub 200 mM KCl | 2.23 ± 0.1 | 7.77 ± 0.1 | 0.51 |
| 1 TOG2M: 1 Tub 100 mM KCl | 3.53 ± 0.04 | 1.48 ± 0.04 | 0.8 |
| 1 TOG2M: 2 Tub 100 mM KCl | 6.24 ± 0.10 | 3.76 ± 0.1 | 1.41 |
| 1 TOG2M: 1 Tub 200 mM KCl | 3.15 ± 0.24 | 1.85 ± 0.24 | 0.72 |
| 1 TOG2M: 2 Tub 200 mM KCl | 4.28 ± 0.18 | 5.72 ± 0.18 | 0.97 |
-
*Standard error is defined based on combined data from duplicated SEC runs.
Table 3
X-ray Crystallographic and Refinement statistics of MT polymerase:αβ-tubulin:DRP.
https://doi.org/10.7554/eLife.38922.013| Data collection | 1:2:2 sk-Alp14-monomer: αβ-Tubulin:DRP | 1:2:2 sk-Alp14-monomer-SL: αβ-Tubulin:DRP | 1:2:2 sk-Alp14-monomer: αβ-Tubulin:DRPΔN | 1:2:2 sk-Alp14-dimer: αβ-Tubulin:DRPΔN |
|---|---|---|---|---|
| Resolution range (Å) | 96.59 - 4.40 (4.64- 4.40)* | 59.45 – 3.60 (3.79 – 3.60)* | 57.56 – 3.20 (3.37 – 3.20)* | 99.83 – 3.5 (3.69 – 3.50)* |
| Space group | P 21 | P 21 | P 21 | P 21 |
| Wavelength (Å) | 0.9792 | 0.9792 | 0.9792 | 0.9792 |
| Unit cell (Å): a, b, c (°): β | 218.80, 107.65, 282.74 90.38 | 218.48, 106.15, 282.23 90.39 | 115.13, 194.99, 149.57 90.19 | 122.73 199.67, 162.70 90.09 |
| Total number of observed reflections | 229567 | 380856 | 298551 | 235576 |
| Unique reflections | 80099 {68039}† | 142673 {121943}† | 104265 {88337}† | 91368 |
| Average mosaicity | 0.57 | 0.38 | 0.64 | 0.50 |
| Multiplicity | 2.9 (2.9)* | 2.7 (2.7)* | 2.9 (2.9)* | 2.6 (2.4)* |
| Completeness (%) | 95.4 (94.8) {80.6}† | 95.0 (96.7) {79.0}† | 96.2 (97.9) {82.0}† | 92.9 (90.2)* |
| Wilson B-factor (Å2) | 82.7 | 81.4 | 46.6 | - |
| <I/σ (I)> | 4.9 (1.9)* | 4.8 (1.2)* | 5.8 (1.5)* | 4.8 (1.1)* |
| Rmergec | 0.14 (0.48)* | 0.13(0.65)* | 0.13(0.65)* | 0.14 (0.63)* |
| Structure refinement | ||||
| Rwork | 0.23 (0.26)* | 0.20 (0.24)* | 0.18 (0.23)* | - |
| Rfree | 0.26 (0.33)* | 0.24 (0.26)* | 0.24 (0.26)* | - |
| Complexes per asymmetric unit | 2 | 2 | 2 | - |
| Number of atoms | 78030 | 77878 | 36865 | - |
| Protein residues | 9989 | 9981 | 4661 | - |
| Ligand atoms | 496 | 496 | 248 | - |
| RMS bond lengths (Å) | 0.004 | 0.004 | 0.004 | - |
| RMS bond angles (°) | 0.94 | 0.98 | 0.93 | - |
| Ramachandran favored (%) | 94.0 | 94.0 | 95.0 | - |
| Ramachandran allowed (%) | 5.4 | 5.5 | 4.5 | |
| Ramachandran outliers (%) | 0.3 | 0.3 | 0.2 | - |
| Clashscore | 4.5 | 4.8 | 5.6 | - |
| Mean B values (Å2) | ||||
| Overall | 108.4 | 98.3 | 48.6 | - |
| Macromolecules | 108.6 | 98.4 | 48.6 | - |
| Ligands | 78.5 | 91.5 | 36.4 | - |
-
*Numbers represent the highest-resolution shell.
†Numbers represent the truncated data after treated with ellipsoidal truncation and anisotropic scaling.
-
‡Rmerge = ΣhklΣi|Ii(hkl)-Iav(hkl)|/ΣhklΣiIi(hkl).
Table 4
Buried Surface Area between αβ-tubulin dimer and TOG domains or DRP.
https://doi.org/10.7554/eLife.38922.017| Interface | 1:2:2: sk-Alp14-monomer: αβ-Tubulin: DRP(Å2)* | 1:2:2: sk-Alp14-monomer-SL: αβ-Tubulin: DRP (Å2) | 1:2:1: sk-Alp14-monomer: αβ-Tubulin: DRP-ΔN (Å2) |
|---|---|---|---|
| TOG1 and TOG2-interface 2 | 273 ± 35 | 257 ± 42 | - |
| TOG1-TOG2 dimer-interface 1 | 661 ± 27 | 702 ± 18 | - |
| αβ-tubulin and TOG1 | 752 ± 12 | 786 ± 42 | 804 ± 24 |
| αβ-tubulin and TOG2 | 916 ± 23 | 890 ± 22 | 863 ± 12 |
| β-tubulin and DRP or DRP-ΔN | 842 ± 68 | 873 ± 21 | 846 ± 20 |
| α-tubulin and DRP (inter-αβ-tubulin subunit) | 108 ± 47 | 81 ± 31 | - |
-
*Interface areas were determined by a single buried surface, and averaged among each non-crystallographic unit in the structure.
Table 5
Intra and inter dimer curvature angles (°) of αβ-Tubulins observed in structures.
https://doi.org/10.7554/eLife.38922.021| PDB ID | Intra dimer (α1β1) angle (°) | Inter dimer (β1α2) angle (°) | |
|---|---|---|---|
| Stathmin:RB3 complex with GTP | 3RYH | 9.2 | 10.3 |
| Stathmin:RB3 complex with GDP | 1SA0 | 13.0 | 13.5 |
| αβ-tubulin:TOG1 complex with GTP | 4FFB | 13 | - |
| αβ-Tubulin:TOG2 complex with GTP | 4U3J | 13 | - |
| αβ-Tubulin:DRP complex with GDP | 4DRX | 11.0 | - |
| Sk-Alp14-monomer:αβ-Tubulin:DRP wheel with GDP | Current | 11.3 | - |
| Sk-Alp14-monomer:αβ-Tubulin:DRP-ΔN with GDP | Current | 11.2 | 16.4 |
-
*Curvature of αβ-tubulin interface were determined as previously described by Rice and Brouhard 2015.
Key resources table
| Reagent type (species) or resource | Designation | Source | Identifier | Additional information |
|---|---|---|---|---|
| Chemical compound, drug | Darpin D1 (Synthetic DNA) | Invitrogen | N/A | |
| Chemical compound, drug | GTP | Sigma | G-8877 | |
| Chemical compound, drug | GDP | Sigma | G7127 | |
| Chemical compound, drug | Crystallization plates | TTP Labtech | 4150–05600 | |
| Chemical compound, drug | Crystallization sparse matrix screens | Qiagen | N/A | |
| Chemical compound, drug | PEG-8000 | Sigma | 1546605 | |
| Chemical compound, drug | PEG-2000 | Sigma | 8.21037 | |
| Chemical compound, drug | Copper(II) sulfate | Sigma | C1297 | |
| Chemical compound, drug | 1, 10- phenanthroline | Sigma | 131377 | |
| Chemical compound, drug | Trypsin | Sigma | T6567 | |
| Chemical compound, drug | Chymotrypsin | Sigma | C6423 | |
| Chemical compound, drug | Iodoacetamide | Sigma | I6125 | |
| Chemical compound, drug | 4-Vinylpyridine | Sigma | V3204 | |
| Other | 2:4:4 sk- Alp14-550:αβ- Tubulin:DRP | Protein Data Bank | PDB: #6MZF | Deposited Data (Atomic coordinates) |
| Other | 2:4:4 sk-Alp14-550- SL:αβ-Tubulin: DRP | Protein Data Bank | PDB: #6MZE | Deposited Data (Atomic coordinates) |
| Other | 1:2:1 sk-Alp14-550: αβ-Tubulin:DRPΔN | Protein Data Bank | PDB: #6MZG | Deposited Data (Atomic coordinates) |
| Other | Saccharomyces cerevisiae Stu2p | UniprotKB/ Swiss-Prot | P46675 | Protein sequence |
| Other | Saccharomyces kluyveri Stu2p or Alp14p | Lachancea kluyveri NRRL Y-12651 chromosome | SKLU-Cont10078 | Protein sequence |
| Other | Schizosaccharomyces pombe Alp14p | UniprotKB/ Swiss-Prot | O94534 | Protein sequence |
| Other | Chaetomium thermophilum Stu2 | UniprotKB/ Swiss-Prot | G0S3A7 | Protein sequence |
| Other | SoluBL21 bacterial expression system | AmsBio | C700200 | Model system (expression system) |
| Recombinant DNA reagent | pLIC_V2-Sc Stu2p-H6 | Current study | N/A | Recombinant DNA constructs Expressed in bacterial strains |
| Recombinant DNA reagent | pLIC_V2-Sk Stu2p-H6 | Current study | N/A | |
| Recombinant DNA reagent | pLIC_V2-Sc Stu2-550-H6 (TOG1-TOG2 monomer) | Al-Bassam et al., 2006 | ||
| Recombinant DNA reagent | pLIC_V2-KL-Stu2 -monomer-H6 (residues 1–560) | Current study | NA | |
| Recombinant DNA reagent | pLIC_V2-CT Stu2-mon omer-H6 (residues 1–550) | Current study | NA | |
| Recombinant DNA reagent | pLIC_V2-SK Alp14-monomer- H6 (residues 1-550) | Current study | N/A | |
| Recombinant DNA reagent | pLIC_V2-Sk Alp14-monomer -SL-H6 (residues 1–550; linker residues replaced KL sequence; see Materials and methods) | Current study | N/A | |
| Recombinant DNA reagent | pLIC_V2- sk-wt-Alp14- dimer-H6 (residues 1–724) | Current study | N/A | |
| Recombinant DNA reagent | pLIC_V2 -sk-Alp14- dimer- H6 | Current study | N/A | |
| Recombinant DNA reagent | S180C and L304C (residues 1–724) | |||
| Recombinant DNA reagent | pLIC_V2- sk-Alp14- dimer- H6 | Current study | N/A | |
| Recombinant DNA reagent | S41C and E518C (residues 1–724) | |||
| Recombinant DNA reagent | pLIC_V2-wt -Alp14-dimer- H6 (residues 1–690) | Current study | N/A | |
| Recombinant DNA reagent | pLIC_V2-TOG1M - H6 (residues 1–690: Y23A and R23A) | Current study | N/A | |
| Recombinant DNA reagent | pLIC_V2-TOG2M - H6 (residues 1–690: Y300A and K381A) | Current study | N/A | |
| Recombinant DNA reagent | pLIC_V2-INT1-H6 (residues 1–690: L206A, L208A, F275R D276A, L277A, V278A, K320L, R359A) | Current study | N/A | |
| Recombinant DNA reagent | pLIC_V2-INT2-H6 (residues 1–690: L39D, S40A, D42A, L437D, S440A, E478A and R479A) | Current study | N/A | |
| Recombinant DNA reagent | pLIC_V2 -INT1 + 2 H6 (L206A, L208A, F275R D276A, L277A, V278A, K320L, R359A L39D, S40A, D42A, L437D, S440A, E478A and R479A) | Current study | N/A | |
| Recombinant DNA reagent | pET303-H6-DRP | Current study | N/A | |
| Recombinant DNA reagent | pLIC_V2-H6-DRPΔN | Current study | N/A | |
| Other | αβ-tubulin purified from porcine brains | Current study | N/A | Native protein purification |
| Other | αβ-tubulin purified from porcine brains | Castoldi and Popov, 2003 | ||
| Software, algorithm | ASTRA V6.0 | Wyatt Technology | http://www.wyatt. com/products/ software/astra.html | |
| Software, algorithm | NanoAnalyze | TA Instruments | http://www.tainstruments.com/ | |
| Software, algorithm | EMAN2 | http://blake.bcm.edu/emanwiki/EMAN2 | ||
| Software, algorithm | iMOSFLM | Battye et al., 2011 | http://www.mrc-lmb.cam.ac.uk/harry/imosflm/ver721/quickguide.html | |
| Software, algorithm | PHASER | Terwilliger, 2000 | http://www.phaser.cimr.cam.ac.uk/index.php/ | |
| Software, algorithm | PHASER | McCoy, 2007 | Phaser_Crystallographic_ Software | |
| Software, algorithm | PyMol | Schrodinger, LLC | http://www.pymol.org/ | |
| Software, algorithm | UCSF-Chimera | Pettersen et al., 2004 | https://www.cgl.ucsf.edu/chimera/ | |
| Software, algorithm | DM from CCP4 suite | Cowtan and Main, 1996 | http://www.ccp4.ac.uk/html/dmmulti.html | |
| Software, algorithm | PHENIX | Adams et al., 2010 | https://www.phenix-online.org | |
| Software, algorithm | anisotropy server | Strong et al., 2006 | https://services.mbi.ucla.edu/anisoscale/ | |
| Software, algorithm | Phyre protein homology model | Kelley et al., 2015 | www.sbg.bio.ic.ac.uk/phyre2/html/page.cgi?id=index | |
| Software, algorithm | Cr-yolo | Wagner et al., 2018 | http://sphire. mpg.de/wiki/ | |
| Software, algorithm | Relion 2.2 | Kimanius et al., 2016 | https://www2.mrc-lmb.cam.ac.uk/relion/index.php | |
| Software, algorithm | Cryosparc | Punjani et al., 2017 | https://cryosparc.com/ | |
| Software, algorithm | MolProbity | Chen et al., 2012 | http://molprobity.biochem.duke.edu | |
| Software, algorithm | Coot | Emsley et al., 2010 | http://www2.mrc-lmb.cam.ac.uk/personal/pemsley/coot/ | |
| Software, algorithm | BLENDER 3D-animation | Blender foundation | https://www.blender.org/ |
Additional files
-
Transparent reporting form
- https://doi.org/10.7554/eLife.38922.027
Download links
A two-part list of links to download the article, or parts of the article, in various formats.
Downloads (link to download the article as PDF)
Open citations (links to open the citations from this article in various online reference manager services)
Cite this article (links to download the citations from this article in formats compatible with various reference manager tools)
Structural basis of tubulin recruitment and assembly by microtubule polymerases with tumor overexpressed gene (TOG) domain arrays
eLife 7:e38922.
https://doi.org/10.7554/eLife.38922


