TIAM-1/GEF can shape somatosensory dendrites independently of its GEF activity by regulating F-actin localization
- Albert Einstein College of Medicine, United States
Figures
Figure 1 with 1 supplement

The intracellular domain of DMA-1/LRR-TM is required for higher order branching of PVD somatosensory dendrites.
(A) Fluorescent images of PVD (left panels) and schematics (right panels) of wild-type control animals. PVD is visualized by the wdIs52 [F49H12.4p::GFP] transgene in all panels. 1°, 2°, 3°, 4°, and ectopic 3° (e3°) dendrites are indicated. Anterior is to the left and dorsal is up in all panels, scale bars indicate 20 µm. (B) Schematics of the DMA-1/LRR-TM protein and a variant used in transgenic rescue experiments (dma-1(ΔICD)). A PDZ-binding site (YFGI) at the extreme C-terminus of DMA-1/LRR-TM is indicated in lilac. The predicted deletion from the tm5159 deletion allele is shown. (C-F) Fluorescent images of PVD (left panels) and schematics (right panels) of the genotypes indicated. Scale bar indicates 20 µm. (G) Quantification of 2°, 3°, and 4° branch numbers per 100 µm anterior to the PVD cell body. Data for three and two independent transgenic lines for the dma-1 wild type cDNA or the dma-1(ΔICD), respectively, are shown next to the data for the dma-1(dz266[∆PDZ]) allele. The data for dma-1(tm5159) NTS are nontransgenic siblings of a representative transgenic line. For raw data see Figure 1—source data 1. Data are represented as mean ± SEM. Statistical comparisons were performed using one-sided ANOVA with Sidak’s correction. Statistical significance is indicated (ns, not significant; ****, p < 0.0001). n = 20 animals per genotype.
-
Figure 1—source data 1
Complete source data.
- https://doi.org/10.7554/eLife.38949.003
Figure 1—figure supplement 1
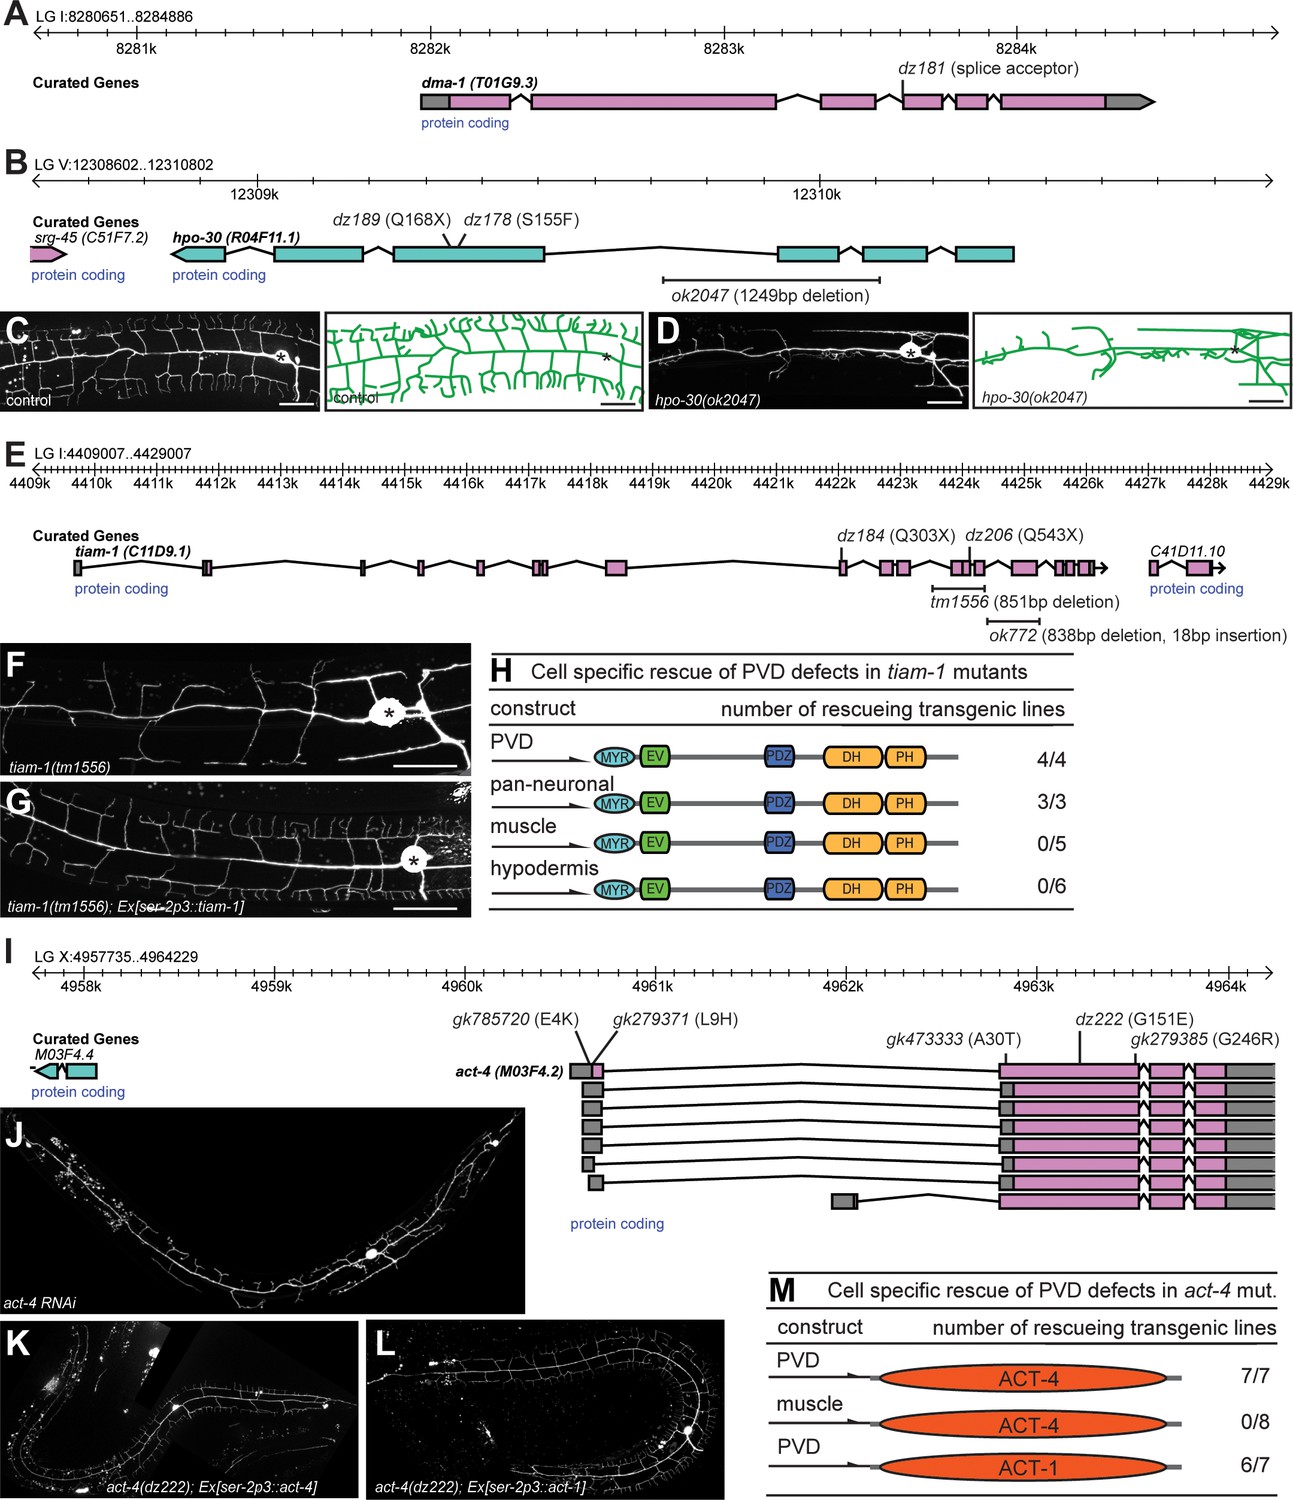
Genes functioning cell-autonomously in PVD somatosensory neurons.
(A–B). Genomic environs of the indicated genes with the physical location on the respective linkage groups (LGs) are shown. The exon-intron structure is indicated, as is the direction of transcription. Alleles and the resulting molecular changes are shown above (for point mutants) and below (for deletions) the gene structure, respectively. dz178 introduces a S155F mutation in the third predicted transmembrane domain in HPO-30/Claudin (B). (C) – (D) Fluorescent images of PVD (left panels) and schematics (right panels) of wild type control (C) and hpo-30(ok2047) mutant animals (D). PVD is visualized by the wdIs52 [F49H12.4p::GFP] transgene and, anterior is to the left and dorsal is up in all panels; scale bars indicate 20 µm. (E) Genomic environs of tiam-1 with the physical location on linkage group I are shown. The exon-intron structure is indicated as well as the direction of transcription. Alleles and the resulting molecular changes are shown above (for point mutants) and below (for deletions) the gene structure, respectively. (F – G) Fluorescent images of PVD of tiam-1(tm1556) animals without (F) and with a transgene expressing a wild type TIAM-1 cDNA under control of the PVD-specific ser-2p3 promoter (Tsalik et al., 2003) (G). (H) Summary of transgenic rescue experiments of tiam-1(tm1556) mutant animals. Cell-specific promoters are shown on the left (PVD: ser-2p3 (Tsalik et al., 2003); pan-neuronal: rab-3p (Nonet et al., 1997); myo-3p muscle: (Okkema et al., 1993); and dpy-7p hypodermis (Gilleard et al., 1997)). The number of rescuing transgenic lines out of the total number of independent transgenic lines obtained is shown on the right. (I) Genomic environs of act-4 with the physical location on linkage group X are shown. The exon-intron structure is indicated as well as the direction of transcription. Alleles and the resulting molecular changes are shown above the gene structure. (J– L) Fluorescent images of PVD in wild-type animals after RNAi-mediated gene knock down of act-4 and, of act-4(dz222) mutant animals carrying a transgene expressing a wild type ACT-4 (K) or ACT-1 (L) genomic DNA, respectively, under control of the PVD specific ser-2p3 promoter (Tsalik et al., 2003). (M) Summary of transgenic rescue experiments of act-4(dz222) mutant animals with ACT-4 or ACT-1, respectively. Cell-specific promoters are shown on the left (PVD: ser-2p3 (Tsalik et al., 2003); myo-3p muscle: (Okkema et al., 1993)). The number of rescuing transgenic lines out of the total number of independent transgenic lines obtained is shown on the right.
Figure 2 with 2 supplements
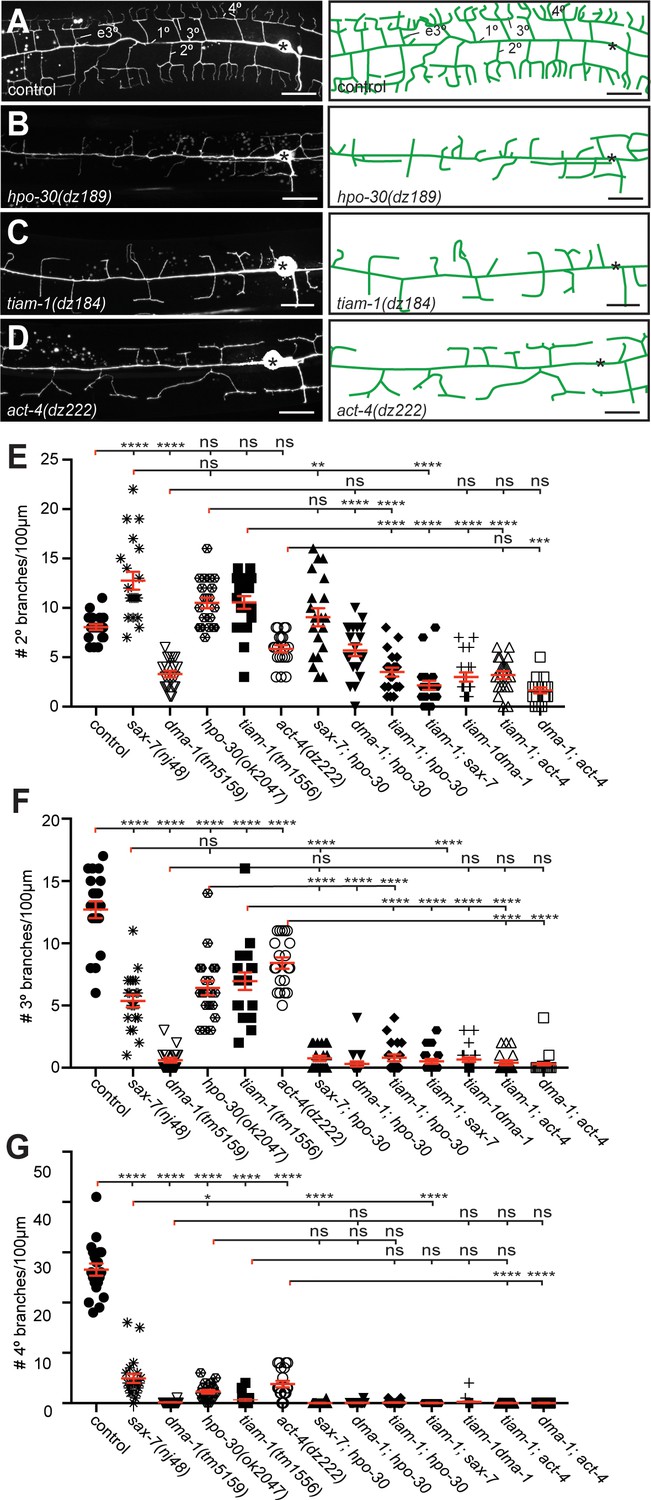
The hpo-30/Claudin, tiam-1/GEF, and act-4/Actin act genetically in the Menorin pathway.
(A – D) Fluorescent images of PVD (left panels, visualized by the wdIs52 [F49H12.4p::GFP] transgene) and schematics (right panels) of the genotypes indicated. The control image is identical to Figure 1A and shown for comparison only. Details on alleles of individual genes and images of other alleles are shown in Figure 1—figure supplement 1. Scale bar indicates 20 µm. (E – G) Quantification of 2°, 3°, and 4° branch numbers per 100 µm anterior to the PVD cell body. Data for additional single and double mutants of the Menorin pathway as well as the average length and aggregate length of secondary, tertiary, and quaternary branches are shown in Figure 2—figure supplement 2. All alleles used are molecular or genetic null alleles (Material and methods for details). Data for control, lect-2, sax-7, mnr-1 and dma-1 mutant animals is identical to data from Díaz-Balzac et al. (2016) and shown for comparison only. For raw data see Figure 1—source data 1. Data are represented as mean ± SEM. Statistical comparisons were performed using one-sided ANOVA with the Tukey correction. Statistical significance is indicated (ns, not significant; *, p<0.05; **, p<0.01; ***, p<0.001; ****, p<0.0001). n = 20 animals for all genotypes.
Figure 2—figure supplement 1
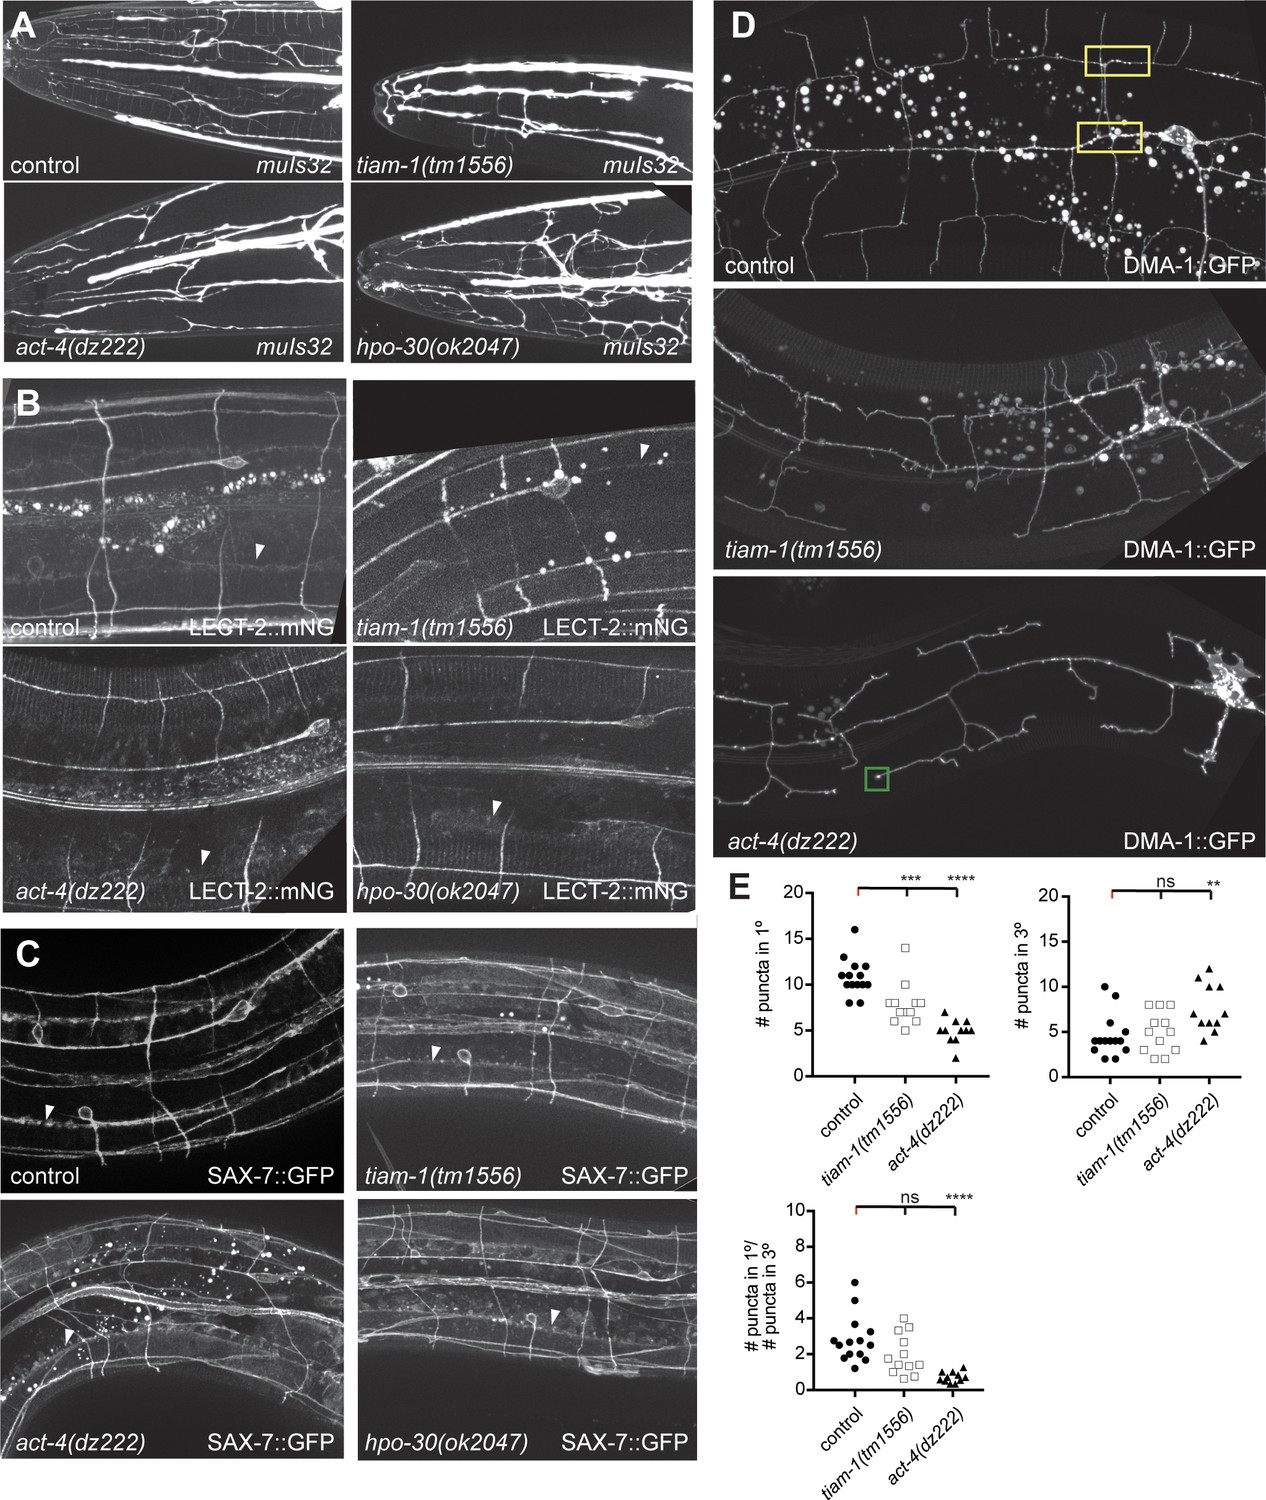
Effects of hpo-30/Claudin, tiam-1/GEF and act-4/Actin on localization of LECT-2:mNG, SAX-7::GFP and DMA-1::GFP.
(A) Fluorescent images of animals expressing GFP in FLP neurons (muIs32 [Pmec-7::GFP]) in the indicated genotypes. Anterior is to the left and scale bars indicate 20 µm. (B – D) Fluorescent images of animals expressing a LECT-2::mNeonGreen fusion at endogenous levels (a functional knock in (lect-2(dz249) [lect-2::mNG^3xFlag] (Díaz-Balzac et al., 2016)) (B), a functional fosmid-based SAX-7::GFP reporter (ddIs290) (C), and a functional DMA-1::GFP reporter (D) (Liu and Shen, 2011). Arrowheads indicate the localization of LECT-2::mNG or SAX-7::GFP in a stripe at edge of the lateral hypodermis, where hypodermis and muscle abut. The control image (B) is identical to Figure 4B and shown for comparison only. A green box indicated enrichment of DMA-1::GFP at the tip of dendrites of act-4(dz222) mutant animals. (E) Quantification of DMA-1::GFP puncta in the genotypes indicated. n = 14 for control, n = 12 for tiam-1(tm1556), and n = 11 for act-4(dz222). For raw data see Figure 1— source data 1. Statistical significance is indicated as Data are represented as mean ±SEM. Statistical comparisons were performed using one-sided ANOVA with the Tukey correction. Statistical significance is indicated (ns: not significant, **p<0.05, ***p<0.005, ****p<0.0005).
Figure 2—figure supplement 2
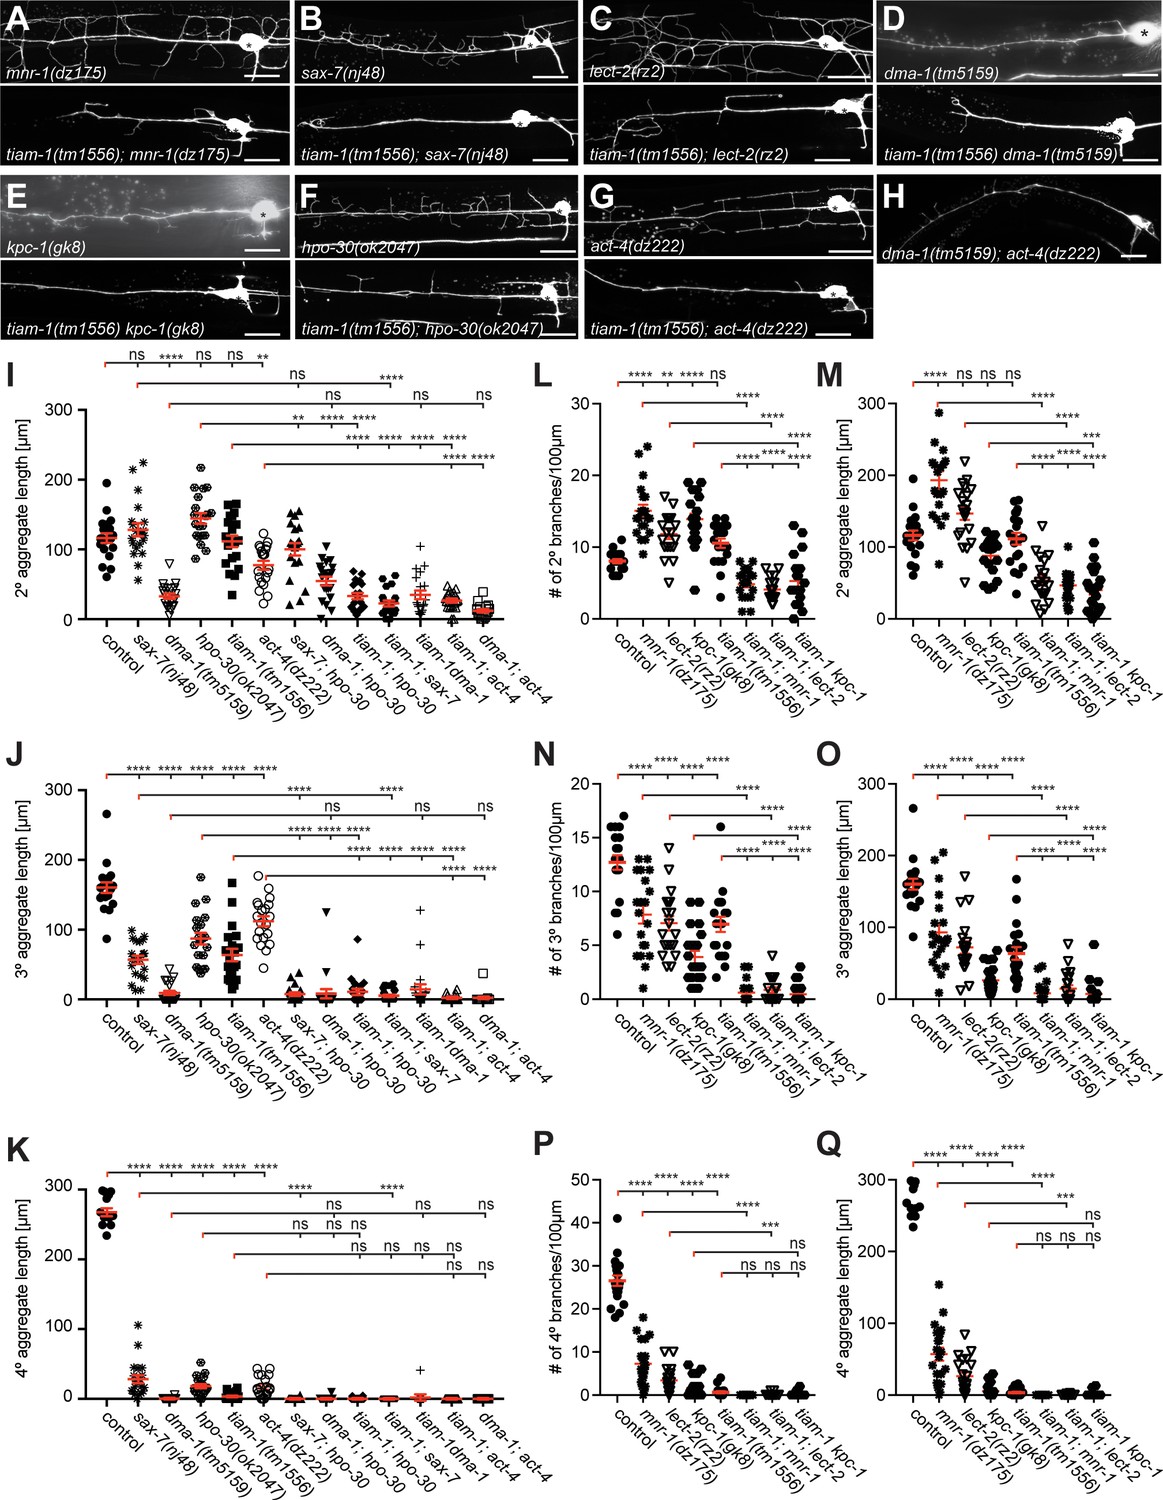
The Genetics of hpo-30/Claudin, tiam-1/GEF, and act-4/Actin.
(A – H) Fluorescent images of animals expressing GFP in PVD neurons (wdIs52 [F49H12.4p::GFP]) in the indicated genotypes. Anterior is to the left and scale bars indicate 20 µm. (I – K) Quantification of the aggregate length of secondary, tertiary, and quaternary branches 100 µm anterior to the PVD cell body. Data are represented as mean ± SEM. Statistical comparisons were performed using one-sided ANOVA with the Tukey correction. For raw data see Figure 1— source data 1. Statistical significance is indicated as Statistical significance is indicated (ns: not significant, **p<0.01, ***p<0.001, ****p<0.0001). n = 20 for all samples. (L – Q) Quantification of the number (KM,O) or aggregate length (LN,P) of secondary, tertiary, and quaternary branches 100 µm anterior to the PVD cell body. Some data in (KM,O) is identical to data in Figure 2 and shown for comparison only. For raw data see Figure 1— source data 1. Statistical significance is indicated as Data are represented as mean ± SEM. Statistical comparisons were performed using one-sided ANOVA with the Tukey correction. Statistical significance is indicated (ns: not significant, **p<0.01, ***p<0.001, ****p<0.0001). n = 20 for all samples.
Figure 3 with 1 supplement
The tiam-1/GEF and act-4/Actin act downstream of the dma-1/LRR-TM receptor in PVD dendrites.
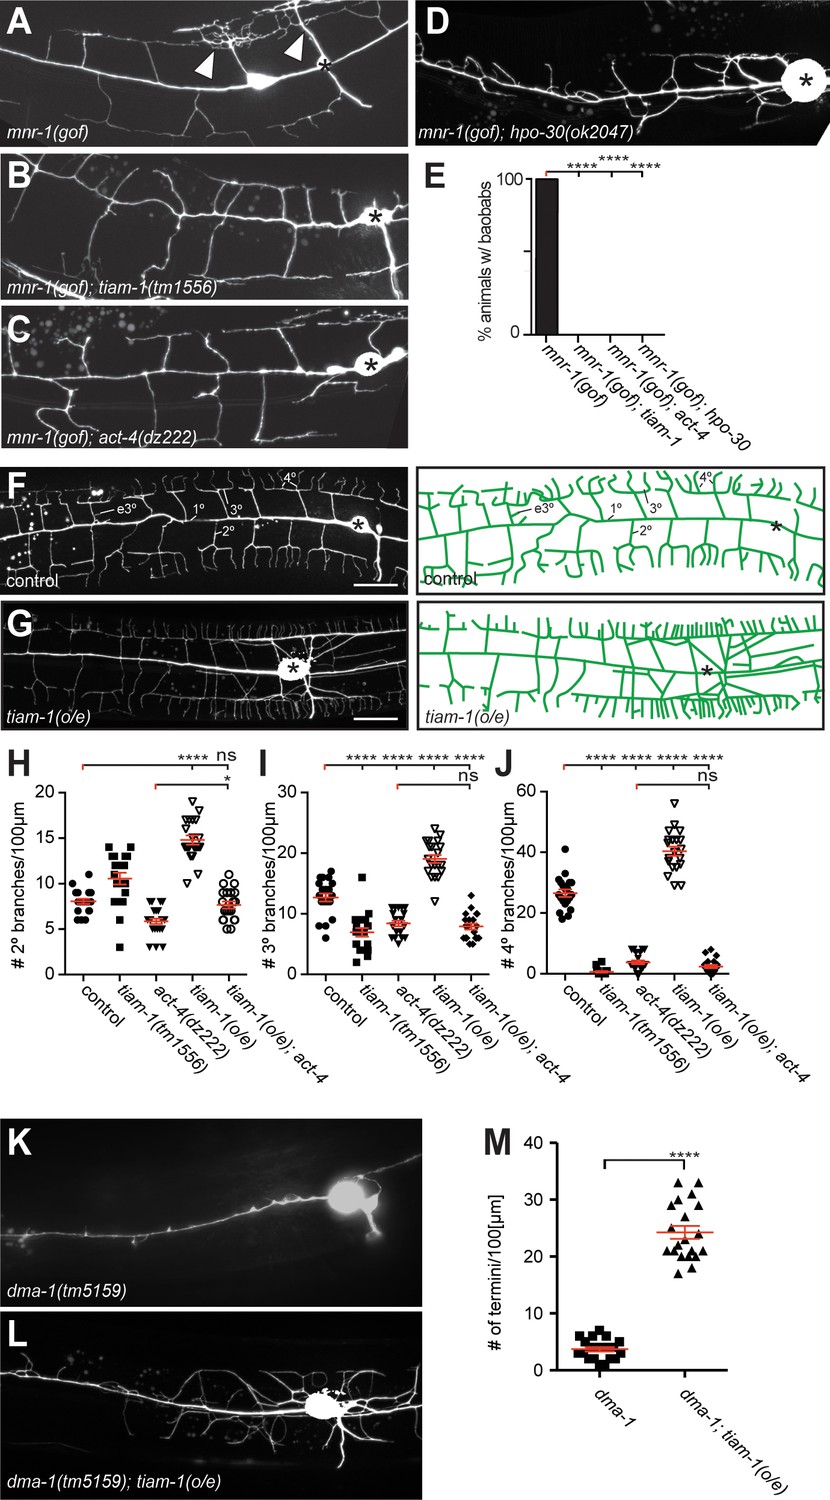
(A – D) Fluorescent images of animals in which mnr-1/Menorin was expressed ectopically in muscle (mnr-1(gof): dzIs43, [myo-3p::mnr-1] (Salzberg et al., 2013)) in different genetic backgrounds. A characteristic baobab-like tree is indicated by a white arrowhead in (A). PVD is visualized by the wdIs52 [F49H12.4p::GFP] transgene in all panels. Anterior is to the left, dorsal up, and scale bars indicate 20 µm in all panels. (E) Quantification of animals with baobab-like dendritic trees in the genotypes indicated. Data are represented as mean. For raw data see Figure 1— source data 1. Statistical comparisons were performed using the Z-test. Statistical significance is indicated (****p<0.0005). n = 20 animals for all samples. (F – G) Fluorescent images of PVD (left panels) and schematics (right panels) of wild type control and tiam-1(o/e) overexpressing animals (dzIs95 [ser-2p3::tiam-1]). The control image (F) is identical to Figure 1A and shown for comparison only. (H – J) Quantification of secondary (2°, (H), tertiary (3°, (I), and quaternary (4°, (J) branch numbers per 100 µm anterior to the PVD cell body in the genotypes indicated. Data for control, tiam-1(tm1556), and act-4(dz222) are identical to data in Figure 2 and shown for comparison only. For raw data see Figure 1—source data 1. Data are represented as mean ±SEM. Statistical comparisons were performed using one-sided ANOVA with the Tukey correction. Statistical significance is indicated (ns, not significant; *, p<0.05; ****p<0.0001). n = 20 for all samples. (K – L) Fluorescent images of PVD in dma-1/LRR-TM mutant animals alone (K) and in combination with a tiam-1(o/e) expression array (L). Anterior is to the left and ventral down. Scale bar indicates 20 µm. (M) Quantification of dendrite termini in a 100 µm section anterior to the PVD cell body in the genotype indicated. For raw data see Figure 1—source data 1. Data are represented as mean ±SEM. Statistical comparisons were performed using Student’s T-test. Statistical significance is indicated (****p<0.0001). n = 20 animals for all samples.
Figure 3—figure supplement 1
The tiam-1/GEF and act-4/Actin act downstream or in parallel of the dma-1/LRR-TM receptor in PVD dendrites.
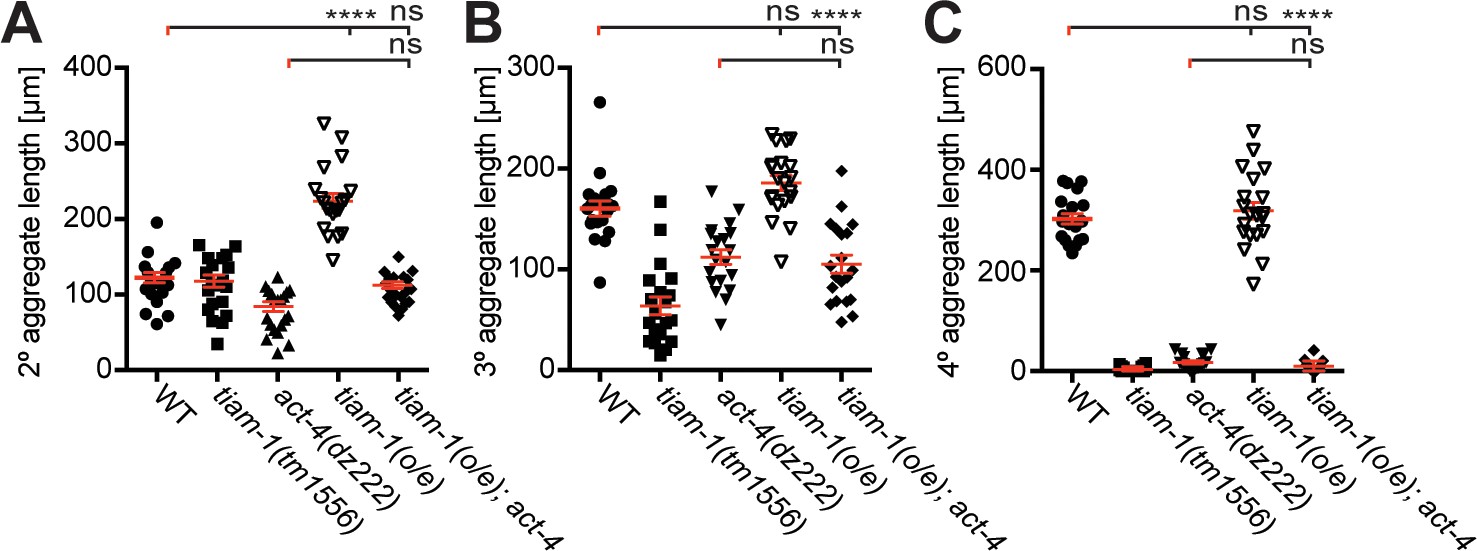
Quantification of the aggregate length of secondary, tertiary, and quaternary branches 100 µm anterior to the PVD cell body in the genotypes indicated. For raw data see Figure 1— source data 1. Statistical significance is indicated as Data are represented as mean ±SEM. Statistical comparisons were performed using one-sided ANOVA with the Tukey correction. Statistical significance is indicated (ns, not significant, **p<0.01, ***p<0.001, ****p<0.0001). n = 20 for all samples.
Figure 4
HPO-30/Claudin forms a complex with, and, localizes DMA-1/LRR-TM to higher order branches of PVD somatosensory neurons.
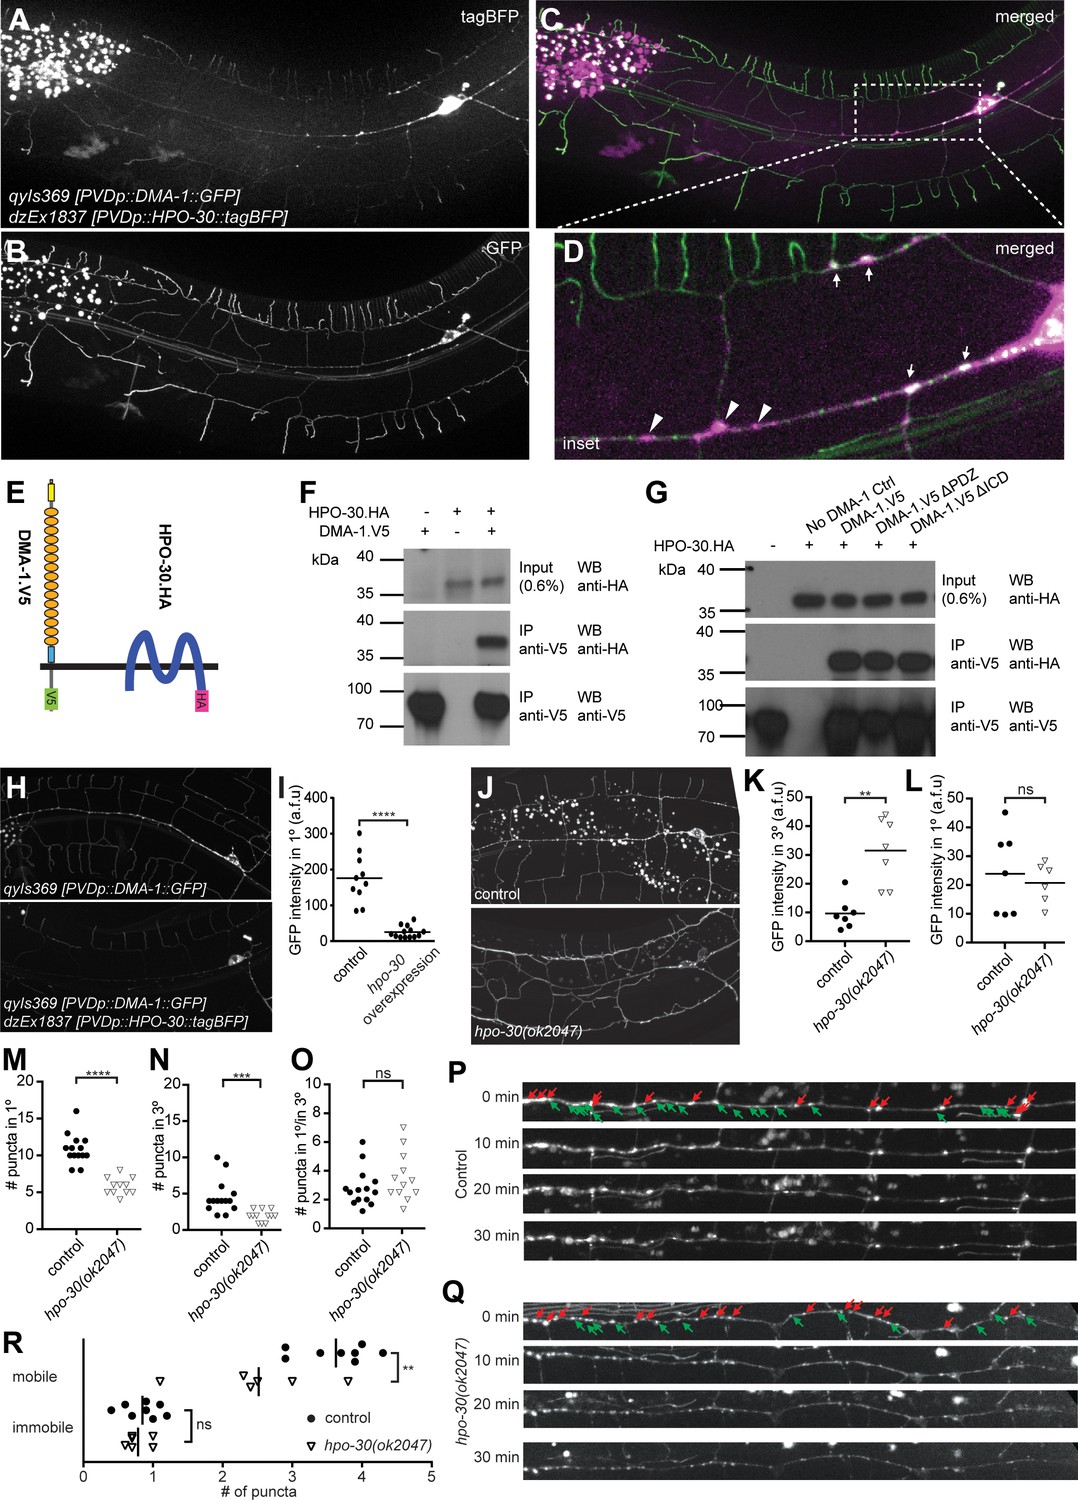
(A – D) Images of an animal with PVD-specific expression of HPO-30::tagBFP (A, dzEx1837) and DMA-1::GFP (B, qyIs369) as well as a composite image (C), respectively. Both reporters show diffuse staining across the dendrite in addition to discreet punctate staining, with inset enlargement (D) where white arrows indicate puncta of HPO-30::tagBFP and DMA-1::GFP colocalization and a scale bar 10 µm. (E) Schematic showing the topography of the DMA-1/LRR-TM single pass transmembrane receptor and the four transmembrane, claudin-like, HPO-30 protein. Immuno tags (V5 and HA) used for co-immunoprecipitation experiments are shown. Not to scale. (F – G) Western blots of co-immunoprecipitation experiments. Transfected constructs are indicated above the panels. Antibodies used for immunopreciptation (IP) and western blotting (WB) are indicated. A molecular marker is denoted on the left. Note, that all cases the two lower panels are from a single western blot, which was developed repeatedly with two different antibodies after stripping. In G., DMA-1.HA ΔPDZ and DMA-1.HA ΔICD are lacking the PDZ-binding site or the intracellular domain, respectively. Similar results were obtained from at least three independent replicate experiments. (H – I) PVD-specific expression of DMA-1::GFP (qyIs369) imaged in the presence (upper panel) or absence (lower panel) of a transgene with PVD-specific overexpression of HPO-30::tagBFP (dzEx1837) using identical imaging parameters for comparison of fluorescent intensity. The intensity of DMA-1::GFP appears substantially dimmer on the 1° dendrites when HPO-30::tagBFP is overexpressed. The average fluorescent intensity of the 1° dendrites within 50 µm of the cell body is quantified and presented in I). ****, p<0.0001, Mann-Whitney test. (J – O). PVD-specific expression of DMA-1::GFP (qyIs369) imaged in a hpo-30(ok2047) null mutant or wild type control animal using identical imaging parameters for comparison of fluorescent intensity. Fluorescent intensity was quantified for 3° and 1° dendrites within 50 µm of the cell body in K and L, respectively. The number of puncta for 3° and 1° dendrites between 30 and 130 µm from the cell body was counted and presented in M and N, respectively; the ratio of the puncta between 3° and 1° dendrites is presented in O. For raw data see Figure 1— source data 1. Statistical significance is indicated as ns, not significant; **, p<0.01; ***, p<0.001; ****, p<0.0001; Mann-Whitney test. (P) – R. Images of selected time points in a time-lapse series of visualizing DMA-1::GFP (qyIs369) in wild-type control and hpo-30 null mutant animals, imaged in 2 min intervals for 30 min to observe the dynamics of DMA-1::GFP puncta. Puncta between 30 to 130 µm anterior to the cell body were identified at t = 0 min and classified as mobile or immobile. Puncta were deemed immobile if there was no perceived movement throughout the whole time-lapse assay (30 min), and mobile otherwise. The number of mobile and immobile puncta were quantified in R. For raw data see Figure 1— source data 1. Statistical significance is indicated as **, p<0.01, 2-way ANOVA.
Figure 5 with 2 supplements
TIAM-1/GEF interacts with DMA-1/LRR-TM through PDZ motif/domain interaction to shape 4° dendrite branches.
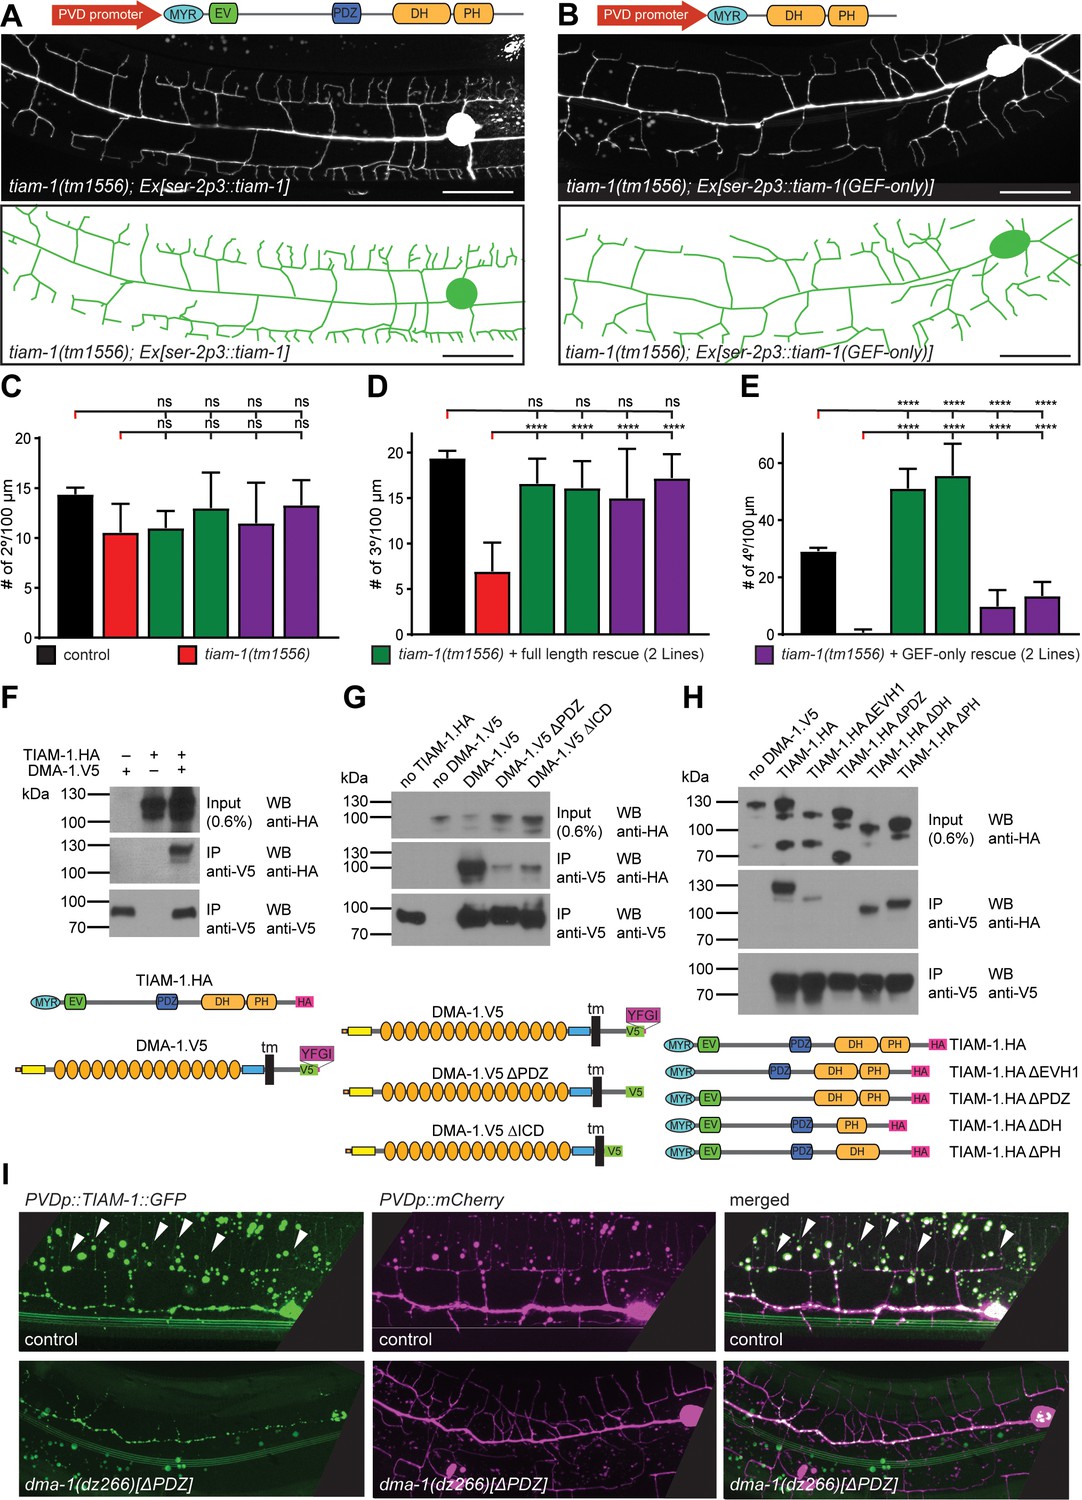
(A – B) Fluorescent image with schematics of tiam-1 mutant animals carrying either a full length or deletion construct (GEF-only) of the tiam-1 cDNA under control of the PVD-specific ser-2p3 promoter. (B) (C – E) Quantification of 2°, 3°, and 4° branch numbers per 100 µm anterior to the PVD cell body in the genotypes indicated. For raw data see Figure 1 — source data 1. Statistical significance is indicated as Data are represented as mean ±SEM. Statistical comparisons were performed using one-sided ANOVA with the Tukey correction. Statistical significance is indicated (****p<0.0005). n = 10 animals per genotype. (F – H) Western Blots of co-immunoprecipitation experiments with corresponding schematic showing the topography of the DMA-1/LRR-TM single pass transmembrane receptor and the TIAM-1/GEF multidomain protein. Schematics not to scale. Immuno tags (V5 and HA) used for co-immunoprecipitation experiments are shown. Transfected constructs are indicated above the panels. Antibodies used for immunoprecipitation (IP) and western blotting (WB) are indicated. A molecular marker is on the left. Note, that the two lower panels are from a single western blot, which was developed repeatedly with two different antibodies after stripping in all panels. Panel F investigates the interaction between TIAM-1 and DMA-1, and panels G and H are structure function analyses to delineate the domains required for the TIAM-1/DMA-1 interaction in TIAM-1 and DMA-1, respectively. Similar results were obtained from at least three independent replicate experiments. (G) (H) (I) Fluorescent images of TIAM-1::GFP reporter expressed in PVD in wild type or dma-1(Δ|DZ) mutant animals. PVD is visualized by dzIs53 ([F49H12.4p::mCherry]). TIAM-1::GFP (wyIs1139) staining on 4° dendrite branches in wild-type animals is lost in dma-1(ΔPDZ) mutant animals.
Figure 5—figure supplement 1
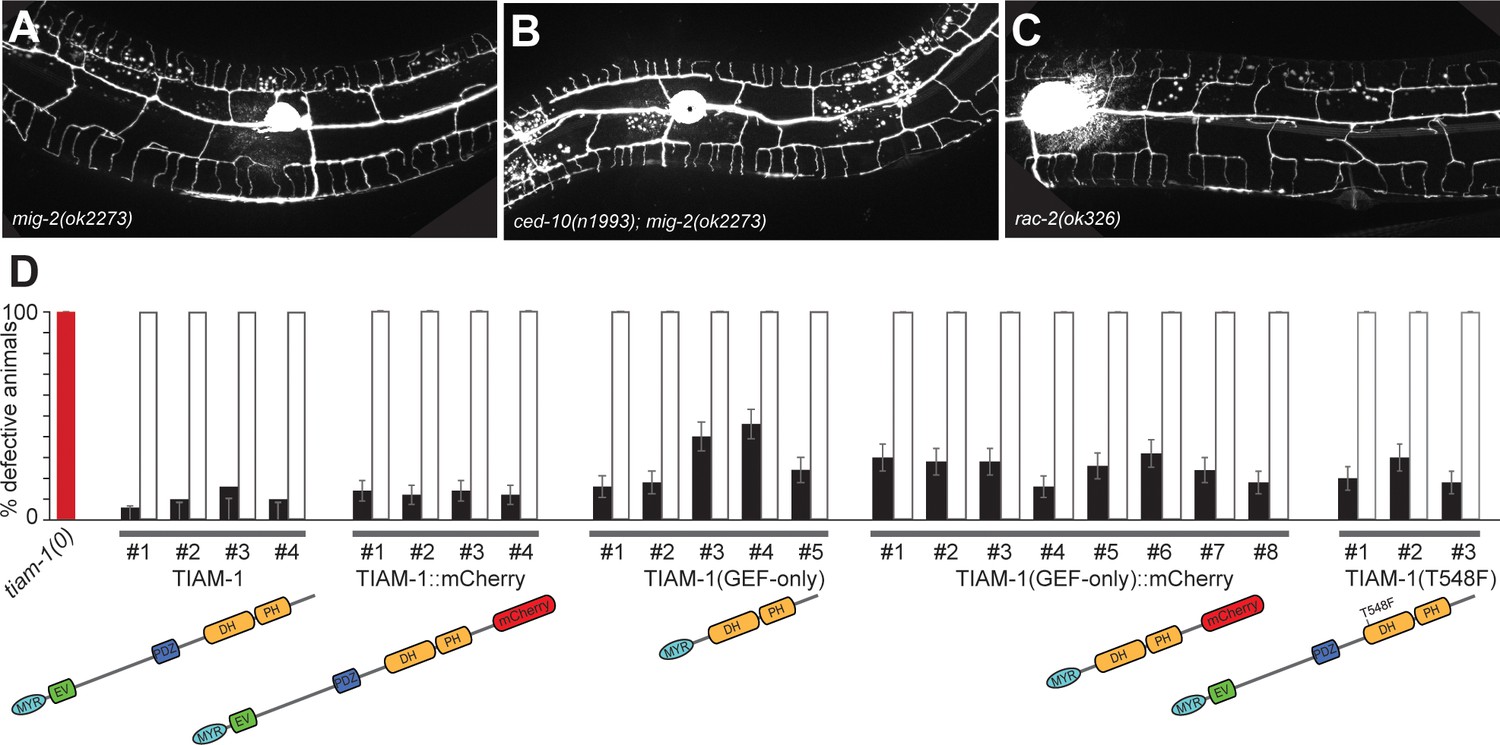
The TIAM-1/GEF acts independently of Rac1 GEF activity.
images of animals expressing GFP in PVD neurons (wdIs52 [F49H12.4p::GFP]) in the indicated genotypes. Anterior is to the left in A and to the right in B and C. (D) Quantification of animals with a defective PVD dendrite in transgenic rescue experiments. A red bar indicates the tiam-1(tm1556) mutant phenotype. Different transgenic lines (numbered #1-#N) are shown for each construct. Black bars indicate transgenic animals and white bars corresponding non-transgenic siblings. Shown is the percentage of animals with defective PVD dendritic arbors ± the standard error of proportion.
Figure 5—figure supplement 2

Supplementary co-immunoprecipitation experiments (related to Figure 5 (A) Figure 7 (B)).
(A) Replacement of PDZ motif in DMA-1 with EFYA (SDN-1 PDZ motif) diminishes the binding affinity between TIAM-1 and DMA-1. Western blots of co-immunoprecipitation experiments. Transfected constructs are indicated above the panels. Antibodies used for immunoprecipitation (IP) and western blotting (WB) are indicated. A molecular marker is on the left. Similar results were obtained from at least three independent replicate experiments. (B) DMA-1/LRR-TM, TIAM-1/GEF and ACT-4/Actin are part of the same biochemical complex. Western blots of co-immunoprecipitation experiments. Transfected constructs are indicated above the panels. Antibodies used for co-immunoprecipitation (IP) and western blotting (WB) are indicated. A molecular marker is on the left. Similar results were obtained from at least three independent replicate experiments.
Figure 6

The TIAM-1/GEF functions independently of its guanine nucleotide activity.
(A) Genomic environs of the tiam-1 locus in linkage group I (LGI) with exons and introns indicated. The location of the two CRISPR/Cas9 engineered dz264 and dz265 alleles, encoding a missense mutation that causes the T548F mutation is shown. (B) Fluorescent images with schematics of tiam-1 mutant animals carrying a T548F point mutant form of the tiam-1 cDNA under control of the PVD-specific ser-2p3 promoter. The T548F point mutant is analogous to the S1216F mutation in UNC-73 (Steven et al., 1998) and the T516F mutation in a previously described TIAM-1 cDNA (Demarco et al., 2012). Importantly, the point mutations in both proteins have been shown to abrogate GEF activity toward Rac in vitro (Demarco et al., 2012). (C – D) Fluorescent images of PVD (left panels) and schematics (right panels) of wild-type control (C) and tiam-1(dz265) mutant animals (D). PVD is visualized by the wdIs52 [F49H12.4p::GFP] transgene in all panels.
Figure 7 with 1 supplement
F-actin is localized to the leading edges of developing dendrites and requires the Menorin pathway for polarized localization.
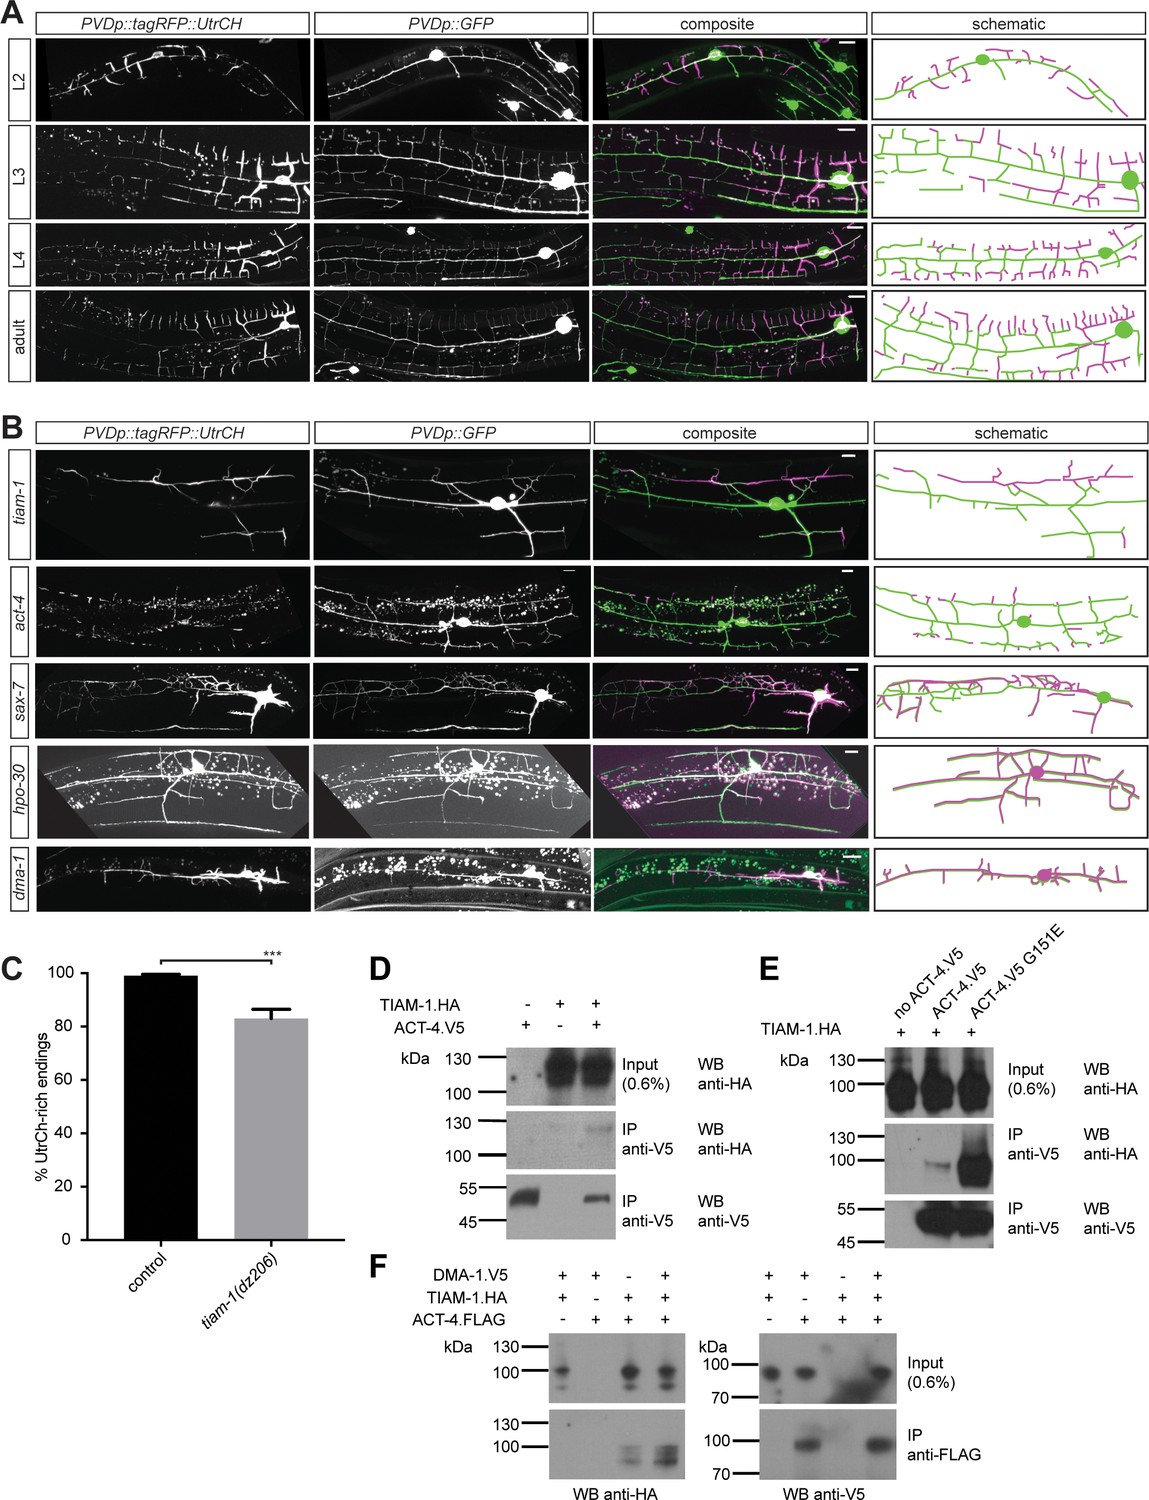
(A) Fluorescent images of animals at different developmental stages carrying a F-actin reporter (ser-2p3::tagRFP::UtrCH [dzEx1564], left panels), a PVD cytoplasmic GFP reporter (wdIs52 [F49H12.4p::GFP], second panels), merged images (third panel), and corresponding schematics (right panels). L2: second larval stage, L3: third larval stage, L4 fourth larval stage. Scale bars indicate 10 µm. (B) Fluorescent images of animals in different genetic backgrounds carrying a F-actin reporter (ser-2p3::tagRFP::UtrCH [dzEx1564], left panels), a PVD cytoplasmic GFP reporter (wdIs52 [F49H12.4p::GFP], second panels), merged images (third panel), and corresponding schematics (right panels). Genotypes are indicated on the left. Scale bars indicate 10 µm. (C) Quantification of dendrite termini with F-actin rich staining in wild-type control (n = 10) and tiam-1(tm1556) mutant animals (n = 13). For details on quantification see Materials and methods. For raw data see Figure 1— source data 1. Statistical significance is indicated as Data are represented as mean ±SEM. Statistical comparisons were performed using the Mann-Whitney test. Statistical significance is indicated (***, p<0.005). (D – F) Western blots of co-immunoprecipitation experiments analyzing the interaction between TIAM-1 and wild type ACT-4 or mutant ACT-4(G151E). Transfected constructs are indicated above the panels. Antibodies used for immunopreciptation (IP) and western blotting (WB) are indicated. A molecular marker is on the left. Note, that panels in F are from a single western blot, which was developed repeatedly with two different antibodies after stripping. Similar results were obtained from at least three independent replicate experiments.
Figure 7—figure supplement 1
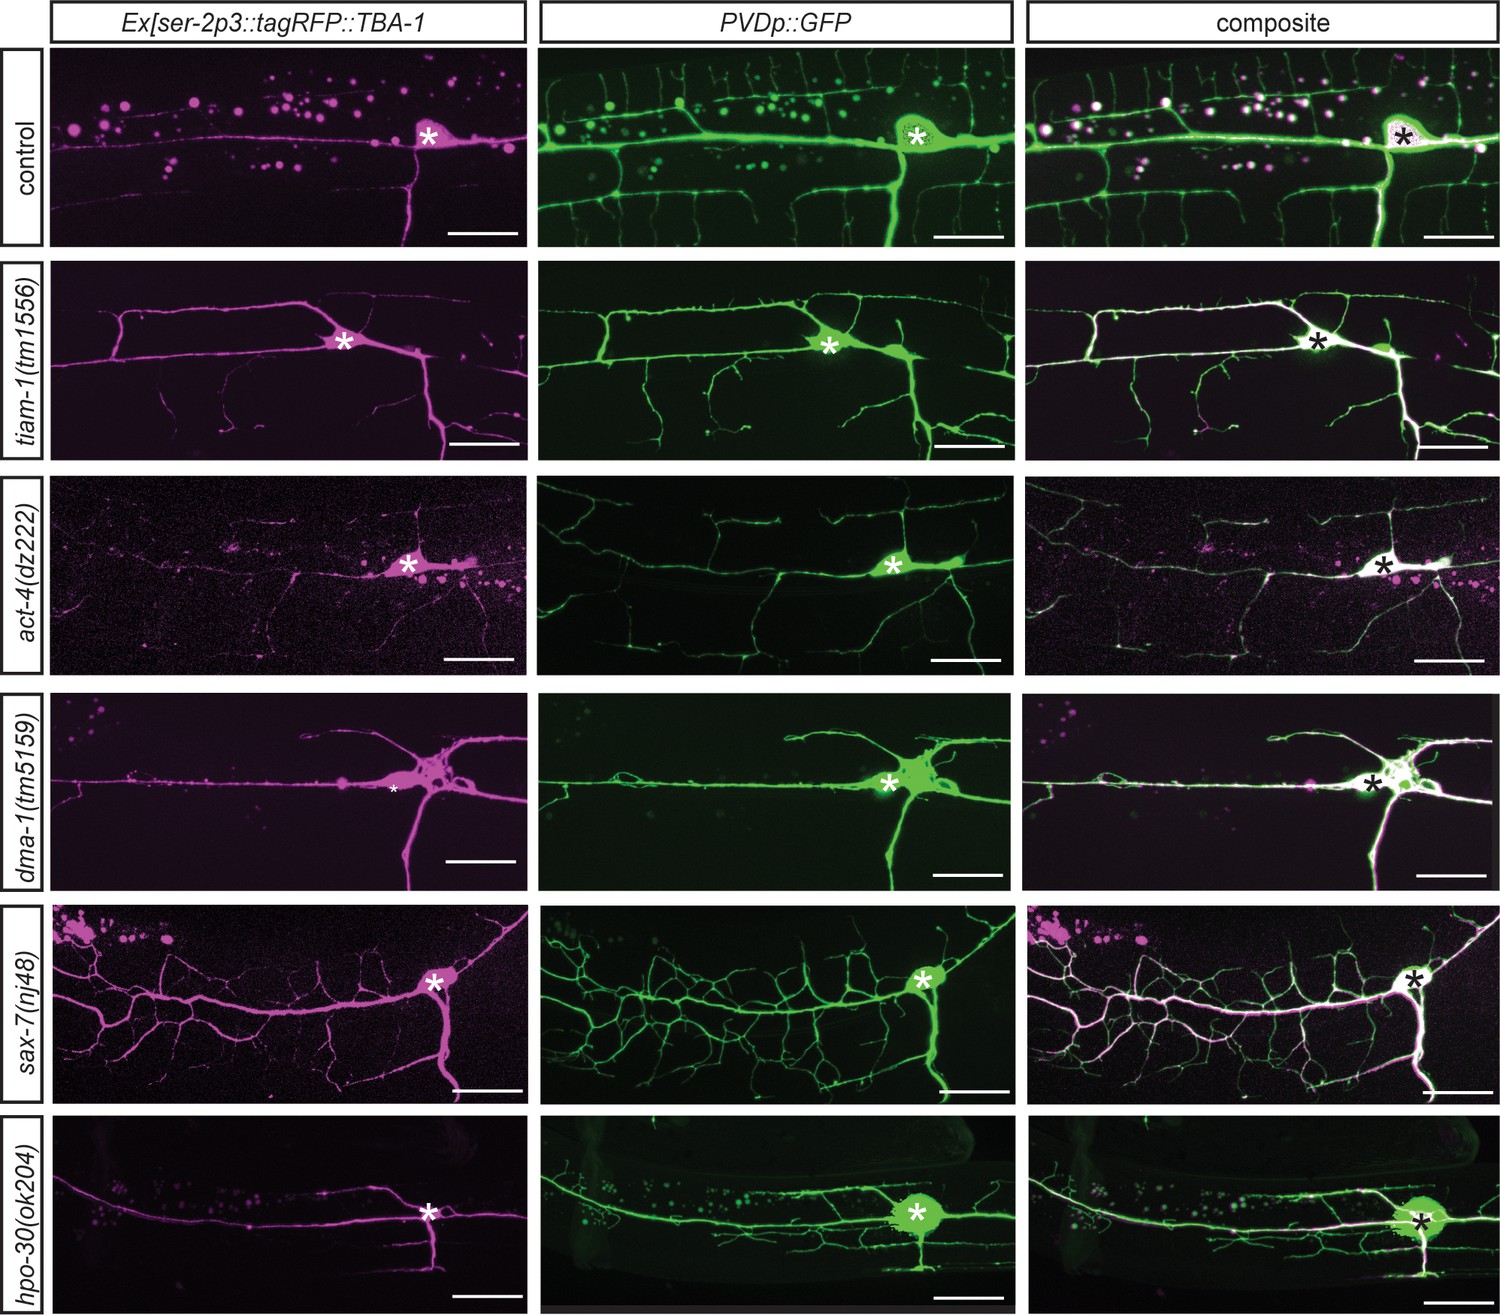
Localization of TBA-1::tagRFP in different genetic backgrounds.
Fluorescent images of animals in different genetic backgrounds carrying a microtubule reporter (dzEx1569, Ex[ser-2p3::TBA-1::tagRFP], left panels), a PVD cytoplasmic GFP reporter (middle panels), and merged images (right panel). Genotypes are indicated on the left.
Additional files
-
Supplementary file 1
Lists of all mutants alleles used, as well as all plasmids with details of their construction.
In addition, Supplementary file 1 lists all transgenic strains created during the course of these studies.
- https://doi.org/10.7554/eLife.38949.023
-
Transparent reporting form
- https://doi.org/10.7554/eLife.38949.024
Download links
A two-part list of links to download the article, or parts of the article, in various formats.
Downloads (link to download the article as PDF)
Open citations (links to open the citations from this article in various online reference manager services)
Cite this article (links to download the citations from this article in formats compatible with various reference manager tools)
TIAM-1/GEF can shape somatosensory dendrites independently of its GEF activity by regulating F-actin localization
eLife 8:e38949.
https://doi.org/10.7554/eLife.38949


