Microtubule plus-ends act as physical signaling hubs to activate RhoA during cytokinesis
- University of Massachusetts, United States
Figures
Figure 1 with 1 supplement
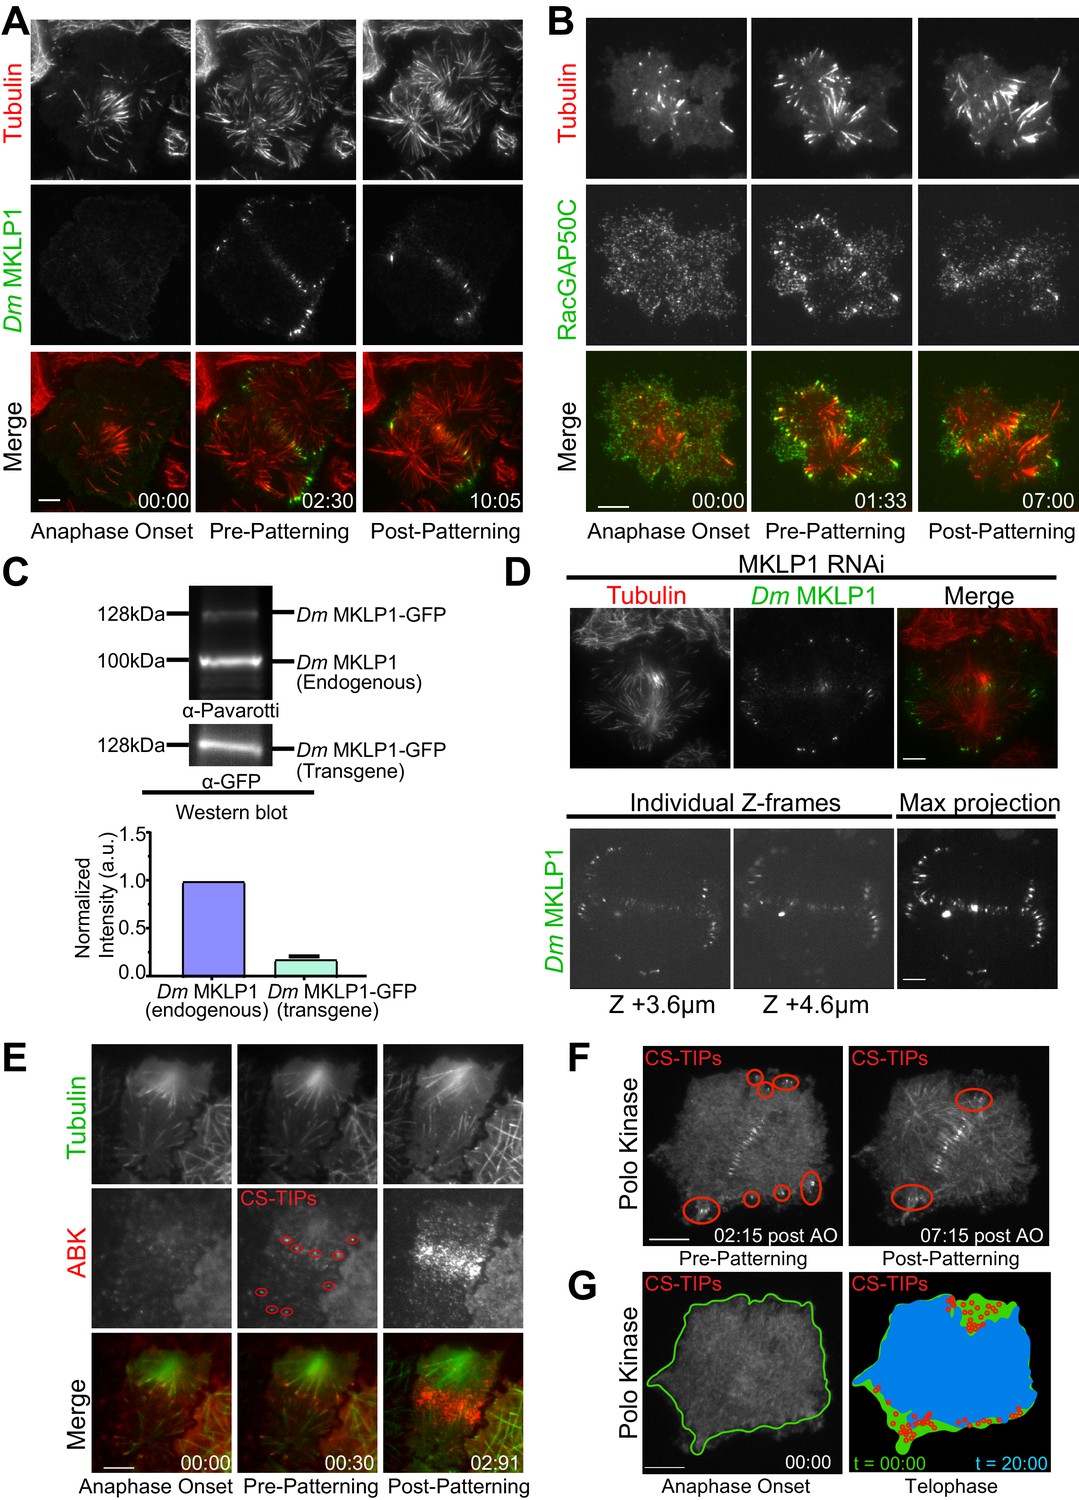
Dm MKLP1, RacGAP50C, ABK, and polo kinase localize to CS-TIPs and the midzone.
(A) Selected still frames from the live-cell TIRF movies showing Dm MKLP1-EGFP (green) localization to the plus-tips of polar and equatorial MTs (red) within 2.30 min. of anaphase onset. Dm MKLP1-EGFP gets patterned on the equatorial MTs after ∼10 min. (the last panel). (B) Selected still frames from the live-cell TIRF movies showing RacGAP50C-EGFP (green) localization to the plus-tips of polar and equatorial MTs (red) within 1.33 min. of anaphase onset. The last panel shows patterning of RacGAP50C-EGFP mainly on the equatorial MTs. (C) A representative western blot showing expression of Dm MKLP1 transgene and its endogenous counterpart; bar graph shows quantitation of Dm MKLP1 intensity from the western blot shown above and other similar blots (bottom). (D) Still images from live-cell TIRF microscopy showing Dm MKLP1-EGFP localization to the MT plus-tips and midzone in cells where endogenous Dm MKLP1 was depleted (top); selected Z-frames from spinning disk confocal z-sections showing Dm MKLP1-EGFP localization towards the dorsal surface (up to 4.6 µm) and throughout the cell volume. (E) ABK (red) localizes to the plus-tips of polar and equatorial MTs (green) within 30 s. of anaphase onset. The last panel shows ABK localization to the equatorial and midzone MTs. (F) A representative image showing Polo localization to the CS-TIPs (red regions) within 02:15 min. of anaphase onset (AO) and then patterning on the equatorial MT tips. (G) Images are arranged to simulate a time-series of the events for Polo kinase that occurred during anaphase/telophase. Outline of the cell cortex at anaphase onset (t = 00:00) is marked in green. In the next image, red circles represent the position of CS-TIPs that appeared over the time-series; the blue region indicates the edge of the soluble Polo-EGFP signal after 20:00 minutes; while the green fills the space to the original cell outline (green line). The membrane invaginates where CS-TIPs contact the cortex as evident in the overlay of the cell periphery (blue) relative to the cell boundary at anaphase onset (green). Figure 1A–D: zero-time points (00:00) indicate anaphase onset, the next time points indicate the onset of the decoration of cytokinesis regulatory proteins (MKLP1, RagGAP50C, ABK, Polo kinase) on both the polar and equatorial MTs (pre-patterning), and the last time points refer to the time when the vast majority of polar CS-TIPs are lost and are retained on the equatorial MTs (post-patterning). n ≥ 25 for every condition, at least three independent experiments were performed. Time: mins:secs. Scale bars, 10 μm.
Figure 1—figure supplement 1
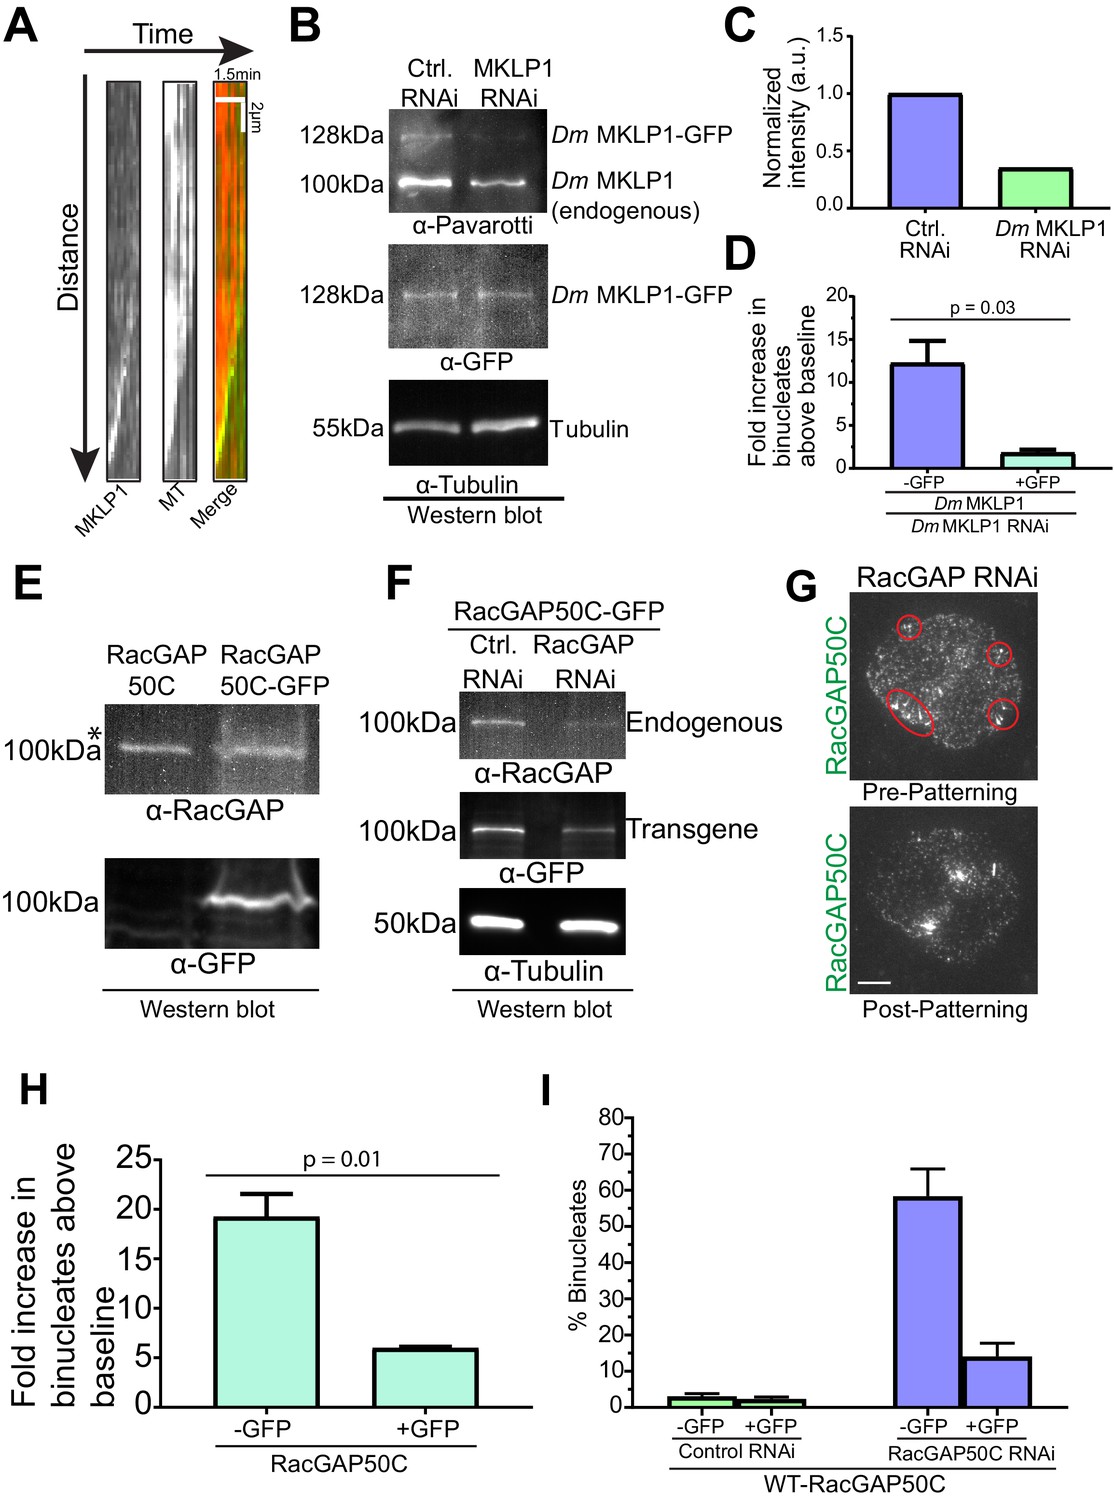
Depletion phenotypes of Dm MKLP1 and RacGAP50C are rescued by expression of their respective transgenes.
(A) Kymographs of MKLP1 tip tracking (left) and microtubule polymerization (middle) were generated from time-lapse TIRF microscopy (Video 2). In the merged image the MT is red and the Dm MKLP1 is green. Scale bars, 2 µm, time: 1.5 min. (B) RNAi was performed to deplete endogenous Dm MKLP1, a representative western blot is shown here. Note the partial depletion of Dm MKLP1-GFP transgene as well. (C) Quantitation of Dm MKLP1 intensity from the western blot shown in Figure 1—figure supplement 1B. Intensity of only the endogenous protein was measured for control RNAi, while intensity of both the endogenous MKLP1 and GFP-tagged MKLP1 was summed for the Dm MKLP1 RNAi condition. (D) Expression of the Dm MKLP1 transgene (+GFP) rescues the binucleate phenotype resulting from depletion of endogenous Dm MKLP1 (-GFP), n = 493, data pooled from two experiments. (E) Western blot showing expression of RacGAP50C (endogenous) and RacGAP50C-EGFP (transgene). *Please note the endogenous copy of RacGAP50C runs higher than its expected size (75 kDa). However, the RacGAP50C-EGFP transgene runs at the expected size (100 kDa). Western blots performed with two different antibodies against RacGAP50C gave the same results. (F) Western blots showing depletion of endogenous RacGAP50C. Please note partial depletion of transgene (RacGAP50C-EGFP) in this and all the blots. (G) RacGAP50C-EGFP localizes to the midzone MTs and is patterned on MT +TIPs normally when endogenous RacGAP50C is depleted; red circles indicate localization of RacGAP50C-EGFP on the MT +TIPs. (H) Depletion of endogenous RacGAP50C results in ∼20 fold increase in binucleates; expression of RacGAP50C-EGFP (+GFP) rescues the binucleate phenotype to a large extent. (I) Data presented in Figure 1—figure supplement 1H is now shown here in terms of % binucleates for clarity. Bar graph shows reduction in % binucleates when RacGAP50C (+GFP) is expressed following endogenous RacGAP50C depletion. Error bar: Mean ± SD. Two-tailed Student’s t- test p-values are reported.
Figure 2
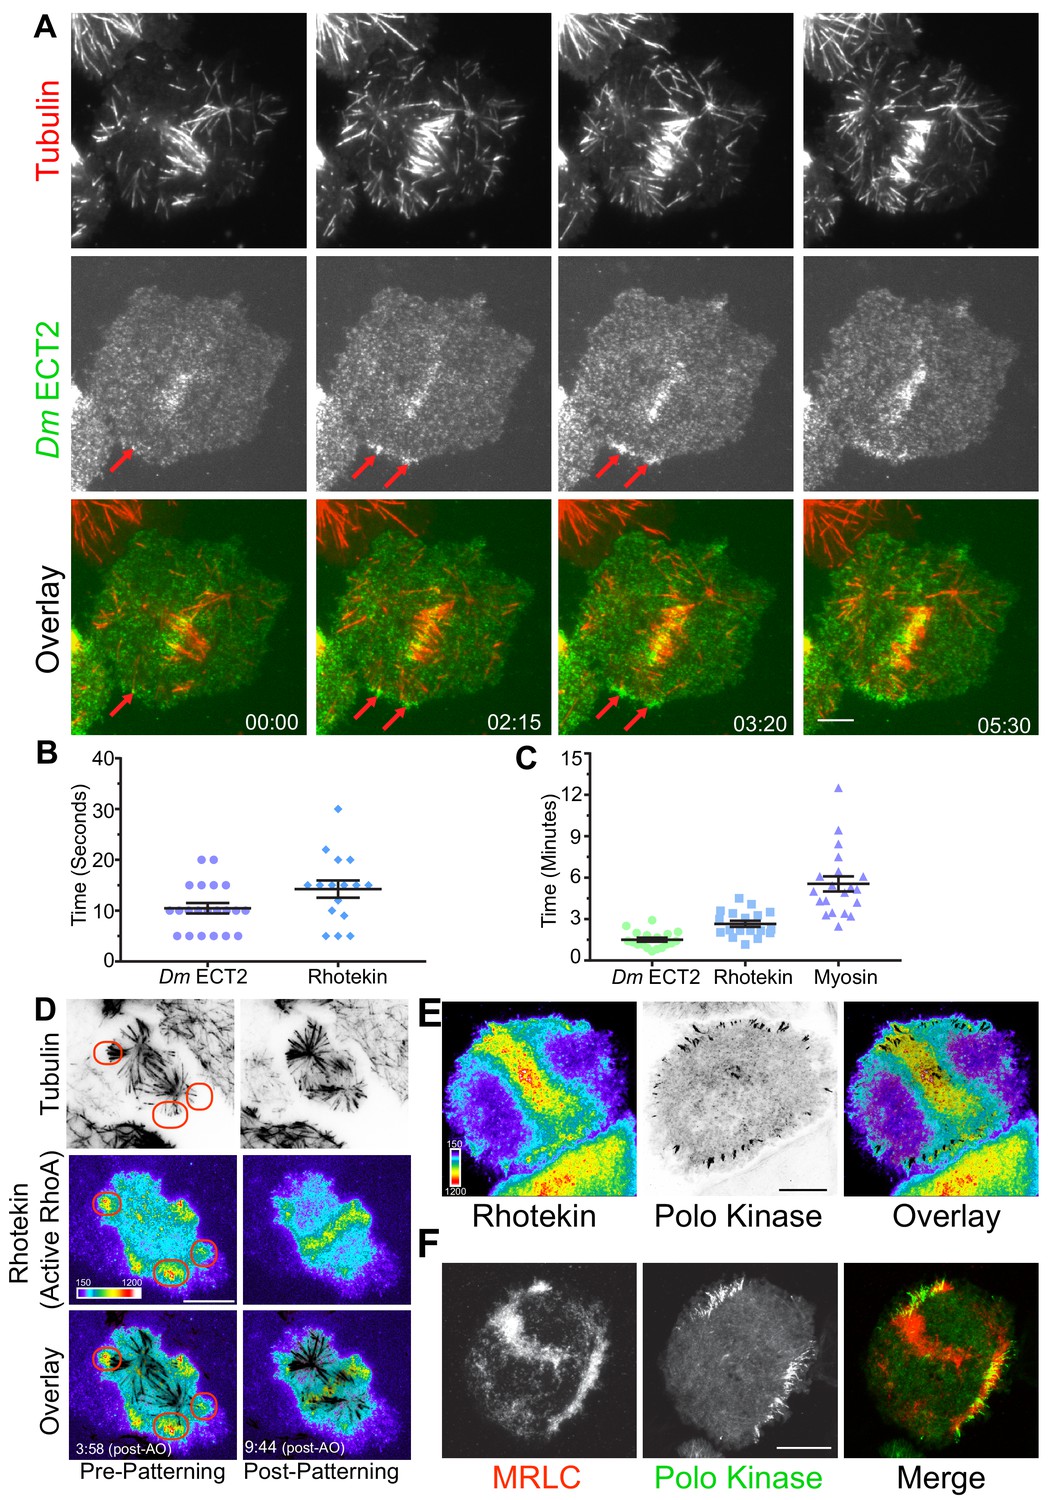
MT plus-tips recruit Dm ECT2 (Pebble) upon contact leading to RhoA activation and myosin accumulation.
(A) Representative TIRF micrographs showing Dm ECT2 (green) recruitment to cortical locales (red arrows) physically contacted by astral MT (red) plus-tips. Dm ECT2 localization (time-point 00.00) is followed by auto-amplification (later time-points) near the equatorial cortex. n = 23. (B) Dot plots show first appearance of Dm ECT2 (10.48 secs ± 1.03, n = 21), and Rhotekin (14.25 secs ± 1.68, n = 16) after MTs contact the cortex. Error bars: Mean ± SEM. (C) Dot plots show average peak accumulation timings of Dm ECT2 (1.5 ± 0.14 mins, n = 18); RhoA (2.5 ± 0.2 mins, n = 18); and MRLC (5.5 mins ± 0.54, n = 19) following initial contact by astral MT plus-tips, Error Bars: Mean ± SEM. (D) Rhotekin is enriched at astral plus-tips in both polar and equatorial regions during the time period prior to CS-TIP patterning and becomes restricted to equatorial tips when patterning typically occurs. In this cell, MT plus-tip-signaling is detectable prior (3:58) to robust midzone RhoA activation (9:44). Red ovals denote polar signaling TIPs prior to patterning onto equatorial MTs. (E) Polo-positive CS-TIPs activate cortical RhoA (Rhotekin) upon contact during cytokinesis. (F) Polo-positive CS-TIPs trigger cortical contractility as evidenced by co-localized MRLC accumulation. Time: mins:secs. Color wedge displays pixel values from 150 to 1200. Scale bars, 10 µm (B, C, and D), 5 µm (A).
Figure 3 with 1 supplement
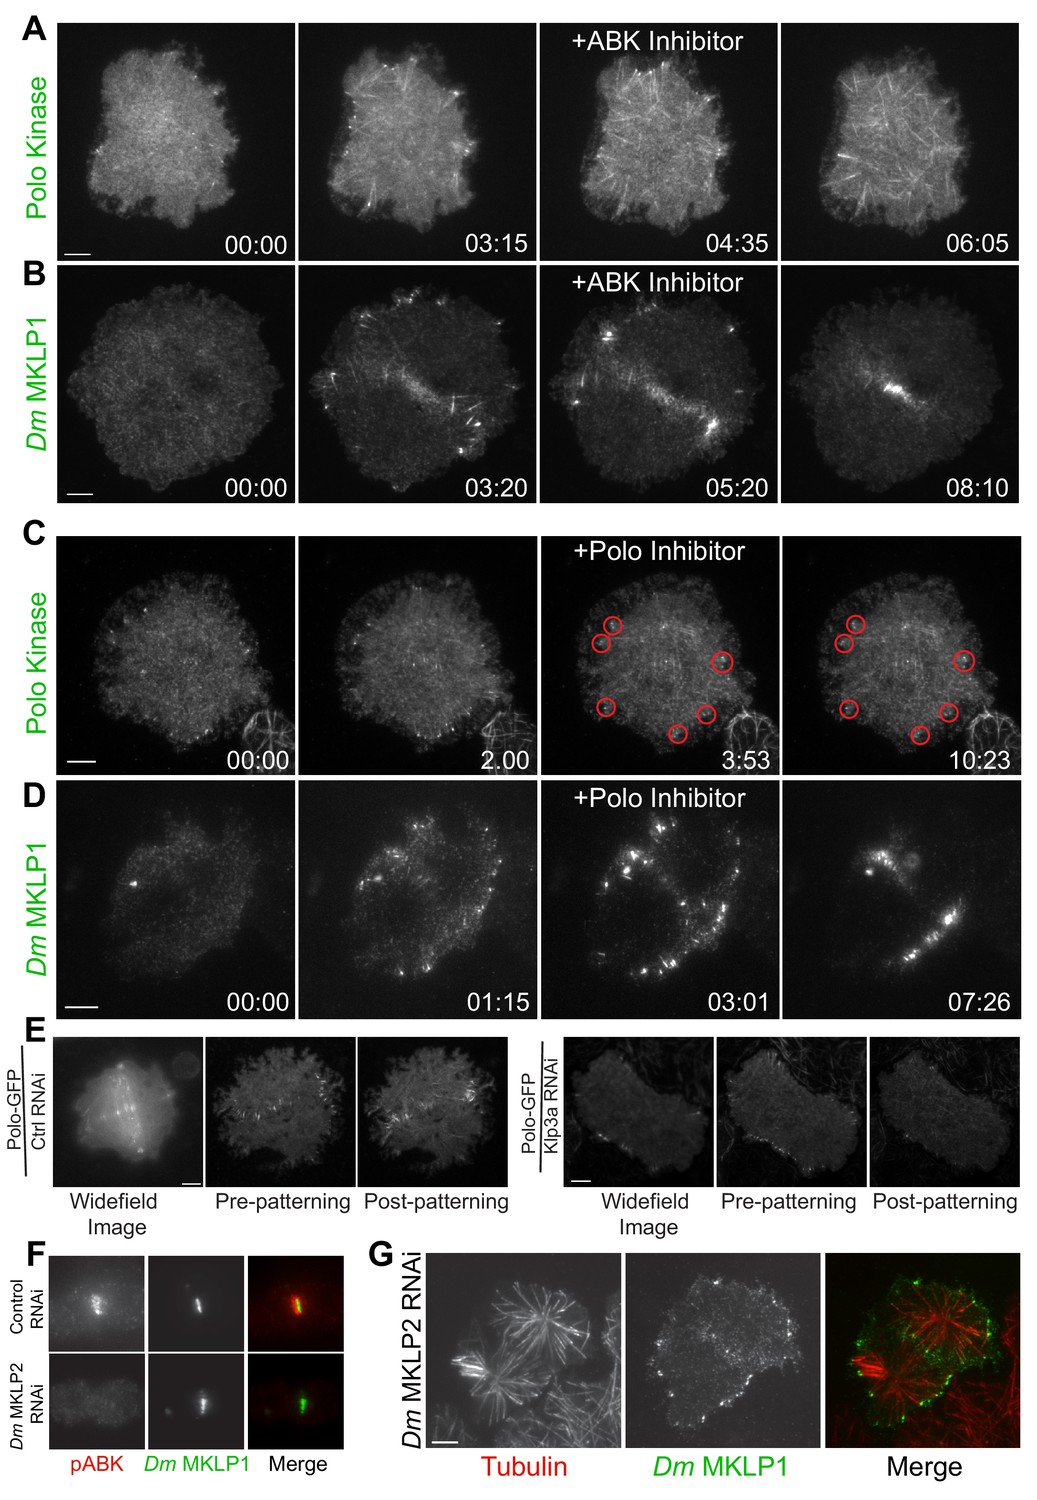
Plus-tip localization of CS-TIP components requires ABK activity, but not Polo kinase activity or midzone-localized ABK.
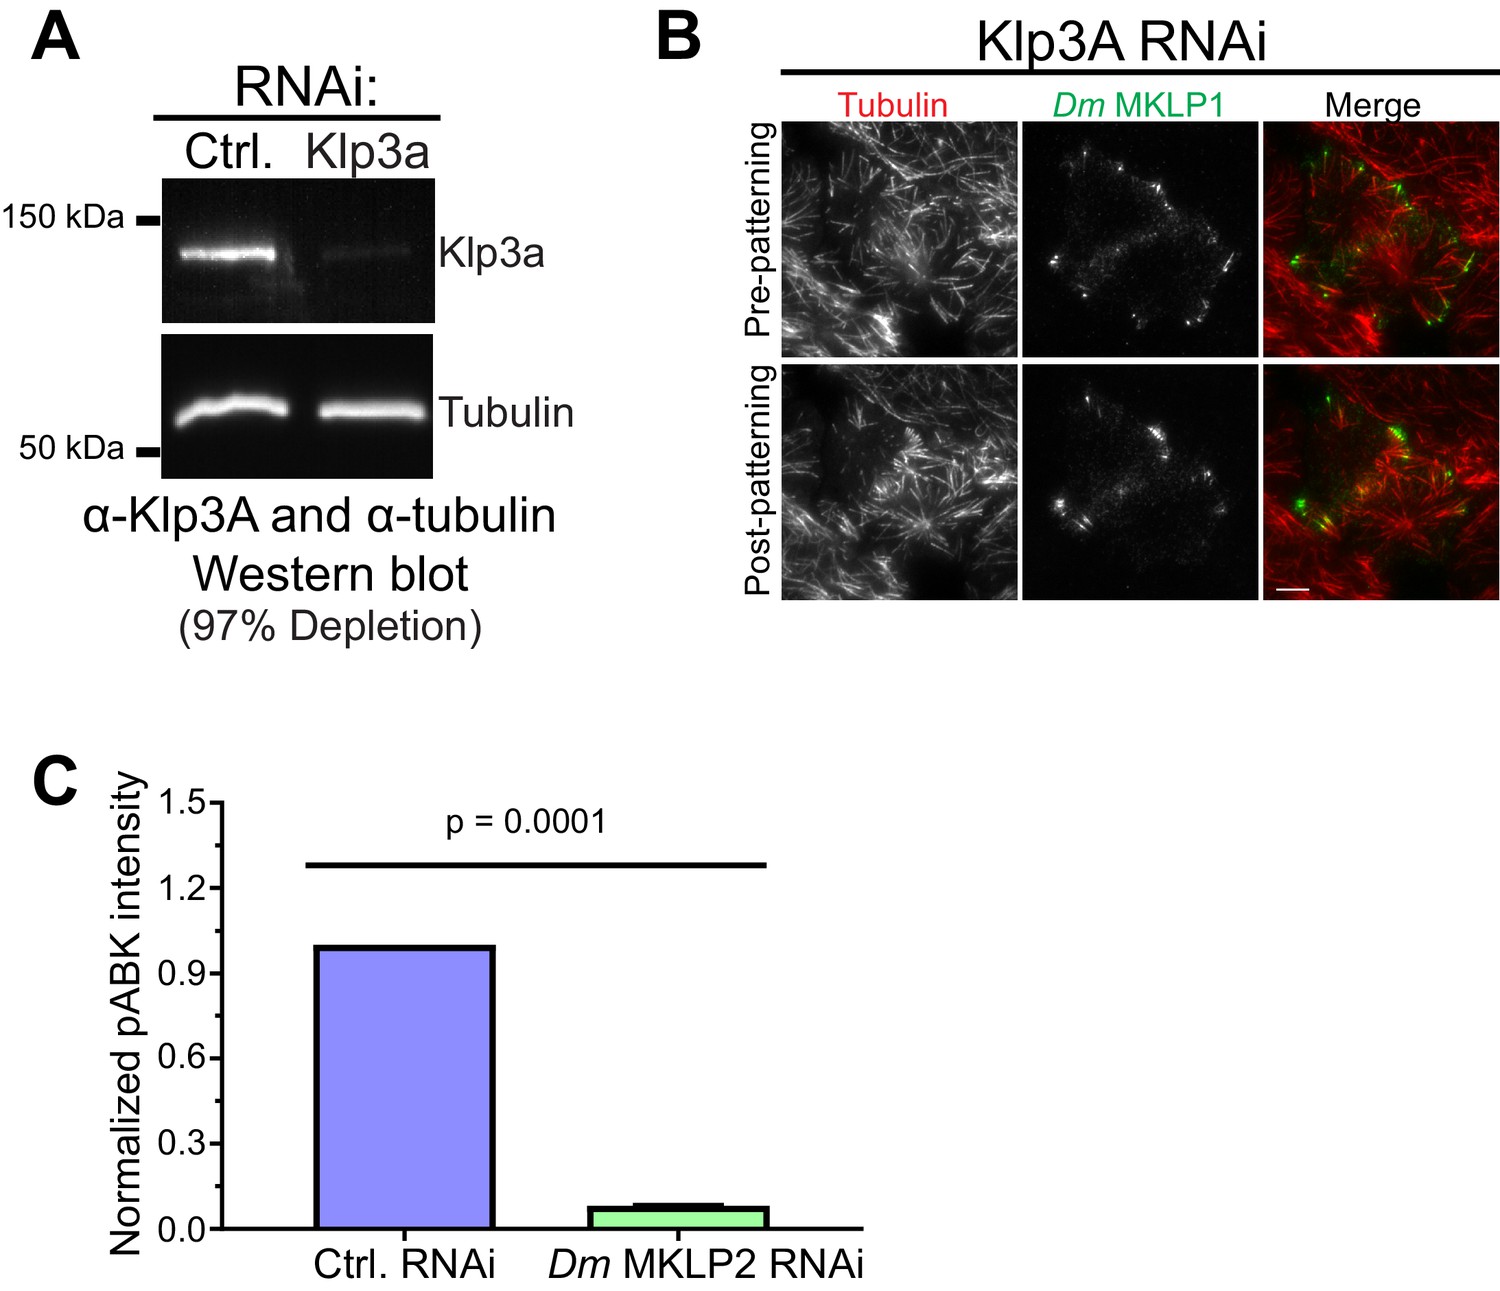
(A, B) Polo and Dm MKLP1 are rapidly lost from CS-TIPs following wash-in of the ABK inhibitor Binucleine 2. Zero time-points indicate anaphase onset, 04:35 and 05:20 time-points indicate the time of Binucleine 2 addition. n = 12. (C, D) Polo and Dm MKLP1 remain localized to the CS-TIPs following wash-in of the Polo kinase inhibitor BI 2536. Zero time-points indicate anaphase onset, 03:53 and 03:01 time-points indicate the time of BI 2536 addition. n = 10. (E) Control cells show normal localization of Polo-EGFP on the CS-TIPs and midzone (left). Depletion of Dm Kinesin-4 (Klp3A) results in loss of Polo kinase from the midzone, but not from the CS-TIPs (Right). The first image is a representative frame from a wide-field movie, while last two images are representative frames from a live-cell TIRF movie for control and Klp3A depletion. n = 25. (F) Depletion of Dm MKLP2 leads to loss of active phosphorylated ABK (pABK) at the midzone (left panel), yet Dm MKLP1 assembles on CS-TIPs normally (right panel). n = 30. Time: mins:secs. Scale bars, 5 µm (C, D, and E), 10 µm (A, B, and F).
Figure 3—figure supplement 1
Klp3A depletion does not affect CS-TIPs or midzone localization of Dm MKLP1.
(A) Western blot showing depletion of Dm Kinesin-4 (Klp3A) in cells expressing Polo-EGFP. (B) Still images from live-cell TIRF microscopy showing Dm Kinesin-4 (Klp3A) depletion does not affect CS-TIPs or midzone localization of Dm MKLP1. (C) Quantification of midzone-localized pABK intensity in control and Dm MKLP2 depleted cells, n = 25, Error bar: Mean ±SEM. Student’s t-test two-tailed p-value is reported.
Figure 4
Satellite MT arrays provide additional cortical-proximal signaling platforms.
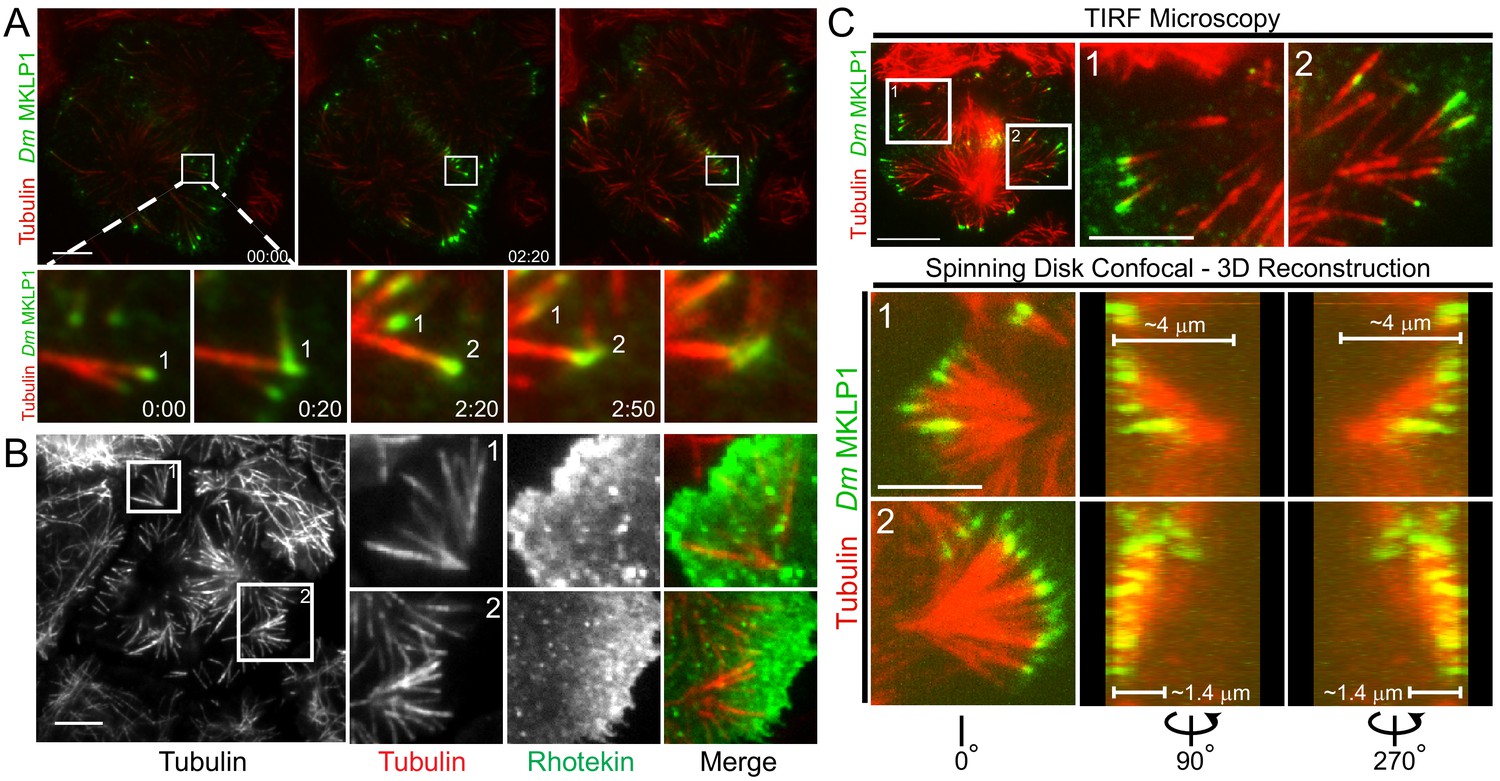
(A) Representative frames from a TIRF time-lapse of Dm MKLP1-EGFP (Video 2), (top panel). Inset shows enlarged midzone region (bottom panel). Two CS-TIP bundling events (labeled 1 and 2) are visible at the equatorial cortex. The CS-TIPs start at oblique angles, become organized into antiparallel bundles with localized Dm MKLP1, and are pushed inward. (B) Representative frames from a TIRF time-lapse movie of Tag-RFP-T-α-tubulin and EGFP-Rhotekin (left). Inset 1 and 2 show satellite MT arrays where Rhotekin is enriched in the vicinity of MT plus-tips (right). (C) In the TIRF mode, MTs were visible both in and out of the TIRF field (See inset 1 and 2 of the top panel), therefore, correlative TIRF-spinning disk confocal microscopy was performed to observe the MTs that were outside of the TIRF Field (bottom panel). Lower panels display the astral brushes highlighted in inset 1 and inset 2 from different angles of the 3-D reconstruction (left is 0°, middle is 90°, and right is 270°). The 90° and 270° views revealed that the astral brush in inset 1 extends downward from a vertex ~4 µm away from the ventral surface while the brush in inset 2 originated closer (~1.4 μm) to the ventral cortex. Time: mins:secs. Scale bars, 5 μm, 10 μm.
Figure 5 with 2 supplements
EB1 and a ‘’PTIV’’ motif in RacGAP50C are required for robust centralspindlin localization to MT plus-tips and efficient cytokinesis.
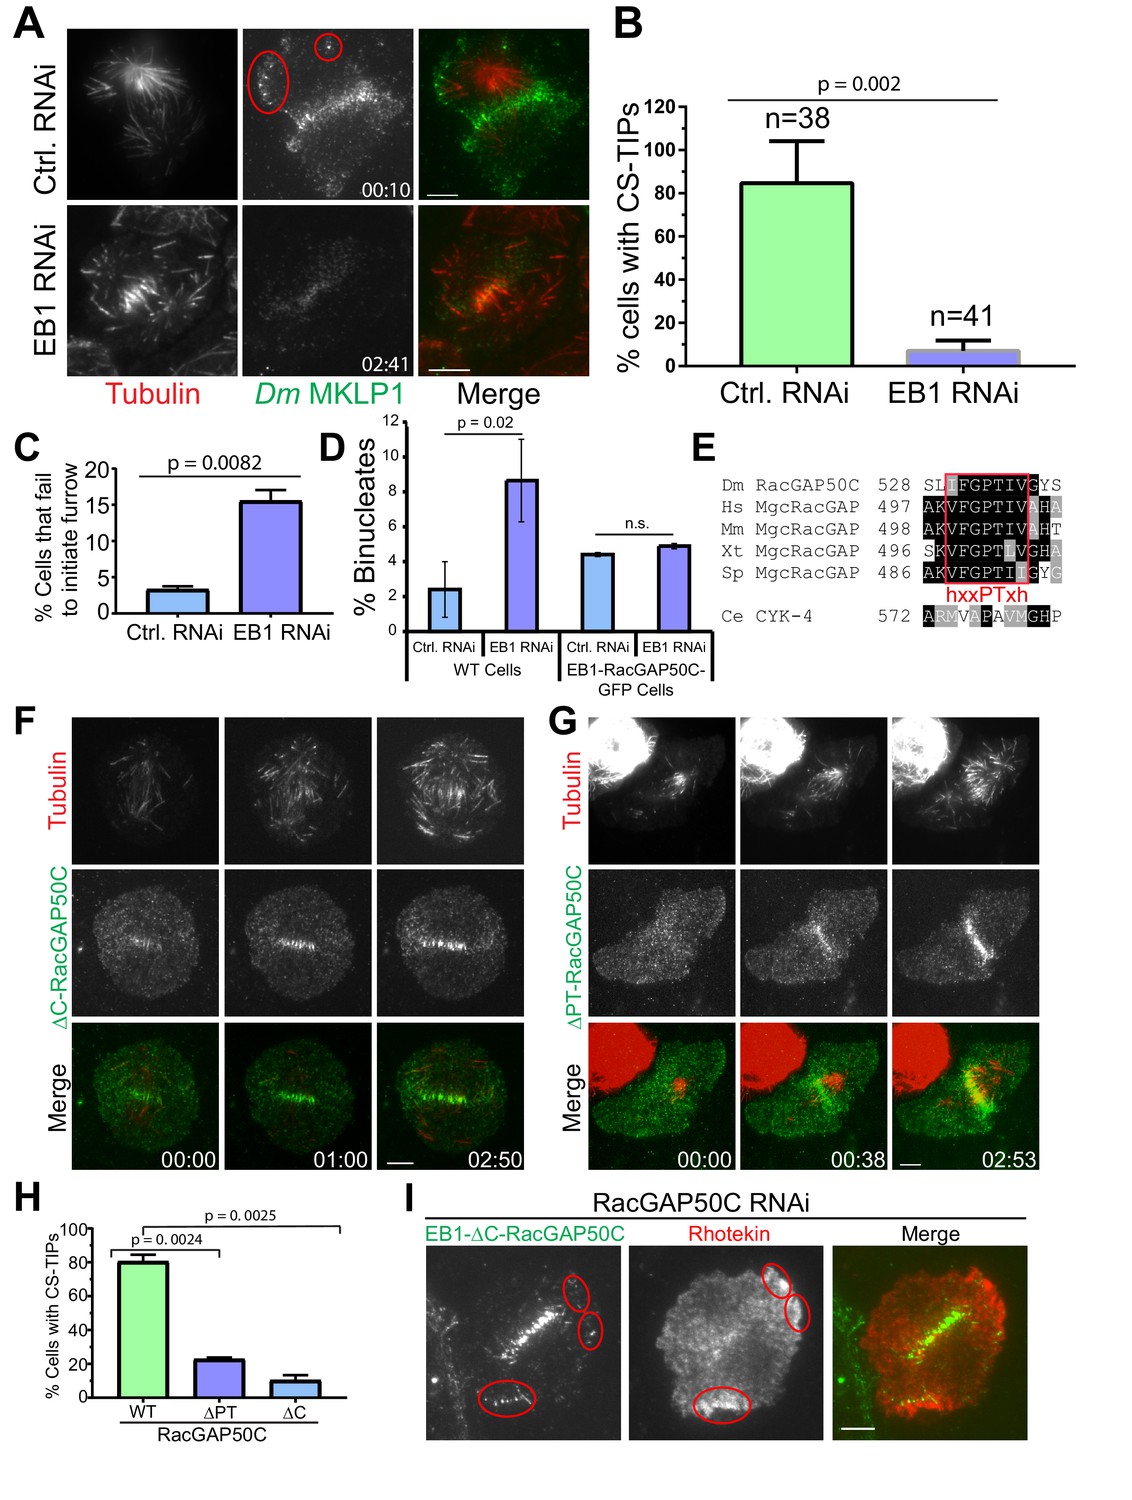
(A) TIRF micrographs showing loss of CS-TIPs assembly in cells depleted of EB1 (bottom panel); control cells show normal CS-TIPs localization (top panel). (B) Quantitation of CS-TIPs assembly in control and EB1 depleted cells (observed in both Polo and Dm MKLP1-EGFP-expressing cells; two experiments each, n = 38 and 41 for control and EB1 depleted cells respectively) (C) Quantitation of cells that fail to initiate furrowing in control and EB1 RNAi cells. n = 120 and 110 for control and EB1 RNAi cells respectively, Error bars = Mean ± SD. (D) Quantitation of binucleated cells in control and EB1 RNAi conditions in WT cells (n = 3 independent experiments; n = 570 and 603 cells counted in total for control- and EB1 RNAi-treated cells respectively) and cells expressing an EB1-RacGAP50C-EGFP hybrid (n = 2 independent RNAi experiments; n = 431 and 550 cells counted in total for control- and EB1 RNAi-treated cells respectively). (E) The putative hxxPTxh motif (IFGPTIV) in RacGAP50C is highly conserved although key residues in the motif are different in C. elegans. (F, G) Deletion of C-terminus or ‘’PTIV motif’’ in RacGAP50C disrupts MT plus-tip enrichment, but not midzone or cortical localization. (H) Quantitation of CS-TIPs assembly in cells expressing WT (n = 21), ∆PTIV (n = 26), or ∆C-RacGAP50-EGFP (n = 20), three experiments each, Error bars: Mean ± SD. (I) Still frames from live-cell TIRF microscopy showing RhoA activation in the vicinity of CS-TIPs in a cell expressing EB1-∆C-RacGAP-EGFP fusion protein and depleted of endogenous RacGAP50C. Student’s t-test two-tailed p-values are reported, not significant (n.s.) is a p-value>0.05. Error bars: Mean ± SD. Scale Bars, 5 μm.
Figure 5—figure supplement 1
Effects of EB1 depletion on spindle length, RhoA activation, and cytokinesis.
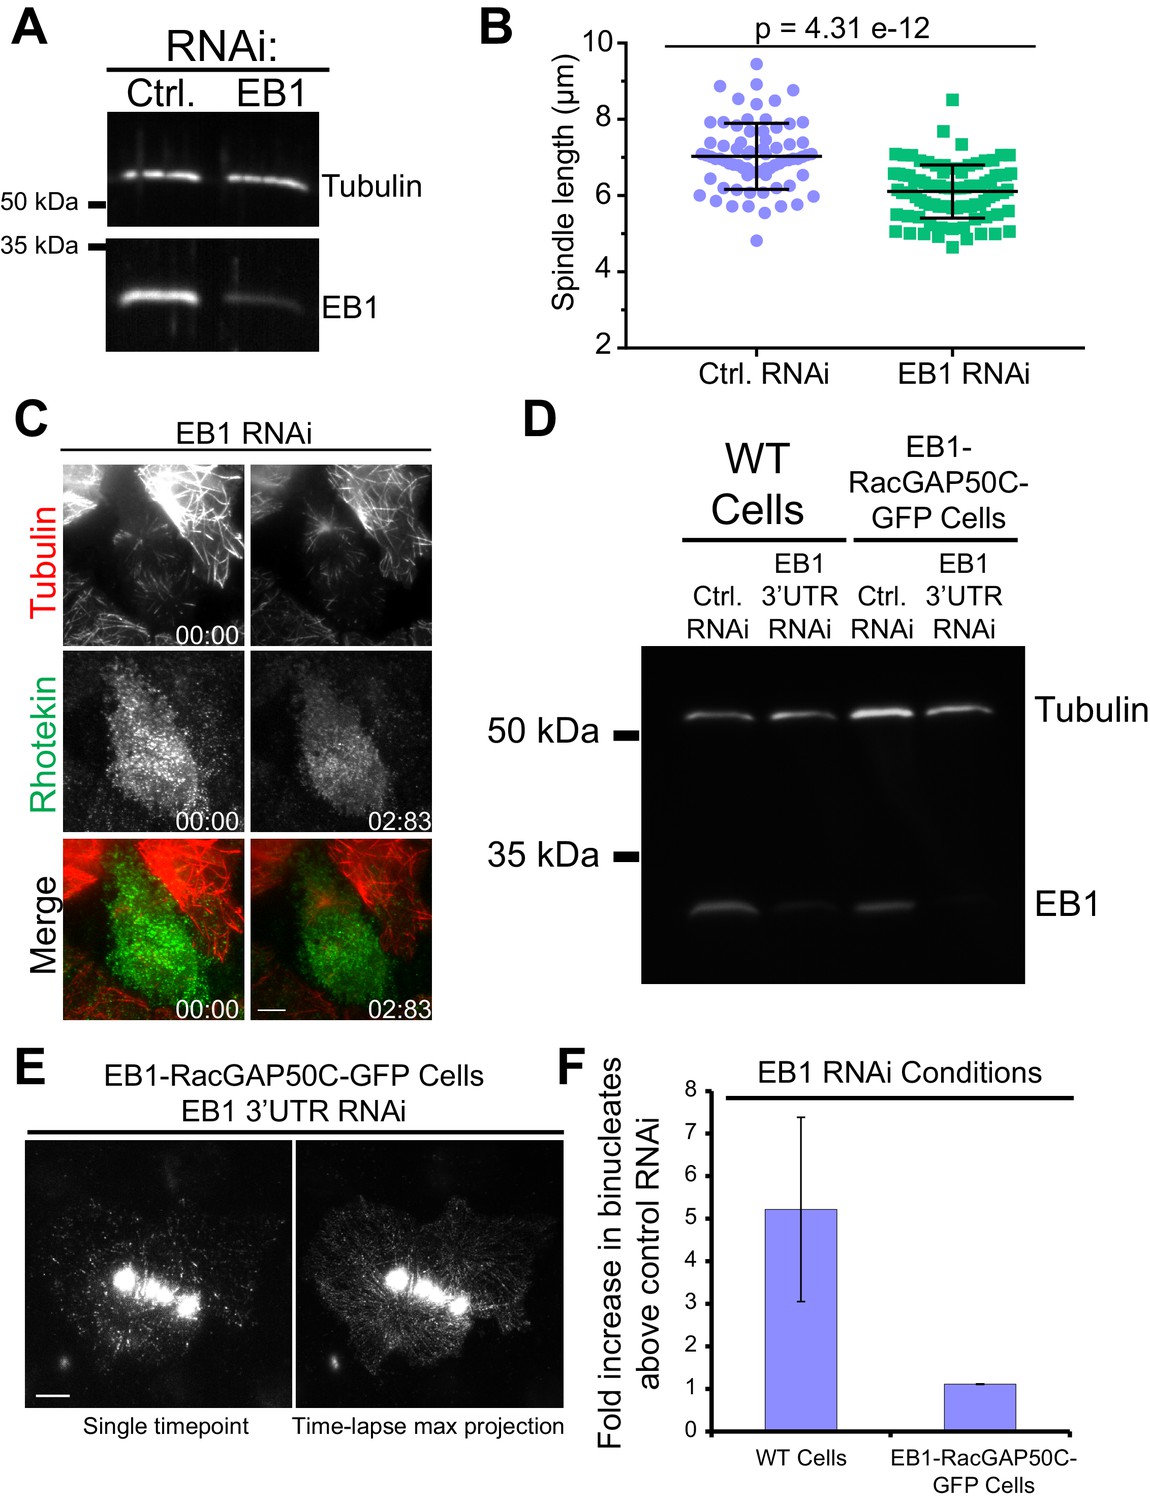
(A) Western blot showing depletion of EB1 in cells expressing Dm MKLP1-EGFP. (B) EB1 depletion results in shorter spindle; dot plots showing the average spindle length for control RNAi (7.0 ± 0.86 µm, n = 87) and EB1 RNAi (6.1 ± 0.69 µm, n = 73). Error Bars are S.D., two-tailed p-value from Student’s t-test is shown. (C) Depletion of EB1 results in loss of RhoA activation near MT plus-tips; but a distinct midzone region of RhoA activation is still visible in most of the cells. (D) Western blot analysis of EB1 and tubulin (loading control) from WT cells and EB1-RacGAP50C-EGFP expressing cells treated with control RNA or dsRNA targeting the 3’ UTR of the endogenous EB1 transcripts. (E) Representative images of a TIRF-microscopy time-lapse (left: single time-point; right: max-projection of the entire time-lapse) of a mitotic cell showing that the EB1-RacGAP50C-GFP plus-tip-tracks following depletion of the endogenous EB1. (F) Average fold increase in binucleates in EB1-depleted cells relative to the control RNAi condition in WT (three independent experiments) versus EB1-RacGAP50C-EGFP-expressing cells (two independent experiments). Error bars are SD (B) and SEM (F). Scale bars are 5 μm.
Figure 5—figure supplement 2
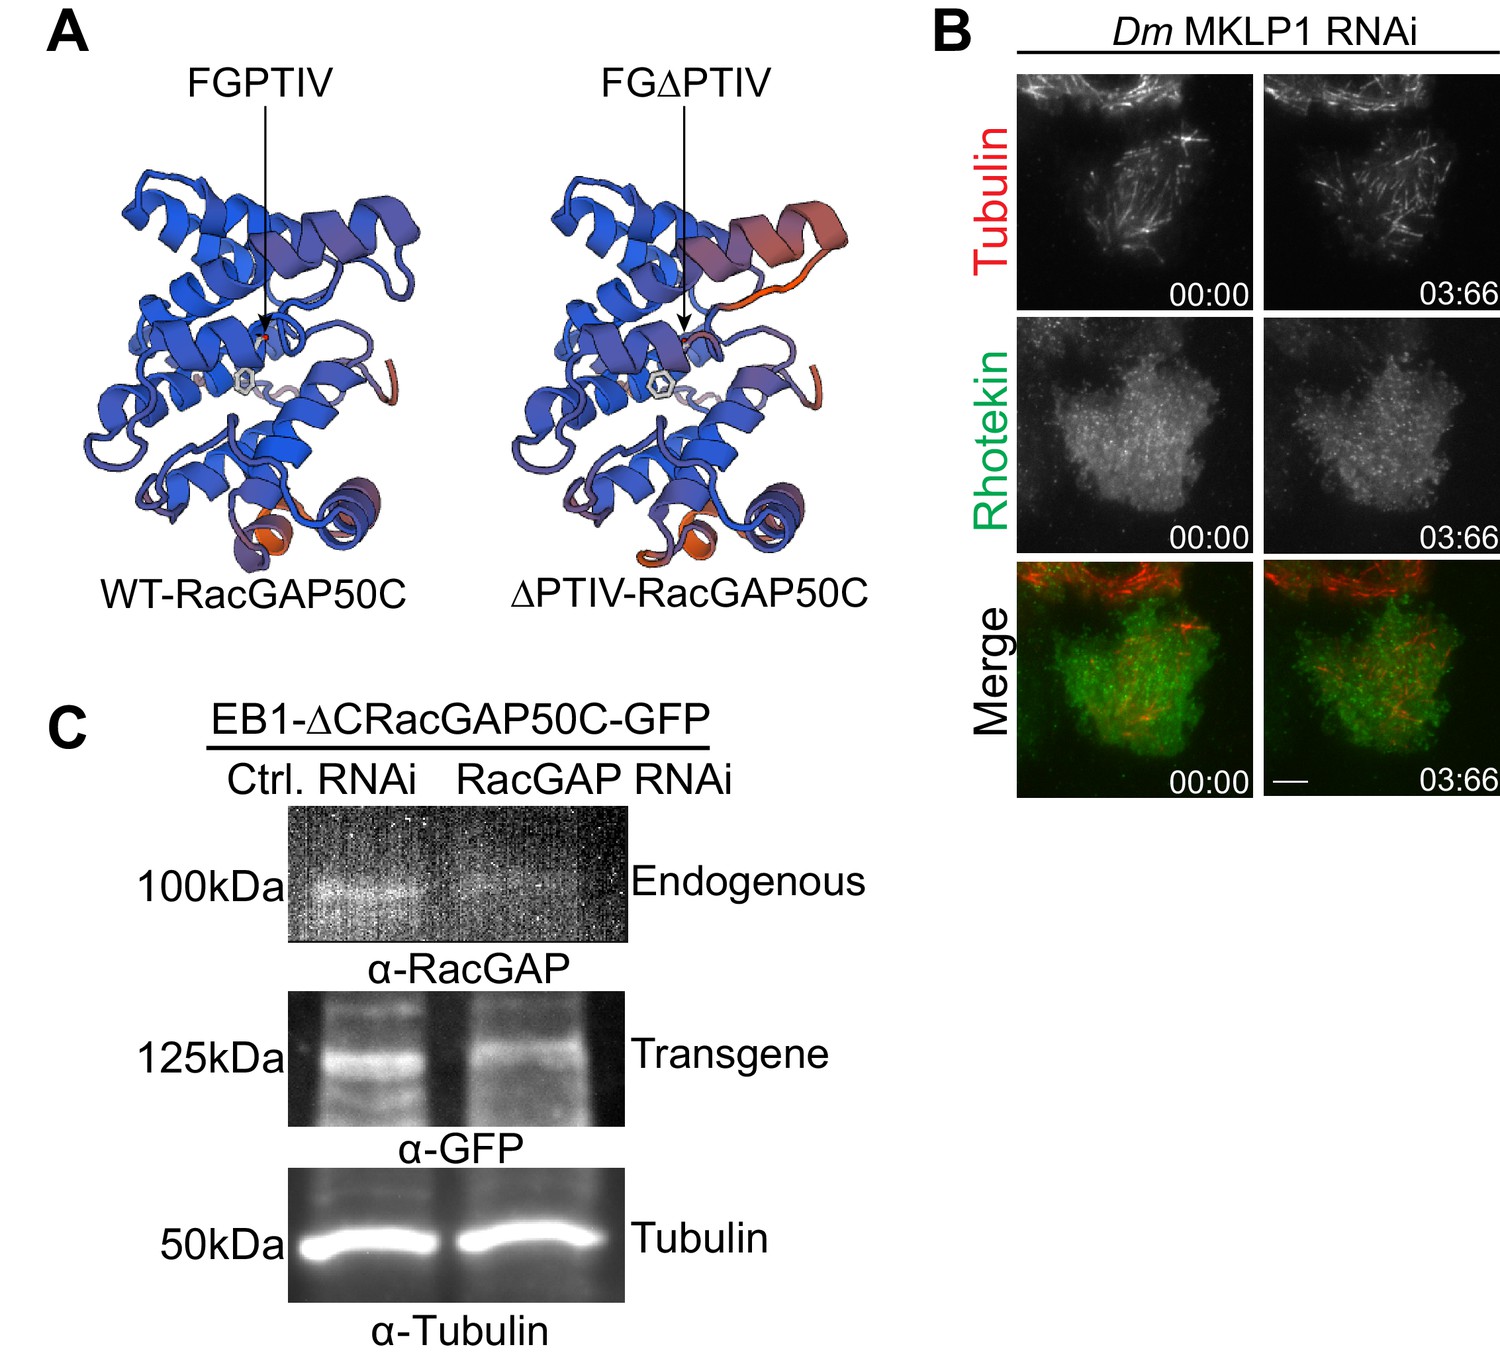
Investigating contribution of centralspindlin to spatial RhoA activation cues.
(A) Homology structure modelling of WT-RacGAP50C and ∆PTIV-RacGAP50C. Structures were generated using Rac GTPase-activating protein 1 (2ovj. 1. A) as a template in the SWISS-MODEL. Arrow heads indicate the position of the hxxPTxh motif (IFGPTIV) in Drosophila RacGAP50C. (B) Depletion of Dm MKLP1, which co-depletes RacGAP50C, results in complete loss of RhoA activation from CS-TIPs and the midzone.(C) Western blot showing depletion of endogenous RacGAP50C for the data shown in Figure 5I.
Figure 6
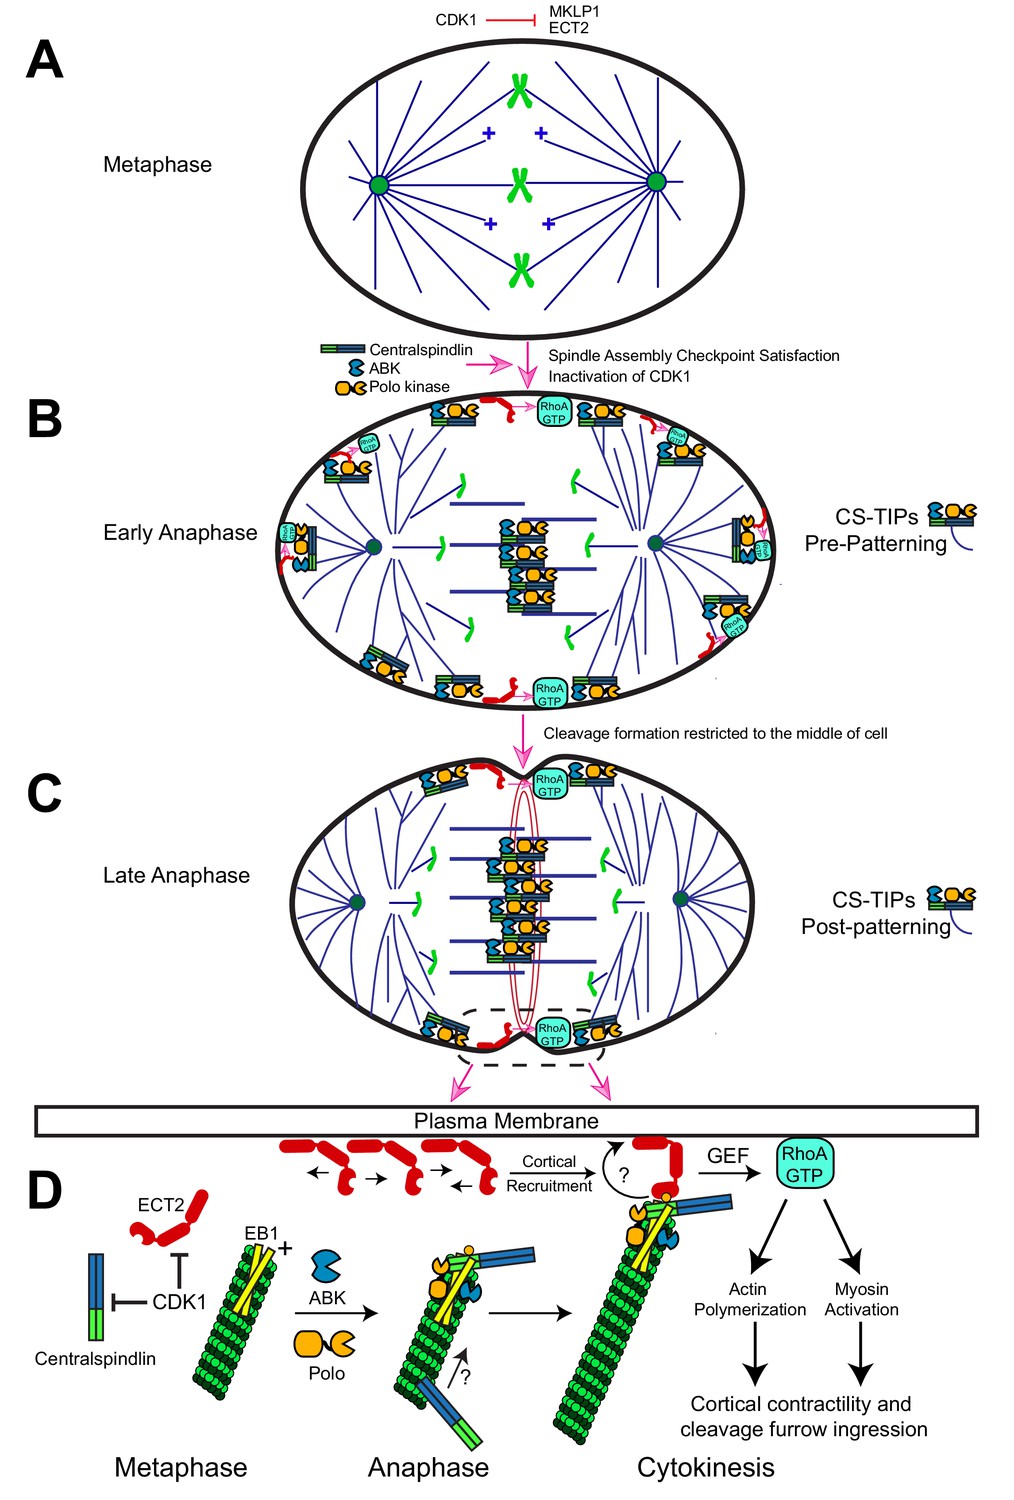
Description of the CS-TIP patterning phenomenon and a model for how CS-TIPs activate RhoA during cytokinesis.
(A) Phosphorylation of MKLP1 by CDK1 during metaphase impedes its association with the spindle MTs. (B) As cells progress into anaphase, CDK1 activity drops, resulting in loss of MKLP1 phosphorylation and binding of MKLP1 to spindle MTs. Within 2–3 min. of anaphase onset, the centralspindlin complex, ABK, and Polo kinase decorate the plus-tips of polar and equatorial astral MTs. CS-TIPs locally activate RhoA by recruiting ECT2 after physically contacting the cortex. (C) A phenomenon that we refer to as CS-TIP patterning occurs ~10 min. post anaphase onset and involves loss of CS-TIPs from the polar astral MTs and retention on the equatorial MT plus-tips thereby supporting equatorial assembly of an actomyosin ring. (D) Model for how CS-TIPs trigger cortical contractility. High CDK1 activity in metaphase prevents centralspindlin binding to MTs and ECT2 enrichment on the plasma membrane. When CDK1 activity drops ECT2 becomes enriched at the plasma membrane and centralspindlin, ABK, and Polo kinase assembles onto CS-TIPs. Robust MT plus-tip localization of Polo kinase and centralspindlin requires EB1. The plus-tip-localization of centralspindlin also requires the C-terminus of RacGAP50C and a putative EB1 interaction motif therein. The plus-end directed motility of Dm MKLP1 may also contribute to centralspindlin’s tip localization (arrow and question mark). Polo-phosphorylated (yellow circle) RacGAP50C on CS-TIPs directly binds to cortical ECT2 leading to its rapid recruitment to contact sites and amplification via unknown feedback mechanisms (curved arrow and question mark). The GEF activity of ECT2 locally generates active RhoA-GTP at the cortex leading to actin polymerization and myosin activation to promote cortical contractility and cleavage furrow ingression.
Videos
Video 1
Con A coated coverslips do not affect early events of cytokinesis.
Video shows overnight imaging of Drosophila S2 cells on a Con A coated dish, expressing Tag-RFP-T-α-tubulin. There are two diving cells (marked 1 and 2) in this field of view. One cell divided normally (cell number 1), while the other cell ingressed normally but regressed after sometime (cell number 2). Frames were acquired at 4 min. intervals on a Nikon Eclipse Ti-E - TIRF microscope. The playback rate is 10 frames per second. Time: mins:secs. Scale bar, 5 μm.
Video 2
Dm MKLP1-EGFP localizes to the CS-TIPs of polar and equatorial MTs.
Video shows co-expression of Dm MKLP1-EGFP (green) and Tag-RFP-T-α-tubulin (red) in S2 cells. Dm MKLP1-EGFP decorates the polar and equatorial CS-TIPs within ~2–3 min. of anaphase onset before becoming patterned onto equatorial MTs (~7–10 min.). Dm MKLP1-EGFP is also visible on the growing MT plus-tips and the central spindle. Frames were acquired at 10 s. intervals on a Nikon Eclipse Ti-E - TIRF microscope. The playback rate is 10 frames per second. Time: mins:secs. Scale bar, 5 μm.
Video 3
RacGAP50C-EGFP localizes to the CS-TIPs of polar and equatorial MTs.
Video shows co-expression of RacGAP50C-EGFP (green) and Tag-RFP-T-α-tubulin (red) in S2 cells. RacGAP50C-EGFP decorates the CS-TIPs within ~2 min. of anaphase onset before becoming patterned onto equatorial MTs. RacGAP50C-EGFP is also visible on the growing MT plus-tips and the central spindle. Frames were acquired at 5 s. intervals after anaphase onset on a Nikon Eclipse Ti-E - TIRF microscope. The playback rate is 10 frames per second Time: mins:secs. Scale bar, 5 μm.
Video 5
Dm MKLP1-EGFP localization to the MT +TIPs can be obsrved throughout the cell volume.
Video shows co-expression of Dm MKLP1-EGFP (green) and Tag-RFP-T-α-tubulin (red) in S2 cells. Spinning disk confocal microscopy was employed to visualize Dm MKLP1-EGFP localization towards the dorsal side of the cell. Assembly of Z-sections reveal Dm MKLP1-EGFP localization to the MT +TIPs towards the dorsal side and throughout the cell volume. 0.2 µm confocal z-sections were taken on a Nikon Eclipse Ti-E spinning disk confocal microscope.
Video 4
Polo kinase localizes to the CS-TIPs and triggers cortical contractility.
Video shows the expression of Polo-EGFP in S2 cells. Polo-EGFP localizes to the CS-TIPs, central spindle, and interphase MTs. Cortical contractility and membrane invagination is clearly visible in the regions where CS-TIPs contact the cortex. Frames were acquired at 15 s. intervals on a Nikon Eclipse Ti-E - TIRF microscope. The playback rate is 10 frames per second. Time: mins:secs. Scale bar, 5 μm.
Video 6
Accumulation of Dm ECT2 (Pebble) on the CS-TIPs and its auto-amplification near the cortex.
Video shows co-expression of Dm ECT2-EGFP (green) and Tag-RFP-T-α-tubulin (red) in Drosophila S2 cells. Dm ECT2 localization to the CS-TIPs at t = 10.15, and its amplification between t = 10.15 and 12.45 is clearly visible around the cortex. Accumulation of Dm ECT2-EGFP on midzone MTs and cortex is also visible. Frames were acquired at 5 s. intervals after anaphase onset on a Nikon Eclipse Ti-E - TIRF microscope. The playback rate is 20 frames per second. Time: mins:secs. Scale bar, 5 μm.
Video 7
CS-TIPs activate RhoA.
Video shows co-expression of EGFP-Rhotekin (green) and Tag-RFP-T-α-tubulin (red) in Drosophila S2 cells. RhoA activation near the CS-TIPs is visible between t = 02:01 and 5:31. Cortical localization of Rhotekin-EGFP precedes its midzone localization. The midzone localization of Rhotekin-EGFP is visible between t = 5:31 and 07:31. Frames were acquired at 5 s. intervals after anaphase onset on a Nikon Eclipse Ti-E - TIRF microscope. The playback rate is 10 frames per second.Time: mins:secs. Scale bar, 5 μm.
Video 8
Polo-positive CS-TIPs activate RhoA.
Video shows co-expression of RFP-Rhotekin (red) and Polo-EGFP (green) in Drosophila S2 cells. In this movie, Polo-EGFP serves as a CS-TIP marker. RhoA activation near the polo positive CS-TIPs is visible between t = 01:36 and 6:36. Frames were acquired at 5 s. intervals after anaphase onset on a Nikon Eclipse Ti-E - TIRF microscope. The playback rate is 10 frames per second. Time: mins:secs. Scale bar, 5 μm.
Video 9
CS-TIPs trigger cortical contractility by myosin accumulation.
Video shows co-expression of myosin light regulatory chain (MRLC)-RFP (red) and Polo-EGFP (green) in Drosophila S2 cells. Myosin accumulation and cortical contractility near the polo positive CS-TIPs are visible between t = 02:00 and 13:16. Frames were acquired at 5 s. intervals on a Nikon Eclipse Ti-E - TIRF microscope. The playback rate is 10 frames per second. Time: mins:secs. Scale bar, 5 μm.
Video 10
ABK is required for CS-TIPs assembly.
Video shows the expression of Polo-EGFP in S2 cells. Addition of ABK inhibitor, Binucleine 2, between t = 03:15 and 04:35 results in disassembly of CS-TIPs. Frames were acquired at 15 s. intervals on a Nikon Eclipse Ti-E - TIRF microscope. The playback rate is 10 frames per second. Time: mins:secs. Scale bar, 5 μm.
Video 11
ABK is required for CS-TIPs assembly.
Video shows the expression of Dm MKLP1-EGFP in S2 cells. Addition of ABK inhibitor, Binucleine 2, between t = 04:10 and 6:10 results in disassembly of CS-TIPs. Frames were acquired at 10 s. intervals on a Nikon Eclipse Ti-E - TIRF microscope. The playback rate is 10 frames per second. Time: mins:secs. Scale bar, 5 μm.
Video 12
Polo kinase is not required for CS-TIPs assembly.
Video shows the expression of Polo-EGFP in S2 cells. Addition of Polo inhibitor, BI 2536, between t = 02:45 and 03:53, doesn’t result in CS-TIPs disassembly. Frames were acquired at 15 s. intervals after anaphase onset on a Nikon Eclipse Ti-E - TIRF microscope. The playback rate is 10 frames per second. Time: mins:secs. Scale bar, 5 μm.
Video 13
Polo kinase is not required for CS-TIPs assembly.
Video shows co-expression of Dm MKLP1-EGFP (green) and Tag-RFP-T-α-tubulin (red) in S2 cells. Addition of Polo inhibitor, BI 2536, between t = 01:20 and 02:50, doesn’t result in CS-TIPs disassembly. Frames were acquired at 5 s. intervals on a Nikon Eclipse Ti-E - TIRF microscope. The playback rate is 10 frames per second. Time: mins:secs. Scale bar, 5 μm.
Video 14
Polo Kinase doesn’t localize to the midzone, but assembles normally on the CS-TIPs in Klp3A depleted cells.
Video shows the expression of Polo-EGFP in Klp3A depleted cells in Drosophila S2 cells. Polo-EGFP doesn’t localize to the midzone, but assembles normally on the CS-TIPs. Frames were acquired at 5 s. intervals on a Nikon Eclipse Ti-E - TIRF microscope. The playback rate is 10 frames per second. Time: mins:secs. Scale bar, 5 μm.
Video 15
ABK is required for CS-TIP signaling.
Video shows co-expression of EGFP-Rhotekin (green) and Tag-RFP-T-α-tubulin (red) in Drosophila S2 cells. RhoA activation near the CS-TIPs is visible between t = 02:00 to 3:55. Addition of ABK inhibitor, Binucleine 2, between t = 03:55 and 5:08 results in loss of Rhotekin from the CS-TIPs within ∼3 min. However, midzone Rhotekin signals take ∼6.30 min. to disappear. Frames were acquired at 5 s. intervals after anaphase onset on a Nikon Eclipse Ti-E - TIRF microscope. The playback rate is 10 frames per second. Time: mins:secs. Scale bar, 5 μm.
Video 16
ABK is required for CS-TIPs signaling.
Video shows the expression of MKLP1-EGFP (green) and Rhotekin-RFP (red) in Drosophila S2 cells. RhoA is visible around the cortex at t = 1.00, but it gets reorganized near the CS-TIPs by t = 3:58. Addition of ABK inhibitor, Binucleine 2, between t = 04:48 and 6:30 results in loss of Rhotekin from the CS-TIPs within ∼3 min. Frames were acquired at 5 s. intervals after anaphase onset on a Nikon Eclipse Ti-E - TIRF microscope. The playback rate is 10 frames per second. Time: mins:secs. Scale bar, 5 μm.
Video 17
Polo kinase activity is required for CS-TIPs signaling.
Video shows co-expression of EGFP-Rhotekin and Tag-RFP-T-α-tubulin (red) in Drosophila S2 cells. RhoA activation near the CS-TIPs is visible between t = 00:00 to 01:40. Addition of Polo inhibitor, BI 2536, between t = 01:40 and 2:51 results in loss of Rhotekin from the CS-TIPs within ∼3 min. Frames were acquired at 5 s. intervals on a Nikon Eclipse Ti-E - TIRF microscope. The playback rate is 10 frames per second. Time: mins:secs. Scale bar, 5 μm.
Video 18
Polo kinase activity is required for CS-TIPs signaling but not for assembly.
Video shows the expression of MKLP1-EGFP (green) and RFP-Rhotekin (red) in Drosophila S2 cells. RhoA accumulation near the CS-TIPs is visible after t = 01:02. Addition of Polo inhibitor, BI 2536, between t = 01:27 and 02:55 results in loss of Rhotekin from the CS-TIPs within ∼4.30 min, however MKLP1 localization to the cortex is still visible. Frames were acquired at 5 s. intervals on a Nikon Eclipse Ti-E - TIRF microscope. The playback rate is 10 frames per second. Time: mins:secs. Scale bar, 5 μm.
Video 19
Polo kinase activity is required for ECT2 accumulation near the cortex.
Video shows co-expression of Dm ECT2-EGFP (green) and Tag-RFP-T-α-tubulin (red) in Drosophila S2 cells. ECT2 localization on the CS-TIPs is visible after t = 04:29. Addition of Polo inhibitor, BI 2536, between t = 04:34 and 05:49 results in loss of ECT2 from the CS-TIPs within ~3 min. Frames were acquired at 5 s. intervals after anaphase onset on a Nikon Eclipse Ti-E - TIRF microscope. The playback rate is 10 frames per second. Time: mins:secs. Scale bar, 5 μm.
Video 20
Satellite MT arrays originate de novo.
Video shows co-expression of Dm MKLP1-EGFP (green) and Tag-RFP-T-α-tubulin (red) in S2 cells. Correlative TIRF-spinning disk confocal microscopy was employed to investigate the nature and origin of satellite MT arrays. 3-D image reconstruction reveals that oblique brushes originate considerably further up into the cell volume than the astral brushes in which MTs could be seen in the TIRF field. For example, the vertex of the brush in inset 1 (see Figure 5C) seem to originate ~5 μm deep from the bottom of the cell. 0.2 µm confocal z-sections were taken on a Nikon Eclipse Ti-E spinning disk confocal microscope, and 3-D movie was made with the help of MetaMorph software.
Video 21
3-D view of the Satellite MT arrays.
The Video gives a 3-D impression of the satellite MT-arrays of the same cell shown in Figure 5C (see Video 20 and Figure 5C). Dm MKLP1-EGFP is shown in green while Tag-RFP-T-α-tubulin is shown in red. 0.2 µm confocal z-sections were taken on a Nikon Eclipse Ti-E spinning disk confocal microscope, and 3-D image reconstruction was made with the help of MetaMorph software.
Video 22
EB1 is required for CS-TIPs assembly.
Video shows co-expression of Dm MKLP1-EGFP (green) and Tag-RFP-T-α-tubulin (red) in Drosophila S2 cells. In contrast to control RNAi cells, depletion of EB1 in cells expressing Dm MKLP1-EGFP results in loss of CS-TIPs assembly. Frames were acquired at 5 s. intervals on a Nikon Eclipse Ti-E - TIRF microscope. The playback rate is 10 frames per second. Time: mins:secs. Scale bar, 5 μm.
Video 23
Depletion of EB1 results in loss of RhoA activation and focusing near the CS-TIPs.
Video shows co-expression of EGFP-Rhotekin (green) and Tag-RFP-T-α-tubulin (red) in Drosophila S2 cells. EB1 depletion results in loss of active RhoA near the CS-TIPs but not at the midzone. Frames were acquired at 5 s. intervals on a Nikon Eclipse Ti-E - TIRF microscope. The playback rate is 10 frames per second. Time: mins:secs. Scale bar, 5 μm.
Video 24
C-terminal truncation of RacGAP50C results in loss of CS-TIPs assembly.
Video shows co-expression of ΔC-RacGAP50C-EGFP (green) and Tag-RFP-T-α-tubulin (red) in Drosophila S2 cells. In contrast to full length RacGAP50C, C-terminal truncation of RacGAP50C results in loss of CS-TIPs assembly. Frames were acquired at 5 s. intervals after anaphase onset on a Nikon Eclipse Ti-E - TIRF microscope. The playback rate is 10 frames per second. Time: mins:secs. Scale bar, 5 μm.
Video 25
Deletion of ‘’PTIV’’ motif in RacGAP50C results in loss of CS-TIPs assembly.
Video shows co-expression of ΔPTIV-RacGAP50C-EGFP (green) and Tag-RFP-T-α-tubulin (red) in Drosophila S2 cells. In contrast to full length RacGAP50C, deleion of ‘’PTIV’’ motif in RacGAP50C results in loss CS-TIPs assembly. Frames were acquired at 5 s. intervals after anaphase onset on a Nikon Eclipse Ti-E - TIRF microscope. The playback rate is 10 frames per second. Time: mins:secs. Scale bar, 5 μm.
Video 26
Depletion of Dm MKLP1 results in loss of RhoA activation and focusing near the CS-TIPs and midzone.
Video shows co-expression of EGFP-Rhotekin (green) and Tag-RFP-T-α-tubulin (red) in Drosophila S2 cells. In contrast to WT cells, Dm MKLP1 depletion results in loss of active RhoA near the CS-TIPs and midzone. Frames were acquired at 5 s. intervals on a Nikon Eclipse Ti-E - TIRF microscope. The playback rate is 10 frames per second. Time: mins:secs. Scale bar, 5 μm. Time: mins:secs. Scale bar, 5 μm.
Tables
Key resources table
| Reagent type (Species) Or resource | Designation | Source or reference | Identifiers | Additional information |
|---|---|---|---|---|
| Cell line (Drosophila melanogaster) | Drosophila Schneider 2 (S2) cell line | American Type Culture Collection | RRID:CVCL_Z232 Cat# CRL-1963 | |
| Transfected construct (Drosophila melanogaster) | Dm MKLP1-EGFP and Tag-RFP-T-α-tubulin | This study | RRID:CVCL_UZ77 | All constructs were transfected in Drosophila Schneider 2 (S2) cells. |
| Transfected construct (Drosophila melanogaster) | RacGAP50C-EGFP and Tag-RFP-T-α-tubulin | This study | RRID:CVCL_UZ78 | |
| Transfected construct (Drosophila melanogaster) | Polo Kinase-EGFP | This study | RRID:CVCL_UZ79 | |
| Transfected construct (Drosophila melanogaster) | EGFP-Rhotekin and Tag-RFP-T-α-tubulin | This study | RRID:CVCL_UZ80 | |
| Transfected construct (Drosophila melanogaster) | RFP-Rhotekin and Dm MKLP1-EGFP | This study | RRID:CVCL_UZ81 | |
| Transfected construct (Drosophila melanogaster) | RFP-Rhotekin and MRLC-EGFP | This study | RRID:CVCL_UZ82 | |
| Transfected construct (Drosophila melanogaster) | Dm ECT2-EGFP and Tag-RFP-T-α-tubulin | This study | RRID:CVCL_UZ83 | |
| Transfected construct (Drosophila melanogaster) | EB1-RacGAP50C-EGFP and Tag-RFP-T-α-tubulin | This study | RRID:CVCL_UZ84 | |
| Transfected construct (Drosophila melanogaster) | EB1-∆C-RacGAP50C-EGFP and Tag-RFP-T-α-tubulin | This study | RRID:CVCL_UZ85 | |
| Transfected construct (Drosophila melanogaster) | EB1-∆PTIV-RacGAP50C- EGFP and Tag-RFP-T-α-tubulin | This study | RRID:CVCL_UZ86 | |
| Antibody | Anti-Pavarotti (rabbit serum) | Kind gift from Dr. David Glover, University of Cambridge | PMID: 9585508 | 1:5000 dilution was used for western blots |
| Antibody | Anti-RacGAP50C (rabbit polyclonal) | Kind gift from Dr. David Glover, University of Cambridge | PMID: 17032738 | 1:4000 dilution was used for western blots |
| Antibody | Anti-alpha Tubulin (DM1 A) (mouse monoclonal) | Sigma-Aldrich | Cat# T6199 | 1:10,000 dilution was used for western blots |
| Antibody | Anti-EB1A (rabbit polyclonal) | Kind gift from Dr. Stephen Rogers, UNC Chapel Hill | 1:5000 dilution was used for western blots | |
| Antibody | Anti-Klp3A (rabbit polyclonal) | Kind gift from Dr. Jonathan Scholey, UC Davis | 1:500 dilution was used for western blots | |
| Chemical compound, drug | Binucleine 2 | Sigma | Cat# B1186 | |
| Chemical compound, drug | BI 2536 | Millipore Sigma | Cat# 533936 | |
| Software, algorithm | MetaMorph | MetaMorph | ||
| Software, algorithm | ImajeJ,Fiji | NIH | ||
| Software, algorithm | MS office | Microsoft | ||
| Software, algorithm | Prism | GraphPad |
Table 1
Primers for cloning (5’ to 3’)
https://doi.org/10.7554/eLife.38968.038| MKLP1FW | TTCAATTGCAAATGGTACCTACTAGTATGAAGGCAGTACCCAGGAC |
| MKLP1 RV | TCCTCGCCCTTGCTCACCATTCTAGAGATTTTCGACTTCTTGCTGC |
| RacGAP50C FW | GTTTCAATTGCAAATGGTACCTACTAGTATGGCGCTCTCCGCATTGGC |
| RacGAP50C RV | CTCCTCGCCCTTGCTCACCATTCTAGATTTCTTGTGCGCAGATGCCG |
| ∆C-RacGAP50C RV | CTCCTCGCCCTTGCTCACCATTCTAGAGTTATCGATCGGCATTAGCAC |
| ∆PTIV-RacGAP50C FW | GGCTACTCCACACCAGATCC |
| ∆PTIV-RacGAP50C RV | GCCAAAGATGAGCGAGATGTTATCG |
| Polo Kinase FW | GGGGTACCGAAAAGCTGTATCGAGTCGC |
| Polo Kinase RV | GGACTAGTTGTGAACATCTTCTCCAGCA |
| Tag RFP Rhotekin FW | GGCATGGACGAGCTGTACAAGACTAGTTCCGGACTCAGATCTCGAG |
| Tag RFP Rhotekin RV | GGGATAGGCTTACCTTCGAACCGCGGTTAGCCTGTCTTCTCCAGCACCTG |
| EGFP Rhotekin FW | TTCAAGTTTCAATTGCAAATGGTACCACCATGGTGAGCAAGGGCGA |
| EGFP Rhotekin RV | TAGGCTTACCTTCGAACCGCGGGCCCGCCTGTCTTCTCCAGCACCT |
| MRLC FW | TTCAATTGCAAATGGTACCTACTAGTATGTCATCCCGTAAGACCGC |
| MRLC RV | AGCTCTTCGCCCTTAGACACTCTAGACTGCTCATCCTTGTCCTTGG |
Table 2
Primers for RNAi (5’ to 3’)
https://doi.org/10.7554/eLife.38968.039| Subito FW | TAATACGACTCACTATAGGGCTGAAGCTAATCAATGGCAGC |
| Subito RV | TAATACGACTCACTATAGGGTTTTCTGAACTGTACTGGCCG |
| EB1 FW | GAATTAATACGACTCACTATAGGGAGAATGGCTGTAAACGTCTACTCCACAAATGTG |
| EB1 RV | GAATTAATACGACTCACTATAGGGAGATGCCCGTGCTGTTGGCACAGGCGTTTA |
| EB1 3’UTR FW | TAATACGACTCACTATAGGGTTTGAAACGTGAACGAAAACCCAC |
| EB1 3’UTR RV | TAATACGACTCACTATAGGGAAACGACAAAAGTCAGCTAGTGAAA |
Additional files
-
Transparent reporting form
- https://doi.org/10.7554/eLife.38968.040
Download links
A two-part list of links to download the article, or parts of the article, in various formats.
Downloads (link to download the article as PDF)
Open citations (links to open the citations from this article in various online reference manager services)
Cite this article (links to download the citations from this article in formats compatible with various reference manager tools)
Microtubule plus-ends act as physical signaling hubs to activate RhoA during cytokinesis
eLife 8:e38968.
https://doi.org/10.7554/eLife.38968


