Branching morphogenesis in the developing kidney is not impacted by nephron formation or integration
- Monash University, Australia
- Murdoch Children's Research Institute, Australia
- University of Melbourne, Australia
- The University of Queensland, Australia
Figures
Figure 1 with 1 supplement
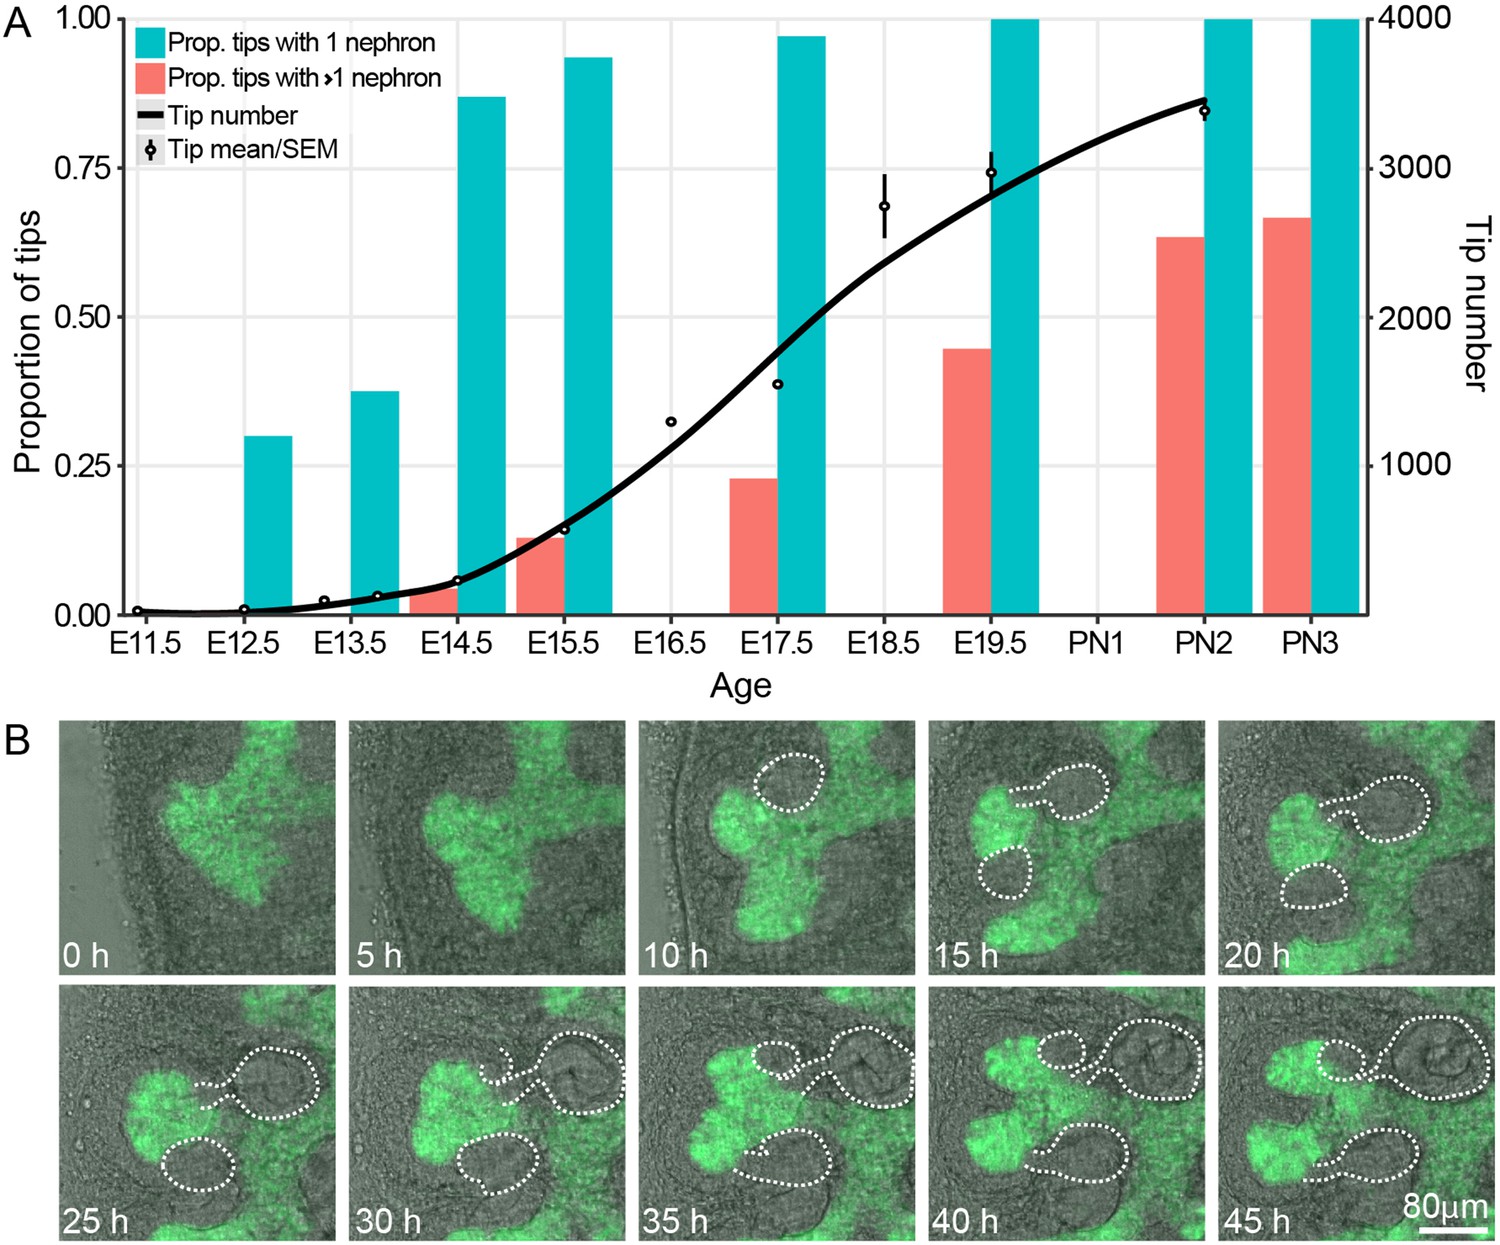
The proportion of ureteric bud tips associated with one or more connected nephrons as a product of developmental time.
(A) Analysis of developing fetal and early postnatal kidneys in which the proportion of ureteric bud tips with 1 or more nephrons which had re-integrated into their associated ureteric bud tips are quantified (left y-axis, blue and orange bars; assessed at E12.5, 13.5, 14.5, 15.5, 17.5, 19.5, PN2 and PN3). The number of tips at each developmental stage is also shown (right y-axis; assessed at E11.5, 12.5, 13.25, 13.75, 15.5, 16.5, 17.5, 18.5, 19.5 and PN2). (B) Screen shots from a live imaging experiment of cultured Hoxb7-gfp kidneys tracking branching morphogenesis of the ureteric bud (green) and the formation and differentiation of renal vesicles into connected nephrons (white line). Time (h, hours) and scale are indicated.
-
Figure 1—source data 1
Embryos were dissected at embryonic ages between E12.5 and E22.5 (the first column, embryonic day).
Confocal microscopy and Imaris software were used to view kidneys stained with anti-cytokeratin antibodies and count the number of nephron connections for multiple tips from multiple kidneys. The counts were binned into two groups; a single connection and more than one connection (the first column, nephron.connections). The proportion of tips counted with the number of nephron connections listed is in the third column.
- https://doi.org/10.7554/eLife.38992.005
-
Figure 1—source data 2
Embryos were dissected at embryonic ages between E11.5 and E21.5 (the Embryonic Day column), and staged using limb staging (the Stage Column).
Each row represents an analysis of a single kidney from an individual embryo. The kidneys were whole mount stained and analysed using Optical Projection Tomography and Tree Surveyor software, or confocal microscopy and Imaris software, as described in the methods. For stages 7 to 13, Tree Surveyor was used to reconstruct the ureteric trees, and provide a count of the tip number for each ureteric tree analysed. For stages 12 to 15, confocal microscopy was paired with Imaris analysis. Tips were identified using the property that a single cluster of cap mesenchyme cells associates with a single ureteric tree tip. In this counting method, clusters of cap mesenchyme were manually counted in Imaris to provide an estimate of tip number.
- https://doi.org/10.7554/eLife.38992.006
Figure 1—figure supplement 1
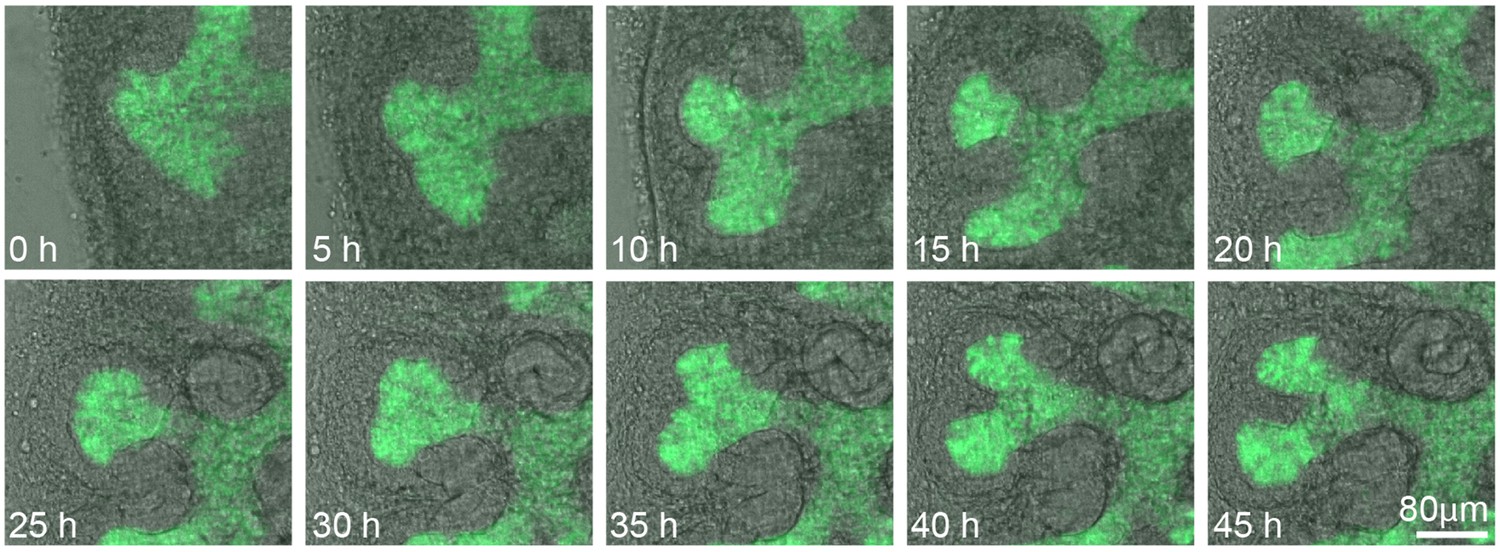
Screen shots from a live imaging experiment of cultured Hoxb7-gfp kidneys tracking branching morphogenesis of the ureteric bud (green) without overlays, showing nephron differentiation in phase contrast.
Time (h, hours) and scale are indicated.
Figure 2
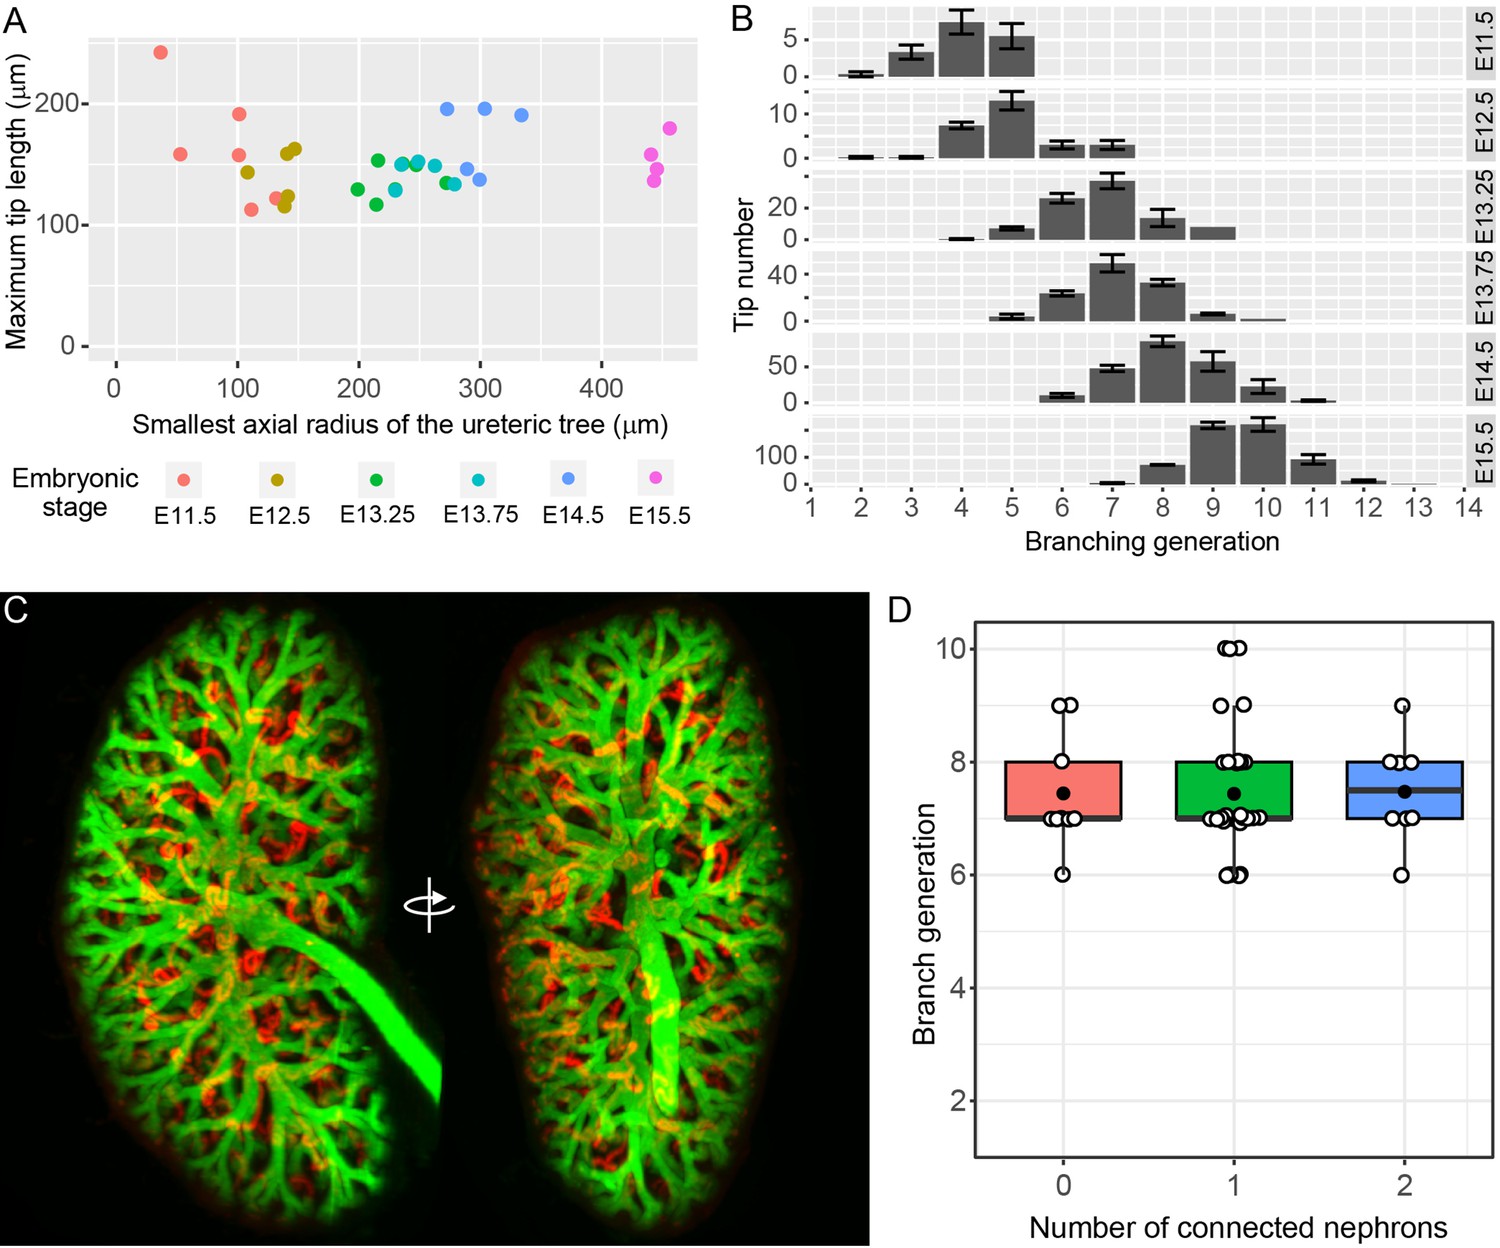
The relationship between branching morphogenesis and developmental time.
(A) Analysis of maximal terminal tip length and axial radius of the kidney shows no relationship between the two measures (p=0.95, lm linear regression in R) at different developmental time points (where n = 6,5,7,5,5,4 for increasing time points, respectively). (B) The distribution of tip branching generations showing the mean and SEM of kidneys at each developmental stage (n = 6,5,7,5,5,4 for increasing time points, respectively). The branching generation of a tip is the number of branching events along the path from the ureter to the tip extremity determined using Tree Surveyor software. (C) A digital projection of light sheet imaging of a whole kidney at E15.5 labellling the collecting duct (green, Trop2+) and differentiating nephrons (red, E-cadherin+;Trop2-). (D) The direct relationship between nephron number and branch generations per tip shows no evidence for a reduction in branching associated with nephron integration. Generation number of tips with no (red), 1 (green) and 2 (blue) connected nephrons are indicated. Each tip is represented (open circle); mean (closed circle) and median (bar) are indicated.
-
Figure 2—source data 1
A single kidney from an E15.5 embryo was dissected, whole mount stained and analysed using light sheet microscopy and Imaris software, as described in the methods.
In Imaris, proliferative tips were identified by EdU staining, the number of nephrons counted by E-cadherin labelling and the branch generation determined by observing Trop2 stained ureteric tree branches back to the ureter. Fifty tips were assessed (tip number in column 1), and the number of associated nephrons (column 2) and branch generations were counted (column 3).
- https://doi.org/10.7554/eLife.38992.008
-
Figure 2—source data 2
Statistical analyses for Figures 2C and 3A, and 3B.
- https://doi.org/10.7554/eLife.38992.009
Figure 3
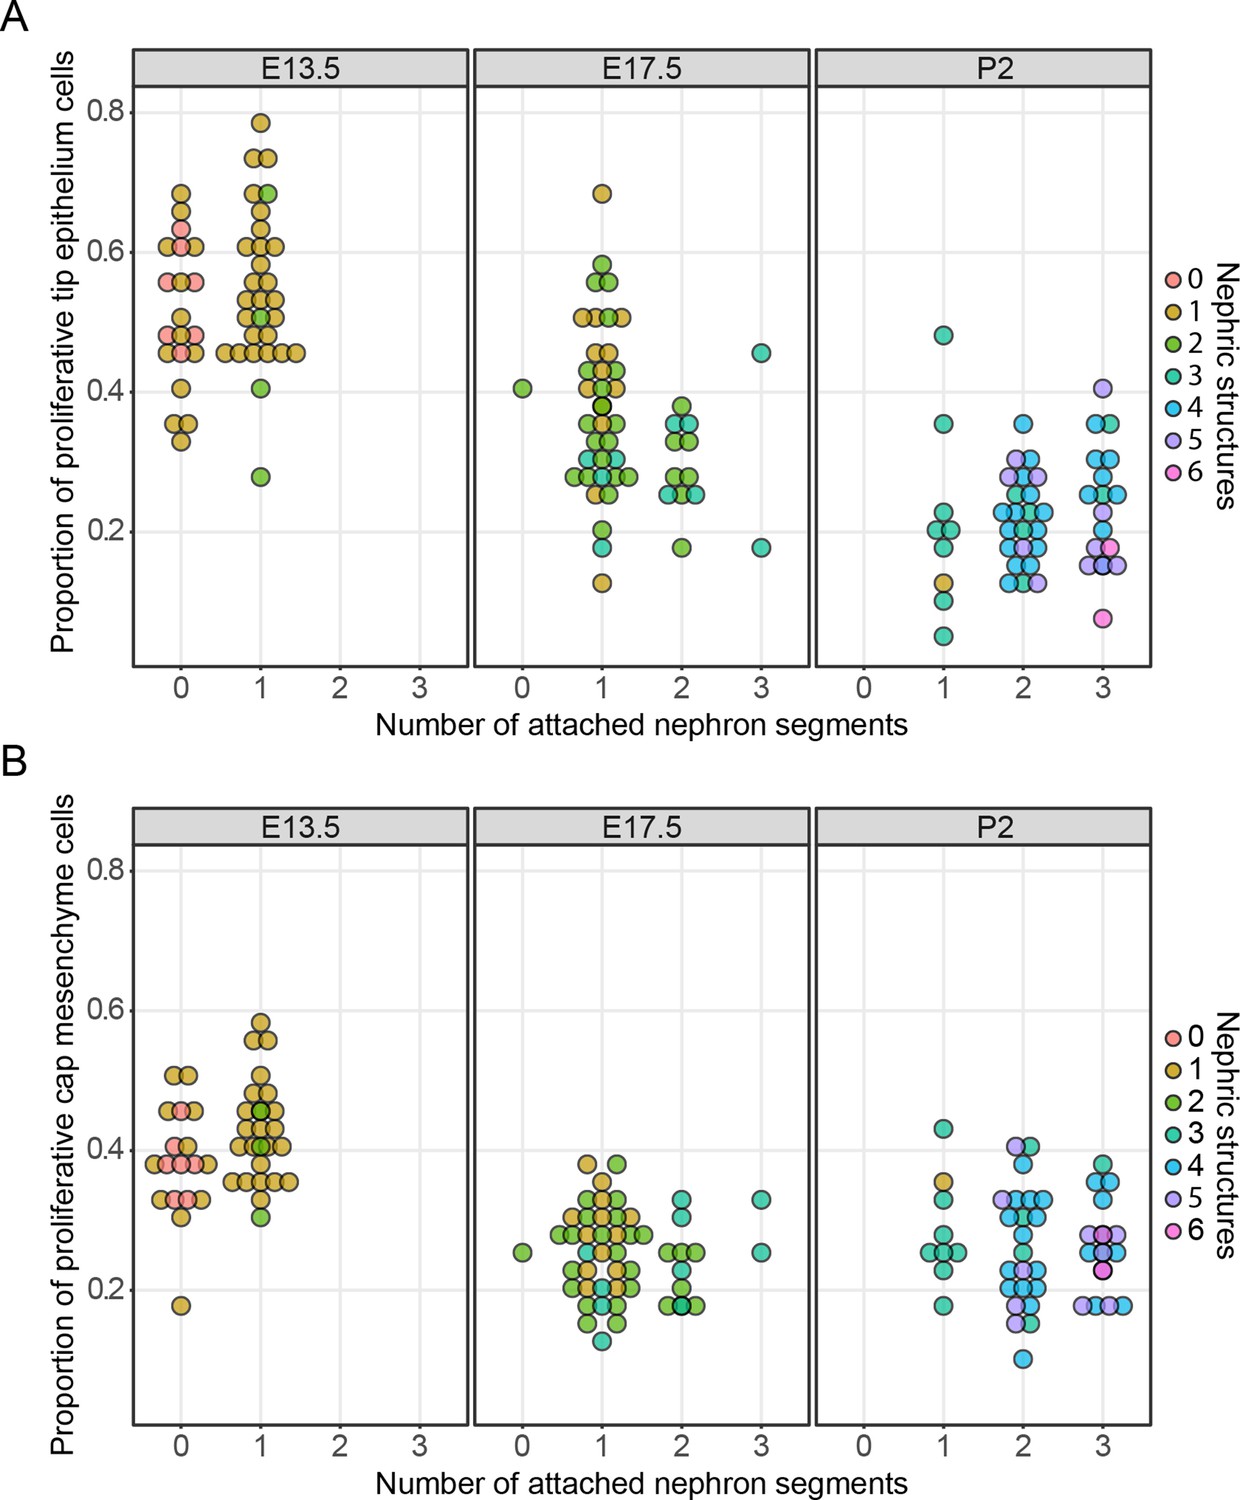
The relationship between cell proliferation nephron endowment.
EdU labelling was used to quantify cell proliferation in the tip (A) and cap (B) cell niches. The number of nephrons, which are physically connected to the tips are detailed across three different developmental time points and the total number of nephric structures (connected and associated) are indicated in colour. Each data point represents a single cap or tip cell niche.
-
Figure 3—source data 1
Kidneys samples (column 1) were dissected from embryos at embryonic ages (column 2), and stained for Edu, Six2, Trop2 and DAPI.
The kidneys were imaged using confocal microscopy and analysed using Imaris software. Multiple tips were assessed for each kidney (column 3). The number of attached nephron segments that are continuous with the ureteric tip (column 4) and the total number of nephric structures (both attached and non-attached, column 5) were counted. The same tip was assessed for tip cell number (column 6), Edu positive proliferating cells (column 7), the ratio of proliferative cells to total cell number (column 8). The clustered cap mesenchyme cells associated with the tip were also analysed for cap cell number (column 9), EdU positive proliferating cells (column 10), the ratio of proliferative cells to total cell number (column 11). The values for each tip.
- https://doi.org/10.7554/eLife.38992.013
Videos
Video 1
Light sheet imaging of whole labelled kidney at E15.5
Whole mouse kidneys at E15.5 were labelled with antibodies to detect collecting duct and nephrons. Collecting duct volumes (green, Trop2 staining) are registered alongside differentiating nephrons (red, generated by digital subtraction of Trop2 from E-cadherin volumes) and incorporated EdU (blue, including only cells in the duct and nephrons volumes). Samples were imaged on an Ultramicroscope II (LaVision BioTec).
Video 2
Light sheet imaging of cell proliferation in UB tips of whole labelled kidney at E15.5
Whole mouse kidneys (E15.5) were labelled with antibodies to detect collecting duct and nephrons. Collecting duct volumes (greyscale) are registered alongside differentiating nephrons (cyan, generated by digital subtraction of Trop2 volumes from E-cadherin volumes). Density of EdU labelling within the ureteric bud volumes are indicated by a yellow-red heat map. Samples were imaged on an Ultramicroscope II (LaVision BioTec).
Tables
Key resources table
| Reagent type (species) or resource | Designation | Source or reference | Identifiers | Additional information |
|---|---|---|---|---|
| Genetic reagent (Mus musculus) | Hoxb7-GFP | PMID: 10322632 | MGI:Tg(Hoxb7-EGFP)33Cos/J; RRID:IMSR_JAX:016251 | |
| Antibody | Pan-cytokeratin | Abcam | Abcam:AB11213; RRID:AB_297852 | (1:200) |
| Antibody | Ecadherin | Thermo Fisher | Thermo Fisher:13–1900; RRID:AB_86571 | (1:400) |
| Antibody | Trop2 | R and D Systems | R and D Systems:AF1122; RRID:AB_2205662 | (1:100) |
| Antibody | Six2 | Proteintech | Proteintech:115621AP; RRID:AB_2189084 | (1:600) |
| Commercial kit | Click-iT EdU Alexa Fluor 647 imaging kit | Life Technologies | Life Technologies:C10340 | |
| Software | Tree Surveyor | PMID: 23193168 | ||
| Software | Drishti | doi: 10.1117/12.935640 |
Additional files
-
Transparent reporting form
- https://doi.org/10.7554/eLife.38992.014
Download links
A two-part list of links to download the article, or parts of the article, in various formats.
Downloads (link to download the article as PDF)
Open citations (links to open the citations from this article in various online reference manager services)
Cite this article (links to download the citations from this article in formats compatible with various reference manager tools)
Branching morphogenesis in the developing kidney is not impacted by nephron formation or integration
eLife 7:e38992.
https://doi.org/10.7554/eLife.38992


