Remodeling of lumbar motor circuitry remote to a thoracic spinal cord injury promotes locomotor recovery
- Indiana University School of Medicine, United States
- Mudanjiang College of Medicine, China
- School of Basic Medical Sciences, Fudan University, China
- Norton Healthcare, United States
- Indiana University, United States
- Lewis Katz School of Medicine, Temple University, United States
Figures
Figure 1 with 1 supplement
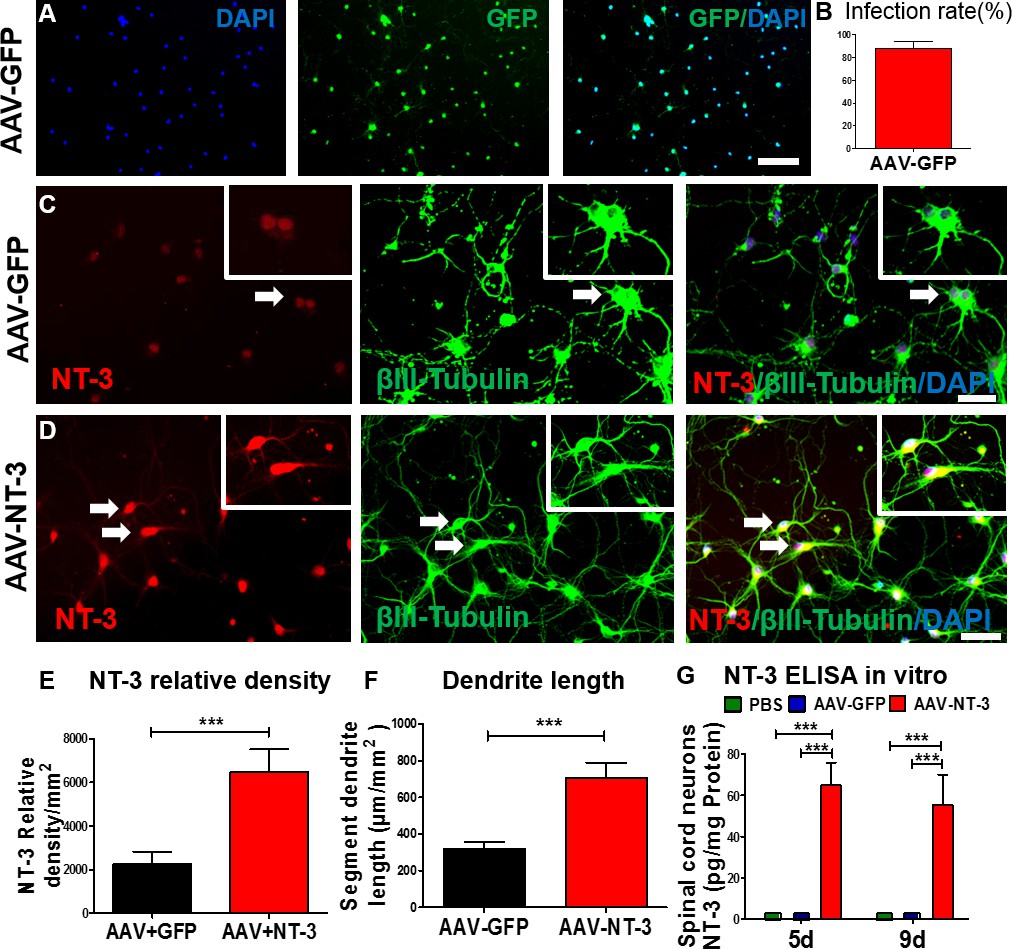
AAV-NT-3 enhanced NT-3 expression, secretion, and neurite extension in spinal cord neurons in vitro.
(A) AAV-GFP infected spinal cord neurons (green) counterstained with DAPI (blue) in vitro. (B) AAV-GFP infection in spinal cord neurons was highly efficient (infection rate: 87.4 ± 6.34%). (C and D) Representative immunofluorescent staining shows triple labeling of NT-3 (red, arrows), βIII-Tubulin (green, for neuronal cell bodies and dendrites, arrows), and DAPI (blue, a nuclear dye) in spinal cord neurons in the AAV-GFP group (C) and AAV-NT-3 group (D) (n = 8 wells/group). (E and F) Quantitative analyses of NT-3 expression (E) and dendrite length (F) in spinal cord neurons based on immunofluorescent staining shown in C and D. (G) NT-3 concentration measured by ELISA in spinal cord neurons at 5 and 9 days in culture after addition of PBS, AAV-GFP and AAV-NT-3 (n = 3 mice/group). Error bars show mean ± SD. *** p < 0.001, Student’s t tests, One-way ANOVA, Tukey’s post hoc test. Scale bars: A, 100 μm; C and D, 50 μm. Abbreviations: AAV, adeno-associated virus (serotype 2); DAPI, 4’,6-diamidino-2-phenylindole; ELISA, enzyme-linked immunosorbent assay; GFP, green fluorescent protein; NT-3, neurotrophin-3; PBS, phosphate buffered saline; SD, standard error of the mean.
Figure 1—figure supplement 1
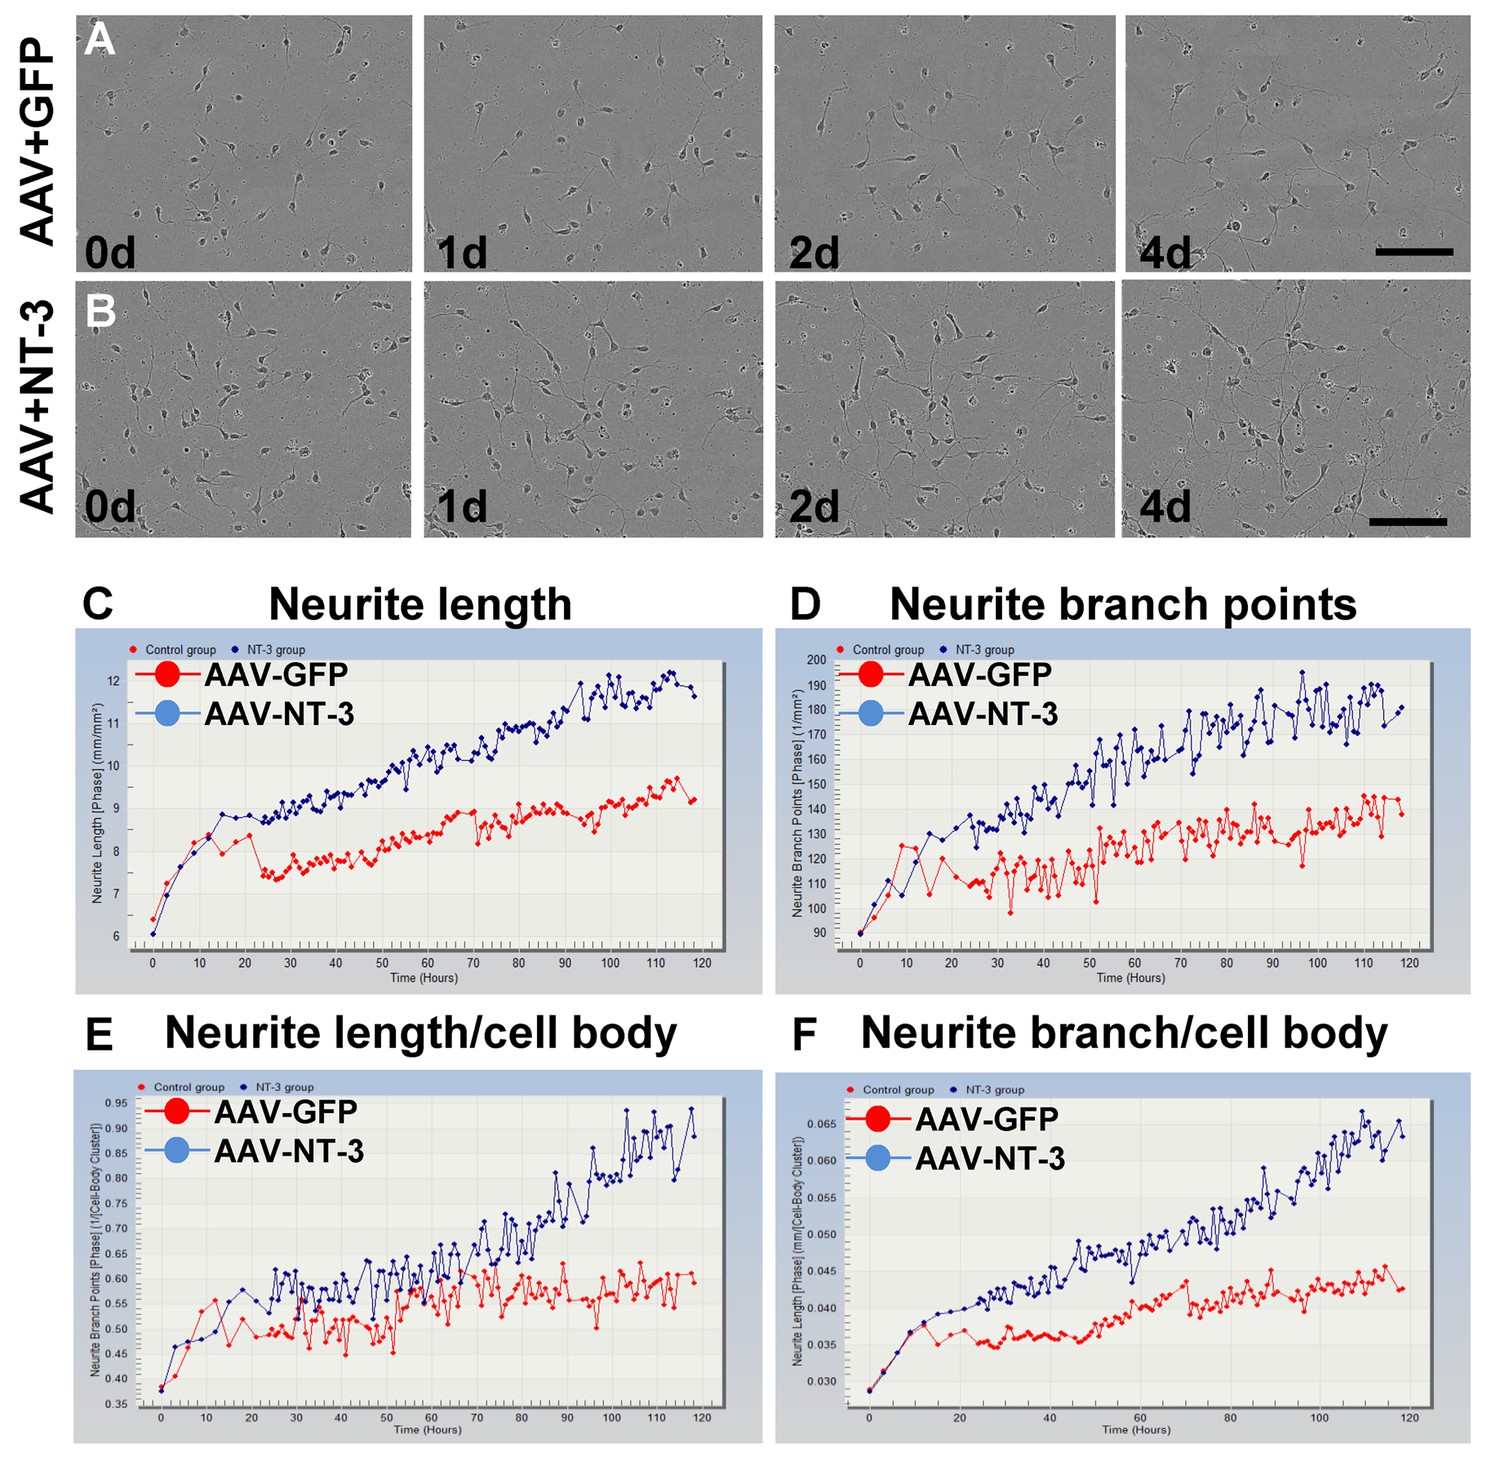
AAV-NT-3 promoted neurite outgrowth in vitro.
(A and B) Representative time-lapse imaging of neurite outgrowth of spinal cord neurons in AAV-GFP (A) and AAV-NT-3 (B) groups. (C–F) Timestamp indicates time in days. Data represent neurite length (C), neurite branch points (D), neurite length/cell body (E), and neurite branch/cell body (F) (n = 8 wells/group). Scale bar, 100 μm. Abbreviations: AAV, adeno-associated virus (serotype 2); GFP, green fluorescent protein.
Figure 2 with 1 supplement
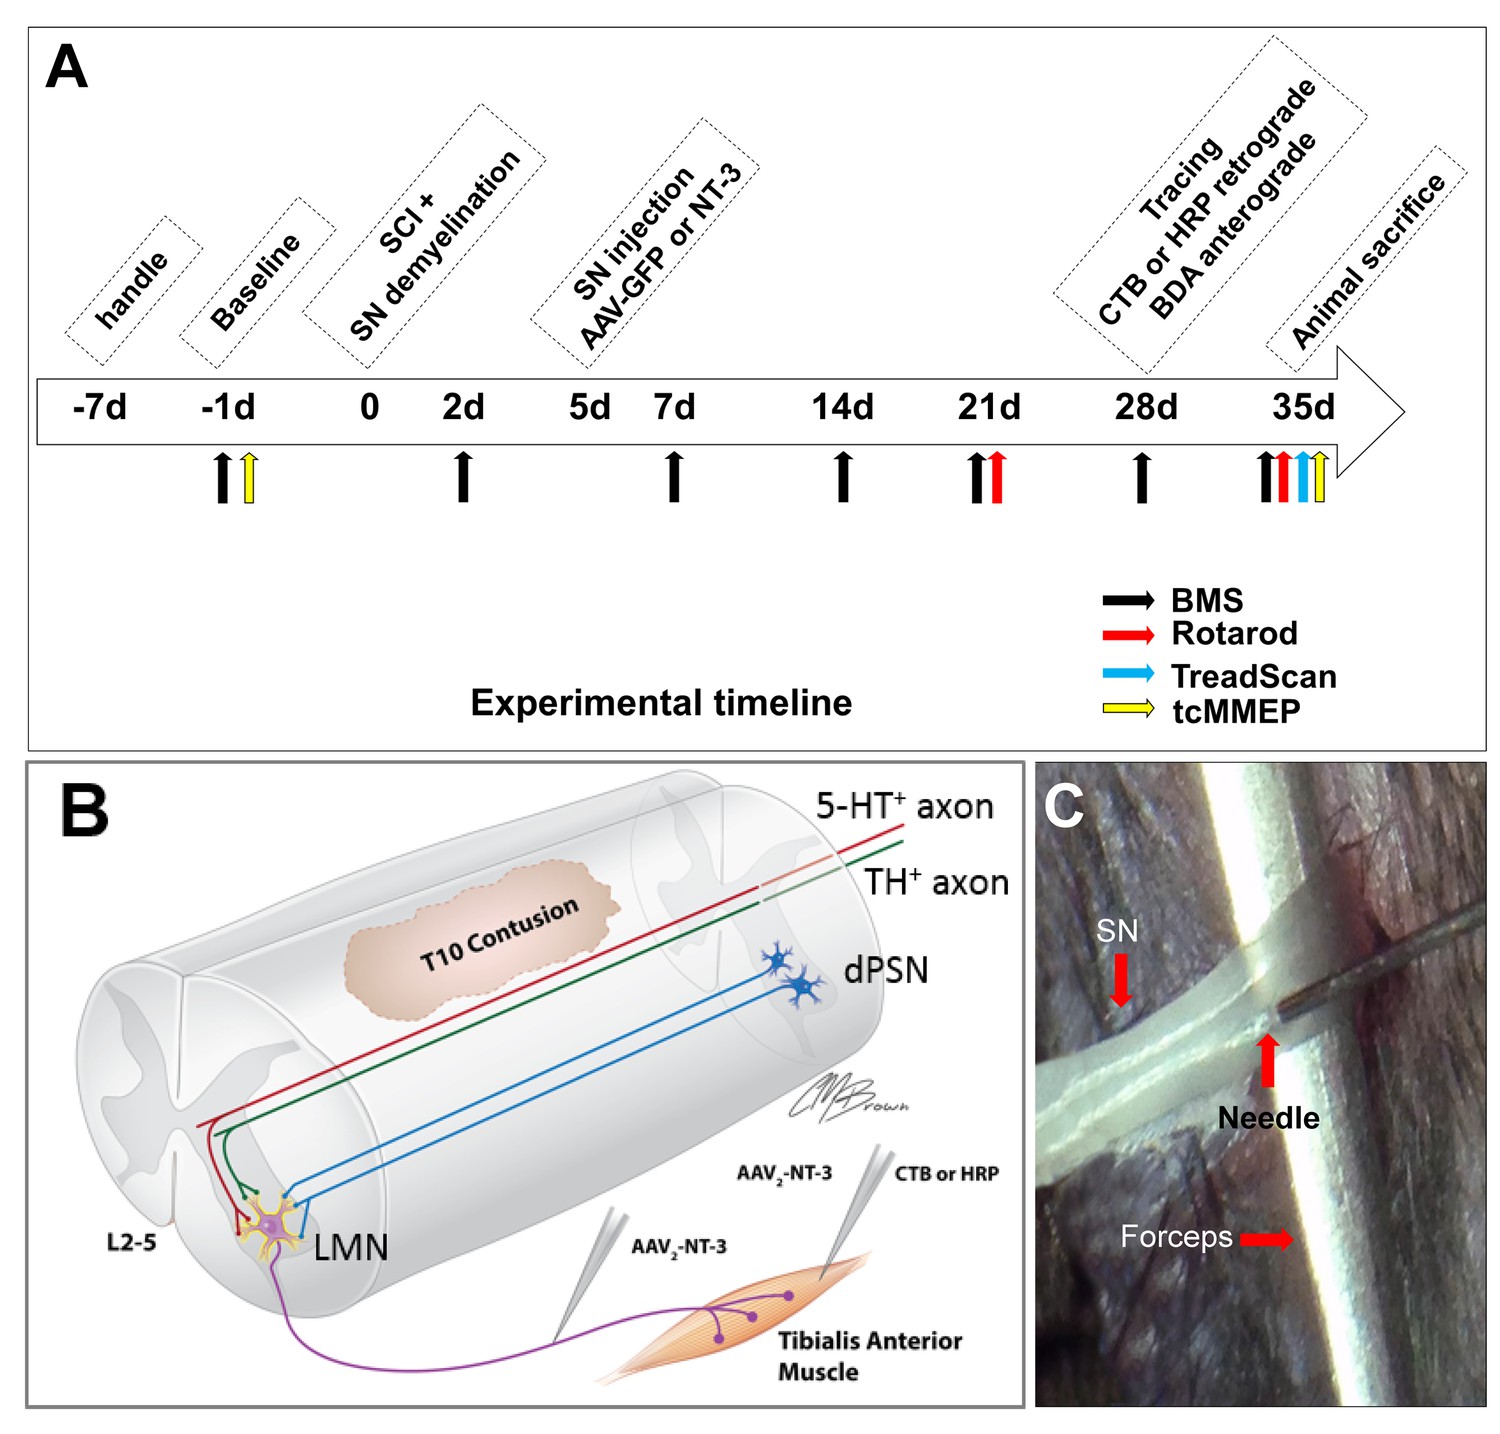
In vivo Experimental Design.
(A) Experimental timeline. (B) Schematic drawing shows the experimental design. A spinal cord contusion injury was made at T10. AAV-NT-3 was injected into the sciatic nerve to allow retrograde transport of NT-3 to lumbar MNs. Retrograde tracers CTB or HRP were injected into the Tibialis Anterior muscle. Descending serotonergic (5-HT+), dopaminergic (TH+), and propriospinal (dPST) axons were examined in their sprouting and synaptogenesis on lumbar MNs. (C) Photograph of the sciatic nerve injection. The exposed nerve was loosely held with arch-tipped forceps to prevent lateral nerve movement. Intraneural injection was performed using a 32-gauge needle attached to a Hamilton syringe. Abbreviations: 5-HT, 5-hydroxytryptamine; AAV, adeno-associated virus (serotype 2); BDA, biotinylated dextran amine; BMS, Basso Mouse Scale; CTB, cholera toxin B; d, day; HRP, horseradish peroxidase; L, lumbar; LMN, lumbar motoneurons; NT-3, neurotrophin-3; SCI, spinal cord injury; SN, Sciatic nerve; tcMMEP, transcranial magnetic motor-evoked potentials; TH, tyrosine hydroxylase.
Figure 2—figure supplement 1
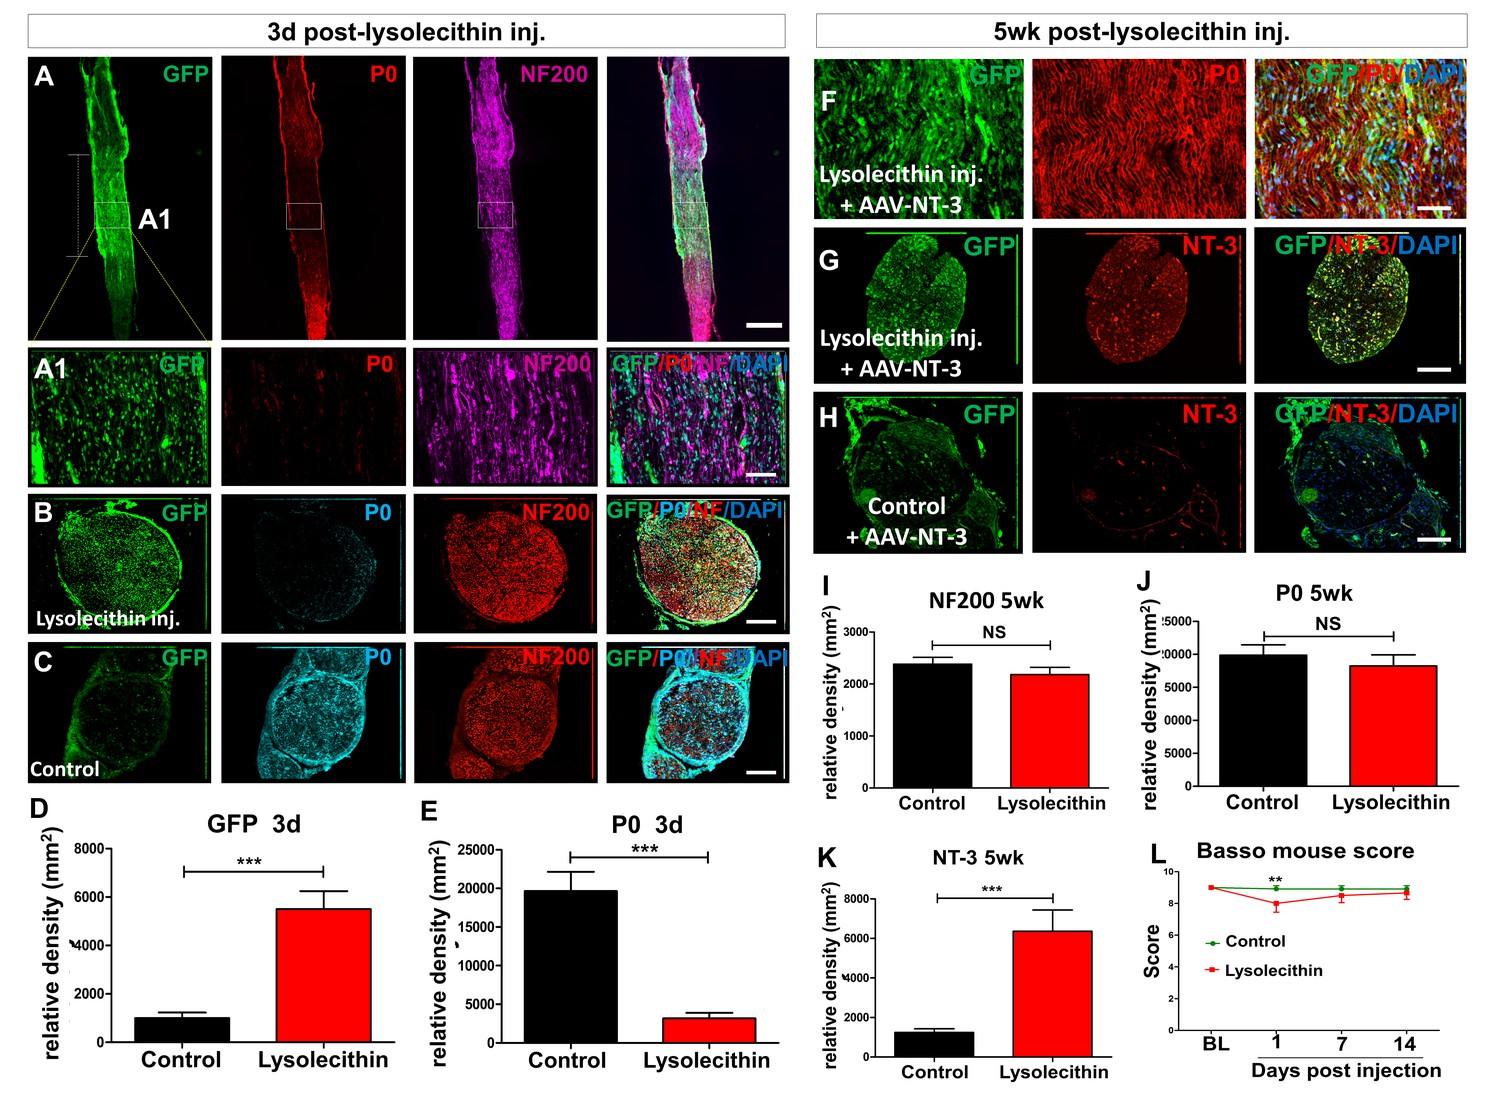
Transient demyelination of sciatic nerves induced by lysolecithin injection.
(A) Representative immunofluorescent staining for GFP (AAV infection, green), P0 (myelin, red), NF200 (axon, pink) and merge (with DAPI, blue) in a sciatic nerve longitudinal section at 3 days after lysolecithin injection. (A1) High magnifications of boxed areas shown in A. Scale bar in A, 2 mm; in A1, 50 μm. (B and C) Representative immunofluorescent staining for GFP (green), P0 (blue), NF200 (red) and merge in sciatic nerve cross sections in lysolecithin injected and control groups. Scale bar, 2 mm. (D and E) Compared with the control group, lysolecithin treatment significantly increased GFP expression (D), and decreased myelination (E). (n = 3 mice/group, bilateral sciatic nerve per mice). However, the lysolecithin injection did not affect axons (NF200, red A-C). (F) GFP (green), P0 (red), and merged (with DAPI, blue) images demonstrate long-term expression of GFP (indicative of effective AAV infection), and remyelination of sciatic nerve axons at 5 weeks after lysolecithin injection. Scale bar, 50 μm. (G–H) GFP (green), NT-3 (red), and merged (with DAPI, blue) images demonstrate the presence or absence of lysolecithin injection and corresponding NT-3 expression after AAV-NT-3 administration at 5 weeks after lysolecithin injection. Scale bars, 2 mm. (I and K) Five weeks after lysolecithin injection, there was no difference between the control and lysolecithin injected group in axon density (I, NF200) and myelination (J, P0). However, transient demyelination in the presence of AAV-NT-3 virus injection increased NT-3 expressed in sciatic nerves (K) (n = 3 mice/group, bilateral sciatic nerves per mice). Error bars show mean ±SD. *p < 0.05, **p < 0.01, Student’s t tests. (L) Transient BMS functional deficit was observed only at 1 day after lysolecithin injection, but such deficit was quickly recovered at 7 and 14 days post-injection. **p < 0.01 versus control. (n = 6 mice/group). Abbreviations: AAV, adeno-associated virus (serotype 2); DAPI, DAPI dihydrochloride; GFP, green fluorescent protein; NS, no significance; NT-3, neurotrophin-3; P0, P0 protein.
Figure 3 with 1 supplement
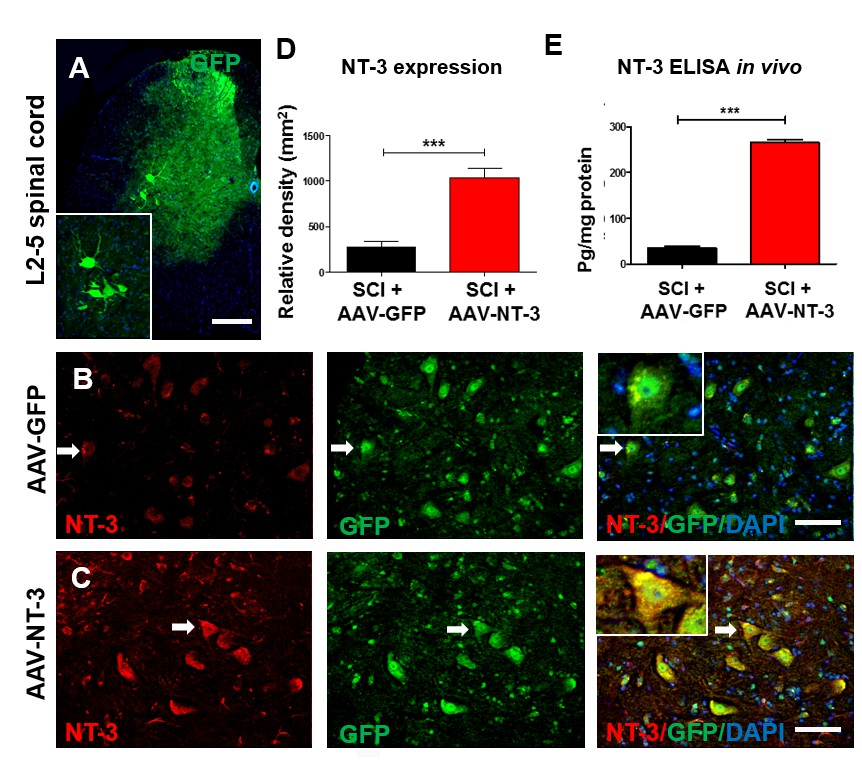
Retrogradely transported AAV-NT-3 enhanced NT-3 expression in lumbar motoneurons.
(A) A photomicrographic image of a lumbar spinal cord (L2-5) cross section shows AAV-GFP labeled ventral horn motoneurons (also seen in the insert) and dorsal horn afferent sensory axons. (B and C) Immunofluorescent triple staining of NT-3 (red, arrows), GFP (green, arrows) and DAPI (blue) in the AAV-GFP (B) and AAV-NT-3 (C) groups. (D and E) Comparison in NT-3 relative density (D) and expression (E) between the AAV-NT-3 and AAV-GFP groups (n = 3 mice/group). Error bars show mean ± SD. ***p < 0.001, Student’s t tests. Scale bars: A, 200 μm; B, C, 50 μm. Abbreviations: AAV, adeno-associated virus (serotype 2); DAPI, 4’,6-diamidino-2-phenylindole; ELISA, enzyme-linked immunosorbent assay; GFP, green fluorescent protein; NT-3, neurotrophin-3; SD, standard error of the mean.
Figure 3—figure supplement 1
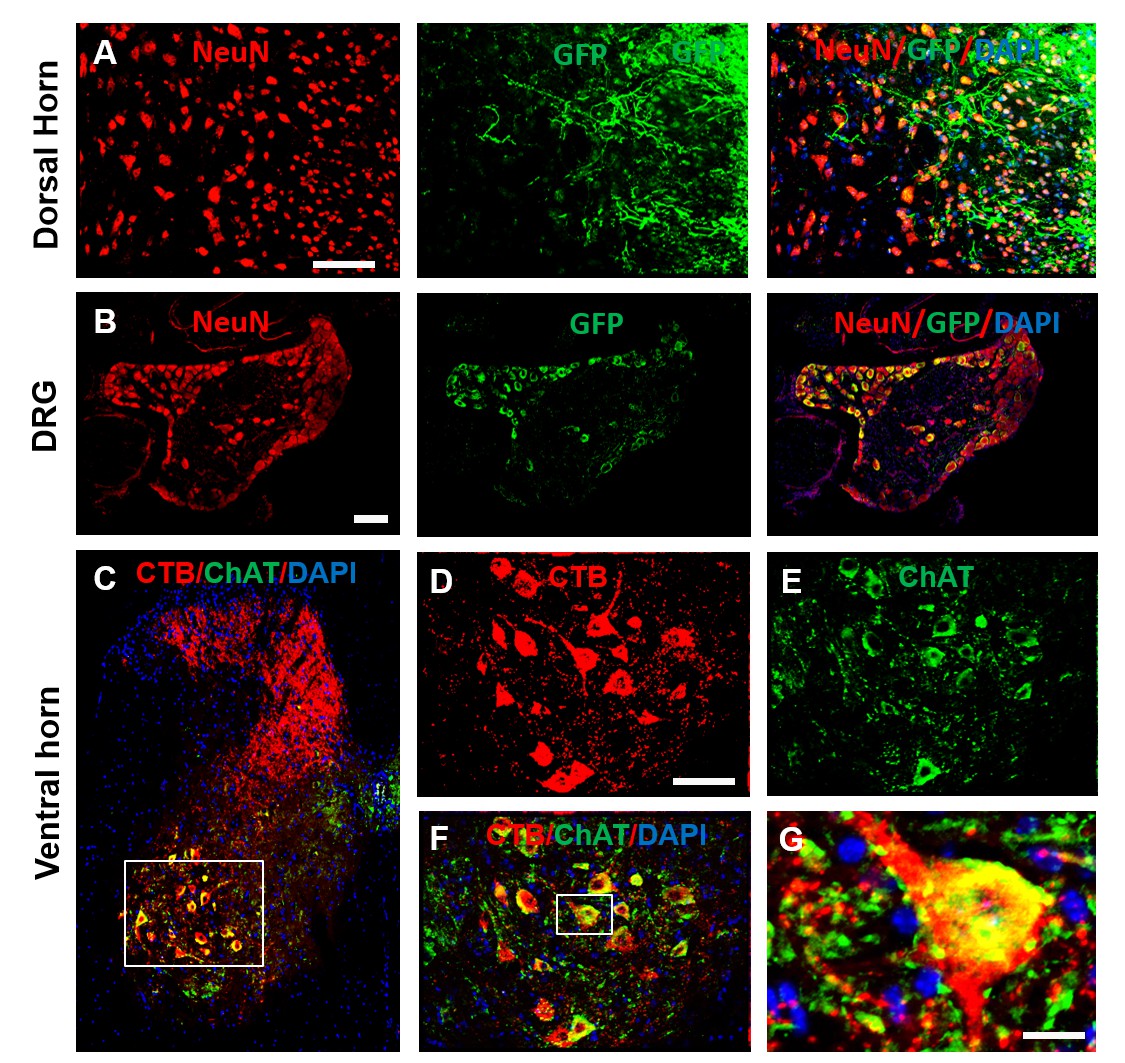
Expression of AAV-GFP in dorsal root axons and DRG neurons, and co-localization of ChAT and CTB in lumbar MNs.
(A) Immunofluorescent staining of a cross section of the lumbar spinal cord dorsal horn revealed expression of GFP in dorsal root sensory axons (green), counterstained with NeuN in dorsal horn neurons (red). (B) A cross section of the DRG shows DRG neurons (NeuN, red) co-localize with GFP (green), indicating that these neurons were transfected with AAV. (C) A cross section of the spinal cord shows retrogradely transported CTB (red) co-labeled with ChAT (a marker for MNs, green) in the lumbar spinal cord. (D–F) High magnification of boxed area in C. (G) High magnification of boxed area in F. Scale bars: A, 50 μm; B, 100 μm; C, 50 μm; insert in C, 20 μm. Abbreviations: ChAT, choline acetyltransferase; CTB, cholera toxin B subunit; DAPI, DAPI dihydrochloride; DRG, dorsal root ganglion; GFP, green fluorescent protein; MN, motoneurons.
Figure 4 with 1 supplement
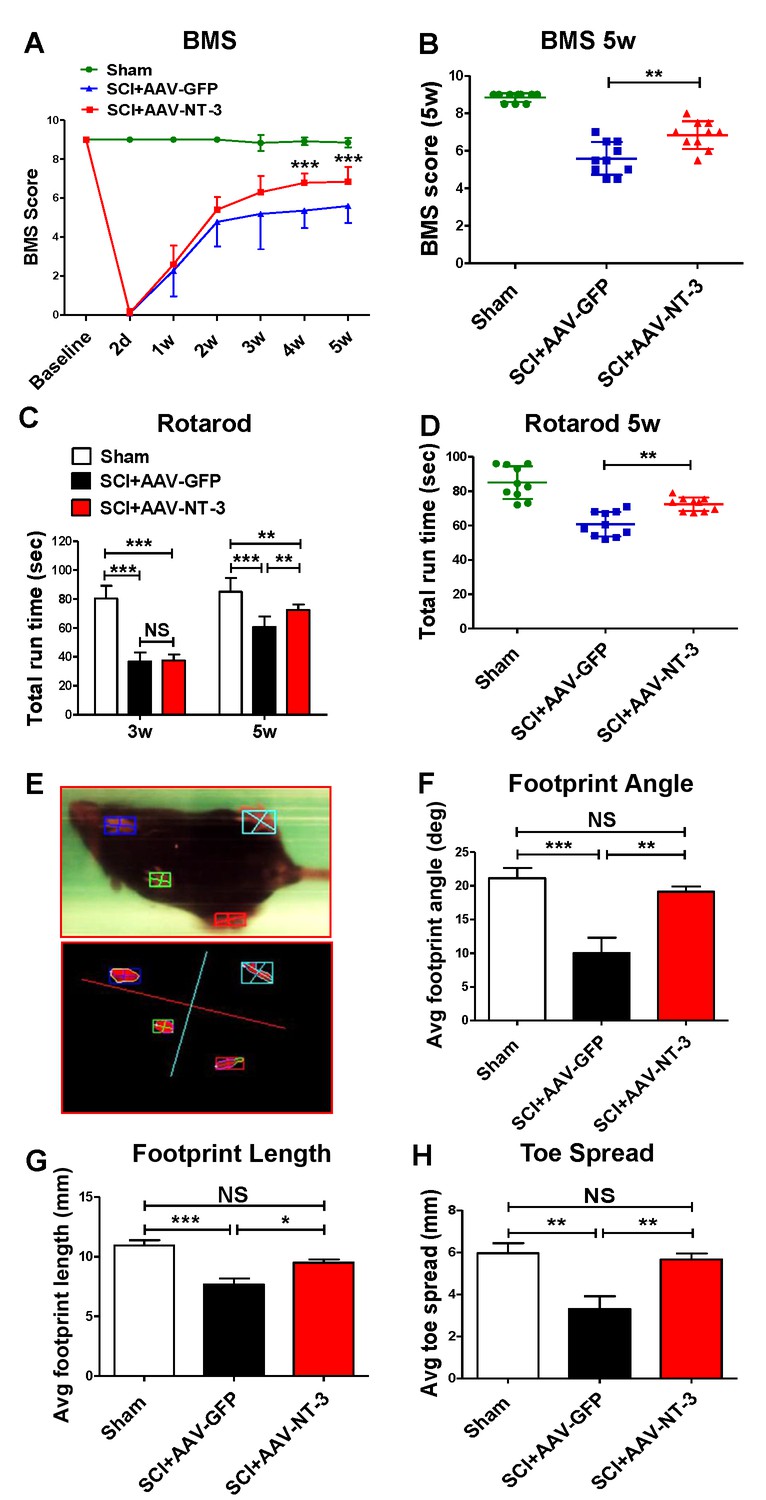
Retrogradely transported AAV-NT-3 enhanced hindlimb locomotor recovery.
(A and B) AAV-NT-3 significantly improved Basso Mouse Scale (BMS) for locomotion at 4 and 5 weeks post-SCI. (C and D) AAV-NT-3 significantly increased rotarod run times at 5 weeks post-injury as compared to AAV-GFP. (E – H) TreadScan analyses show captured footprint images (E), and quantifications of footprint angle (F), footprint length (G), and toe spread (H). n = 10 mice/group, error bar = mean ± SD. **p < 0.01, ***p < 0.001, repeated measures two-way ANOVA, Tukey’s post-hoc test (BMS), One-way ANOVA, Kruskal–Wallis post-hoc test (rotarod and TreadScan). Abbreviations: AAV, adeno-associated virus (serotype 20; GFP, green fluorescent protein; NS, no significance; NT-3, neurotrophin-3; SCI, spinal cord injury; SD, standard error of the mean.
Figure 4—figure supplement 1
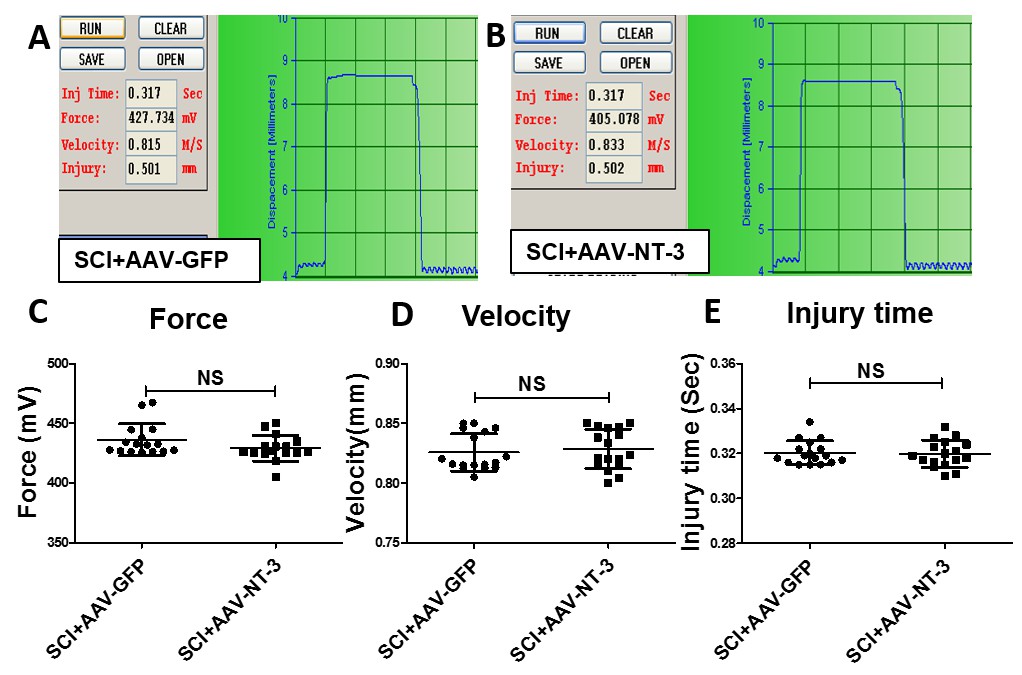
Spinal cord injury parameters produced by an Infinite Horizon injury device.
(A and B) Examples of the force and impact velocity in a SCI + AAV GFP (A) and a SCI + AAV-NT-3 treated animals (B). (C–E) No statistical significant differences were found in the force (C), velocity (D), and injury time (E) between the two groups. n = 17 mice/group, two-tailed Student’s t-test.
Figure 5

Electrophysiological measure with transcranial magnetic motor-evoked potentials (tcMMEP).
(A) tcMMEP set up. (B) Compared to the sham group, three types of tcMMEP responses, i.e. early response (ER), late response (LR), and no response (NR) were observed. AAV-NT-3 markedly increased the percent of early response. (C) Examples of normal response waveforms in the sham group. (D–F) Examples of no response (D), early response (E), and late response (F) waveforms in the AAV-GFP and AAV-NT-3 treatment groups at 5 weeks after SCI. (G and H) Compared to the control groups, AAV-NT-3 significantly increased the amplitude (G) and decreased the latency (H). n = 10 mice/group. *p < 0.05, **p < 0.01, ***p < 0.001, χ2 test (early response), One-way ANOVA, Kruskal–Wallis post-hoc; Student’s t tests (late response).
Figure 6 with 1 supplement

Retrogradely transported AAV-NT-3 attenuated dendritic atrophy.
(A) Dark-field micrographs and matching computer-generated composites of transverse hemisections through the lumbar spinal cords of sham, SCI + AAV GFP, and SCI + AAV-NT-3 groups after BHRP injection into the tibialis anterior (TA) muscle. Computer-generated composites of BHRP-labeled somata and processes were drawn at 480 μm intervals through the entire rostrocaudal extent of the TA motor pool. Polar histogram of BHRP-labeled TA motoneuron dendrites was measured. (B) Length per radial bin of TA dendrites displayed a non-uniform distribution, with the majority of the arbor located between 300 ◦ and 120 ◦. Following SCI, dendritic lengths of these radial bins in the SCI + AAV GFP group reduced significantly. Treatment with AAV2-NT-3 attenuated these reductions. (C) The dendritic length per TA motoneuron was significantly reduced in the AAV-GFP group and treatment with AAV-NT-3 significantly attenuated this dendritic atrophy. (D and E) Strong correlation between dendrite length per cell and BMS (D) and rotarod (E) scores for sham, SCI + AAV GFP and SCI + AAV-NT-3 groups (n = 4/group). Error bars show mean ±SD. *p < 0.05, ***p < 0.001, One-way ANOVA, Kruskal–Wallis post-hoc (B, C); Pearson’s correlation coefficient (r value, (D, E). n = 4 mice/group. Scale bar in A, 200 μm.
Figure 6—figure supplement 1
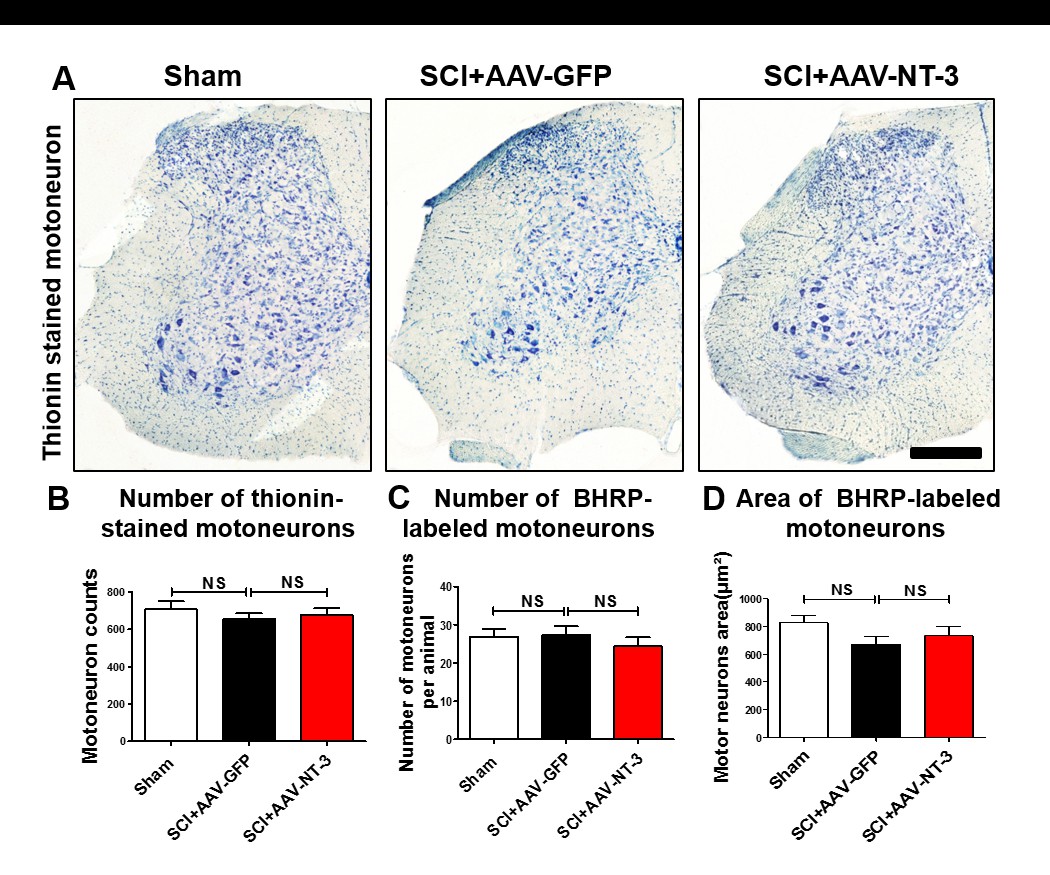
Motoneuron counts.
(A) Representative sections show Thionin-stained motoneurons in the lumbar ventral horn among different treatment groups. (B–D) Quantitative analysis of the number of Thionin-labeled motoneurons (B), the number of BHRP-labeled motoneurons (C) and the area of BHRP-labeled motoneurons (E) (n = 6 mice/group). Error bars = mean ± SD. One-way ANOVA, Kruskal–Wallis post-hoc. Scale bars, 200 μm. Abbreviations: AAV, adeno-associated virus (serotype 2); BHRP, cholera toxin B subunit; NS, no significance; NT-3, neurotrophin-3; SCI, spinal cord injury; SD, standard error of the mean.
Figure 7 with 1 supplement
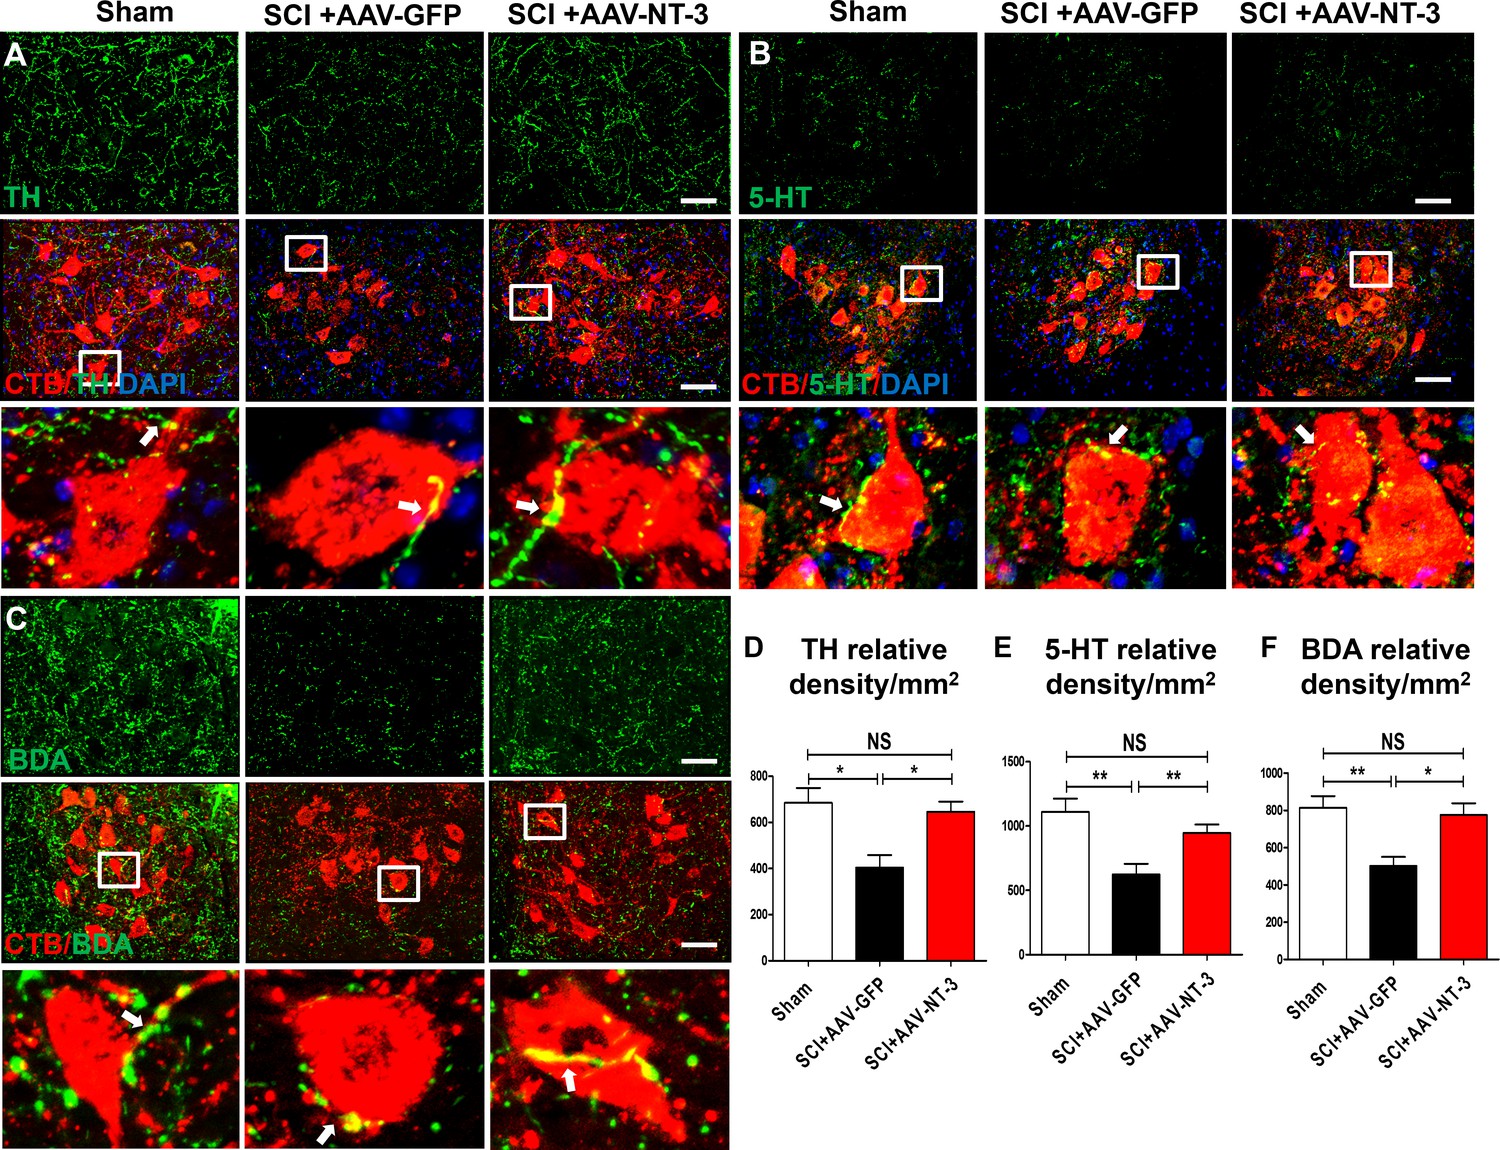
Retrogradely transported AAV-NT-3 enhanced terminal innervation by descending dopaminergic, serotonergic, and propriospinal axons in the lumbar motoneuron pool.
(A–C) Representative images for TH+ dopaminergic axons (A, green), 5-HT+ serotonergic axons (B, green) and BDA+ dPST axons (C, green) in the lumbar motoneuron (MN) pool of different treatment groups at 5 weeks post-SCI. The lumbar MNs were retrogradely labeled with CTB (red) and counterstained with DAPI (a nuclear dye, blue). Inserts are high magnifications of boxed areas show synaptic-like structures established between TH-, 5-HT-, and dPST-labeled axons and CTB-labeled MNs (A-C, arrows). (D–F) Quantitative analyses of the TH+ relative integrated optical density (IOD)/mm2 (D), 5-HT+ IOD (E), and BDA+ IOD (F). n = 6 mice/group. Error bars, mean ± SD. *p<0.05, **p<0.01, One-way ANOVA, Kruskal–Wallis post-hoc. Scale bars, 50 μm; Box scale bars, 20 μm. Abbreviations: 5-HT, 5-hydroxytryptamine or serotonin; AAV, adeno-associated virus (serotype 2); BDA, biotinylated dextran amine; CTB, cholera toxin B subunit; DAPI, DAPI dihydrochloride; GFP, green fluorescent protein; NS, no significance; NT-3, neurotrophin-3; SCI, spinal cord injury; SD, standard error of the mean.
Figure 7—figure supplement 1

Retrogradely transported AAV-NT-3 enhanced sprouting of dPST axons on lumbar MNs and formation of synaptic-like contacts on lumbar MNs.
(A) BDA anterogradely-labeled dPST axons (green) innervating the lumbar MN pool (ChAT+, red) in both the SCI + AAV GFP and SCI + AAV-NT-3 groups. Inserts at high magnifications clearly show synaptic-like contacts between BDA+ dPST axons (green) and ChAT+ MNs (red) in merged images. (B) Terminals of BDA anterogradely-labeled dPST axons (green) express SYP (red), a presynaptic marker, indicating their formation of synaptic contacts on lumbar MNs in both the SCI + AAV GFP and SCI + AAV-NT-3 groups. Inserts at high magnification confirmed that BDA+ dPST axon terminals (green) co-localized with the presynaptic marker SYP (red). (C) After a T10 contusive SCI, spared dPST axons (BDA+, red) were found surrounding the lesion cavity (n = 6 mice/group). Scale bars: A and B, 50 μm; Box scale bars, 20 μm; C and D, 200 μm; Box scale bars, 50 μm. Abbreviations: AAV, adeno-associated virus (serotype 2); BDA, biotinylated dextran amine; ChAT, choline acetyltransferase; dPST, descending propriospinal tract; GFP, green fluorescent protein; MN, motoneuron; NT-3, neurotrophin-3; SCI, spinal cord injury; SYP, synaptophysin.
Figure 8 with 1 supplement
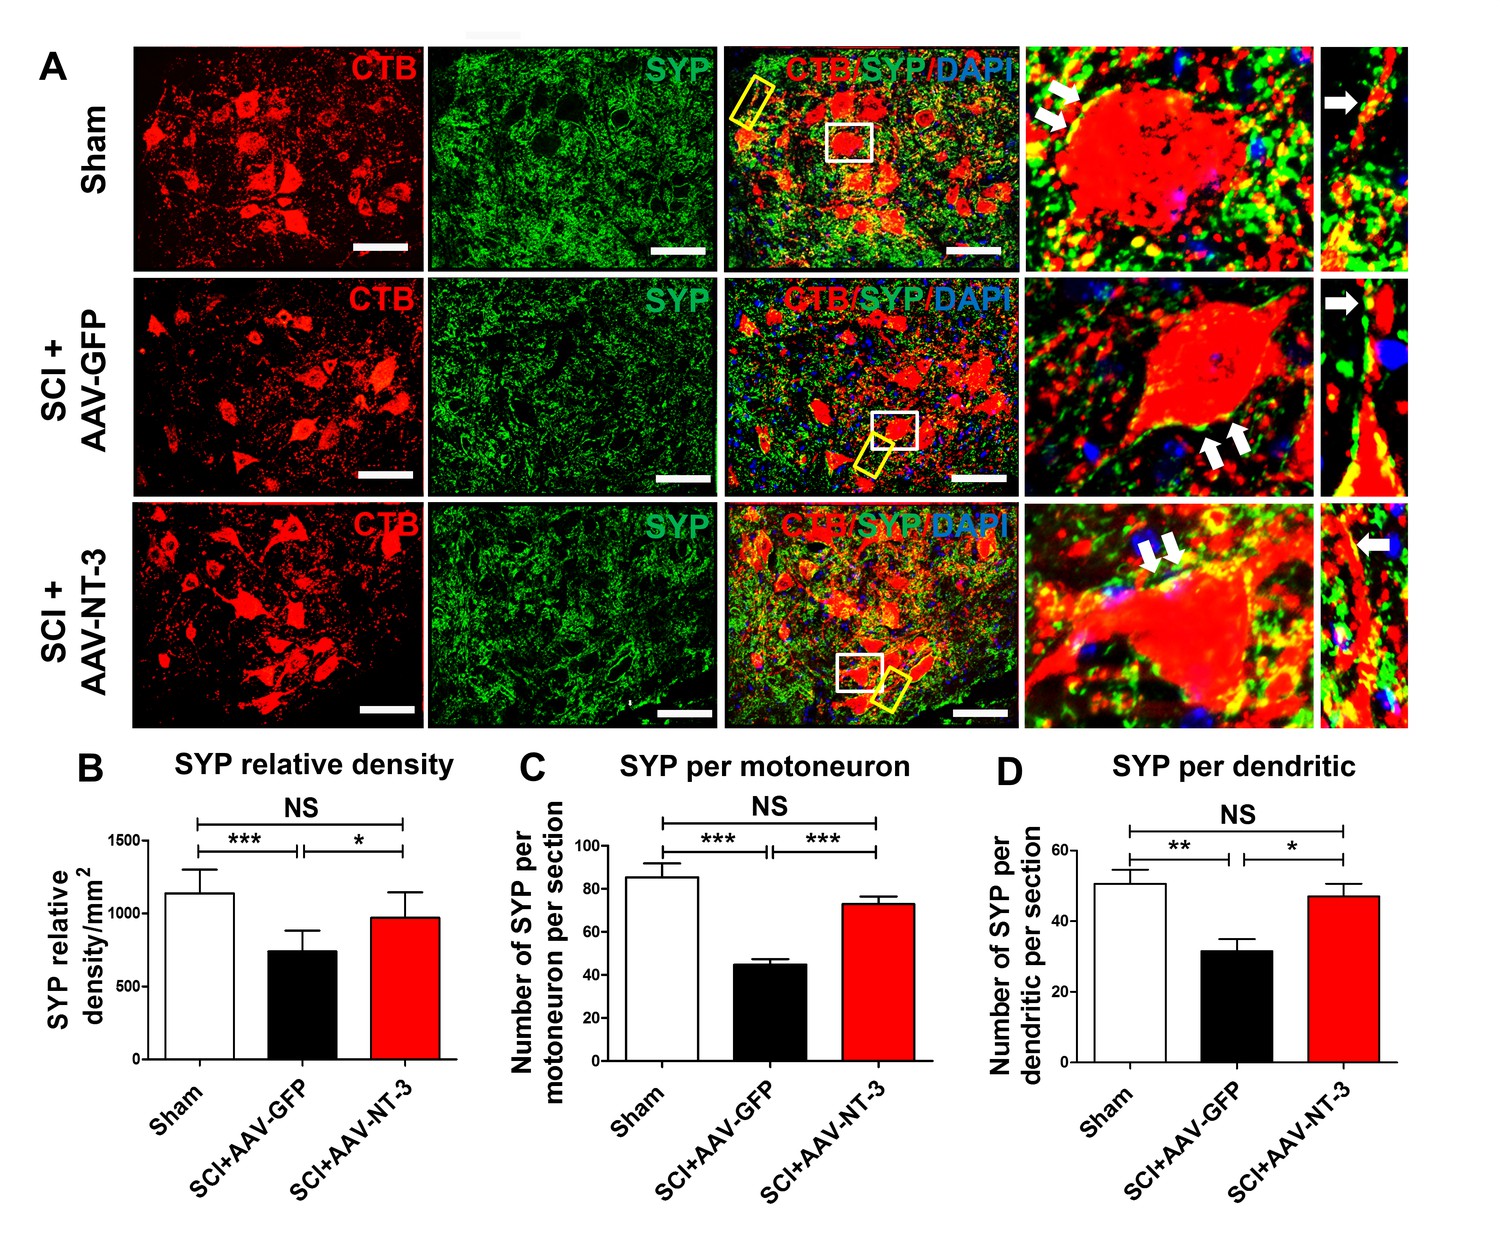
Retrogradely transported AAV-NT-3 enhanced synaptic density in the lumbar motoneuron pool.
(A) Confocal images show triple staining of CTB-labeled MNs (red), synaptophysin (SYP, a presynaptic marker, green), and DAPI (a nuclear dye, blue) in the lumbar MN pool of 3 treatment groups at 5 weeks post-SCI. High magnifications of boxed areas depict co-localization between SYP+ presynaptic terminals and lumbar MNs (white box, arrows) and their dendrites (yellow box, arrows), indicating of synaptic contacts. (B–D) Quantitative analyses of the SYP relative density (B), the number of SYP+ terminals per motor neuron per section (C), and the number of SYP+ terminals per dendrite per section (D). n = 6 mice/group. Error bars: mean ± SD. *p<0.05, **p<0.01, ***p<0.001, One-way ANOVA, Kruskal–Wallis post-hoc. Scale bars, 50 μm; Box scale bars, 20 μm. Abbreviations: AAV, adeno-associated virus (serotype 2); CTB, cholera toxin B subunit; DAPI, DAPI dihydrochloride; GFP, green fluorescent protein; NS, no significance; NT-3, neurotrophin-3; SCI, spinal cord injury; SD, standard error of the mean; SYP, synaptophysin.
Figure 8—figure supplement 1
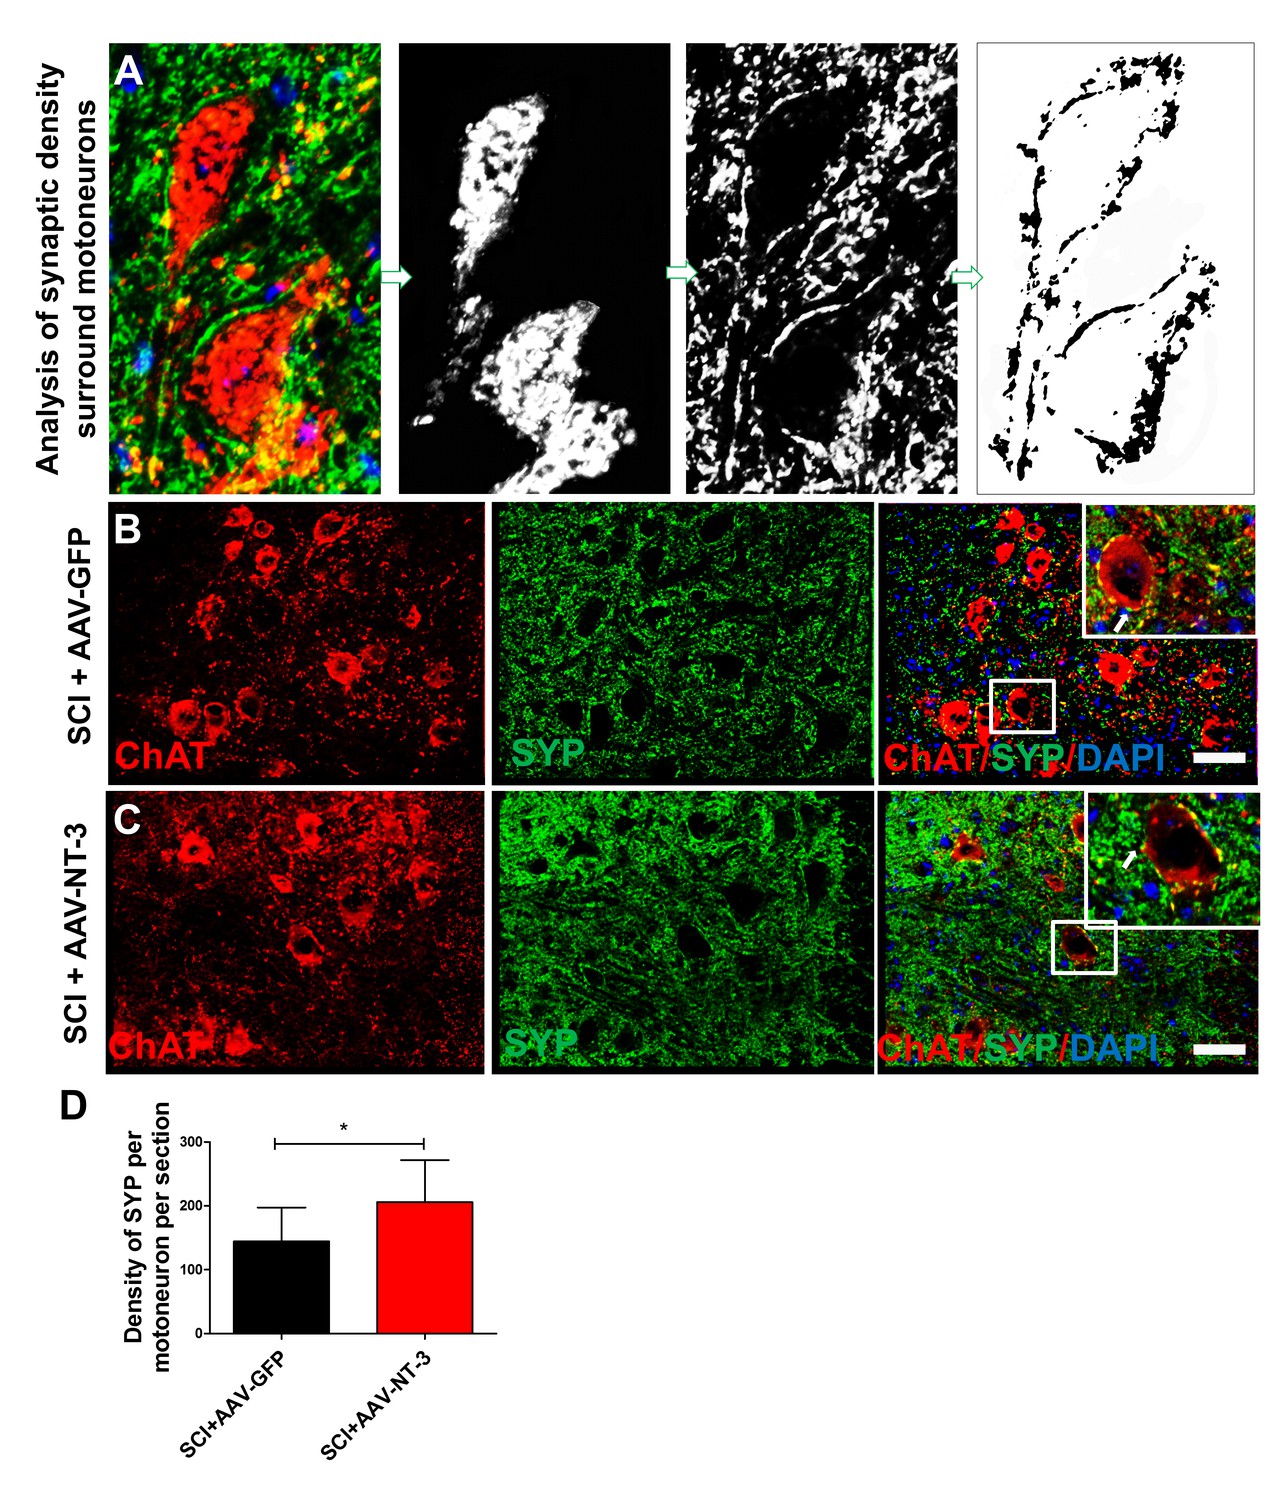
Quantitative assessments of BDA+terminals surrounding ChAT+lumbar MNs.
(A). Automatic selection of the soma of CTB-labeled MNs. A fixed threshold was used for the detection of the immunostaining and determination of a circular perimeter surrounding the soma. (B and C) Representative immunofluorescence staining for ChAT+ MNs (red), SYP+ presynaptic terminals (green) and DAPI+ nuclear staining (blue) in the lumbar MN pool in both the SCI + AAV GFP (B) and SCI + AAV-NT-3 groups (C). Inserts in B and C show co-localization of SYP+ terminals (red) with ChAT+ lumbar MNs (D) n = 6 mice/group, two-tailed Student’s t-test. *p<0.05. Scale bars: B, C, 50 μm. Abbreviations: AAV, adeno-associated virus (serotype 2); ChAT, choline acetyltransferase; DAPI, DAPI dihydrochloride; GFP, green fluorescent protein; NT-3, neurotrophin-3; SCI, spinal cord injury; SYP, synaptophysin.
Figure 9 with 1 supplement
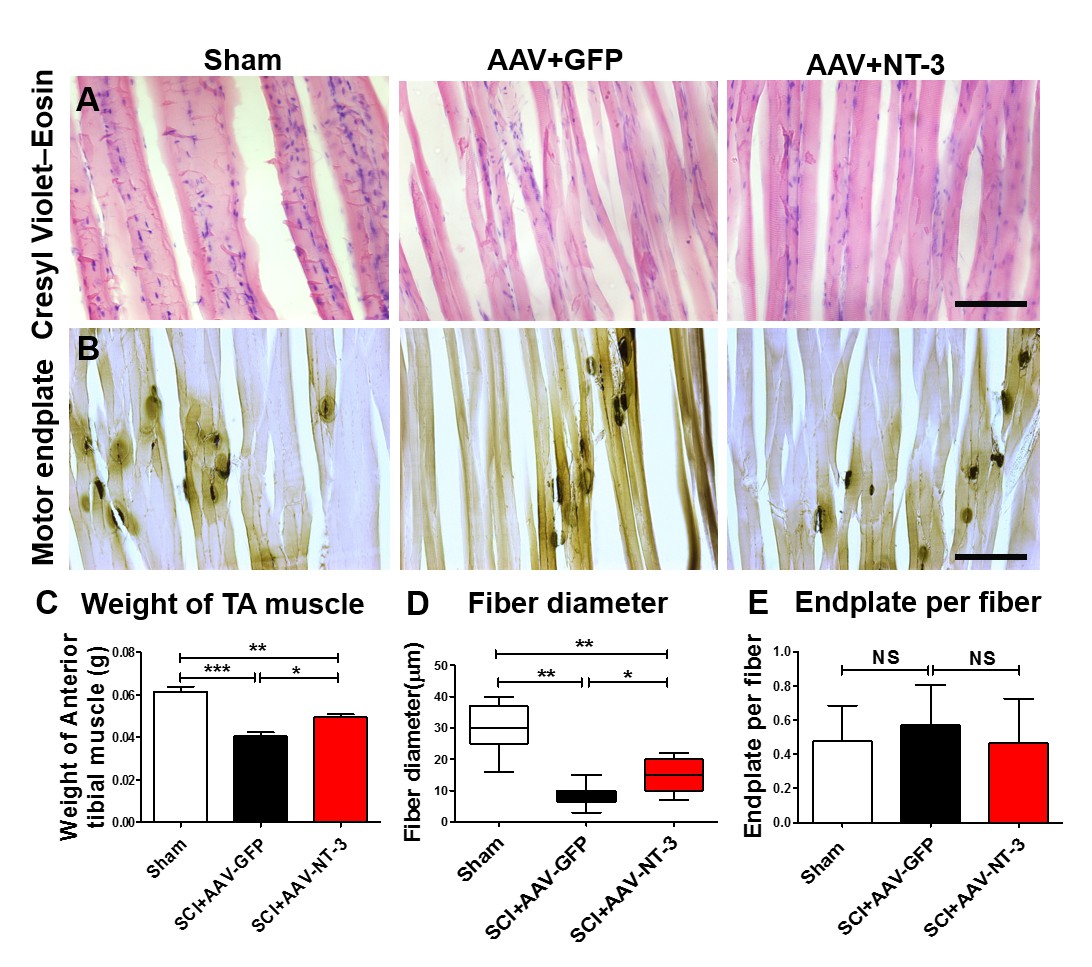
AAV-NT-3 increased muscle size and fiber diameter.
(A and B) Cresyl Violet–Eosin (A) and acetylcholinesterase (B) staining in Sham, SCI + AAV GFP and SCI + AAV-NT-3 groups. (C – E) Quantitative analyses of TA muscle weight (C), fiber diameter (D) and endplate per fiber (E) (n = 6 mice/group). Error bars, mean ± SD. *p<0.05, **p<0.01, One-way ANOVA, Kruskal–Wallis post-hoc. Abbreviations: AAV, adeno-associated virus (serotype 2); GFP, green fluorescent protein; NS, no significance; NT-3, neurotrophin-3; SCI, spinal cord injury; SD, standard error of the mean; TA, tibialis anterior.
Figure 9—figure supplement 1

Histological comparison between AAV-GFP and AAV-NT-3 groups at 5 weeks post-SCI.
(A and B) Cresyl Violet–Eosin (A1-3) and Luxol fast blue stained (B1-3) cross sections through the injury epicenter show SCI-induced tissue damage and myelin loss. (C–E) Quantitative analyses show no statistically significant difference in the lesion area (C), lesion volume (D) and myelin sparing (E) between the two treatment groups (n = 6 mice/group). Error bars = mean ± SD. Student’s t tests, Scale bars, 300 μm. Abbreviations: AAV, adeno-associated virus (serotype 2); GFP, green fluorescent protein; NS, no significance; NT-3, neurotrophin-3; SCI, spinal cord injury; SD, standard error of the mean. Dataset 1. Statistical Report Summary.
Author response image 1
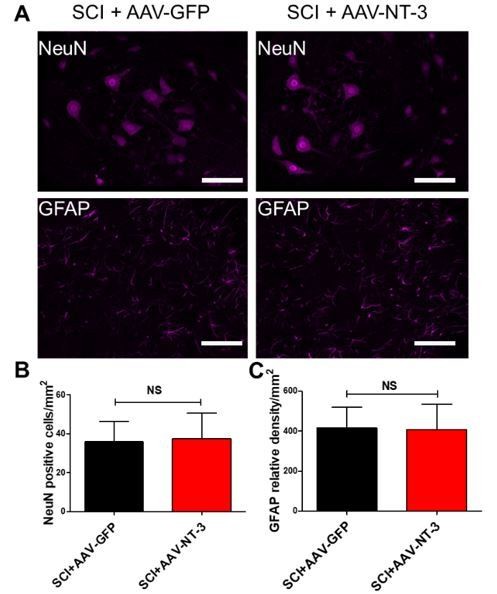
Effect of NT-3 on neuronal number and astrocytic integrated optical density (IOD) in the lumbar spinal cord.
(A) Representative images of neurons (NeuN-immunoreactive, IR) or astrocytes (GFAP-IR) in SCI + AAV-GFP and SCI + AAV-NT-3 treated animals in the lumbar spinal cord segments. (B-C) No statistical significant differences were found in the NeuN-IR neuronal number (B) and GFAP-IR IOD (C) between the two groups. Student’s t tests.
Author response image 2
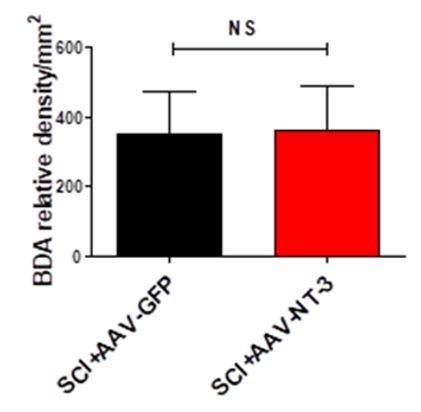
BDA relative density in SCI + AAV-GFP and SCI + AAV-NT-3 groups (n = 6/group). mean ± SD, Student’s t tests.
https://doi.org/10.7554/eLife.39016.025Tables
Table 1
Summary of experimental design and animal groups
https://doi.org/10.7554/eLife.39016.019| Groups | Treatments | Assessments | ||||||
|---|---|---|---|---|---|---|---|---|
| T10 contusion | Sciatic nerve | HRP | BDA | CTB | Behavior | Total | ||
| Sham | - | PBS | n = 4 | (n = 4) | n = 10 | (n = 10) | n = 14 | |
| SCI + AAV-GFP | + | Demyelination +AAV-GFP | n = 4 | (n = 4) | n = 13 | (n = 10) | n = 17 | |
| SCI + AAV-NT-3 | + | Demyelination +AAV-NT-3 | n = 4 | (n = 4) | n = 13 | (n = 10) | n = 17 | |
-
Note: HRP and BDA groups share the same animals. CTB and Behavior groups share the same animals. Abbreviations: AAV, adeno-associated virus, serotype 2; CTB, cholera toxin B; HRP, horseradish peroxidase; BDA, biotinylated dextran amine.
Table 2
Transient demyelination animal groups
https://doi.org/10.7554/eLife.39016.020| Groups | Treatments | Assessments (time after demyelination) | ||||||
|---|---|---|---|---|---|---|---|---|
| Virus | Sciatic nerve | 3 days IF | 5 weeks IF | 5 weeks ELISA | Behavior | Total | ||
| AAV-GFP | AAV-GFP | Transient demyelination | n = 3 | n = 3 | n = 3 | (n = 6) | n = 9 | |
| AAV-NT-3 | AAV-GFP + AAV-NT-3(1:1) | Transient demyelination | n = 3 | n = 3 | n = 3 | (n = 6) | n = 9 | |
-
Note: Behavior assessments used the same animals of the 5 week groups (IF and ELISA). Abbreviations: AAV, adeno-associated virus, serotype 2; ELISA, enzyme-linked immunosorbent assay; GFP, green fluorescent protein; IF, immunofluorescence; NT-3, neurotrophin-3.
Table 3
Primary and secondary antibodies used in this study
https://doi.org/10.7554/eLife.39016.021| Antigen | Host type | Working dilution | Manufacturer | Catalog# | Research resource identifiers (RRIDs) |
|---|---|---|---|---|---|
| Glial fibrillary acidic protein (GFAP) | Mouse Monoclonal IgG | 1:1000 | Invitrogen | G9269 | AB_477035 |
| β−3-Tubulin | Mouse Monoclonal IgG | 1:200 | Sigma, St. Louis, USA | T5293 | AB_477580 |
| Choline acetyltransferase (ChAT) | Goat Monoclonal IgG | 1:200 | Sigma, St. Louis, USA | ABIN350213 | AB_10781260 |
| CS-56 (CSPG) | Mouse Monoclonal lgM | 1:200 | Sigma, St. Louis, USA | C8035 | AB_476879 |
| ED-1 (CD-68) | Rabbit Monoclonal lgG | 1:200 | AbD Serotec, USA | MCA341R | AB_2291300 |
| Green fluorescent protein (GFP) | Chicken Monoclonal lgG | 1:1000 | Chemicon, USA | AB16901 | AB_11212200 |
| 5-Hydroxytryptamine (5-HT) | Mouse Monoclonal IgG | 1:200 | Abcam, USA | ab85615 | AB_10696528 |
| NeuN | Mouse Monoclonal IgG | 1:200 | Chemicon, USA | MAB377 | AB_2298772 |
| Neurofilament 200 (NF) | Rabbit Monoclonal lgG | 1:200 | Sigma, St. Louis, USA | N4142 | AB_477272 |
| Synaptophysin (SYP) | Mouse Monoclonal IgG | 1:1000 | Millipore/Life Technologies, USA | MAB5258 | AB_2313839 |
| SMI-31 | Mouse Monoclonal IgG | 1:200 | Covance, USA | SMI-31R-100 | AB_10122491 |
| S-100 | Mouse Monoclonal IgG | 1:200 | Sigma, St. Louis, USA | HPA015768 | AB_1856538 |
| Tyrosine Hydroxylase (TH) | Mouse Monoclonal IgG | 1:200 | Sigma, St. Louis, USA | T9573 | AB_261823 |
| Neurotrophin-3 (NT-3) | Rabbit Polyclonal IgG | 1:1000 | Santa Cruz Biotechnology, Santa Cruz, USA | sc-80250 | AB_1126615 |
| SecondaryAntibodies | |||||
| Alexa Fluor 488 (green) | Goat anti Chicken | 1:1000 | Invitrogen, USA | A11039 | AB_142924 |
| ExtrAvidin−FITC buffered aqueous solution | 1:200 | Sigma, St. Louis, USA | E2761 | AB_2492295 | |
| ExtrAvidin−TRITC buffered aqueous solution | 1:200 | Sigma, St. Louis, USA | E3011 | AB_2492295 | |
| FITC conjungated anti rabbit secondary antibody | Goat Polyclonal IgG | 1:200 | Sigma, St. Louis, USA | F0382 | AB_259384 |
| FITC conjungated anti mouse secondary antibody | Goat Polyclonal IgG | 1:200 | Sigma, St. Louis, USA | F5262 | AB_259638 |
| TRITC conjungated anti rabbit secondary antibody | Goat Polyclonal IgG | 1:200 | Sigma, St. Louis, USA | T6778 | AB_261740 |
| TRITC conjungated anti mouse secondary antibody | Goat Polyclonal IgG | 1:200 | Sigma, St. Louis, USA | T2402 | AB_261618 |
| CY5 conjungated anti mouse secondary antibody | Goat Polyclonal IgG | 1:200 | Invitrogen, USA | A10524 | AB_2534033 |
| Hoechst 33342 | 1:200 | Sigma, St. Louis, USA | 4082S | AB_10626776 |
Additional files
-
Transparent reporting form
- https://doi.org/10.7554/eLife.39016.022
Download links
A two-part list of links to download the article, or parts of the article, in various formats.
Downloads (link to download the article as PDF)
Open citations (links to open the citations from this article in various online reference manager services)
Cite this article (links to download the citations from this article in formats compatible with various reference manager tools)
Remodeling of lumbar motor circuitry remote to a thoracic spinal cord injury promotes locomotor recovery
eLife 7:e39016.
https://doi.org/10.7554/eLife.39016


