Anillin regulates epithelial cell mechanics by structuring the medial-apical actomyosin network
- University of Michigan, United States
- University of Pittsburgh, United States
Figures
Figure 1 with 2 supplements

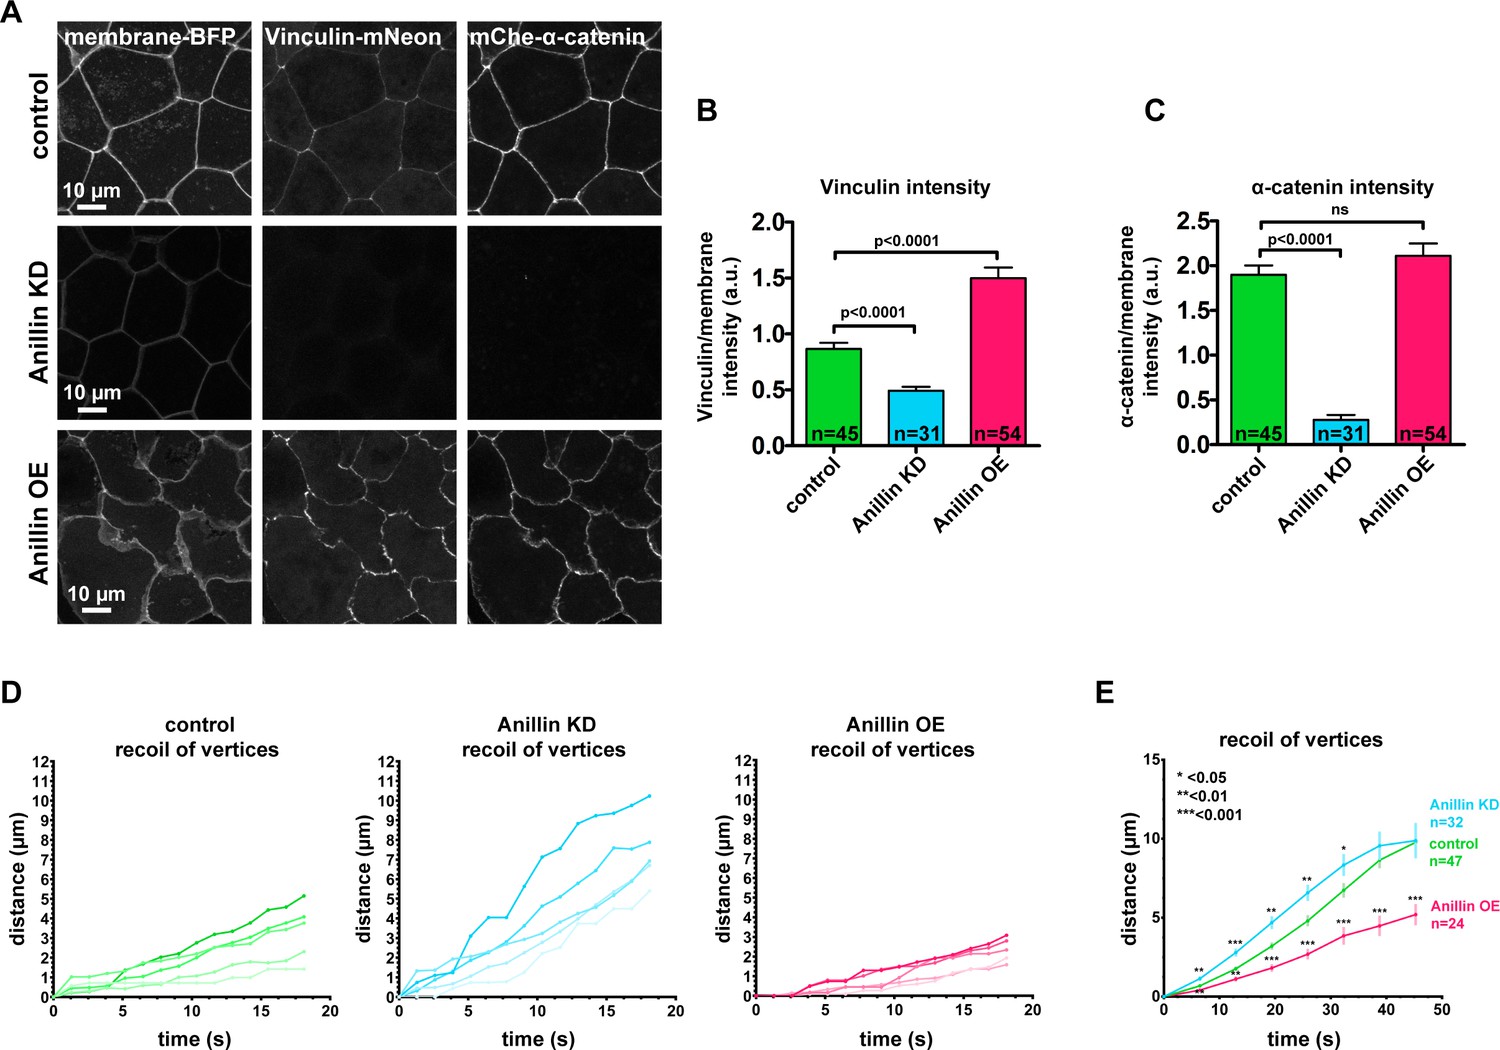
Anillin increases junctional vinculin recruitment but reduces recoil of junction vertices after laser ablation.
(A) Confocal images of live epithelial cells in gastrula-stage Xenopus laevis embryos expressing a probe for the plasma membrane (2x membrane localization signal of Src family tyrosine kinase Lyn tagged with TagBFP at its C-terminus) and inculin-mNeon when anillin is knocked down (KD) or overexpressed (OE). (B) Quantification of vinculin intensity as a ratio to membrane intensity. Measurements were taken by tracing a bicellular junction from vertex to vertex. Error bars, S.E.M. Statistics, unpaired t-test, n = number of junctions. (C) Cell view images showing E-cadherin tagged with 3xGFP prior to junctional laser ablation. Blue boxes show the zoomed area for the ablation montage. Vertical red lines indicate the initial location of junction vertices; green dots indicate the location of junction vertices measured after ablation. (D) Quantification of junction vertex separation over time after laser ablation (at time 0 s). Error bars, S.E.M. Statistics, unpaired t-test, n = number of junctions. (E) Quantification of initial junction length from vertex to vertex prior to ablation. Error bars, S.E.M. Unpaired t-tests between control and anillin KD or control and anillin OE resulted in no statistical significance; Control vs. KD, p=0.49, Control vs OE, p=0.69. (F) Cell view of embryo overexpressing anillin tagged with 3xmCherry. Blue boxes show the zoomed area for the ablation montage. Horizontal red lines indicate the initial location of junction vertices; green dashed line indicates the perpendicular separation between the two cells, and the gray dashed outline indicates the extracellular space forming between the two cells. Cartoon traces of the ablation data depicting the events during ablation are shown below. Pink circle indicates the site of laser ablation, green dashed line indicates perpendicular separation between cells, and pink arrows represent direction and magnitude of forces where larger arrows represent larger forces. (Unannotated data can be found Figure 1—figure supplement 2A).
-
Figure 1—source data 1
Source data for Figure 1B,D,E, Figure 1—figure supplement 1B,C,E and Figure 1—figure supplement 2C.
(Figure 1B) vinculin intensity at junctions with anillin perturbations. (Figure 1D) Junction recoil after laser ablation with anillin perturbations. (Figure 1E) Initial junction length before laser ablation. (Figure 1—figure supplement 1B,C) Junctional vinculin and α-catenin intensity with anillin perturbations. (Figure 1—figure supplement 1D) Example junction recoil after laser ablation with anillin perturbations. (Figure 1—figure supplement 1E) Junction recoil after laser ablation with anillin perturbations monitored for 45 s. (Figure 1—figure supplement 2C) Percentage of cells that separate perpendicularly after junctional laser ablation.
- https://doi.org/10.7554/eLife.39065.005
Figure 1—figure supplement 1
Anillin increases junctional vinculin recruitment but reduces recoil of junction vertices after laser ablation.
(A) Confocal images of live epithelial cells in gastrula-stage Xenopus laevis embryos expressing a probe for the plasma membrane (2x membrane localization signal of Src family tyrosine kinase Lyn tagged with TagBFP at its C-terminus), mCherry-α-catenin, and Vinculin-mNeon as a junctional tension sensor when anillin is knocked down (KD) or overexpressed (OE). (B) Quantification of vinculin intensity as a ratio to membrane intensity. Measurements were taken by tracing a bicelllular junction from vertex to vertex. Error bars, S.E.M. Statistics, unpaired t-test, n = number of junctions. (C) Quantification of α-catenin intensity as a ratio to membrane intensity. Measurements were taken by tracing a bicelllular junction from vertex to vertex. Error bars, S.E.M. Statistics, unpaired t-test, n = number of junctions. D) Examples of individual junction recoil after laser ablation (at time 0 s) for control, anillin KD and anillin OE. Examples were randomly selected from averaged data in Figure 1D. (E) Quantification of junction vertex separation after laser ablation (at time 0 s). These data were measured from the same data set in Figure 1D but over a longer time period. Error bars, S.E.M. Statistics, unpaired t-test, n = number of junctions.
Figure 1—figure supplement 2
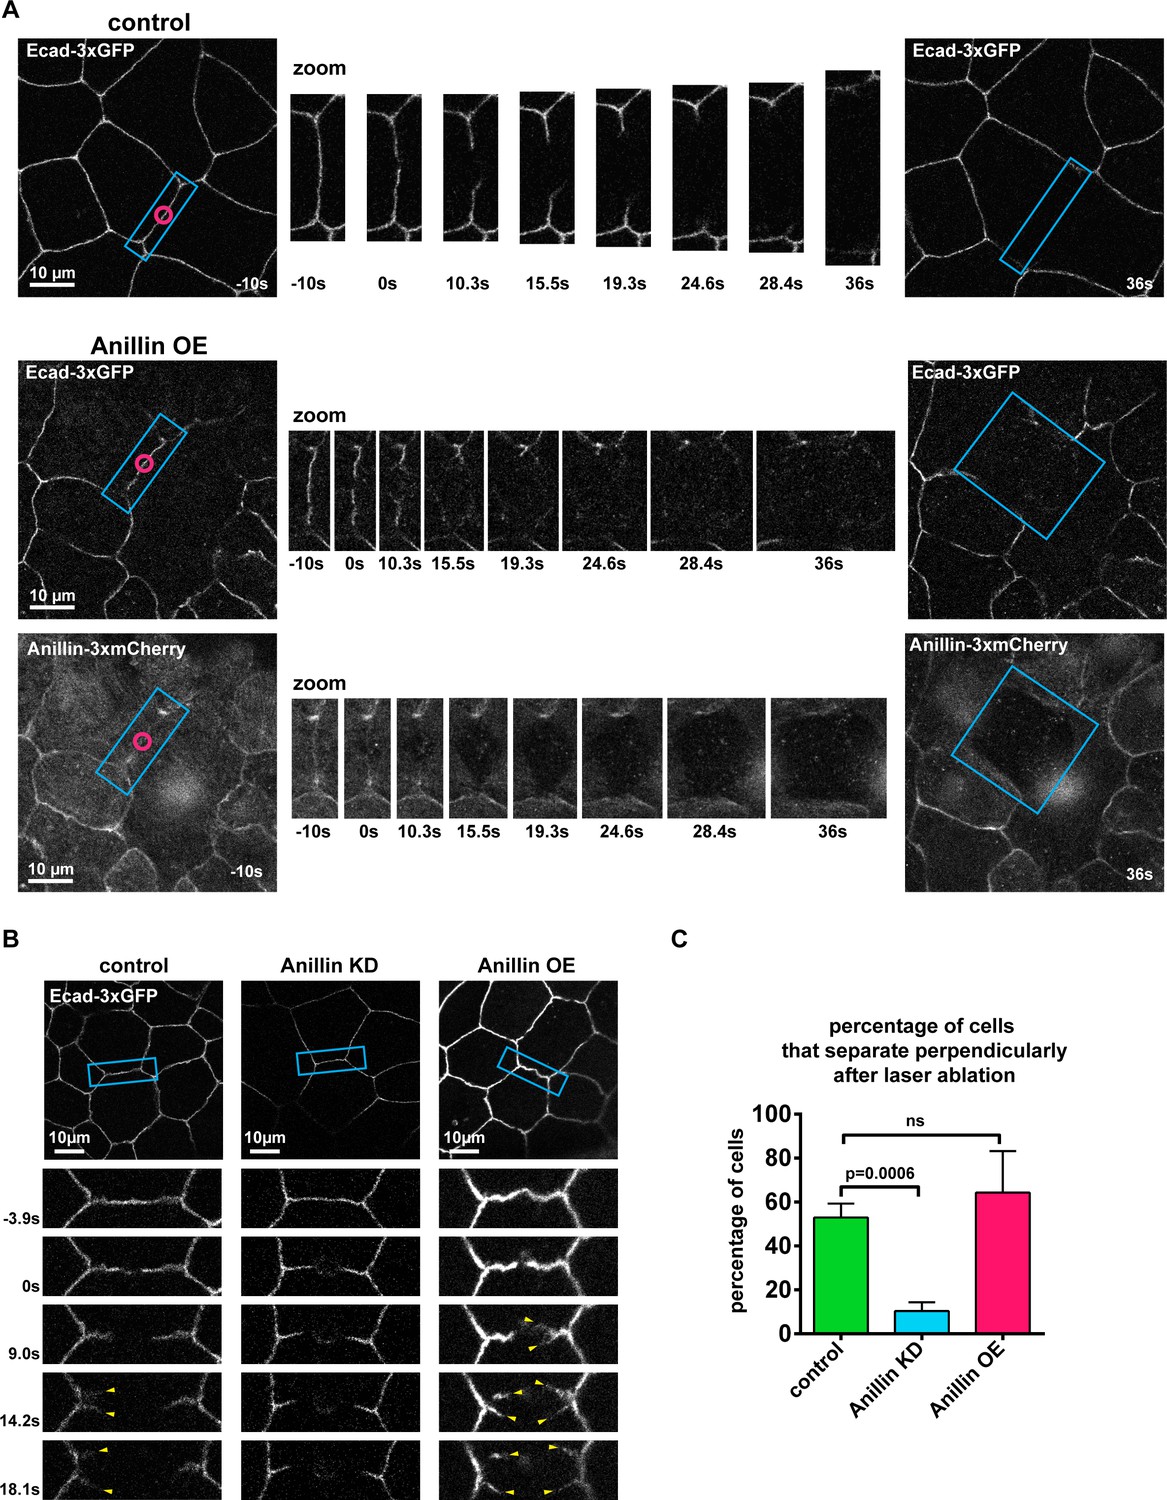
Anillin increases perpendicular junction separation after junctional laser ablation.
(A) Confocal images of E-cadherin tagged with 3xGFP (Ecad-3xGFP) signal in a control embryo or an embryo overexpressing anillin tagged with 3xmCherry. Anillin overexpressing example is an unannotated version of Figure 1F. Blue boxes show the zoomed area for the ablation montage, pink circles show site of laser ablation. (B) Confocal images of embryos expressing Ecad-3xGFP showing examples of perpendicular junction separation in controls or when anillin is knocked down or overexpressed. Yellow arrowheads indicate perpendicular junction separation (E-cadherin splaying where the stubs of the junction left after laser ablation were peeled apart). (C) Percentage of cells that undergo perpendicular junction separation from the data in Figure 1D and Figure 1—figure supplement 2B. Each movie was examined three times, and perpendicular separation was defined as any junctions splitting in two like the control and anillin overexpression examples shown in B. Error bars, S.E.M. Statistics, unpaired t-test, n = number of junctions.
Figure 2

Anillin structures medial-apical F-actin and myosin II.
(A) Confocal images of fixed epithelial cells from gastrula-stage control, anillin knockdown (KD), or anillin overexpression (OE) Xenopus laevis embryos stained for anillin (α-anillin) and F-actin (Alexa Fluor 488 phalloidin). Blue boxes show zoomed areas. (B) Confocal images of live epithelial cells expressing Anillin-3xmCherry and Lifeact-GFP (probe for F-actin). Yellow boxes show zoomed areas. (C) Confocal images of live epithelial cells expressing probes for myosin II (SF9-mNeon) and membrane (membrane-TagBFP). (D) Confocal images of live epithelial cells expressing probes for myosin II (SF9-mNeon) and F-actin (Lifeact-RFP). Yellow boxes show zoomed area. Notice how medial-apical myosin II decorates the F-actin bundles. (E) Quantification of medial-apical F-actin intensity from fixed embryos measured by a circular ROI 10 µm in diameter in the center of each cell. Error bars, S.E.M. Statistics, unpaired t-test. (F) Quantification of medial-apical myosin II intensity measured by a circular ROI 10 µm in diameter in the center of each cell. Medial-apical myosin II intensity was normalized by dividing by junctional membrane intensity. Error bars, S.E.M. Statistics, unpaired t-test.
-
Figure 2—source data 1
Source data for Figure 2E,F.
- https://doi.org/10.7554/eLife.39065.009
Figure 3 with 1 supplement
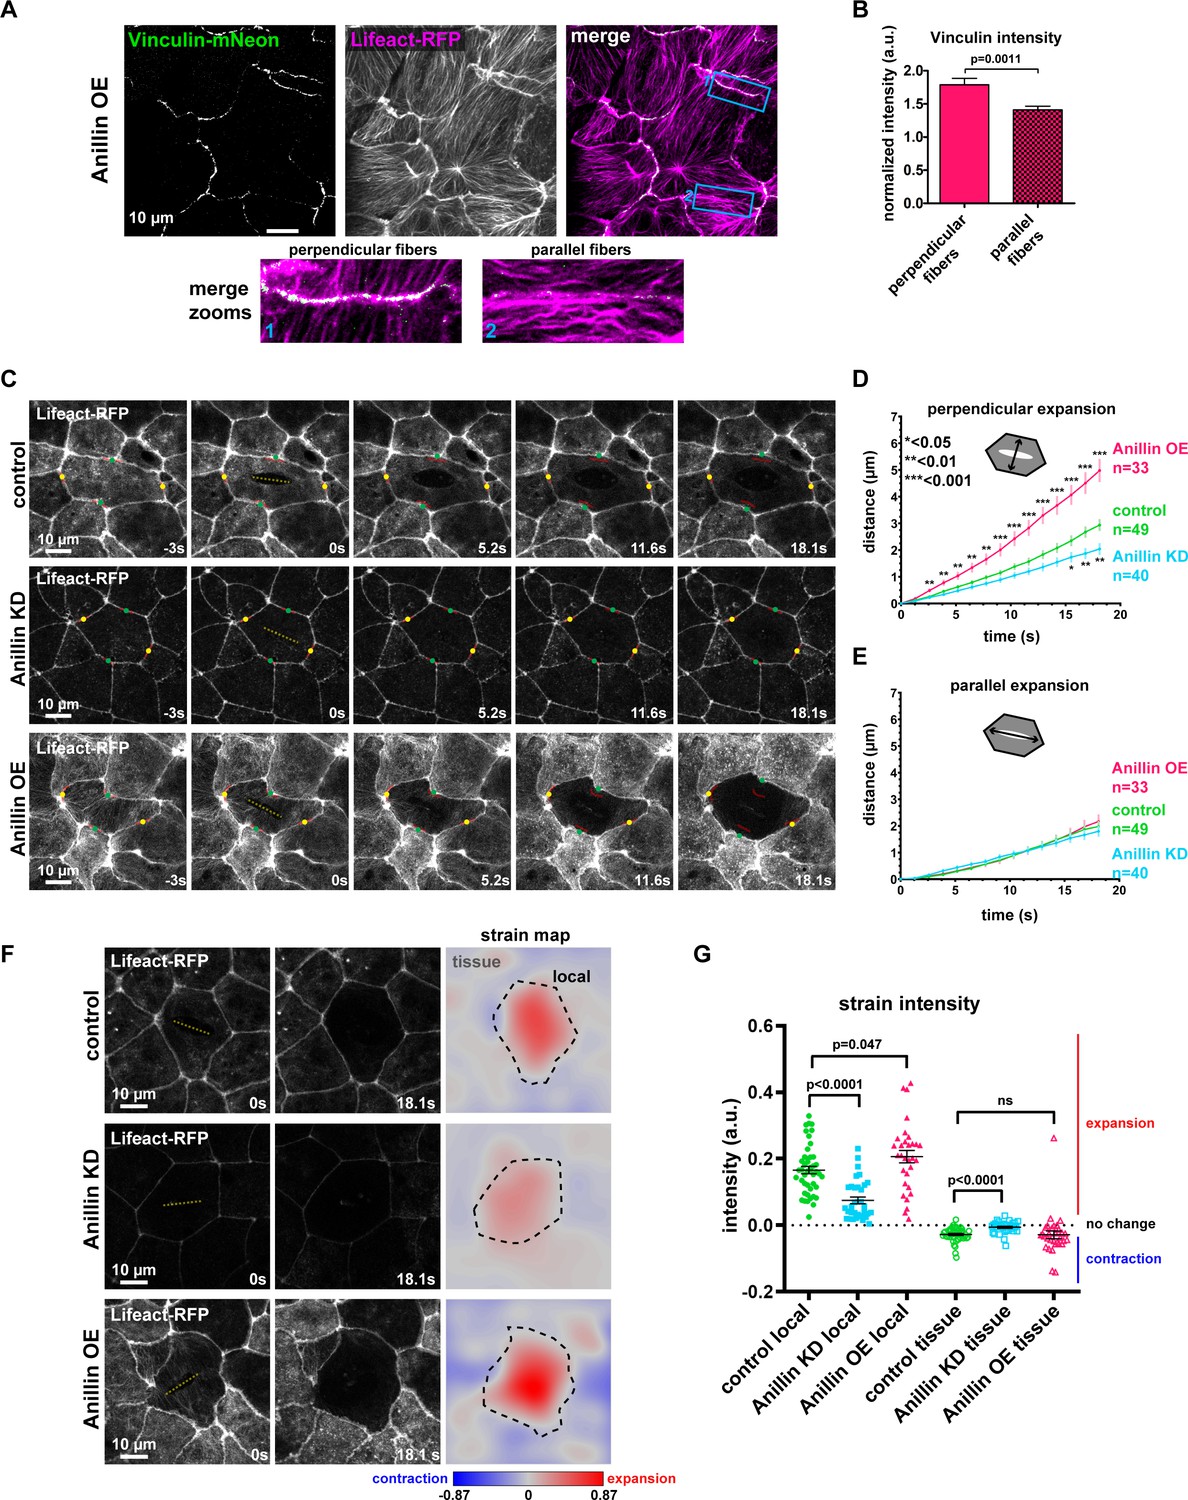
Anillin increases tensile forces and strain energy stored across the medial-apical surface of epithelial cells.
(A) Confocal images of live epithelial cells in a gastrula-stage Xenopus laevis embryo expressing Vinculin-mNeon along with probes for F-actin (Lifeact-RFP) and the plasma membrane (2x membrane localization signal of Src family tyrosine kinase Lyn tagged with TagBFP at its C-terminus, not shown) when anillin is overexpressed (OE). The brightness and contrast of the Vinculin-mNeon channel was adjusted to make vinculin signal visible in the merged image; unadjusted images were used for quantification. (B) Quantification of vinculin intensity normalized to membrane intensity. Measurements were taken by tracing a bicelllular junction from vertex to vertex at junctions with F-actin fibers connected perpendicularly to the junction or F-actin fibers running parallel to the junction. Error bars, S.E.M. Statistics, unpaired t-test, perpendicular n = 38, parallel n = 38, n = number of junctions. (C) Single-plane confocal images of medial-apical cortex ablation in cells expressing Lifeact-RFP and E-cadherin-3xGFP (not shown). Yellow dashed lines indicate the medial-apical ablation site. Red lines indicate the initial position of junctions. The points measured between junctions post-ablation are indicated by green dots (distance perpendicular to cut site) and yellow dots (distance parallel to cut site). (D) Quantification of cell opening perpendicular to the cut site measured as the junction-to-junction distance by a line drawn perpendicular to the cut site. Error bars, S.E.M. Statistics, unpaired t-test, n = number of cells. (E) Quantification of cell opening parallel to the cut site measured as the junction-to-junction distance by a line drawn parallel to the cut site. Error bars, S.E.M. Statistics, unpaired t-test, n = number of cells. (F) The first two columns show single-plane confocal images of medial-apical cortex ablation in cells expressing Lifeact-RFP at 0 s (time of ablation) and 18.1 s after ablation. The third column shows strain area mapped to the images. Pixel intensity represents area strain and indicates how the 2D surface changes shape over 18.1 s. A phase lookup table was applied to the strain maps with blue representing contraction and red indicating expansion. Yellow dashed line indicates medial-apical ablation site, black dashed line represents the 18.1 s cell outline where the area strain map intensity was measured for ‘local’ strain; the area outside the black dashed line was measured as ‘tissue’ strain. (G) Quantification of local and tissue strain mean intensities. Error bars, S.E.M. Statistics, unpaired t-test.
-
Figure 3—source data 1
Source data for Figure 3B,D,E,G and Figure 3—figure supplement 1A,B,C.
(Figure 3B) Junctional vinculin intensity with perpendicular or parallel bundles of F-actin when anillin is overexpressed. (Figure 3D) Junction recoil perpendicular to the cut site after medial-apical laser ablation with anillin perturbations. (Figure 3E) Junction recoil parallel to the cut site after medial-apical laser ablation with anillin perturbations. (Figure 3G) Local and tissue strain intensity after medial-apical ablation with anillin perturbations. (Figure 3—figure supplement 1A) Initial junction-to-junction distance perpendicular to the medial-apical cut site. (Figure 3—figure supplement 1B) Initial junction-to-junction distance parallel to the medial-apical cut site. (Figure 3—figure supplement 1C) Ratio of initial junction-to-junction distance perpendicular/parallel to cut site.
- https://doi.org/10.7554/eLife.39065.013
Figure 3—figure supplement 1
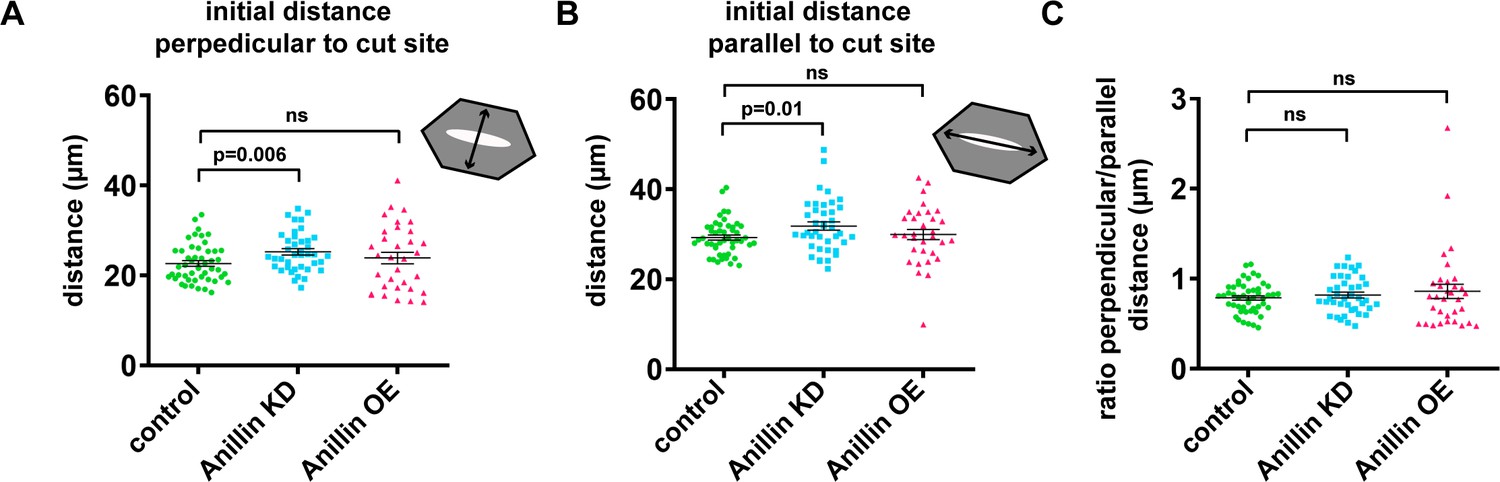
Cell sizes and shapes were similar across medial-apical laser ablation experiments.
(A) Quantification of the initial junction-to-junction distance measured by a line drawn perpendicular to the cut site. Error bars, S.E.M. Statistics, unpaired t-test. (B) Quantification of the initial junction-to-junction distance measured by a line drawn parallel to the cut site. Error bars, S.E.M. Statistics, unpaired t-test. (C) Quantification of initial cell geometry as a ratio of the initial perpendicular distance to the initial parallel distance (measured in A and B). Error bars, S.E.M. Statistics, unpaired t-test.
Figure 4 with 1 supplement
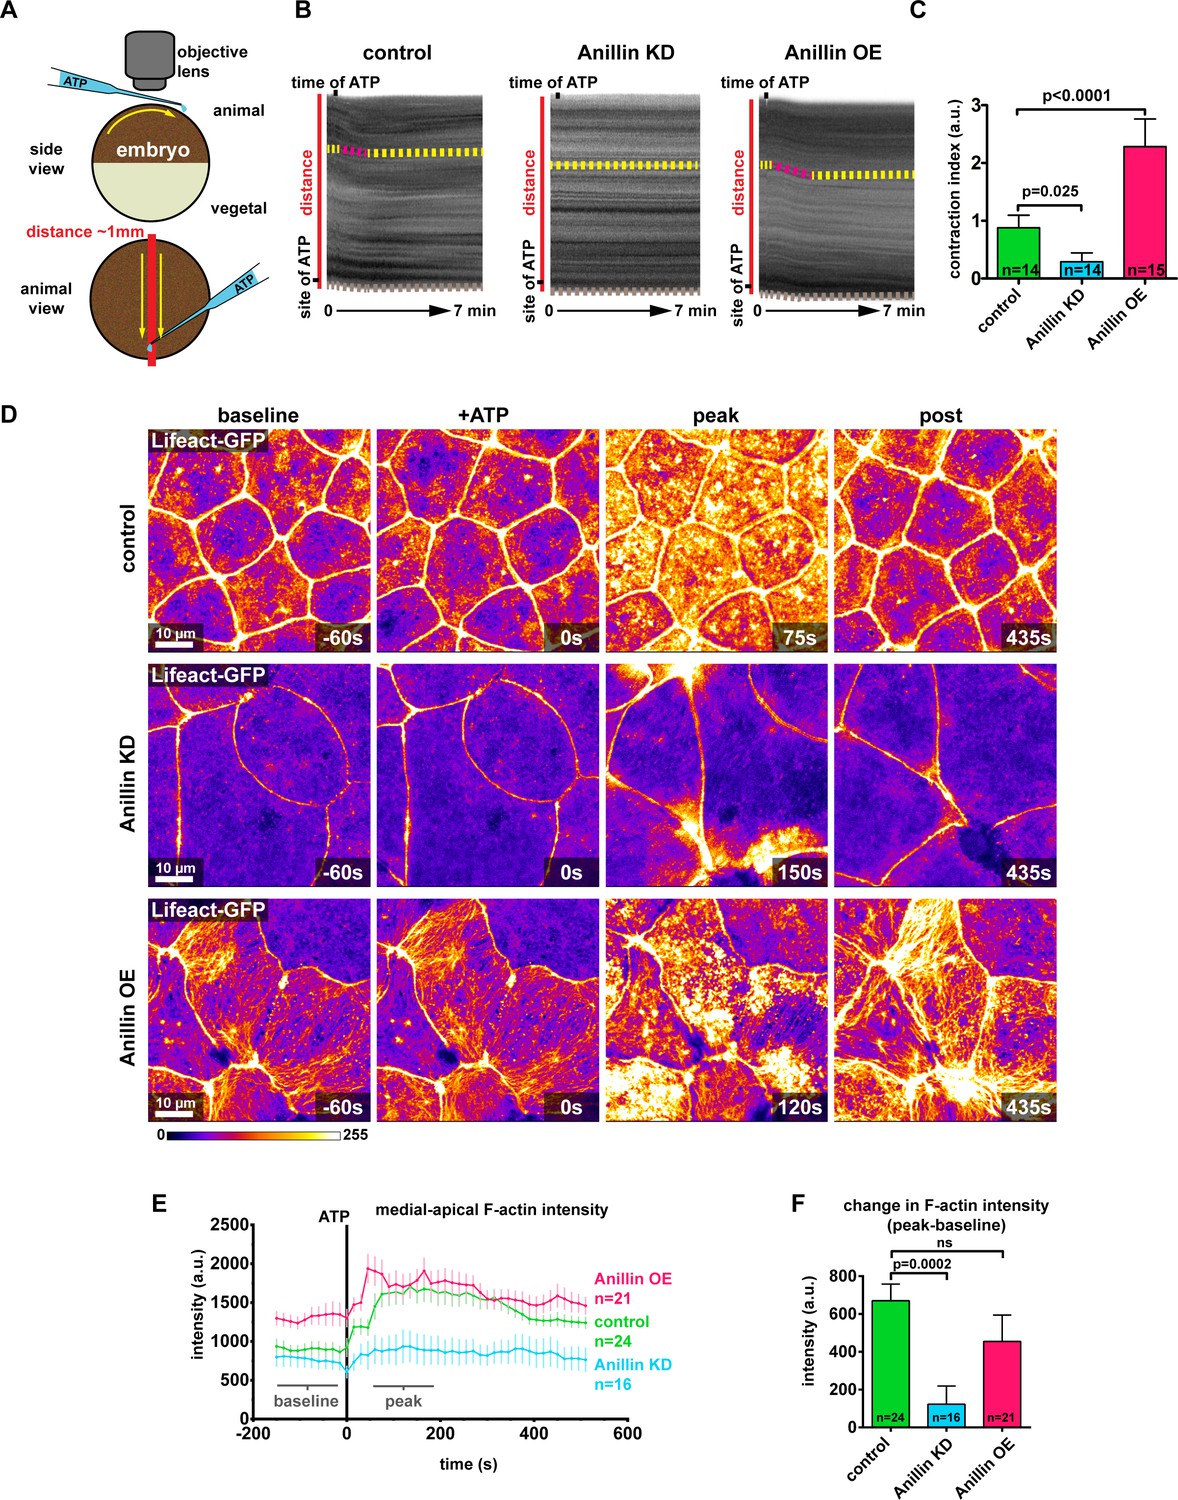
Anillin establishes a contractile medial-apical actomyosin network.
(A) Diagram of whole embryo extracellular ATP addition experiments. 40 nl of 50 mM ATP (blue) was micropipetted onto one side of the animal hemisphere of gastrula-stage embryos. A video was captured of the embryo over time, and kymographs were generated by drawing a line across the entire embryo (red line). Yellow arrows represent the direction of contraction towards the site of ATP addition. (B) Kymographs of the animal hemisphere generated from light microscopy videos. The fluctuations in gray scale intensity are caused by the natural variations in pigment of the embryos. Contraction towards the site of ATP can be observed as a shift in the embryo’s pigment towards the site of ATP addition. Yellow dashed lines represent periods of no contraction, and pink dashed lines represent contraction events. Brown dashed lines at the bottom of the kymograph represent movement of the whole embryo. (C) Quantification of the contraction index measured from kymographs. Contraction index is the difference between the shift in a pigment over time (sum of the length of yellow and pink dashed lines in B) and the movement of the whole embryo over time (brown line in B). Statistics, unpaired t-test, n = number of embryos. (D) Confocal images of live epithelial cells with F-actin probe Lifeact-GFP. After the addition of 500 µM ATP, notice the accumulation of medial-apical F-actin in controls and anillin overexpressing cells, while F-actin only increases near the junctions in anillin knockdown cells. The movement of cells across the field of view in controls and anillin knockdown was caused by flow of solution when ATP was added. (E) Quantification of medial-apical F-actin (Lifeact-GFP) intensity over time measured by a circular ROI 10 µm in diameter in the center of each cell. Statistics, unpaired t-test, n = number of cells. (F) Comparison of the change in medial-apical F-actin (Lifeact-GFP) intensity before and after ATP addition. The difference between peak and baseline F-actin intensity was measured for each embryo by averaging the peak 10 frames (from 60 s to 195 s) and subtracting the baseline 10 frames (−15 s to −150 s). Statistics, unpaired t-test, n = number of cells.
-
Figure 4—source data 1
Source data for Figure 4C,E,F and Figure 4—figure supplement 1B.
(Figure 4C) Embryo contraction after ATP addition with anillin perturbations. (Figure 4E) Medial-apical F-actin intensity over time, after ATP addition, with anillin perturbations. (Figure 4F) Change in medial-apical F-actin intensity after ATP addition, with anillin perturbations. (Figure 4—figure supplement 1B) F-actin intensity after ATP addition over time, measured near the junction or at the medial-apical center of the cells.
- https://doi.org/10.7554/eLife.39065.017
Figure 4—figure supplement 1
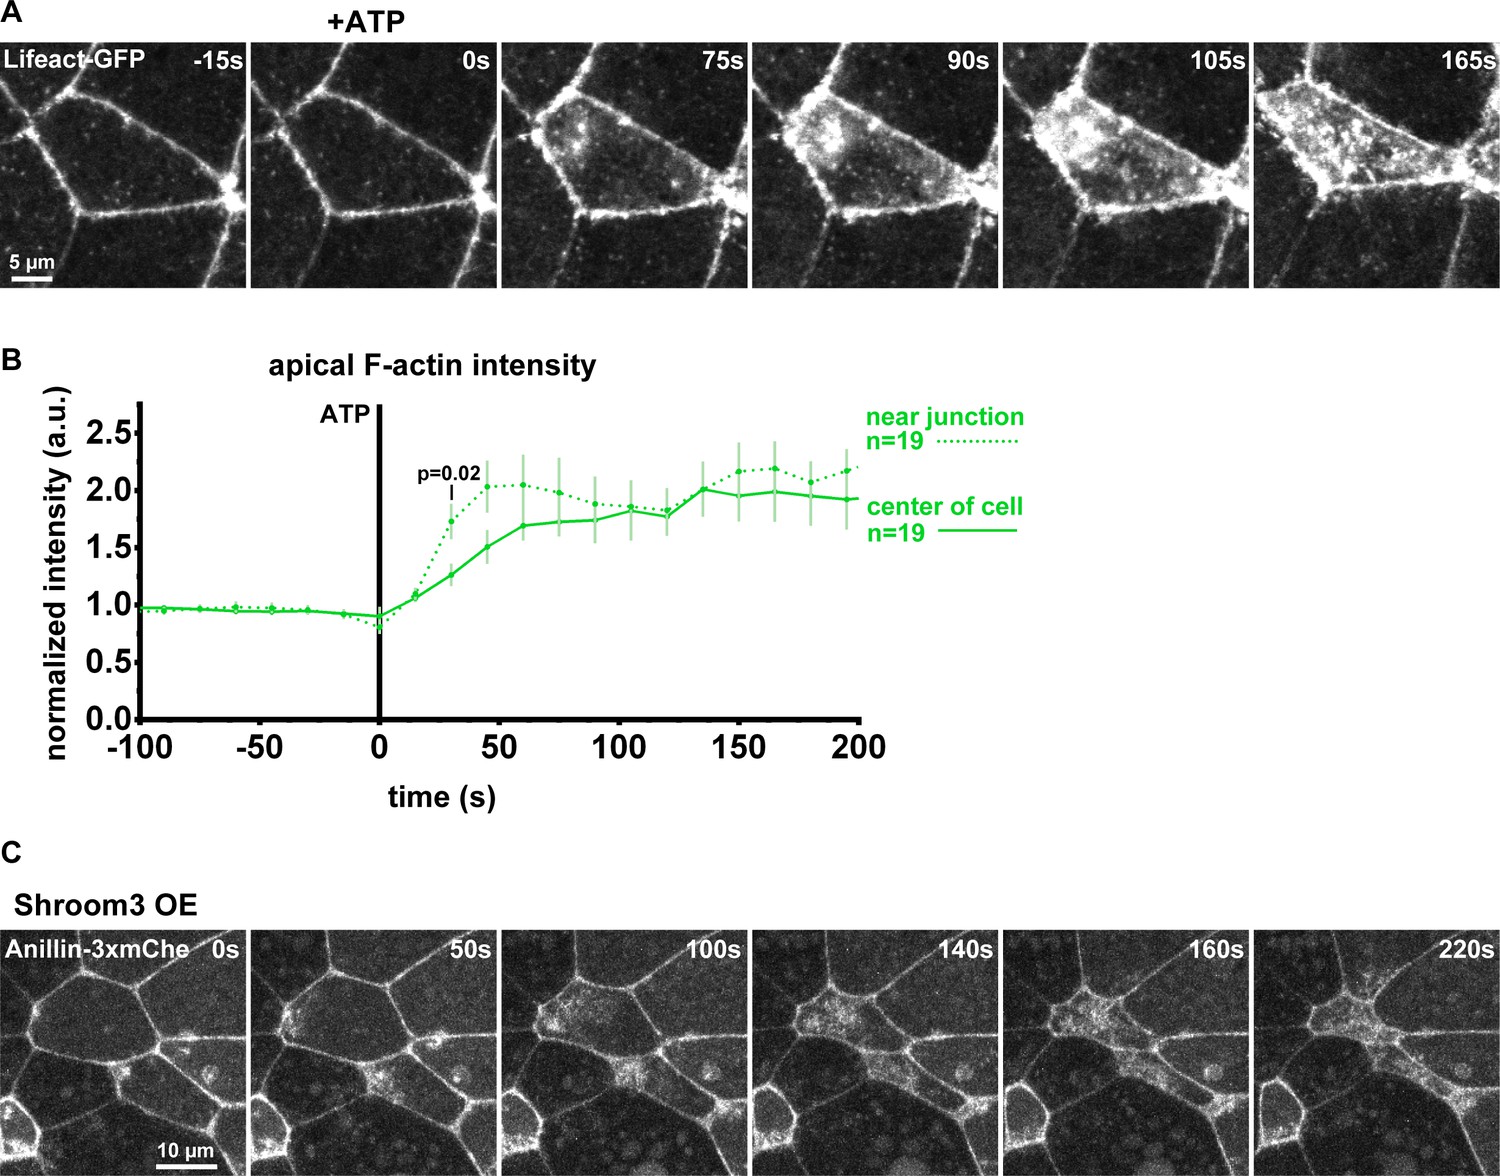
In apically constricting cells, F-actin and anillin accumulation emanates from junctions and spreads medial-apically.
(A) Confocal images of live epithelial cells from gastrula-stage Xenopus laevis embryos expressing a probe for F-actin (Lifeact-GFP). Exogenous ATP is added at time 0 to induce contraction. Notice how F-actin accumulates first near the junctions and then spreads medial-apically. (B) Apical F-actin intensity measured using an ROI with a 5 µm diameter near the junction or in the center of the cell. Error bars, S.E.M. Statistics, unpaired t-test, n = number of cells. (C) Confocal images of live epithelial cells expressing Anillin-3xmCherry at low levels and overexpressing Shroom3 to induce apical constriction. Notice how anillin accumulates first near the junctions and then spreads across the medial-apical surface of constricting cells.
Figure 5
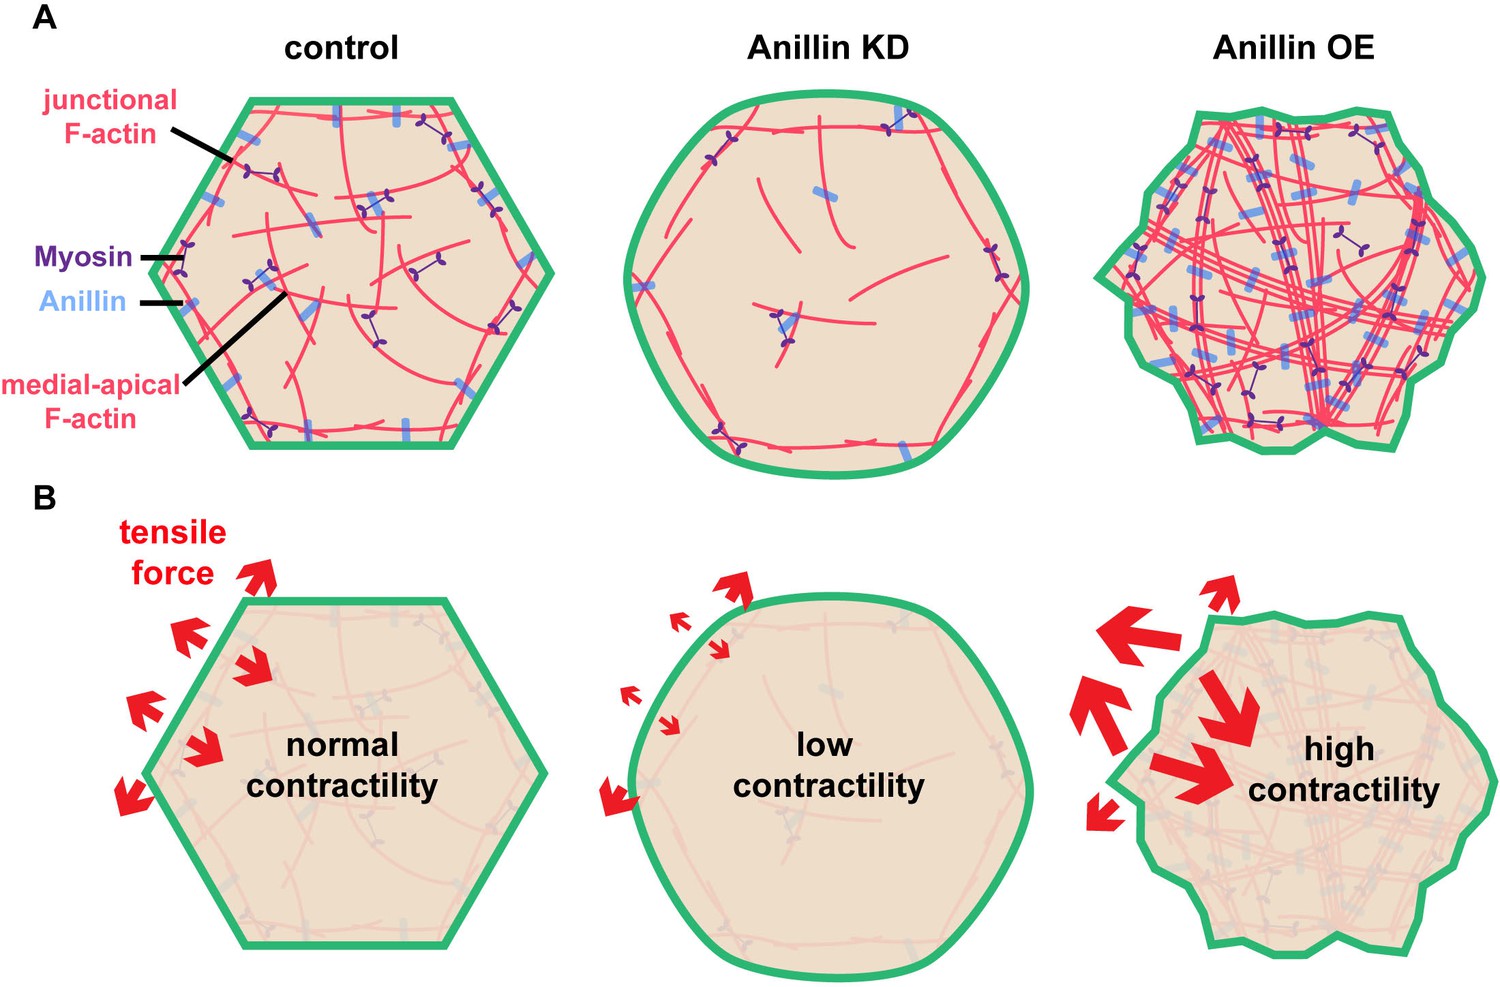
Anillin organizes medial-apical actomyosin and regulates the orientation of tensile forces applied on junctions.
(A) Diagram of the apical surface of epithelial cells showing junctional and medial-apical F-actin and anillin in control embryos or when levels of anillin are perturbed. When anillin is knocked down, medial-apical F-actin is strongly reduced, and when anillin is overexpressed, medial-apical F-actin is reorganized into thick bundles decorated with myosin II that span the apical surface. (B) Diagram depicting the changes in the orientation of actomyosin-mediated forces applied on cell–cell junctions when anillin is perturbed. When anillin is knocked down, the medial-apical actomyosin is not robustly contractile, reducing forces perpendicular to the junction. When anillin is overexpressed, perpendicular forces on cell–cell junctions are increased due to the large contractile bundles of F-actin that connect perpendicular to the junction.
Figure 6
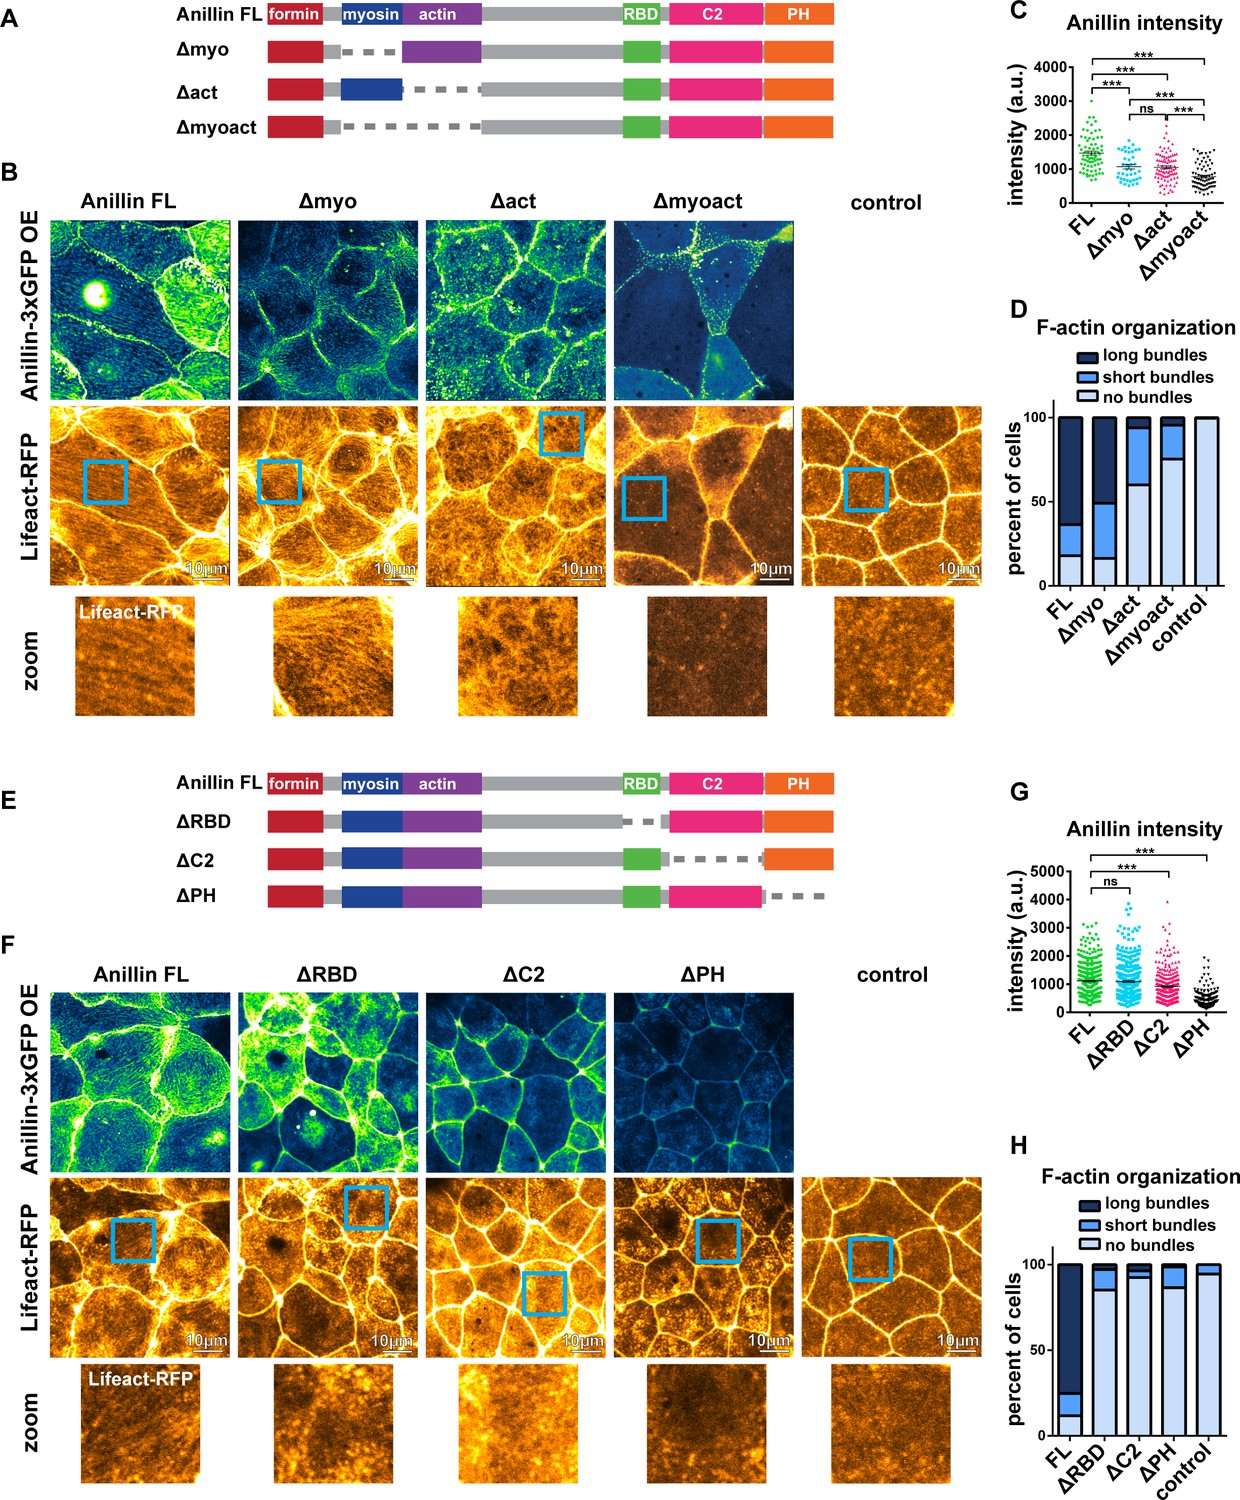
Anillin’s F-actin- and Rho-binding domains are necessary for structuring the medial-apical F-actin network.
(A) Domain diagram of full length anillin and N-terminal domain deletions. Full length (FL), Rho binding domain (RBD), pleckstrin homology (PH). (B) Confocal images of live epithelial cells from gastrula-stage Xenopus laevis embryos expressing either Anillin FL or anillin domain deletions tagged with 3xGFP along with Lifeact-RFP to probe for F-actin. Blue boxes show zoomed areas. (C) Quantification of anillin construct intensity measured by a circular ROI 10 µm in diameter in the center of each cell. Statistics, unpaired t-test, *** p =<0.001, n = number of cells. (D) Blinded categorization of medial-apical F-actin bundle organization in cells. FL, n = 306; Δmyo, n = 112; Δact, n = 61; Δmyoact, n = 57; control, n = 110 cells. (E) Domain diagram of Anillin FL and C-terminal domain deletions. (F) Confocal images of live epithelial cells from gastrula-stage Xenopus laevis embryos expressing either Anillin FL or anillin domain deletions tagged with 3xGFP and Lifeact-RFP to probe for F-actin. (G) Quantification of anillin construct intensity measured by a circular ROI 10 µm in diameter in the center of each cell. Statistics, unpaired t-test, *** p =<0.001, n = number of cells. (H) Blinded categorization of medial-apical F-actin bundles in cells. FL, n = 395; ∆RBD, n = 352; ∆C2, n = 332; ∆PH, n = 287; control, n = 109 cells.
-
Figure 6—source data 1
Source data for Figure 6C,D,G,H.
(Figure 6C) Medial-apical anillin intensity (N-terminal mutants). (Figure 6D Blinded classification of medial-apical F-actin organization in cells with anillin perturbations (N-terminal mutants). (Figure 6G) Medial-apical anillin intensity (C-terminal mutants). (Figure 6H) Blinded classification of medial-apical F-actin organization in cells with anillin perturbations (C-terminal mutants).
- https://doi.org/10.7554/eLife.39065.022
Figure 7 with 1 supplement

Anillin regulates epithelial cell mechanics by stabilizing medial-apical F-actin.
(A) Single plane confocal images of live epithelial cells from gastrula-stage Xenopus laevis embryos expressing actin tagged with mNeon (Actin-mNeon) in control, anillin overexpressing (OE), or Anillin Δactin-binding domain OE embryos. White dashed circle shows the medial-apical area bleached in the zoomed view montages on the right. The percent of original fluorescence intensity (normalized to 100%) is indicated below each of the zoomed views. (B) Medial-apical Actin-mNeon Fluorescence Recovery After Photobleaching (FRAP) data fitted with a two phase association curve. n = number of cells. (C) Mobile fractions from FRAP data. Error bars, S.E.M. Statistics, unpaired t-test, n = number of cells. (D) Confocal images of live epithelial cells expressing a probe for F-actin (Lifeact-GFP). Top image was taken before the addition of 20 µm jasplakinolide. Bottom image of the same field of view was taken 1 hr after the addition of jasplakinolide. (E) Single plane confocal images showing E-cadherin tagged with 3xGFP (E-cad-3xGFP) prior to junction laser ablation for a control embryo (2% EtOH) and an embryo treated with 20 µm jasplakinolide. Blue boxes show the zoomed area for the ablation montage. Red lines indicate the initial location of junction vertices, green dots indicate the location of junction vertices measured after ablation. (F) Quantification of vertex separation over time after ablation (at time 0). Error bars, S.E.M. Statistics, unpaired t-test, n = number of cells (G) Confocal images of an embryo expressing E-cad-3xGFP and treated with 20 µm jasplakinolide before and after laser ablation. Blue boxes show the zoomed area for the ablation montage. Red lines indicate the initial position of the vertices, green dashed line indicates the perpendicular separation between the two cells, gray dashed line indicates the space forming between the two cells, and blue arrows represent forces on junctions adjacent to the lower cell vertex. Notice that the lower vertex only begins to separate in the parallel direction after the forces perpendicular to the adjacent junction (blue arrows) lead to loss of adhesion between the two cells.
-
Figure 7—source data 1
Source data for Figure 7B,C,F and Figure 7—figure supplement 1A,B,C.
(Figure 7B) Fluorescence recovery after photobleaching (FRAP) of medial-apical actin in control, full length anillin overexpression, or Anillin ∆act overexpression. (Figure 7C) Curve fit data from 7B, which was used to calculate average mobile fraction and statistics of medial-apical actin FRAP. (Figure 7F) Junction recoil after laser ablation with and without jasplakinolide treatment. (Figure 7—figure supplement 1A) Medial-apical actin FRAP when anillin was knocked down. (Figure 7—figure supplement 1B) Junction recoil after laser ablation with anillin knockdown and anillin knockdown treated with jasplakinolide. (Figure 7—figure supplement 1C) Percentage of cells that separate perpendicularly after junction laser ablation.
- https://doi.org/10.7554/eLife.39065.025
Figure 7—figure supplement 1
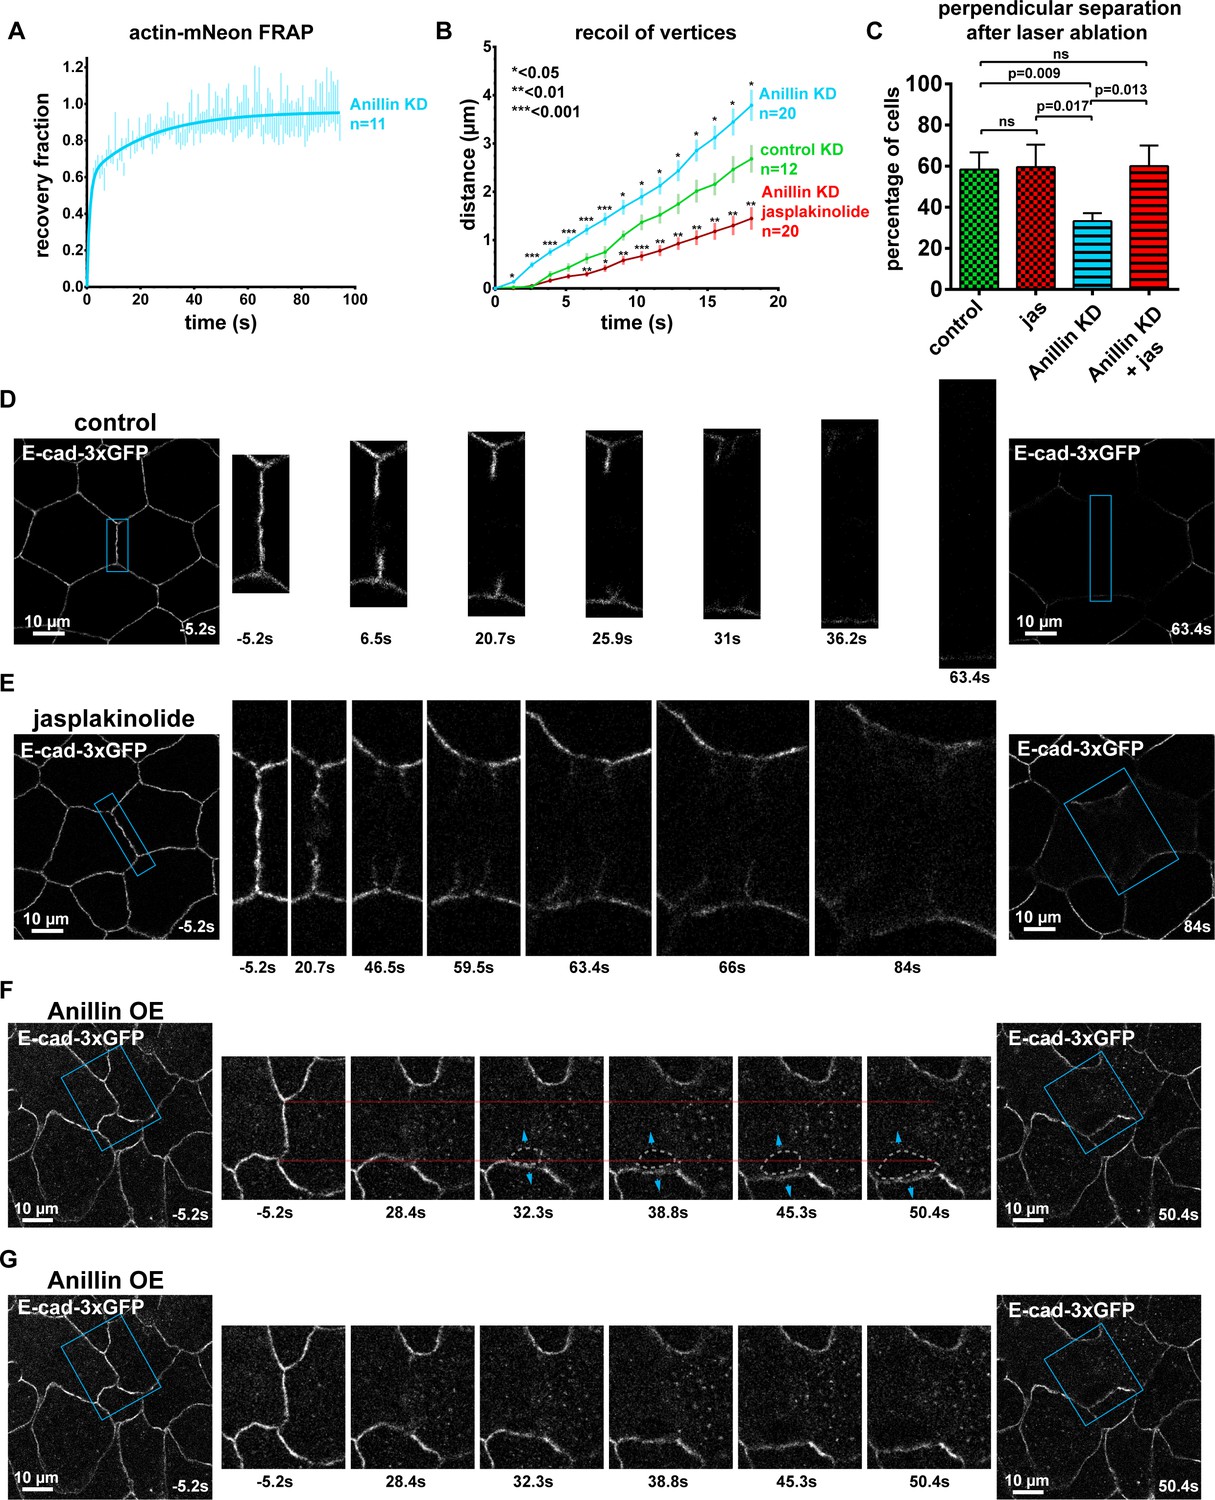
Stabilizing F-actin rescues anillin knockdown junction recoil defect after laser ablation.
(A) Medial-apical FRAP data for Actin-mNeon highly expressed in anillin knockdown (KD) gastrula-stage Xenopus laevis embryos. Data fitted with a two phase association curve. n = number of cells. (B) Quantification of vertex separation over time after ablation (at time 0 s). Error bars, S.E.M. Statistics, unpaired t-test, n = number of junctions. (C) Percentage of cells that undergo perpendicular junction separation from the data shown in Figure 7F and Figure 7—figure supplement 1B. Controls and anillin KD were treated with 2% EtOH, jas samples were treated with 20 µm jasplakinolide. Each movie was examined three times, and perpendicular separation was defined as any junctions that exhibited E-cadherin splaying where the stubs of the junction left after laser ablation were peeled apart. Error bars, S.E.M. Statistics, unpaired t-test, n = number of junctions, (D) Cell view of control gastrula-stage Xenopus laevis embryo expressing E-cad-3xGFP before and after laser ablation. Blue boxes show the zoomed areas for the ablation montage. (E) Unannotated version of laser ablation results in Figure 7G. Cell view of a gastrula-stage Xenopus laevis embryo expressing E-cad-3xGFP and treated with 20 µm jasplakinolide. Blue boxes show the zoomed areas for the ablation montage. (F) Cell view of an embryo expressing E-cad-3xGFP and overexpressing Anillin-3xmCherry (not shown) before and after laser ablation. Blue boxes show the zoomed areas for the ablation montage. Red lines indicate the initial position of the junction vertices, gray dashed line indicates the space forming between the two cells, and blue arrows represent forces between junctions adjacent to the measured vertex. Notice how the lower vertex only begins to separate (moving away from the red line) after the forces perpendicular to the adjacent junction (blue arrows) cause loss of adhesion between the two cells. (G) Unannotated version of laser ablation results in E.
Figure 8 with 1 supplement
Anillin promotes tissue stiffness.
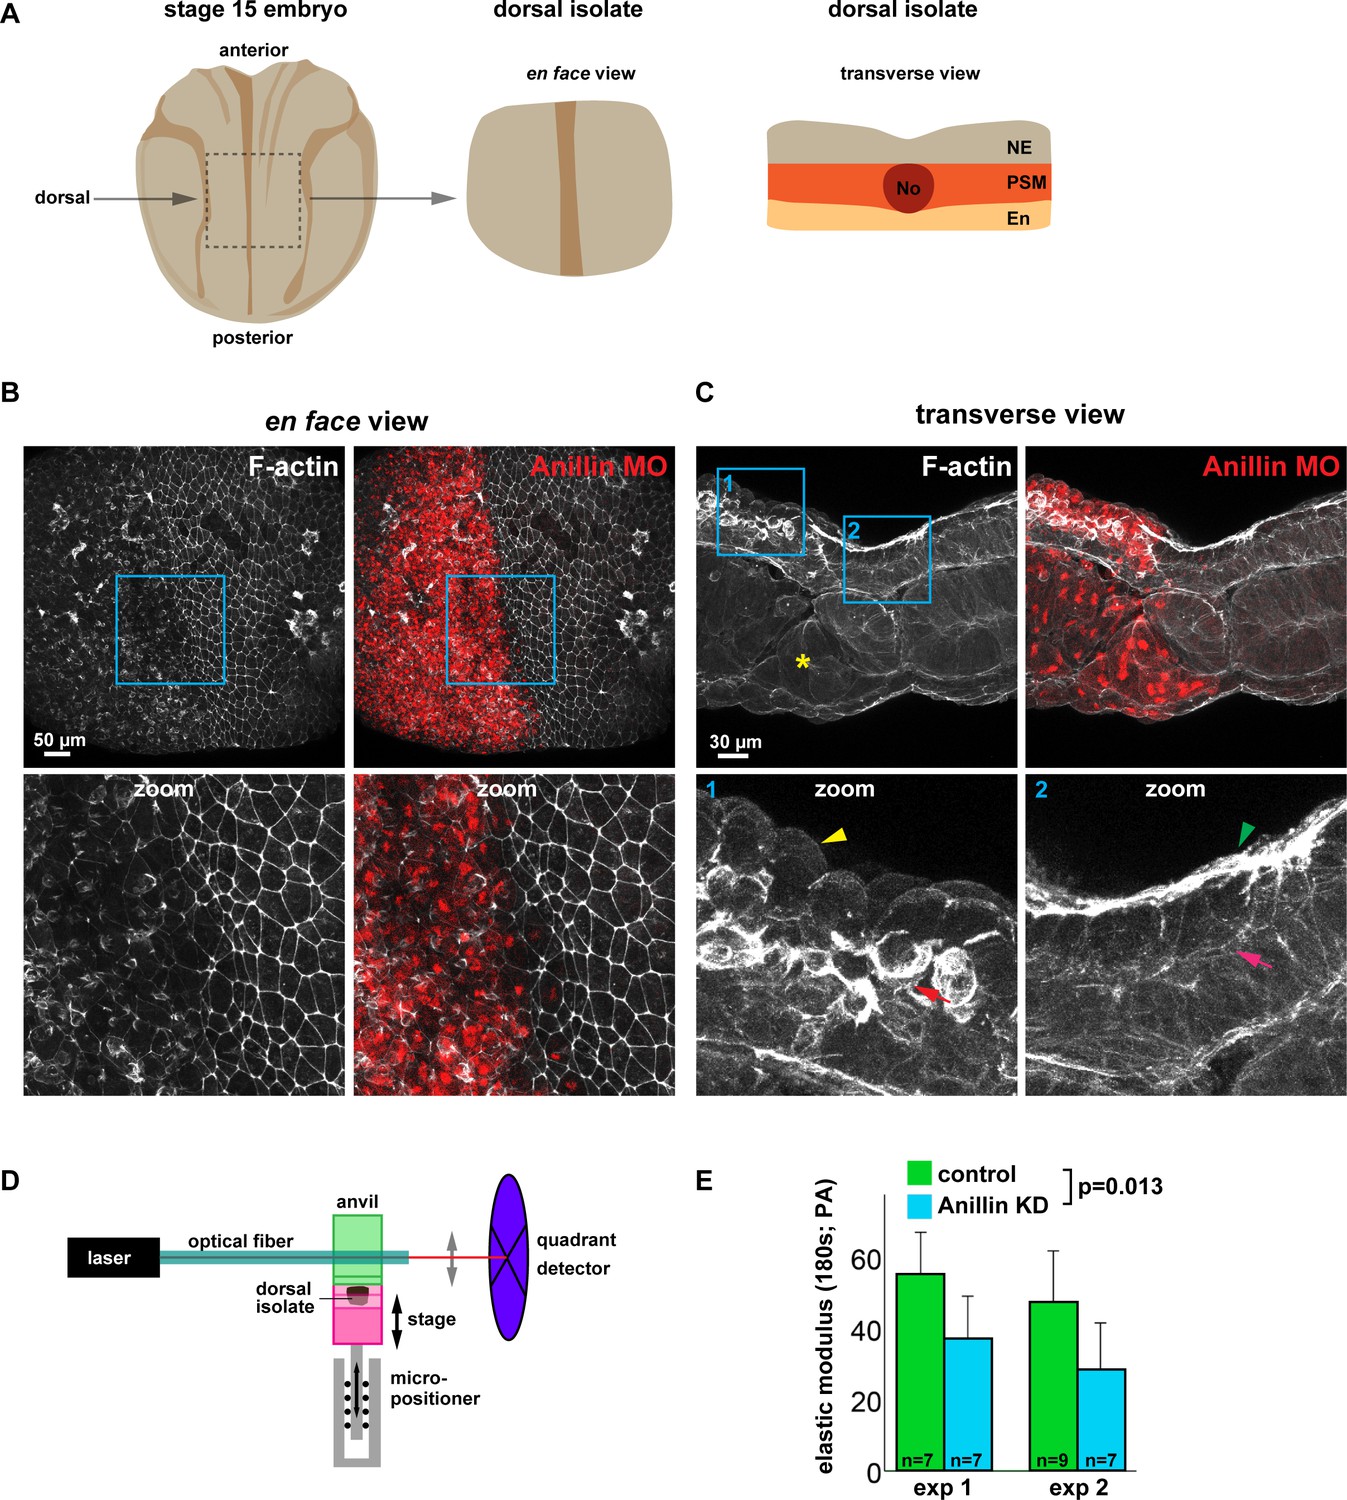
(A) Cartoons of a stage 15 Xenopus laevis embryo and dorsal isolate (based on Nieuwkoop and Faber). Transverse view shows the neural ectoderm (NE), presomitic mesoderm (PSM), endoderm (En), and notochord (No). (B) En face images of fixed dorsal isolates, z-projected (~50 microns deep). F-actin was stained using phallacidin tagged with BODIPY FL. Anillin morpholino was co-injected with Alexa Fluor 647-conjugated Dextran as a lineage tracer. Blue boxes represent zoomed areas below. Notice the reduced junctional and medial-apical F-actin in anillin-depleted neural ectoderm. (C) Transverse section views of the dorsal isolates. Blue boxes show zoomed areas below. Anillin knockdown epithelial cells exhibit an apically domed morphology and loss of F-actin on their apical surface (yellow arrowhead), enhanced basolateral F-actin (red arrow), and disrupted mesoderm organization (yellow asterisk). Control epithelial cells have a flat apical morphology with robust F-actin (green arrowhead) and little basal F-actin (pink arrow). (D) Diagram of the nanoNewton Force Measurement Device, which measures resistive force generated by the tissue isolate in response to compression using a force-calibrated optical fiber. A computer-controlled stage compresses the tissue isolate against an anvil attached to the optical fiber, and the resistive force is measured using the deflection of the optical force probe. (E) Quantification of the stiffness of dorsal isolates. Tissue stiffness is significantly reduced when anillin is knocked down. Statistics, 2-way ANOVA, n = number of dorsal isolates.
-
Figure 8—source data 1
(Figure 8E) Dorsal isolate elastic modulus with anillin knockdown.
- https://doi.org/10.7554/eLife.39065.030
Figure 8—figure supplement 1
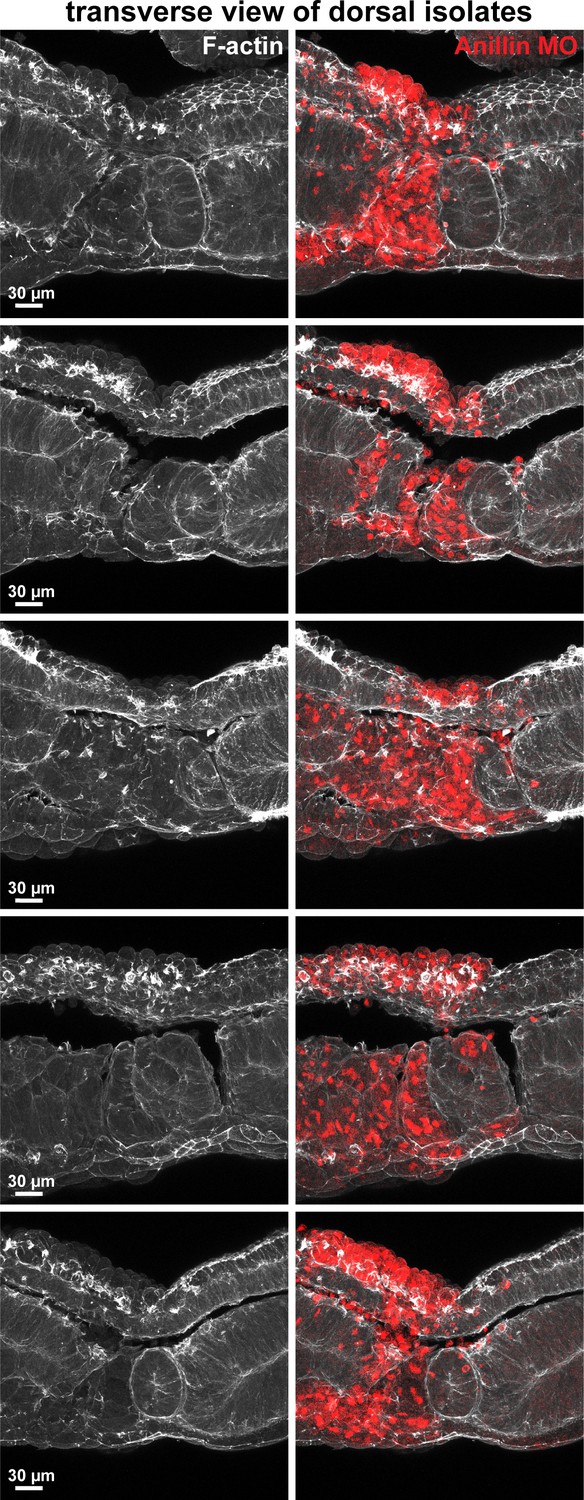
Anillin maintains apical F-actin in dorsal epithelium.
Additional examples of transverse sections of dorsal isolates explanted from Xenopus laevis embryos injected with anillin morpholino. Anillin morpholino was co-injected with Alexa Fluor 647-conjugated Dextran as a lineage tracer. Anillin knockdown dorsal epithelial cells (red) exhibit a rounded apical morphology, loss of F-actin on their apical surface, enhanced basal F-actin, and disrupted mesodermal organization. Control epithelial cells have a flat apical morphology, robust apical F-actin, and weak basal F-actin.
Figure 9

Anillin regulates apical tensile forces, stabilizes F-actin, and stiffens tissues.
(A) Schematic of our results showing that increased anillin expression slows junction recoil. (B) Diagram of how anillin slows junction recoil by reorienting tensile forces across the apical surface of cells, changing the orientation of the dominant tensile force from being in line with the junction to being perpendicular to the junction, which may contribute to the observed changes in junction recoil. (C–D) Diagram of how anillin stabilizes F-actin (C) and modulates tissue compliance (D), both of which may contribute to the observed changes in junction recoil.
Author response image 1
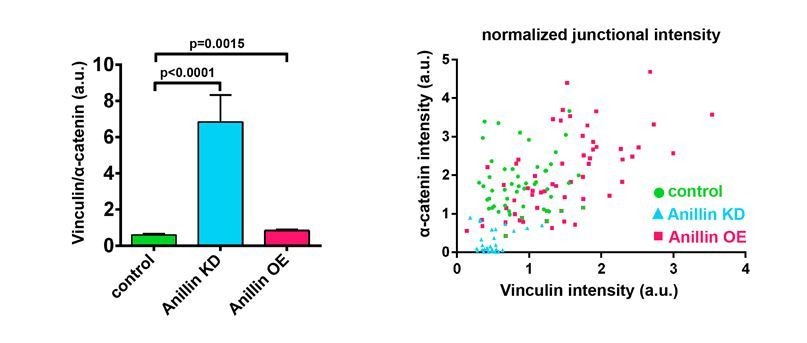
Ratio of junctional Vinculin to α-catenin when Anillin is perturbed.
(Left) Ratio of Vinculin to α-catenin. Measurements were taken by tracing a bicellular junction from vertex to vertex and normalizing Vinculin and α-catenin intensity to membrane intensity. Error bars, S.E.M, n=number of junctions, controls=45, Anillin KD=31, Anillin OE=54. Statistics, unpaired t-test. (Right) Scatter plotof Vinculin and α-catenin intensity, each normalized to membrane signal.
Author response image 2
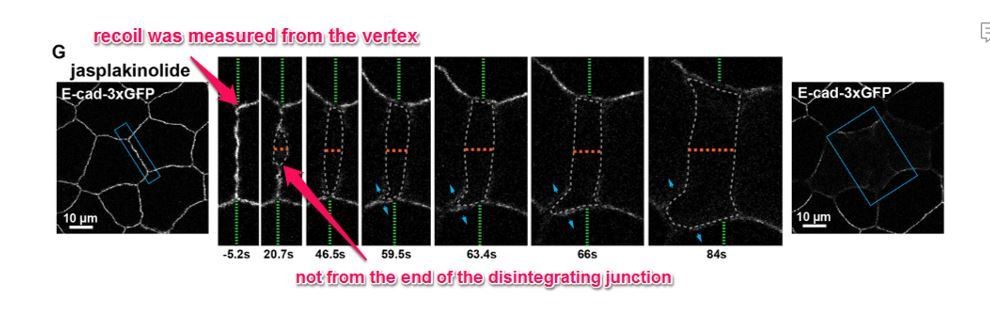
Previous Figure 6G: Confocal images of an embryo expressing E-cad-3xGFP and treated with 20 µm jasplakinolide before and after laser ablation.
Blue boxes show the zoomed area for the ablation montage. Green dashed lines indicate the position of the vertices relative to the edge of the image, orange dashed line indicates the perpendicular separation between the two cells, grey dashed line indicates the space forming between the two cells, and blue arrows represent forces on junctions adjacent to the lower cell vertex. Notice that the lower vertex only begins to separate in the parallel direction after the forces perpendicular to the adjacent junction (blue arrows) lead to loss of adhesion between the two cells.
Videos
Video 1
Increased anillin expression reduces vertex separation following junctional laser ablation.
Cell views of E-cadherin-3xGFP in control, anillin knockdown, or anillin overexpressing Xenopus laevis embryos before and after junctional laser ablation. Ablation was performed at time 0 s. For the anillin knockdown video, note that the reduction of E-cadherin intensity over time is due to drift of the sample out of the focal plane.
Video 2
Example of recoil perpendicular to the junction following junctional laser ablation when anillin is overexpressed.
Cell views of a Xenopus laevis embryo with anillin overexpressed before and after junctional laser ablation. Probes are E-cadherin-3xGFP and Anillin-3xmCherry. Note that there is minimal recoil in the direction parallel to the ablated junction, but significant recoil in the perpendicular direction.
Video 3
Examples of medial-apical F-actin bundles caused by anillin overexpression.
Cell views of a mosaic Xenopus laevis embryo where all cells are expressing Lifeact-GFP to label F-actin, and some cells are overexpressing Anillin-3xmCherry. Notice the cortical waves of F-actin in control cells, whereas in anillin overexpressing cells, F-actin is bundled into large filaments that span the apical surface, and filaments undergo retrograde flow from the junctions and/or rotation along the apical surface. Also note that in the lower right quadrant, there is a dividing cell that forms a contractile ring, and as the dividing cell pulls on the anillin overexpressing cell, the actin fibers orient to the direction of this pulling force.
Video 4
Anillin increases apical expansion after medial-apical laser ablation.
Cell views of the F-actin probe Lifeact-RFP in control, anillin knockdown, or anillin overexpressing Xenopus laevis embryos before and after medial-apical laser ablation. Ablation was performed at time 0 s.
Video 5
Anillin promotes whole embryo contraction after addition of exogenous ATP.
Whole Xenopus laevis embryo views where ATP is added to the bottom center of embryos while live imaging. The thick part of the microinjection needle that dispenses ATP can be seen at the top right of the embryo: these areas were avoided when making the kymographs in Figure 4. Each embryo is ~1.2 mm in diameter.
Video 6
Anillin promotes accumulation of medial-apical F-actin after addition of exogenous ATP.
Cell views of Lifeact-GFP to label F-actin in control, anillin knockdown, or anillin overexpressing Xenopus laevis embryos where ATP was added to the imaging chamber while live imaging. ATP was added at time 0 s.
Video 7
Stabilizing F-actin with jasplakinolide produces medial-apical actin bundles similar to when anillin is overexpressed.
Cell views of Lifeact-RFP used to label F-actin in a Xenopus laevis embryo treated with Jasplakinolide. Jasplakinolide was added at time 0 s.
Video 8
Stabilizing F-actin with jasplakinolide reduces vertex separation following junctional laser ablation similar to when anillin is overexpressed.
Cell views of the F-actin probe Lifeact-RFP in control Xenopus laevis embryo (treated with vehicle, EtOH) or embryo treated with Jasplakinolide before and after junctional laser ablation. Ablation was performed at time 0 s.
Tables
Key resources table
| Reagent type (species) or resource | Designation | Source or reference | Identifiers | Additional information |
|---|---|---|---|---|
| Strain, strain background (Xenopus laevis (Female), Oocyte positive, Pigmented) | Xenopus laevis | Nasco | Cat #: LM00531 | |
| Strain, strain background (Xenopus laevis (Female), Oocyte positive, Albino) | Xenopus laevis | Nasco | Cat #: LM00531(A) | |
| Strain, strain background (Xenopus laevis (Male), Mature 7.5–9 cm, Pigmented) | Xenopus laevis | Nasco | Cat #: LM00715 | |
| Genetic reagent (Anillin morpholino oligonucleotide) | Anillin MO | Gene Tools; (Reyes et al., 2014); https://doi.org/10.1016/j.cub.2014.04.021 | An antisense MO (Gene Tools) was generated to target the 5´UTR of Xenopus laevis anillin with the sequence 5’ – TGGCTAGTAACTCGATCCTCAGACT – 3’. | |
| Antibody (anti-Anillin antibody) | α-Anillin | gift from Aaron Straight, Stanford University (Straight et al., 2005) https://doi.org/10.1091/mbc.e04-08-0758 | 1:500 dilution in Tris-buffered saline (50 mM Tris and150 mM NaCl [pH 7.4]) containing 10% fetal bovine serum (10082–139; Invitrogen), 5% DMSO and0.1% NP-40 overnight at 4ºC | |
| Antibody (goat anti-rabbit-Alexa Fluor 488) | Life Technologies | Cat #: A11008; Lot: 1583138 | 1:200 dilution in Tris-buffered saline (50 mM Tris and 150 mM NaCl [pH 7.4]) containing 10% fetal bovine serum(10082–139; Invitrogen), 5% DMSO and 0.1% NP-40 overnight at 4C | |
| Recombinant DNA reagent (pCS2+/Anillin) | Anillin | (Reyes et al., 2014); https://doi.org/10.1016/j.cub.2014.04.021 | ||
| Recombinant DNA reagent (pCS2+/Anillin-3xGFP) | Anillin-3xGFP | (Reyes et al., 2014); https://doi.org/10.1016/j.cub.2014.04.021 | ||
| Recombinant DNA reagent (pCS2+/Anillin-3xmCherry) | Anillin-3xmChe | (Reyes et al., 2014); https://doi.org/10.1016/j.cub.2014.04.021 | ||
| Recombinant DNA reagent (pCS2+/Actin-mNeon) | Actin-mNeon | this paper | Xenopus laevis actin was cloned from a cDNA library generated from stage 35 tadpoles (Higashi et al., 2016) https://doi.org/10.1016/j.cub.2016.05.036.actin into pCS2+ with the following primers: S: aaaaGAATTCaatggaagacgatattgccgcactg AS: ttttTCTAGAttagaagcatttacggtggacaattgagg | |
| Recombinant DNA reagent (pCS2+/Shroom3) | Shroom3 | gift from Sergei Sokol, Icahn School of Medicine at Mount Sinai (Chu et al., 2013); https://doi.org/10.1371/journal.pone.0081854 | ||
| Recombinant DNA reagent (pCS2+/Lifeact-RFP) | Lifeact-RFP | (Higashi et al., 2016); https://doi.org/10.1016/j.cub.2016.05.036 | ||
| Recombinant DNA reagent (pCS2+/Lifeact-GFP) | Lifeact-GFP | (Higashi et al., 2016); https://doi.org/10.1016/j.cub.2016.05.036 | ||
| Recombinant DNA reagent (pCS2+/BFP-membrane) | BFP-membrane | (Higashi et al., 2016); https://doi.org/10.1016/j.cub.2016.05.036 | ||
| Recombinant DNA reagent (pCS2+/E-cadherin-3xGFP) | E-cadherin-3xGFP; E-cad-3xGFP | (Higashi et al., 2016); https://doi.org/10.1016/j.cub.2016.05.036 | ||
| Recombinant DNA reagent (pCS2+/mCherry-α-catenin) | mChe-α-catenin | (Higashi et al., 2016); https://doi.org/10.1016/j.cub.2016.05.036 | ||
| Recombinant DNA reagent (TOPO-SF9-YFP) | gift from E.M. Munro, University of Chicago (Hashimoto et al., 2015); https://doi.org/10.1016/j.devcel.2014.12.017 | |||
| Recombinant DNA reagent (pCS2+/SF9-mNeon) | SF9-mNeon | this paper | SF9 was subcloned from TOPO into pCS2 + with the following primers: S: AAAAGGATCCACCATGGCCGAGGTGCAGC AS: TTTTATCGATTACCTAGGACGGTCAGCTTGG | |
| Recombinant DNA reagent (pCS2+/Vinculin-mNeon) | Vinculin-mNeon | this paper | Xenopus laevis vinculin was subcloned using BamHI and XbaI restriction enzymes from pCS2+/Vinculin-3xGFP from (Higashi et al., 2016); https://doi.org/10.1016/j.cub.2016.05.036 | |
| Commercial assay or kit (mMESSAGE mMACHINE SP6 Transcription Kit) | mMESSAGE mMACHINE SP6 Transcription Kit | Thermo Fisher Scientific | AM1340 | |
| Chemical compound, drug (Jasplakinolide) | Jasplakinolide; Jas | Cayman Chemical | Cat #: 11705, CAS: 102396-24-7 | |
| Chemical compound, drug (phalloidin Alexa Fluor 568) | phalloidin | Life Technologies | Cat #: A12380, Lot: 1154065 | 1:100 dilution in Tris-buffered saline (50 mM Tris and150 mM NaCl [pH 7.4]) containing 10% fetal bovine serum (10082–139; Invitrogen),5% DMSO and 0.1% NP-40 overnight at 4C |
| Chemical compound, drug (BODIPY FL phallacidin) | BODIPY FL phallacidin | Thermo Fisher Scientific | Cat #: B607 | |
| Chemical compound, drug (ATP) | ATP | Sigma | Cat #: A2383-5G; Lot: SLBD2725V | |
| Software, algorithm (Graphpad Prism 6.01) | GraphPad Software, La Jolla California USA, www.graphpad.com | |||
| Software, algorithm (Fiji (ImageJ)) | (Schindelin et al., 2012) https://doi.org/10.1038/nmeth.2019 | |||
| Software, algorithm (Custom plugin for ImageJ that uses bUnwarp J plugin) | Strain mapping | (Feroze et al., 2015) https://doi.org/10.1016/j.ydbio.2014.11.011 |
Additional files
-
Transparent reporting form
- https://doi.org/10.7554/eLife.39065.032
Download links
A two-part list of links to download the article, or parts of the article, in various formats.
Downloads (link to download the article as PDF)
Open citations (links to open the citations from this article in various online reference manager services)
Cite this article (links to download the citations from this article in formats compatible with various reference manager tools)
Anillin regulates epithelial cell mechanics by structuring the medial-apical actomyosin network
eLife 8:e39065.
https://doi.org/10.7554/eLife.39065


