Expansion of the fatty acyl reductase gene family shaped pheromone communication in Hymenoptera
- Institute of Organic Chemistry and Biochemistry of the Czech Academy of Sciences, Czech Republic
- Charles University, Czech Republic
- Okinawa Institute of Science and Technology Graduate University, Japan
- Max Planck Institute for Chemical Ecology, Germany
Abstract
Fatty acyl reductases (FARs) are involved in the biosynthesis of fatty alcohols that serve a range of biological roles. Insects typically harbor numerous FAR gene family members. While some FARs are involved in pheromone biosynthesis, the biological significance of the large number of FARs in insect genomes remains unclear.
Using bumble bee (Bombini) FAR expression analysis and functional characterization, hymenopteran FAR gene tree reconstruction, and inspection of transposable elements (TEs) in the genomic environment of FARs, we uncovered a massive expansion of the FAR gene family in Hymenoptera, presumably facilitated by TEs. The expansion occurred in the common ancestor of bumble bees and stingless bees (Meliponini). We found that bumble bee FARs from the expanded FAR-A ortholog group contribute to the species-specific pheromone composition. Our results indicate that expansion and functional diversification of the FAR gene family played a key role in the evolution of pheromone communication in Hymenoptera.
https://doi.org/10.7554/eLife.39231.001eLife digest
Many insects release chemical signals, known as sex pheromones, to attract mates over long distances. The pheromones of male bumble bees, for example, contain chemicals called fatty alcohols. Each species of bumble bee releases a different blend of these chemicals, and even species that are closely related may produce very different ‘cocktails’ of pheromones.
The enzymes that make fatty alcohols are called fatty acyl reductases (or FARs for short). Any change to a gene that encodes one of these enzymes could change the final mix of pheromones produced. This in turn could have far-reaching effects for the insect, and in particular its mating success. Over time, these changes could even result in new species. Yet no one has previously looked into how the genes for FAR enzymes have evolved in bumble bees, or how these genes might have shaped the evolution of this important group of insects.
Tupec, Buček et al. set out to learn what genetic changes led the males of three common species of bumble bees to make dramatically different mixes of pheromones. Comparing the genetic information of bumble bees with that of other insects showed that the bumble bees and their close relatives, stingless bees, often had extra copies of genes for certain FAR enzymes. Inserting some of these genes into yeast cells caused the yeast to make the correct blend of bumble bee pheromones, confirming that these genes did indeed produce the mixture of chemicals in these signals.
Further, detailed analysis of the bumble bees’ genetic information revealed many genetic sequences, called transposable elements, close to the genes for the FAR enzymes. Transposable elements make the genetic material less stable; they can be ‘cut’ or ‘copied and pasted’ in multiple locations and often cause other genes to be duplicated or lost. Tupec et al. concluded that these transposable elements led to a dramatic increase in the number of genes for FAR enzymes in a common ancestor of bumble bees and stingless bees, ultimately allowing a new pheromone ‘language’ to evolve in these insects.
These results add to our understanding of the chemical and genetic events that influence what chemicals insects use to communicate with each other. Tupec, Buček et al. also hope that a better knowledge of the enzymes that insects use to make pheromones could have wide applications. Other insects – including pest moths – use a similar mixture of fatty alcohols as pheromones. Artificially produced enzymes, such as FAR enzymes, could thus be used to mass-produce pheromones that may control insect pests.
https://doi.org/10.7554/eLife.39231.002Introduction
Accumulation of DNA sequencing data is greatly outpacing our ability to experimentally assess the function of the sequenced genes, and most of these genes are expected to never be functionally characterized (Koonin, 2005). Important insights into the evolutionary processes shaping the genomes of individual species or lineages can be gathered from predictions of gene families, gene ortholog groups and gene function. However, direct experimental evidence of the function of gene family members is often unavailable or limited (Lespinet et al., 2002; Demuth et al., 2006; Rispe et al., 2008; Cortesi et al., 2015; Niimura and Nei, 2006). Gene duplication is hypothesized to be among the major genetic mechanisms of evolution (Ohno, 1970; Zhang, 2003). Although the most probable evolutionary fate of duplicated genes is the loss of one copy, the temporary redundancy accelerates gene sequence divergence and can result in gene subfunctionalization or neofunctionalization—acquisition of slightly different or completely novel functions in one copy of the gene (Innan and Kondrashov, 2010; Lynch and Conery, 2000).
The alcohol-forming fatty acyl-CoA reductases (FARs, EC 1.2.1.84) belong to a multigene family that underwent a series of gene duplications and subsequent gene losses, pseudogenizations and possibly functional diversification of some of the maintained copies, following the birth-and-death model of gene family evolution (Eirín-López et al., 2012). FARs exhibit notable trends in gene numbers across organism lineages; there are very few FAR genes in fungi, vertebrates and non-insect invertebrates such as Caenorhabditis elegans, whereas plant and insect genomes typically harbor an extensive number of FAR gene family members (Eirín-López et al., 2012). FARs are critical for production of primary fatty alcohols, which are naturally abundant fatty acid (FA) derivatives with a wide variety of biological roles. Fatty alcohols are precursors of waxes and other lipids that serve as surface-protective or hydrophobic coatings in plants, insects and other animals (Wang et al., 2017; Cheng and Russell, 2004; Jaspers et al., 2014); precursors of energy-storing waxes (Metz et al., 2000; Teerawanichpan and Qiu, 2010a; Teerawanichpan and Qiu, 2012); and components of ether lipids abundant in the cell membranes of cardiac, nervous and immunological tissues (Nagan and Zoeller, 2001).
Additionally, in some insect lineages, FARs were recruited for yet another task—biosynthesis of fatty alcohols that serve as pheromones or pheromone precursors. Moths (Lepidoptera) are the most well-studied model of insect pheromone biosynthesis and have been the subject of substantial research effort related to FARs. Variation in FAR enzymatic specificities is a source of sex pheromone signal diversity among moths in the genus Ostrinia (Lassance et al., 2013) and is also responsible for the distinct pheromone composition in two reproductively isolated races of the European corn borer Ostrinia nubilalis (Lassance et al., 2010). Divergence in pheromone biosynthesis can potentially install or strengthen reproductive barriers, ultimately leading to speciation (Smadja and Butlin, 2009). However, the biological significance of a large number of insect FAR paralogs remains unclear, as all FARs implicated in moth and butterfly sex pheromone biosynthesis are restricted to a single clade, indicating that one FAR group was exclusively recruited for pheromone biosynthesis (Lassance et al., 2010; Liénard et al., 2010; Liénard et al., 2014; Antony et al., 2009). While more than 20 FARs have been experimentally characterized from 23 moth and butterfly (Lepidoptera) species (Tupec et al., 2017), FARs from other insect orders have received far less attention. Single FAR genes have been isolated and experimentally characterized from Drosophila (Diptera) (Jaspers et al., 2014), the European honey bee (Hymenoptera) (Teerawanichpan et al., 2010b) and the scale insect Ericeus pela (Hemiptera) (Hu et al., 2018). Our limited knowledge of FAR function prevents us from drawing inferences about the biological significance of the FAR gene family expansion in insects.
Bumble bees (Hymenoptera: Apidae) are a convenient experimental model to study insect FAR evolution because the majority of bumble bee species produces fatty alcohols as species-specific components of male marking pheromones (MMPs) (Ayasse and Jarau, 2014), which are presumed to be biosynthesized by some of the numerous bumble bee FAR gene family members (Buček et al., 2016). Bumble bee males employ MMPs to attract conspecific virgin queens (Goulson, 2010). In addition to fatty alcohols, MMPs generally contain other FA derivatives and terpenoid compounds. MMP fatty alcohols consist predominantly of saturated, mono-unsaturated and poly-unsaturated fatty alcohols with 16–18 carbon atoms (Ayasse and Jarau, 2014). Pheromone mixtures from three common European bumble bee species, B. terrestris, B. lucorum and B. lapidarius, are representative of the known MMP chemical diversity. Fatty alcohols are the major compounds in MMPs of B. lapidarius (hexadecanol and Z9-hexadecenol) and accompany electroantennogram-active compounds in B. terrestris (hexadecanol, octadecatrienol, octadecenol) and B. lucorum (hexadecanol, Z9,Z12-octadecadienol, Z9,Z12,Z15-octadecatrienol, octadecanol) (Bergström et al., 1973; Kullenberg et al., 1973; Kullenberg et al., 1970; Urbanová et al., 2001; Sobotník et al., 2008; Luxová et al., 2003; Zácek et al., 2009).
In our previous investigation of the molecular basis of pheromone diversity in bumble bees, we found that the substrate specificities of fatty acyl desaturases (FADs), enzymes presumably acting upstream of FARs in pheromone biosynthesis (Tillman et al., 1999), are conserved across species despite differences in the compositions of their unsaturated FA-derived pheromone components (Buček et al., 2013). These findings suggest that the substrate specificity of FADs contributes only partially to the species-specific composition of FA-derived MMPs (Buček et al., 2013). The fatty alcohol content in bumble bee MMPs is therefore presumably co-determined by the enzymatic specificity of other pheromone biosynthetic steps, such as FA biosynthesis/transport or FA reduction. Analysis of the B. terrestris male labial gland (LG) transcriptome uncovered a remarkably high number of putative FAR paralogs, including apparently expressed pseudogenes, strongly indicating dynamic evolution of the FAR gene family and the contribution of FARs to the LG-localized MMP biosynthesis (Buček et al., 2016).
Here, we aimed to determine how the members of the large FAR gene family in the bumble bee lineage contribute to MMP biosynthesis. We sequenced B. lapidarius male LG and fat body (FB) transcriptomes and functionally characterized the FAR enzymes, along with FAR candidates from B. terrestris and B. lucorum, in a yeast expression system. We combined experimental information about FAR enzymatic specificities with quantitative information about bumble bee FAR expression patterns, as well as comprehensive gas chromatography (GC) analysis of MMPs and their FA precursors in the bumble bee male LG, with inference of the hymenopteran FAR gene tree. In addition, we investigated the content of transposable elements (TEs) in the genomic environment of FAR genes in genomes of two bumble bee species, B. terrestris and B. impatiens. We conclude that a dramatic TE-mediated expansion of the FAR gene family started in the common ancestor of the bumble bee (Bombini: Bombus) and stingless bee (Meliponini) lineages, which presumably shaped the pheromone communication in these lineages.
Results
Identification of FARs in bumble bee transcriptomes
We sequenced, assembled and annotated male LG and FB transcriptomes of the bumble bee species B. lapidarius. The LG is the MMP-producing organ and is markedly enlarged in males, while the FB was used as a reference tissue not directly involved in MMP biosynthesis (Žáček et al., 2015). Searches for FAR-coding transcripts in the LG and FB transcriptomes of B. lapidarius and the previously sequenced FB and LG transcriptomes of B. lucorum and B. terrestris (Buček et al., 2013; Prchalová et al., 2016) yielded 12, 26 and 16 expressed FAR homologs in B. lapidarius, B. terrestris and B. lucorum, respectively (Figure 1—figure supplement 1).
FAR gene family evolution in hymenoptera
To gain insight into the evolution of FAR gene family in Hymenoptera, we reconstructed a FAR gene tree using predicted FARs from species representing ants, Vespid wasps, parasitoid wasps and several bee lineages (Figure 1). We assigned the names FAR-A to FAR-K to 11 FAR ortholog groups that were retrieved as branches with high bootstrap support in the FAR gene tree. These ortholog groups typically encompass one or more FARs from each of the hymenopteran species used in the tree inference, with the exception of apparent species-specific FAR duplications or losses (Figure 1). Notably, we identified a massive expansion of the FAR-A ortholog group in the bumble bee and stingless bee (subfamily Meliponini) sister lineages (Figure 1, Figure 2). The number of FAR homologs is inflated by a large number of predicted FAR genes and FAR transcripts with incomplete protein coding sequences lacking catalytically critical regions, such as the putative active site, NAD(P)+ binding site or substrate binding site (Figure 1, Figure 1—source data 1). The FAR gene tree also indicates expansion of the FAR-A ortholog group in the ant Camponotus floridanus and the mining bee Andrena vaga. However, this expansion is not present in two other ant species (Acromyrmex echinatior and Harpegnathos saltator) and two other mining bee species (Andrenidae: Camptopoeum sacrum and Panurgus dentipes) (Figure 1, Figure 2). Several additional expansions of FAR families can be inferred from the FAR gene tree, including extensive FAR-B gene expansion in ants (Formicoidea), along with many more lineage-specific FAR gene duplications and minor expansions.
Figure 1 with 5 supplements see all
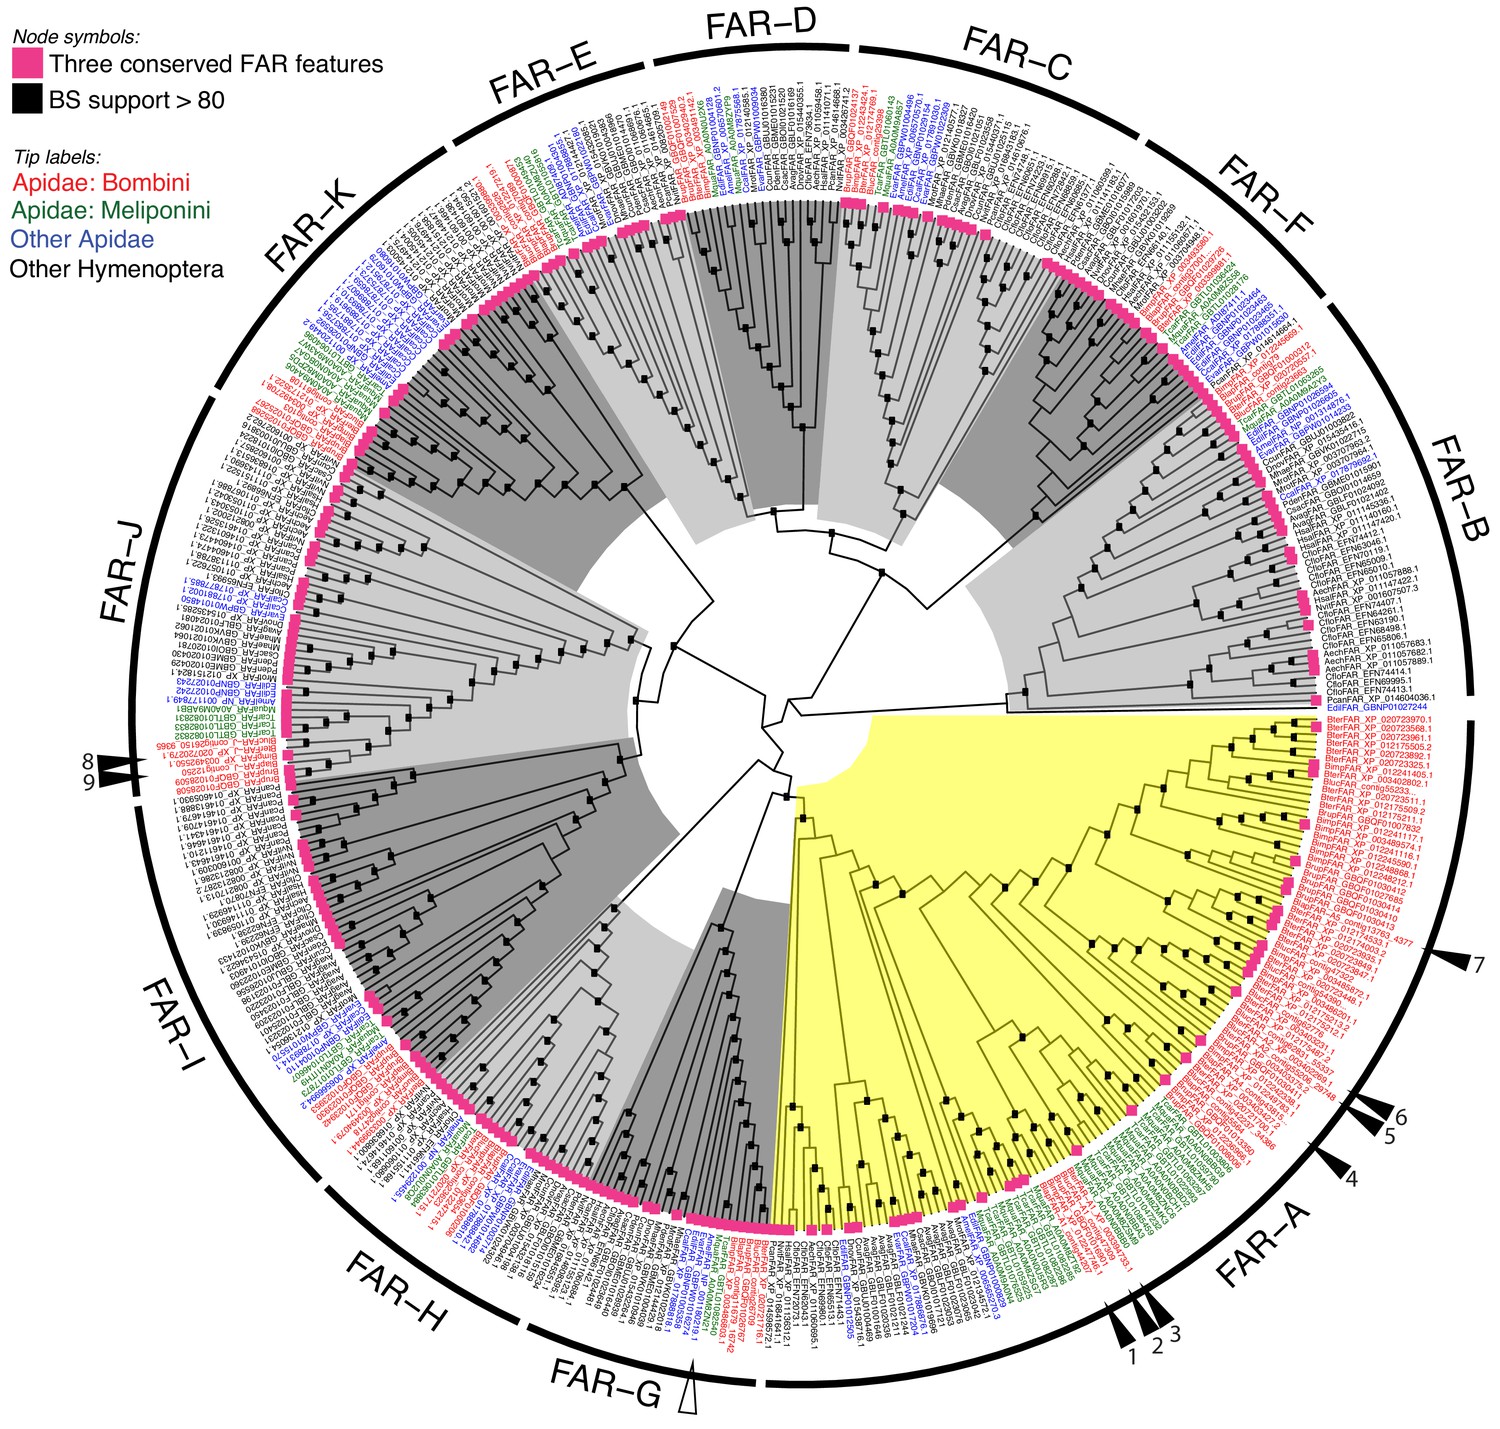
Unrooted hymenopteran FAR gene tree.
Tree tips are colored according to taxonomy: red, bumble bee FARs (B. terrestris, B. lucorum, B. lapidarius, B. impatiens, B. rupestris); green, stingless bee FARs (Tetragonula carbonaria, Melipona quadrifasciata); blue, FARs from other Apidae species (i.e. A. mellifera, Euglossa dilemma, Ceratina calcarata, and Epeolus variegatus); and black, FARs from other hymenopteran species. The FAR-A ortholog group is highlighted yellow; other ortholog groups in shades of grey. Functionally characterized bumble bee FARs from this study are indicated by filled triangles and numbered. 1: BlapFAR-A1, 2: BlucFAR-A1, 3: BterFAR-A1, 4: BlapFAR-A4, 5: BlucFAR-A2, 6: BterFAR-A2, 7: BlapFAR-A5, 8: BterFAR-J, and 9: BlapFAR-J. The functionally characterized A. mellifera FAR is indicated by an empty triangle. Internal nodes highlighted with black boxes indicate bootstrap support >80%. Violet squares at the tree tips indicate FARs for which CDD search yielded all three FAR conserved features—active site, NAD(P)+ binding site and putative substrate binding site (see Figure 1—source data 1 for complete CDD search results).
-
Figure 1—source data 1
Predicted protein sequence lengths and conserved domains detected in predicted FAR coding regions via Conserved Domain Database search.
The presence of a domain or conserved feature is marked with ‘+’.
- https://doi.org/10.7554/eLife.39231.009
Figure 2
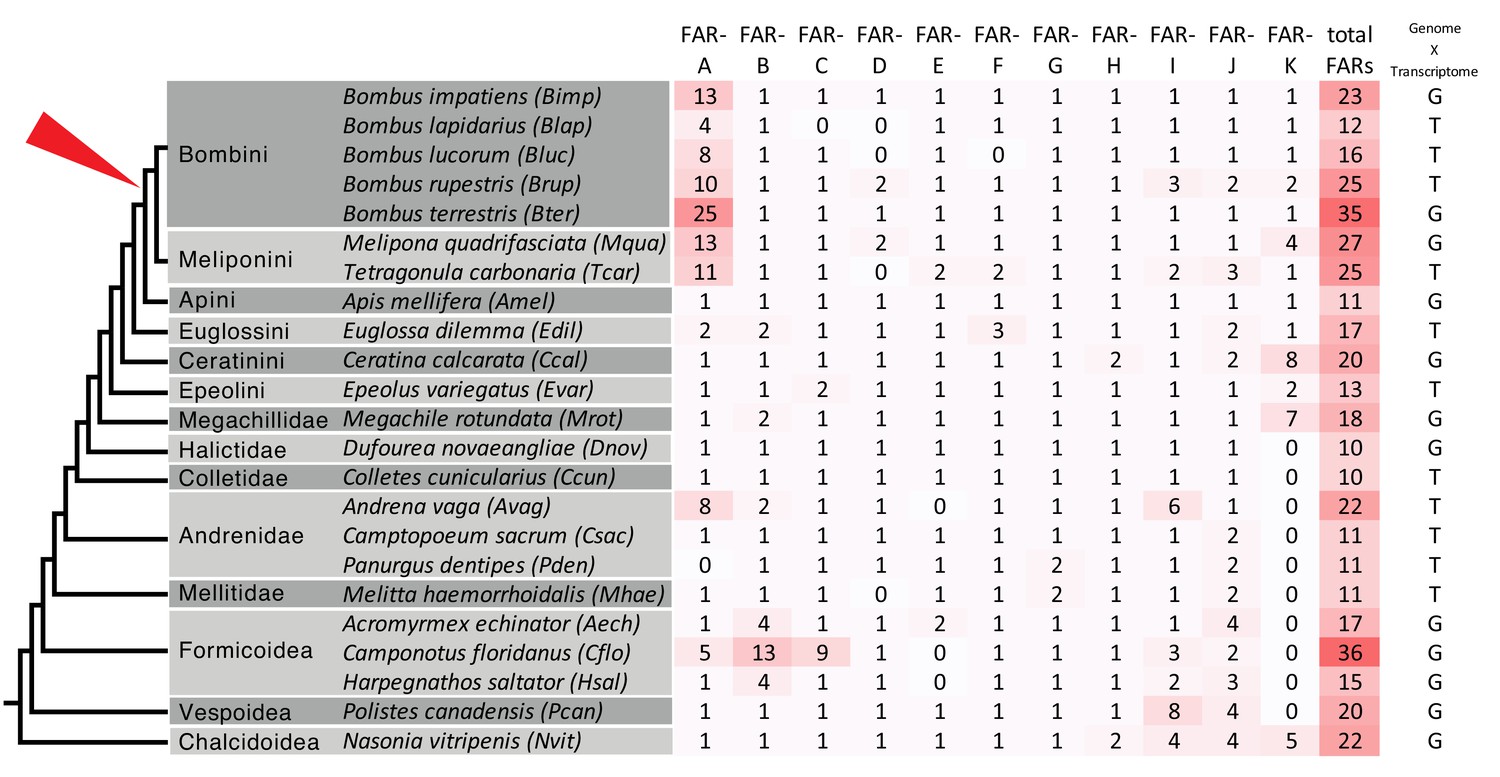
Number of predicted FAR genes (transcripts) across hymenopteran lineages and across FAR groups.
The schematic phylogenetic tree of Hymenoptera was adapted from Peters et al. (2017). The rightmost column indicates whether FARs were predicted from genome or transcriptome assemblies. The red triangle points to the presumed onset of FAR-A expansion in the common ancestor of bumble bees (Bombini) and stingless bees (Meliponini).
We also reconstructed a FAR gene tree encompassing FARs from three representatives of non-hymenopteran insect orders—the beetle Tribolium castaneum, the moth Bombyx mori and the fly Drosophila melanogaster (Figure 1—figure supplement 2). The only functionally characterized FAR from D. melanogaster—Waterproof (NP_651652.2), which is involved in the biosynthesis of a protective wax layer (Jaspers et al., 2014)—was placed in the FAR-J ortholog group (Figure 1—figure supplement 2). The FAR-G ortholog group includes a FAR gene from Apis mellifera with unclear biological function (Teerawanichpan et al., 2010b) and a sex pheromone-biosynthetic FAR from B. mori (Moto et al., 2003) (Figure 1—figure supplement 2). In the gene tree, the majority of FAR ortholog groups contain predicted FARs from both hymenopteran and non-hymenopteran insect species, although the bootstrap support is <80% for some FAR groups. The presence of these FAR ortholog groups in representatives of Hymenoptera, Coleoptera, Lepidoptera and Diptera indicates that these groups are ancestral to holometabolous insects. FAR-D is the only FAR group that does not include any non-hymenopteran FARs from our dataset (Figure 1—figure supplement 2) and thus presumably represents Hymenoptera-specific FAR gene family expansions. FAR-Ds, however, do not contain the complete set of three catalytically critical regions (i.e. the putative active site, NAD(P)+ binding site and substrate binding site) and their enzymatic role is therefore unclear.
Genomic organization and TE content
To uncover the details of genetic organization of FAR-A genes, we attempted to analyze the shared synteny of FAR genes in the genomes of B. terrestris and A. mellifera (Stolle et al., 2011). We aligned the A. melifera and B. terrestris genomes, but we were not able to identify any positional A. mellifera homologs of B. terrestris FAR-A genes (data not shown). While the majority of FAR genes belonging to the non-FAR-A gene ortholog group localize to the B. terrestris genome assembled to linkage groups, most of the B. terrestris FAR-A genes localize to unlinked short scaffolds (Supplementary file 1). Some of the FAR-A genes in the B. terrestris genome are arranged in clusters (Figure 1—figure supplement 3). Unfortunately, the genome assembly of B. impatiens is not mapped to chromosomes to allow similar analysis.
A genome assembly consisting of short scaffolds is often indicative of a repetitive structure in the assembled genomic region. Our analysis of the distribution of TEs in the vicinity of FAR genes in the B. terrestris and B. impatiens genomes confirmed that TEs are significantly enriched around FAR-A genes compared to the genome-wide average around randomly selected genes (Figure 3AC; B. terrestris: p < 0.0001, B. impatiens: p < 0.0001). On average, more than 50% of the 10 kb regions surrounding FAR-A genes are formed by TEs, compared to an average of 10% around randomly selected B. terrestris genes. In contrast, the densities of TEs in the vicinity of FAR genes not belonging to the FAR-A group do not differ from the genome-wide average (Figure 3AC; B. terrestris: p = 0.793; B. impatiens: p = 0.880). Also, there is a statistically significant difference in TE densities between FAR-A genes and non-FAR-A genes (Man-Whitney U-test: B. terrestris: U = 167, p < 0.0001; B. impatiens: U = 78, p = 0.0002). Although all major known TE families are statistically enriched in the neighborhood of the FAR-A genes (Figure 3BD), the Class I comprising retroid elements contributes considerably to the elevated repeat content around FAR-A genes (Figure 3, Figure 3—source data 1).
Figure 3

Average TE densities in 10 kb windows around groups of B. terrestris (A, B) and B. impatiens (C, D) genes.
(A and C) Distributions of overall TE densities around FAR genes (N, non-FAR-A genes, in green; A, FAR-A genes, in red) with respect to the genome-wide distribution of TE densities around RefSeq genes (in grey) are shown for the B. terrestris (A) and B. impatiens (C) genomes. (B and D) Densities of individual TE classes and families for FAR-A (in red) and non-FAR-A (in green) genes are depicted for B. terrestris (B) and B. impatiens (D). The average TE densities for the whole gene group are compared to the genome-wide average. Asterisks indicate statistical significance obtained by permutation test.
-
Figure 3—source data 1
List of TE densities for FAR-A and non-FAR-A genes.
- https://doi.org/10.7554/eLife.39231.012
Tissue specificity of FAR expression
We selected 10 promising MMP-biosynthetic FAR candidates that were (1) among the 100 most abundant transcripts in the LG and were substantially more abundant in LG than in FB based on RNA-Seq-derived normalized expression values (Figure 1—figure supplement 1 and ref. (Buček et al., 2016)) and (2) included all the predicted catalytically critical regions of FARs—the putative active site, NAD(P)+ binding site and substrate binding site in the protein coding sequence (Figure 1—source data 1).
By employing reverse transcription-quantitative PCR (RT-qPCR) on an expanded set of bumble bee tissues, we confirmed that the FAR candidates follow a general trend of overexpression in male LG compared to FB, flight muscle and gut (all from male bumble bees) and virgin queen LG (Figure 4, Figure 4—figure supplement 1, p < 0.05). Notably, B. lapidarius FAR-A1 (BlapFAR-A1) and B. terrestris FAR-J (BterFAR-J) transcripts are also abundant in virgin queen LG, where they are expressed at levels comparable to those in male LG (Figure 4—figure supplement 1).
Figure 4 with 2 supplements see all
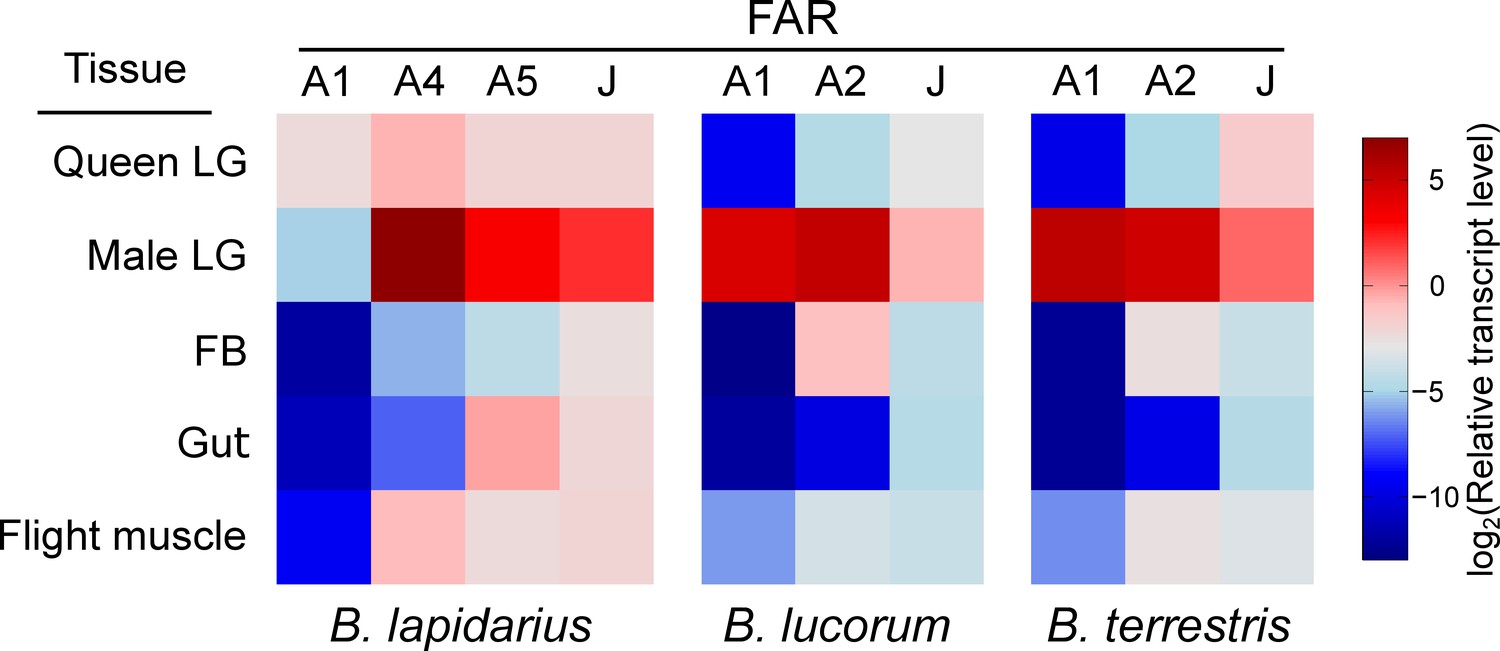
Expression pattern of FAR candidates across bumble bee tissues.
The FAR transcripts were assayed using quantitative PCR on cDNA from tissues of 3-day-old B. lapidarius, B. lucorum and B. terrestris males and queens (N = 3; queen LG: one biological replicate represents tissues from two queens).
-
Figure 4—source data 1
List of Cp differences for FAR transcripts.
The file contains a list of Cp difference values for all assayed FAR transcripts. See Figure 4—figure supplement 1—source data 1 for Cp values.
- https://doi.org/10.7554/eLife.39231.016
Analysis of fatty alcohols and fatty acyls in bumble bee male LG and FB
We performed a detailed analysis of transesterifiable fatty acyls (free FAs and fatty acyls bound in esters) and fatty alcohols in LGs and FBs of 3-day-old B. lapidarius, B. terrestris and B. lucorum males to identify the products and predict the potential FAR substrates in the male LG. In the LGs, we detected 4, 14 and 19 individual fatty alcohol compounds in B. lapidarius, B. lucorum and B. terrestris, respectively (Figure 5). A limited number of fatty alcohols (mainly 16:OH, Z9,Z12-18:OH and Z9,Z12,Z15-18:OH) also were detected in FBs of B. lucorum and B. terrestris, but at substantially lower abundance than in LGs (Figure 5—source data 1).
Figure 5 with 1 supplement see all
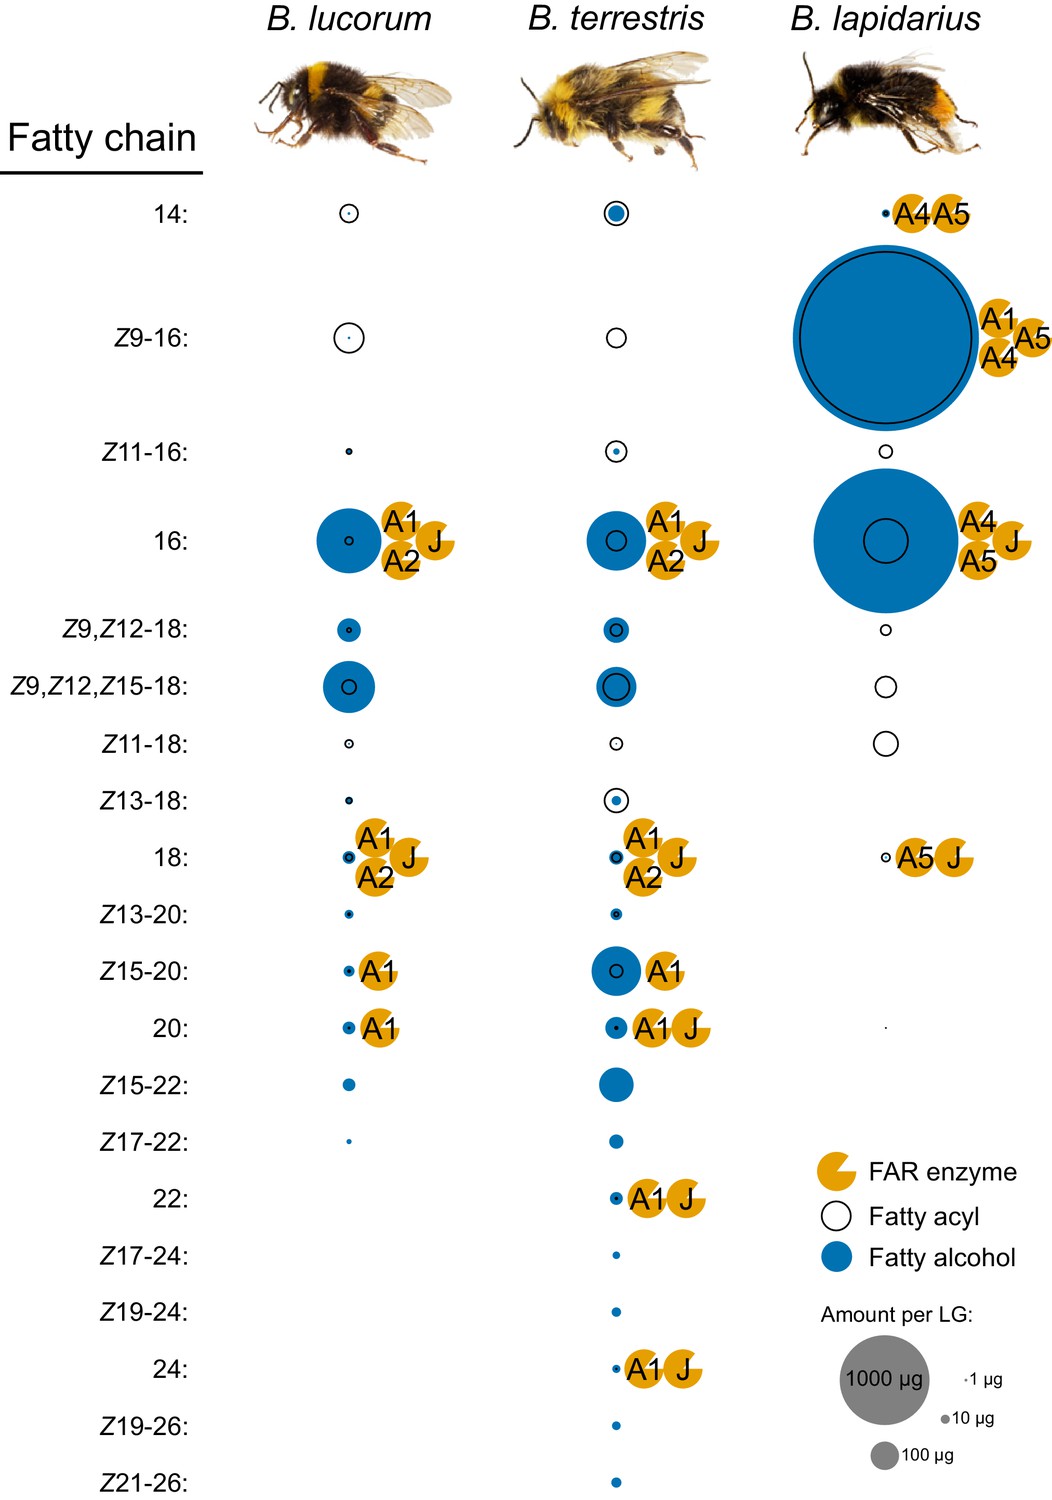
Fatty alcohols and fatty acyls of bumble bee male LGs together with the proposed participation of FARs in biosynthesis.
The fatty alcohols and fatty acyls (determined as methyl esters) were extracted from LGs of 3-day-old males of B. lucorum, B. terrestris and B. lapidarius (N = 3) and quantified by GC. The area (size) of fatty alcohol and fatty acyl circle represents the mean quantity per a single male LG (Figure 5—source data 1). The FARs which could be involved in the fatty alcohol biosynthesis based on their specificity are appended to the left side of the corresponding fatty alcohol circle.
-
Figure 5—source data 1
List of fatty alcohol and fatty acyl quantities in LGs and FBs of bumble bee males.
The file contains a list of quantified fatty alcohols and fatty acyl methyl esters (transesterifiable fatty acyls) in male LGs and FBs of 3-day-old B. terrestris, B. lucorum and B. lapidarius. In the case of 22:1 alcohols in FB of B. terrestris, the assignment of individual isomers was not possible due to their low amount, so they are reported as a sum of isomers.
- https://doi.org/10.7554/eLife.39231.021
To assess the apparent in vivo specificity of all FARs expressed in LGs and FBs, we calculated the fatty alcohol ratios (see Equation 1 in Materials and methods), that is the ratios of the quantity of particular fatty alcohol to the quantity of its hypothetical fatty acyl precursors (Figure 5—figure supplement 1). These ratios are greater than 50% for most of the fatty alcohols in LGs and even approach 100% for some of the monounsaturated >C20 fatty alcohols, suggesting high overall conversion rates of acyl substrates to alcohols.
Cloning and functional characterization
The full-length coding regions of the FAR candidates were isolated from male LG cDNA libraries using gene-specific PCR primers (Supplementary file 2). In general, the FAR candidates share high to very high protein sequence similarity within each ortholog group (Figure 1—figure supplement 4, Figure 1—figure supplement 5). FARs from three bumble bee species belonging to the FAR-J ortholog group are nearly identical, sharing 97.2–99.7% protein sequence identity; BlucFAR-A1 and BterFAR-A1 share 99.4% protein sequence identity with each other and 60.9–61.1% with BlapFAR-A1. BlucFAR-A2 and BterFAR-A2 share 94.8% protein sequence identity (Figure 1—figure supplement 4). BlucFAR-J was not cloned because of its very high similarity to BterFAR-J (99.7% sequence identity, two amino acid differences). We cloned two versions of BlapFAR-A1: one that was custom-synthesized based on the predicted full-length coding sequence assembled from RNA-Seq data and one called BlapFAR-A1-short that we consistently PCR-amplified from B. lapidarius male LG cDNA. BlapFAR-A1-short has an in-frame internal 66 bp deletion in the coding region that does not disrupt the predicted active site, putative NAD(P)+ binding site or putative substrate binding site (Figure 6—figure supplement 1C). Using RT-qPCR with specific primers for each variant, we confirmed that both BlapFAR-A1 and BlapFAR-A1-short are expressed in the B. lapidarius male LG and virgin queen LG (Figure 4—figure supplement 2).
To test whether the MMP-biosynthetic FAR candidates code for enzymes with fatty acyl reductase activity and to uncover their substrate specificities, we cloned the candidate FAR coding regions into yeast expression plasmids, heterologously expressed the FARs in Saccharomyces cerevisiae and assayed the fatty alcohol production by GC (Figure 6—figure supplement 2, Figure 6—figure supplement 3).
His-tagged FARs were detected in all yeast strains transformed with plasmids bearing FARs (Figure 6—figure supplement 4, Figure 6—figure supplement 1A), while no His-tagged proteins were detected in the negative control (yeasts transformed with an empty plasmid). In addition to the major protein bands corresponding to the theoretical FAR molecular weight, we typically observed protein bands with lower and/or higher molecular weight (Figure 6—figure supplement 4). The synthetic BlucFAR-A1-opt and BlucFAR-A2-opt coding regions with codon usage optimized for S. cerevisiae showed a single major western blot signal corresponding to the position of the predicted full-length protein (Figure 6—figure supplement 4). The shortened heterologously expressed proteins thus presumably represent incompletely transcribed versions of full-length FARs resulting from ribosome stalling (Angov, 2011), while the higher molecular weight bands might correspond to aggregates of full-length and incompletely translated FARs. Because the codon-optimized BlucFAR-A1-opt and BlucFAR-A2-opt exhibit the same overall specificity in yeast expression system as the respective non-codon-optimized FARs (Figure 6—figure supplement 5), we employed non-codon-optimized FARs for further functional characterization. We only used the codon-optimized versions of BlucFAR-A1 and BlucFAR-A2 in experiments with exogenously supplemented substrates to increase the possibility of product detection, as the optimized FARs produce overall higher quantities of fatty alcohols (Figure 6—figure supplement 5, Figure 6—source data 1).
Characterization of FAR enzymatic activities involved identification of numerous individual FA derivatives, denoted using the length of the carbon chain (e.g. 20: for 20-carbon chain), the number of double bonds (either as the position/configuration of the double bond(s), if known, for example Z9, or by ‘:X’, for example :1 and :2 for monounsaturated and diunsaturated FAs, respectively) and the C1 moiety (COOH for acid, OH for alcohol, Me for methyl ester, CoA for CoA-thioester).
Functional characterization of FARs from B. terrestris and B. lucorum in yeast indicated that saturated C16 to C26 fatty alcohols are produced by both BterFAR-A1 and BlucFAR-A1 and BterFAR-J enzymes (Figure 6A, Figure 6—figure supplement 3); Bter/BlucFAR-A1 prefers C22 substrates, whereas BterFAR-J has an optimal substrate preference slightly shifted to C24. Unlike any of the other characterized FARs, BterFAR-A1 and BlucFAR-A1 are also capable of reducing supplemented monounsaturated Z15-20: acyl to the corresponding alcohol (Figure 6B, Figure 6—figure supplement 6C). Both BterFAR-A2 and BlucFAR-A2 reduce only 16: and 18: acyls (Figure 6A, Figure 6—figure supplement 7).
Figure 6 with 8 supplements see all
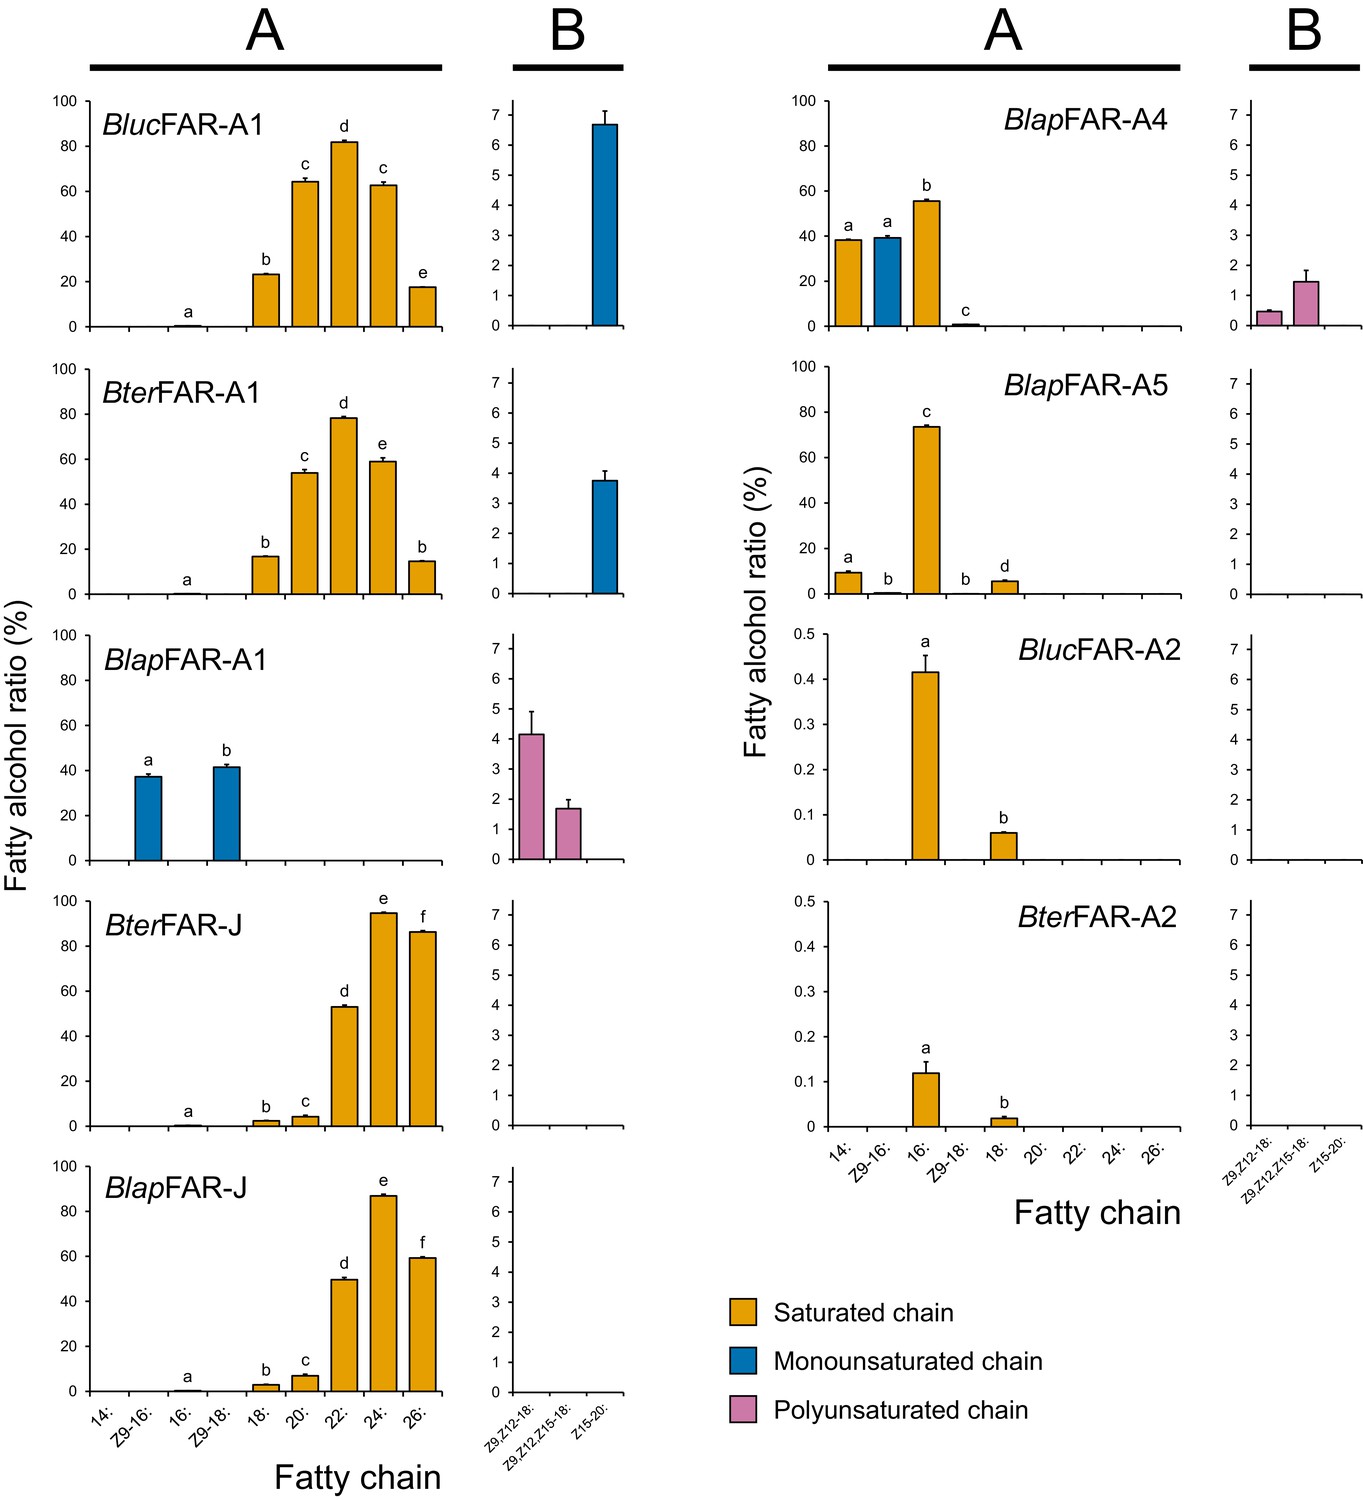
Apparent specificity of bumble bee FARs expressed in yeasts.
The fatty alcohol ratios represent the apparent specificity of individual MMP-biosynthetic FAR candidates when expressed in yeast hosts (N = 3). The fatty alcohol production was quantified by GC analysis of yeast total lipid extracts with the recombinant FARs either acting on yeast native lipids (A) or acting on non-native substrates after supplementation of yeasts with either Z9,Z12-18:, Z9,Z12,Z15-18: or Z15-20: acyl-CoA precursors (B). The data in (B) panel of BlucFAR-A1 and BlucFAR-A2 are taken from yeasts expressing the proteins from yeast codon-optimized nucleotide sequences. Note the different y-axis scale for BterFAR-A2 and BlucFAR-A2. Significant differences (p < 0.01, one-way ANOVA followed by post-hoc Tukey’s HSD test) are marked with different letters. See Equation 1 for a description of fatty alcohol ratio calculation.
-
Figure 6—source data 1
List of fatty alcohol and fatty acyl quantities in FAR-expressing yeasts and fatty alcohol ratios of FARs.
The file contains a list of quantified fatty alcohols and fatty acyl methyl esters (transesterifiable fatty acyls) in yeasts which express bumble bee FARs and of fatty alcohol ratio values for individual FARs and the results of statistical testing.
- https://doi.org/10.7554/eLife.39231.031
Characterization of B. lapidarius FARs showed that BlapFAR-A1, in contrast to BterFAR-A1 and BlucFAR-A1, produces Z9-16:OH and Z9-18:OH (Figure 6A, Figure 6—figure supplement 2). BlapFAR-A4 produces 16:OH and Z9-16:OH, together with lower quantities of 14:OH and Z9-18:OH (Figure 6A, Figure 6—figure supplement 8A). BlapFAR-A5 produces 16:OH as a major product and lower amounts of 14:OH, Z9-16:OH, 18:OH and Z9-18:OH (Figure 6A, Figure 6—figure supplement 8A). In addition, both BlapFAR-A1 and BlapFAR-A4 are capable of reducing supplemented polyunsaturated fatty acyls (Z9,Z12-18: and Z9,Z12,Z15-18:) to their respective alcohols (Figure 6B, Figure 6—figure supplement 6AB). Similarly to BterFAR-J, BlapFAR-J also reduces saturated C16 to C26 acyls (Figure 6A, Figure 6—figure supplement 3).
No fatty alcohols were detected in the negative control, that is the yeasts transformed with empty plasmid (Figure 6—figure supplement 2, Figure 6—figure supplement 8B). The total quantities of fatty alcohols accumulated in FAR-expressing yeasts range from few milligrams to tens of milligrams per liter of culture (Figure 6—figure supplement 8B), the exceptions being BterFAR-A2 and BlucFAR-A2 which both produce sub-milligram quantities of fatty alcohols. We did not detect the formation of fatty aldehydes in any of the yeast cultures (data not shown), confirming that the studied FARs are strictly alcohol-forming fatty acyl-CoA reductases. In contrast to BlapFAR-A1, BlapFAR-A1-short does not produce detectable amounts of any fatty alcohol (Figure 6—figure supplement 1B), suggesting that the missing 22-amino acid region (Figure 6—figure supplement 1C) is necessary for the retention of FAR activity.
Overall, the FAR specificities determined in yeast correlate well with the composition of LG fatty alcohols and fatty acyls (Figure 5). The exceptions are Z9,Z12-18:OH and Z9,Z12,Z15-18:OH, as none of the studied FARs from B. lucorum or B. terrestris reduce the corresponding acyls.
Discussion
Since the first genome-scale surveys of gene families, gene duplications and lineage-specific gene family expansions have been considered major mechanisms of diversification and adaptation in eukaryotes (Lespinet et al., 2002) and prokaryotes (Jordan et al., 2001). Tracing the evolution of gene families and correlating them with the evolution of phenotypic traits has been facilitated by the growing number of next-generation genomes and transcriptomes from organisms spanning the entire tree of life. However, obtaining experimental evidence of the function of numerous gene family members across multiple species or lineages is laborious. Thus, such data are scarce, and researchers have mostly relied on computational inference of gene function (Radivojac et al., 2013). Here, we aimed to combine computational inference with experimental characterization of gene function to understand the evolution of the FAR family, for which we predicted a substantial gene number expansion in our initial transcriptome analysis of the buff-tailed bumble bee B. terrestris (Buček et al., 2016). We specifically sought to determine whether the FARs that emerged through expansion of the FAR gene family substantially contribute to MMP biosynthesis in bumble bees.
We found that the FAR-A group underwent massive expansion in all analyzed species of bumble bee and stingless bee lineages but not in any other Hymenoptera species, with the exceptions of the ant Camponotus floridanus and the mining bee Andrena vaga (Figure 1, Figure 2). The phylogenetic sister group relationship of bumble bees and stingless bees (Peters et al., 2017; Branstetter et al., 2017) indicates that the FAR duplication process occurred or started in their ancestor, while the increased number of predicted FAR-A genes in A. vaga and C. floridanus suggests that the FAR-A genes independently underwent duplication in other hymenopteran lineages. According to estimated lineage divergence times, FAR duplication events in bumble bees and stingless bees started after their divergence from Apis 54 million years ago (40–69 million years 95% confidence interval) (Peters et al., 2017). The number of inferred FAR-A orthologs is inflated by predicted pseudogenes—FARs with fragmented coding sequences that lack some of the catalytically essential domains and motifs (Figure 1—figure supplement 2). These predicted catalytically inactive yet highly expressed FAR-A pseudogenes might play a role in regulating the FAR-catalyzed reduction (Pils and Schultz, 2004). The number of predicted FAR-A pseudogenes indicate that the FAR-A ortholog group expansion in this lineage was a highly dynamic process (Figure 1, Figure 1—figure supplement 2). The high number of species-specific FAR-A duplications or losses between the closely related species B. lucorum and B. terrestris, which diverged approximately 5 million years ago (Hines, 2008), further indicates the dynamic evolutionary processes acting on the FAR genes. Notably, gene family expansion inference based on mixed transcriptome and genome data is limited by (1) the uncertainty of distinguishing genuine genes from alternative splice variants and non-overlapping transcript fragments and (2) potential errors in genome assemblies or annotations. The pattern of lineage-specific FAR-A gene expansion in stingless bees and bumble bees is, to the best of our knowledge, corroborated by all genomic and transcriptomic datasets currently available for this group. Confirming many of the other potential lineage-specific FAR gene expansions in Hymenoptera will, however, require analysis of additional genomic resources.
Strikingly, both stingless bees and bumble bees share a life strategy of scent marking using LG secretion (Jarau et al., 2004). In worker stingless bees, LG secretion is used as a trail pheromone to recruit nestmates to food resources and generally contains fatty alcohols such as hexanol, octanol, and decanol in the form of their fatty acyl esters (Jarau et al., 2006; Jarau et al., 2010). The correlation between FAR-A ortholog group expansion and use of LG-produced fatty alcohols as marking pheromones or their precursors suggests a critical role for FAR-A gene group expansion in the evolution of scent marking. In the future, identification and characterization of FAR candidates involved in production of stingless bee worker LG-secretion could corroborate this hypothesis.
Bumble bee orthologs (FAR-G) of B. mori pheromone-biosynthetic FAR (Moto et al., 2003) are not abundantly or specifically expressed in male bumble bee LGs, as evidenced by RNA-Seq RPKM values (Figure 1—figure supplement 1). MMP-biosynthetic FARs in bumble bees and female sex pheromone-biosynthetic FARs in moths (Lepidoptera) were therefore most likely recruited independently for the tasks of pheromone biosynthesis.
Various models have attempted to describe the evolutionary mechanisms leading to the emergence and maintenance of gene duplicates (Innan and Kondrashov, 2010). The fragmented state of the B. terrestris genome and its limited synteny with the A. mellifera genome restricts our ability to reconstruct the genetic events accompanying the FAR duplications resulting in the FAR-A ortholog group expansion. Notably, the MMP quantities in bumble bees are substantially higher than quantities of pheromones in other insects of comparable size. For example, B. terrestris, B. lucorum and B. lapidarius bumble bee males can produce several milligrams of MMPs (Kindl, personal communication, Figure 5), while the sphingid moth Manduca sexta produces tens of nanograms of sex pheromone (Tumlinson et al., 1989). Taking into consideration the large quantities of MMPs in bumble bee males, we speculate that gene dosage benefits could substantially contribute to the duplications and duplicate fixation of MMP-biosynthetic FARs. Under this model, sexual selection favoring bumble bee males capable of producing large quantities of MMPs could fix the duplicated FARs in a population (Lespinet et al., 2002; Innan and Kondrashov, 2010).
Mechanistically, gene duplications can be facilitated by associated TEs (Reams and Roth, 2015; Schrader and Schmitz, 2018). The content of repetitive DNA in the B. terrestris and B. impatiens genome assemblies is 14.8% and 17.9%, respectively (Sadd et al., 2015), which is lower than in other insects such as the beetle Tribolium castaneum (30%), Drosophila (more than 20%) or the parasitoid wasp Nasonia vitripenis (more than 30%), but substantially higher than in the honey bee Apis mellifera (9.5%) (Elsik et al., 2014; Weinstock and Honeybee Genome Sequencing Consortium, 2006). Our finding that TEs are enriched in the vicinity of FAR-A genes in the B. terrestris and B. impatiens genomes indicates that TEs presumably contributed to the massive expansion of the FAR-A ortholog group (Figure 3). Expansions of another pheromone biosynthetic gene family, FADs, in the fly Drosophila and in corn borer moths (Ostrinia) also have been found to be mediated by TEs. It was proposed that up to seven FAD loci in these species originated by repeated retrotransposition or DNA-mediated transposition (Fang et al., 2009; Xue et al., 2007).
One notable feature of FAR-A expansion in bumble bees and stingless bees is the extent of gene expansion, often generating 10 or more predicted FAR genes (Figure 2). One scenario for FAR-A expansion is that TEs provided substrates for non-homologous recombination that led to the initial duplication (Reams and Roth, 2015; Bourque, 2009). Redundant copies of the ancestral FAR-A gene that arose as a result of the duplication were not under strong purifying selection and might have tolerated accumulation of TEs in their vicinity. The higher abundance of TEs subsequently made the region vulnerable to structural rearrangements, which facilitated expansion of the FAR-A genes. Janoušek et al. presented a model in which TEs facilitate gene family expansions in mammalian genomes (Janoušek et al., 2013; Janoušek et al., 2016). Their model describes gradual accumulation of TEs along with expansions of gene families, which under some model parameters can lead to a runaway process characterized by rapid and accelerating gene family expansion (Janoušek et al., 2016). In bumble bees, this runaway process could have been facilitated by fixation of duplicated FAR-A genes due to sexual selection for increased FAR expression. However, alternative scenarios are possible. For example, initial duplication of the FAR-A ancestral gene might have been unrelated to TEs, and TEs may have accumulated after the initial duplication. Alternatively, translocation of the FAR-A ancestral copy to a TE-rich region in the common ancestor of bumble bees and stingless bees might have facilitated expansion of this ortholog group. Further research is needed to confirm which of these scenarios is most likely.
The spectrum of fatty alcohols in B. terrestris and B. lucorum male LG differs substantially from that of B. lapidarius. In both B. terrestris and B. lucorum, the male LG extract contains a rich blend of C14–C26 fatty alcohols with zero to three double bonds (Figure 5). In B. lapidarius, the male LG extract is less diverse and dominated by Z9-16:OH and 16:OH (Figure 5, Figure 5—source data 1). To uncover how the distinct repertoire of FAR orthologs contributes to the biosynthesis of species-specific MMPs, we functionally characterized LG-expressed FARs. We previously found that the transcript levels of biosynthetic genes generally reflect the biosynthetic pathways most active in bumble bee LG (Buček et al., 2016; Buček et al., 2013). For further experimental characterization, we therefore selected the FAR-A and FAR-J gene candidates, which exhibited high and preferential expression in male LG (Figure 1—figure supplement 1). Notably, the abundant expression of BlapFAR-A1 and BterFAR-J in both virgin queen and male LG (Figure 4—figure supplement 1) suggests that these FARs might also have been recruited for production of queen-specific signals (Amsalem et al., 2014). We found that the highly similar BlucFAR-A1/BterFAR-A1 and BlapFAR-A1 orthologs exhibit distinct substrate preferences for longer fatty acyl chains (C18–C26) and shorter monounsaturated fatty acyl chains (Z9-16: and Z9-18:), respectively. This substrate preference correlates with the abundance of Z9-16:OH in B. lapidarius MMP and the almost complete absence of Z9-16:OH in B. lucorum and B. terrestris (Figure 5—source data 1). BlapFAR-A4 and to some extent BlapFAR-A5 likely further contribute to the biosynthesis of Z9-16:OH in B. lapidarius. The ability of BlucFAR-A1 and BterFAR-A1 (and not of BlapFAR-A1) to reduce long monounsaturated fatty acyls (Z15-20:) also correlates with the absence of detectable amounts of Z15-20:OH in B. lapidarius MMP.
Our comprehensive GC analysis of bumble bee male LGs, however, indicates that the composition of LG fatty acyls is another factor that contributes substantially to the final MMP composition. For example, the very low quantities of Z9-16:OH in B. terrestris and B. lucorum and of Z15-20:OH in B. lapidarius (Figure 5) can be ascribed to the absence of a FAR with the corresponding substrate specificity, but the availability of potential substrates, that is very low amount of Z9-16: acyl in B. lucorum and B. terrestris male LG and the absence of detectable Z15-20: acyl in B. lapidarius LG also likely contribute.
We detected several fatty alcohols in FBs of B. terrestris and B. lucorum, 16:OH, Z9,Z12-18:OH and Z9,Z12,Z15-18:OH being the most abundant (Figure 5—source data 1, Figure 5—figure supplement 1). Fatty alcohols are not expected to be transported from FB across haemolymph to LG (Buček et al., 2016). However, the presence of Z9,Z12-18: and Z9,Z12,Z15-18: fatty alcohols in FB provides an explanation for why we did not find a FAR reducing Z9,Z12-18: and Z9,Z12,Z15-18: among the functionally characterized candidates from B. terrestris and B. lucorum. Our candidate selection criteria were based on the LG-specific FAR transcript abundance, and we might have disregarded a FAR that is capable of polyunsaturated fatty acyl reduction and is expressed at comparable levels in both LG and FB.
We noted several discrepancies between the FAR specificity in the yeast expression system and the apparent FAR specificity in vivo (i.e. the apparent specificity of fatty acyl reduction in bumble bee LG calculated from the fatty acyl and fatty alcohol content, Figure 5—figure supplement 1). We found that BlapFAR-A1 is capable of producing substantial amounts of Z9-16:OH and Z9-18:OH (Figure 6—figure supplement 8A) in the yeast system, while in B. lapidarius LG, only Z9-16: acyl is converted to Z9-16:OH, as evidenced by the absence of detectable amounts of Z9-18:OH (Figure 5). Additionally, BlapFAR-A1 and BlapFAR-A4 produce in the yeast expression system polyunsaturated fatty alcohols (Figure 6) that are not present in B. lapidarius male LG, despite the presence of corresponding fatty acyls in the LG (Figure 5). A possible explanation for the differences between FAR specificities in the bumble bee LG and the yeast expression system is that the pool of LG fatty acyls that we assessed and used to evaluate the apparent FAR specificities has a different composition than the LG pool of fatty acyl-CoAs, which are the form of fatty acyls accepted by FARs as substrates. The presumably low concentrations of Z9,Z12-18:CoA, Z9,Z12,Z15-18:CoA, and Z9-18:CoA in the LG of male B. lapidarius compared to the concentrations of the respective fatty acyls could prevent detectable accumulation of the corresponding fatty alcohols. We therefore propose that the selectivity of enzymes and binding proteins that convert fatty acyls to fatty acyl-CoAs (Oba et al., 2004) and protect fatty acyl-CoAs from hydrolysis (Matsumoto et al., 2001) represents an additional mechanism shaping the species-specific fatty alcohol composition in bumble bee male LGs.
In sum, the functional characterization of bumble bee FARs indicates that the combined action of FARs from the expanded FAR-A ortholog group has the capability to biosynthesize the majority of bumble bee MMP fatty alcohols. The substrate specificity of FARs apparently contributes to the species-specific MMP composition, but other biosynthetic steps, namely the process of fatty acyl and fatty acyl-CoA accumulation, likely also contribute to the final fatty alcohol composition of bumble bee MMPs.
Conclusion
In the present work, we substantially broadened our limited knowledge of the function of FARs in Hymenoptera, one of the largest insect orders. The experimentally determined reductase specificity of FARs that are abundantly expressed in bumble bee male LGs is consistent with their role in MMP biosynthesis. The majority of these MMP-biosynthetic FARs belong to the FAR-A ortholog group. Reconstruction of the FAR gene family evolution indicates the onset of FAR-A gene expansion in the common ancestor of bumble bee and stingless bee lineages after their divergence from honey bee lineage. We therefore propose that the strategy of bumble bees and stingless bees to employ fatty alcohols as marking pheromones was shaped by FAR gene family expansion. Our analysis of TE distribution in the B. terrestris genome indicates that TEs enriched in the vicinity of FAR-A genes might have substantially contributed to the dramatic expansion of the FAR-A gene group. In the future, the increasing availability of annotated Hymenopteran genome assemblies should enable us to more precisely delineate the taxonomic extent and evolutionary timing of the massive FAR gene family expansion and assess in detail the role of TEs in the process.
Materials and methods
Key resources table
| Reagent type (species) or resource | Designation | Source or reference | Identifiers | Additional information |
|---|---|---|---|---|
| Gene (Acromyrmex echinatior) | Acromyrmex echinatior genome | https://www.ncbi .nlm.nih.gov/bioproject | PRJNA271903 | |
| Gene (Andrena vaga) | Andrena vaga transcriptome | https://www.ncbi.nlm.nih.gov/bioproject | PRJNA252325 | |
| Gene (Apis mellifera) | Apis mellifera genome | https://www.ncbi.nlm.nih.gov/bioproject | PRJNA13343 | |
| Gene (Bombus impatiens) | Bombus impatiens genome | https://www.ncbi.nlm.nih.gov/bioproject | PRJNA70395 | |
| Gene (Bombus rupestris) | Bombus rupestris transcriptome | https://www.ncbi.nlm.nih.gov/bioproject | PRJNA252240 | |
| Gene (Bombus terrestris) | Bombus terrestris genome | https://www.ncbi.nlm.nih.gov/bioproject | PRJNA68545 | |
| Gene (Bombus terrestris) | B. terrestris LG and FB transcriptomes | https://www.ncbi.nlm.nih.gov/bioproject | PRJEB9937 | |
| Gene (Camponotus floridanus) | Camponotus floridanus genome | https://www.ncbi.nlm.nih.gov/bioproject | PRJNA50201 | |
| Gene (Camptopoeum sacrum) | Camptopoeum sacrum transcriptome | https://www.ncbi.nlm.nih.gov/bioproject | PRJNA252153 | |
| Gene (Ceratina calcarata) | Ceratina calcarata genome | https://www.ncbi.nlm.nih.gov/bioproject | PRJNA340002 | |
| Gene (Colletes cunicularius) | Colletes cunicularius transcriptome | https://www.ncbi.nlm.nih.gov/bioproject | PRJNA252324 | |
| Gene (Dufourea novaeangliae) | Dufourea novaeangliae genome | https://www.ncbi.nlm.nih.gov/bioproject | PRJNA311229 | |
| Gene (Epeolus variegatus) | Epeolus variegatus transcriptome | https://www.ncbi.nlm.nih.gov/bioproject | PRJNA252262 | |
| Gene (Euglossa dilemma) | Euglossa dilemma transcriptome | https://www.ncbi.nlm.nih.gov/bioproject | PRJNA252310 | |
| Gene (Harpegnathos saltator) | Harpegnathos saltator genome | https://www.ncbi.nlm.nih.gov/bioproject | PRJNA273397 | |
| Gene (Megachile rotundata) | Megachile rotundata genome | https://www.ncbi.nlm.nih.gov/bioproject | PRJNA87021 | |
| Gene (Melipona quadrifasciata) | Melipona quadrifasciata genome | https://www.uniprot.org/proteomes/ | UP000053105 | |
| Gene (Melitta haemorrhoidalis) | Melitta haemorrhoidalis transcriptome | https://www.ncbi.nlm.nih.gov/bioproject | PRJNA252208 | |
| Gene (Nasonia vitripenis) | Nasonia vitripenis genome | https://www.ncbi.nlm.nih.gov/bioproject | PRJNA20073 | |
| Gene (Panurgus dentipes) | Panurgus dentipes transcriptome | https://www.ncbi.nlm.nih.gov/bioproject | PRJNA252205 | |
| Gene (Polistes canadensis) | Polistes canadensis genome | https://www.ncbi.nlm.nih.gov/bioproject | PRJNA301748 | |
| Gene (Tetragonula carbonaria) | Tetragonula carbonaria transcriptome | https://www.ncbi.nlm.nih.gov/bioproject | PRJNA252285 | |
| Gene | B. lucorum and B. lapidarius transcriptomes | This paper, https://www.ncbi.nlm.nih.gov/bioproject | PRJNA436452 | |
| Gene (Bombus lapidarius) | Cloned CDS of FAR-A1, FAR-A1-short, FAR-A4, FAR-A5, FAR-J | This paper, https://www.ncbi.nlm.nih.gov/genbank/ | MG450698; MG450699; MG450702; MG450703; MG450701 | |
| Gene (Bombus lucorum) | Cloned CDS of FAR-A1, FAR-A1-opt, FAR-A2, FAR-A2-opt | This paper,https://www.ncbi.nlm.nih.gov/genbank/ | MG930980; MG450697; MG930982; MG450704 | |
| Gene (Bombus terrestris) | Cloned CDS of FAR-A1, FAR-A2, FAR-J | This paper, https://www.ncbi.nlm.nih.gov/genbank/ | MG930981; MG930983; MG450700 | |
| Strain, strain background (Saccharomyces cerevisiae) | BY4741 | Brachmann et al., 1998 (DOI: 10.1002/(SICI)1097-0061 (19980130)14:2 < 115::AID-YEA204 > 3.0.CO;2–2) | MATa his3Δ1 leu2Δ0 met15Δ0 ura3Δ0 | |
| Strain, strain background (Saccharomyces cerevisiae, BY4741) | FAR expressing yeast strains | This paper | See Supplementary file 2 | |
| Biological sample (Bombus lapidarius) | Labial gland (LG) from males and females; faty body (FB); flight muscle; gut | This paper | Dissected by standard techniques from individuals reared in laboratory colonies | |
| Biological sample (Bombus lucorum) | Labial gland (LG) from males and females; faty body (FB); flight muscle; gut | This paper | Dissected by standard techniques from individuals reared in laboratory colonies | |
| Biological sample (Bombus terrestris) | Labial gland (LG) from males and females; faty body (FB); flight muscle; gut | This paper | Dissected by standard techniques from individuals reared in laboratory colonies | |
| Antibody | Anti-6×His tag antibody-HRP conjugate, mouse monoclonal | Merck | A7058; RRID:AB_258326 | (1:2000) |
| Recombinant DNA reagent | Escherichia coli DH5α | Thermo Fisher Scientific | 18265017 | |
| Recombinant DNA reagent | Escherichia coli One Shot TOP10 | Thermo Fisher Scientific | C4040 | |
| Recombinant DNA reagent | pYEXTHS-BN (plasmid) | Holz et al., 2002 (DOI: 10.1016/S1046-5928 (02)00029–3) | pUC and 2μ origin; LEU2, URA3 and AmpR selectable markers; PCUP1 inducible promoter; N-terminal 6 × His tag and C-terminal Strep II tag | |
| Recombinant DNA reagent | pYEXTHS-BN plasmids carrying FAR CDSs | This paper | See Supplementary file 2 | |
| Sequence- based reagent | Cloning primers | This paper | See Supplementary file 2 | |
| Sequence- based reagent | RT-qPCR primers | This paper; Horňáková et al., 2010 (DOI: 10.1016/j.ab.2009.09.019) | See Supplementary file 2 | |
| Commercial assay or kit | In-Fusion HD Cloning kit | Clontech (Takara) | 639649 | |
| Commercial assay or kit | LightCycler 480 SYBR Green I Master | Roche | 04707516001 | |
| Commercial assay or kit | RNeasy Mini Kit | Qiagen | 74104 | |
| Commercial assay or kit | S.c. EasyComp Transformation Kit | Thermo Fisher Scientific | K505001 | |
| Commercial assay or kit | SMART cDNA Library Construction Kit | Clontech (Takara) | 634901 | |
| Commercial assay or kit | SuperSignal West Femto Maximum Sensitivity Substrate | Thermo Fisher Scientific | 34096 | |
| Commercial assay or kit | TOPO TA Cloning kit | Thermo Fisher Scientific | 450640 | |
| Software, algorithm | Batch conserved domain search | DOI: 10.1093/nar/gku1221 | ||
| Software, algorithm | BLAST | DOI: 10.1016/S0022 -2836 (05)80360–2 | ||
| Software, algorithm | bowtie2 v2.2.6 | DOI: 10.1038/nmeth.1923 | ||
| Software, algorithm | CLC Genomics Workbench software v. 7.0.1 | http://www.clcbio.com | ||
| Software, algorithm | ggtree | DOI: 10.1111/2041-210X.12628 | ||
| Software, algorithm | ht-seq v0.9.1 | DOI: 10.1093/ bioinformatics/btu638 | ||
| Software, algorithm | IQTREE v1.5.5 | DOI: 10.1093/ molbev/msu300 | ||
| Software, algorithm | mafft v7.305 | DOI: 10.1093/nar/gkf436 | ||
| Software, algorithm | MAUVE 2.4.0 | DOI: 10.1101/gr.2289704 | ||
| Software, algorithm | Primer BLAST | DOI: 10.1186/1471-2105-13-134 | ||
| Software, algorithm | R programming language | R Core Team. R: A language and environment for statistical computing. (2016) |
Insects
Specimens of Bombus lucorum and Bombus lapidarius were obtained from laboratory colonies established from naturally overwintering bumble bee queens. The Bombus terrestris specimens originated from laboratory colonies obtained from a bumble bee rearing facility in Troubsko, Czech Republic.
LG and FB samples used for transcriptome sequencing were prepared from 3-day-old B. lapidarius males by pooling tissues from three specimens from the same colony. The cephalic part of the LG and a section of the abdominal peripheral FB were dissected, transferred immediately to TRIzol (Invitrogen), then flash-frozen at −80°C and stored at this temperature prior to RNA isolation.
RNA isolation and cDNA library construction
Request a detailed protocolFor cloning of FARs and RT-qPCR analysis of tissue-specific gene expression, RNA was isolated from individual bumble bee tissues by guanidinium thiocyanate-phenol-chloroform extraction followed by RQ1 DNase (Promega) treatment and RNA purification using the RNeasy Mini Kit (Qiagen). The tissue sample for RNA isolation from virgin queen LGs consisted of pooled glands from two specimens. A nanodrop ND-1000 spectrophotometer (Thermo Fisher) was employed to determine the isolated RNA concentration. The obtained RNA was kept at −80°C until further use.
The cDNA libraries of LGs from 3-day-old bumble bee males were constructed from 0.50 μg total RNA using the SMART cDNA Library Construction Kit (Clontech) with either Superscript III (Invitrogen) or M-MuLV (New England Biolabs) reverse transcriptase.
Transcriptome sequencing, assembly and annotation
Request a detailed protocolThe male LG and FB transcriptomes of B. lapidarius were sequenced and assembled as previously described for the transcriptomes of male LGs and FBs of B. lucorum and B. terrestris (Buček et al., 2013; Prchalová et al., 2016). Briefly, total RNA was isolated from the LGs and FBs of three 3-day-old B. lapidarius males and pooled into a one FB and one LG sample. Total RNA (5 µg) from each of the samples was used as starting material. Random primed cDNA libraries were prepared using poly(A)+ enriched mRNA and standard Illumina TrueSeq protocols (Illumina). The resulting cDNA was fragmented to an average of 150 bp. RNA-Seq was carried out by Fasteris (Fasteris) and was performed using an Illumina HiSeq 2500 Sequencing System. Quality control, including filtering high-quality reads based on the fastq score and trimming the read lengths, was carried out using CLC Genomics Workbench software v. 7.0.1 (http://www.clcbio.com). The complete transcriptome libraries were assembled de novo using CLC Genomics Workbench software. FAR expression values were calculated by mapping Illumina reads against the predicted coding regions of FAR sequences using bowtie2 v2.2.6 (Langmead and Salzberg, 2012) and counting the mapped raw reads using ht-seq v0.9.1 (Anders et al., 2015). The raw read counts were normalized for the FAR coding region length and the total number of reads in the sequenced library, yielding reads per kilobase of transcript per million mapped reads (RPKM) values (Mortazavi et al., 2008). A constant value of 1 was added to each RPKM value and subsequently log2-transformed and visualized as heatmaps using the ggplot2 package in R (Core Team R, 2016). Complete short read (Illumina HiSeq2500) data for FB and LG libraries from B. lapidarius and previously sequenced B. lucorum (Buček et al., 2013) were deposited in the Sequence Read Archive (https://www.ncbi.nlm.nih.gov/sra) with BioSample accession numbers SAMN08625119, SAMN08625120, SAMN08625121, and SAMN08625122 under BioProject ID PRJNA436452.
FAR sequence prediction
Request a detailed protocolThe FARs of B. lucorum and B. lapidarius were predicted based on Blast2GO transcriptome annotation and their high protein sequence similarity to previously characterized FARs from the European honey bee Apis mellifera (Teerawanichpan et al., 2010b) and the silk moth Bombyx mori (Moto et al., 2003).
FAR sequences from species across the Hymenoptera phylogeny were retrieved from publicly available resources. When available, genome assembly-derived FAR sequences were used instead of transcriptome assembly-derived sequences to minimize the impact of misidentification of alternative splice variants as distinct genes on inference of FAR gene expansion. However, in the Euglossa dilemma genome-derived proteome, we failed to identify a FAR-A gene, but we did detect FAR-As in the transcriptome sequencing-derived dataset. We therefore used the Euglossa dilemma transcriptome rather than genome for downstream analyses. FARs from annotated genomes (Bombus impatiens (Sadd et al., 2015), Bombus terrestris (Sadd et al., 2015), Apis mellifera (Janoušek et al., 2016), Camponotus floridanus (Bonasio et al., 2010), Acromyrmex echinatior (Nygaard et al., 2011), Harpegnathos saltator (Bonasio et al., 2010), Nasonia vitripenis (Werren et al., 2010), Polistes canadensis (Patalano et al., 2015), Dufourea novaeangliae (Kapheim et al., 2015), Ceratina calcarata (Rehan et al., 2016), Melipona quadrifasciata (Woodard et al., 2011) and Megachile rotundata (Woodard et al., 2011)) of other hymenopteran species were retrieved by blastp (Altschul et al., 1990) searches (E-value cutoff 10−5) of the species-specific NCBI RefSeq protein database or UniProt protein database using predicted protein sequences of B. lucorum, B. lapidarius and B. terrestris FARs (accessed February 2017). An additional round of blastp searches using FARs found in the first blastp search round did not yield any additional significant (E-value <10−5) blastp hits, indicating that all FAR homologs were found in the first round of blastp searches (data not shown).
FARs from non-annotated transcriptomes (Bombus rupestris (Peters et al., 2017), Tetragonula carbonaria (Peters et al., 2017), Euglossa dilemma (Peters et al., 2017), Epeolus variegatus (Peters et al., 2017), Colletes cunicularius (Peters et al., 2017), Melitta haemorrhoidalis (Peters et al., 2017), Camptopoeum sacrum (Peters et al., 2017), Panurgus dentipes (Peters et al., 2017), and Andrena vaga (Peters et al., 2017)) were retrieved via local tblastn search (E-value cutoff 10−5) of the publicly available contig sequences (BioProjects PRJNA252240, PRJNA252285, PRJNA252310, PRJNA252262, PRJNA252324, PRJNA252208, PRJNA252153, PRJNA252205, and PRJNA252325) using Bombus FARs as a query. The longest translated ORFs were used as a query in tblastn searches against NCBI non-redundant nucleotide database (nr/nt) and ORFs not yielding highly scoring blast hits annotated as FARs were rejected. For FARs with multiple splice variants predicted from the genome sequence, only the longest protein was used for gene tree reconstruction. In the case of transcriptome assembly-derived FARs, we predicted as alternative splice variants those FAR transcripts that were truncated but otherwise identical in sequence to another FAR transcript in the transcriptome. These FARs were not included in gene tree reconstruction.
The active site, conserved Rossmann fold NAD(P)+ binding domain (NABD) (Rossmann et al., 1974) and a putative substrate binding site in FAR coding sequences were predicted using Batch conserved domain search (Marchler-Bauer et al., 2015). The matrix of protein identities was calculated using Clustal Omega with default parameters (https://www.ebi.ac.uk/Tools/msa/clustalo/ accessed February 2018).
FAR gene tree reconstruction
Request a detailed protocolThe protein sequences of predicted hymenopteran FARs were aligned using mafft v7.305. The unrooted gene tree was inferred in IQTREE v1.5.5 with 1000 ultrafast bootstrap approximation replicates (Minh et al., 2013), and with a model of amino acid substitution determined by ModelFinder (Kalyaanamoorthy et al., 2017) implemented in IQTREE. The tree was visualized and annotated using the ggtree package (Yu et al., 2016) in R programming language.
Genome alignment and TE-enrichment analysis
Request a detailed protocolThe genomes of A. mellifera and B. terrestris were aligned using MAUVE 2.4.0 (Darling et al., 2004). The genomic position of predicted B. terrestris FAR genes was visually inspected using the NCBI Graphical sequence viewer (accessed January 2018 at Nucleotide Entrez Database).
TE-enrichment analysis in the vicinity of FAR genes in the B. terrestris and B. impatiens genomes was carried out to explore the impact of TEs in extensive expansion of FAR-A genes. TE annotation using the NCBI RepeatMasker provided insufficient detail. Thus, TE annotations for B. terrestris and B. impatiens were obtained from the Human Genome Sequencing Center FTP (ftp://ftp.hgsc.bcm.edu/; accessed October 2018). We used the approach described by Sadd et al. to identify different types of TEs (Sadd et al., 2015). For B. terrestris, genome version 2.1 was used, and for B. impatiens version 1.0 was used. TE density around FAR genes was calculated 10 kb upstream and downstream of each FAR gene, separately for FAR-A genes and non-FAR-A genes. Statistical significance was assessed by permutation test. We compared FAR-A/non-FAR-A gene set average TE density to the null distribution of the average TE densities around B. terrestris and B. impatiens genes built from 10,000 randomly sampled gene sets with size corresponding to that of the FAR-A/non-FAR-A gene set from the publicly available RefSeq gene set downloaded for the respective genome versions from the NCBI FTP. TE densities were analyzed for a pooled set of all TEs and separately for each TE class and major TE family (Class I: LINE, LTR, LARD, DIRS; Class II: DNA, TIR, MITE, TRIM, Maveric, Helitron) using custom shell scripts and bedtools (Supplementary file 3), a suite of Unix genomic tools (Quinlan and Hall, 2010). R programming language was used for statistical analysis.
Quantitative analysis of FAR expression
Request a detailed protocolFirst-strand cDNA was synthesized from 0.30 μg total RNA using oligo(dT)12-18 primers and Superscript III reverse transcriptase. The resulting cDNA samples were diluted 5-fold with water prior to RT-qPCR. The primers used for the assay (Supplementary file 2) were designed with Primer-BLAST (https://www.ncbi.nlm.nih.gov/tools/primer-blast/) (Ye et al., 2012) and tested for amplification efficiency and specificity by employing amplicon melting curve analysis on dilution series of pooled cDNAs from each species.
The reaction mixtures were prepared in a total volume of 20 μL consisting of 2 μL sample and 500 nM of each primer using LightCycler 480 SYBR Green I Master kit (Roche). The reactions were run in technical duplicates for each sample. RT-qPCR was performed on a LightCycler 480 Instrument II (Roche) in 96-well plates under the following conditions: 95°C for 60 s, then 45 cycles of 95°C for 30 s, 55°C for 30 s and 72°C for 30 s followed by a final step at 72°C for 2 min.
The acquired data were processed with LightCycler 480 Software 1.5 (Roche) and further analyzed with MS Excel (Microsoft Corporation). FAR transcript abundances were normalized to the reference genes phospholipase A2 (PLA2) and elongation factor 1α (eEF1α) as described (Hornáková et al., 2010).
FAR gene isolation and cloning
Request a detailed protocolThe predicted coding regions of FARs from B. lucorum, B. lapidarius and B. terrestris were amplified by PCR from LG cDNA libraries using gene-specific primers (Supplementary file 2) and Phusion HF DNA polymerase (New England Biolabs). Parts of the full-length coding sequence of BlapFAR-A5 were obtained by RACE procedure using SMART cDNA Library Construction Kit. The PCR-amplified sequences containing the 5' and 3' ends of BlapFAR-A5 were inserted into pCRII-TOPO vector using TOPO TA Cloning kit (Invitrogen) and sequenced by Sanger method. The resulting sequences overlapped with contig sequences retrieved from the B. lapidarius transcriptome. The full-length BlapFAR-A5-coding region was subsequently isolated using gene-specific PCR primers. The sequence of BlapFAR-A1 and yeast codon-optimized sequences of BlucFAR-A1-opt and BlucFAR-A2-opt were obtained by custom gene synthesis (GenScript); see Supplementary file 2 for synthetic sequences. The individual FAR coding regions were then inserted into linearized pYEXTHS-BN vector (Holz et al., 2002) using the following restriction sites: Bter/BlucFAR-A1 and BlapFAR-J at SphI-NotI sites; Bter/BlucFAR2, BlapFAR-A1, BlapFAR-A1-short and BlapFAR-A5 at BamHI-NotI sites; and BlucFAR-A1-opt/FAR-A2-opt and BlapFAR-A4 at BamHI-EcoRI sites. In the case of BterFAR-J, the Taq DNA polymerase (New England Biolabs)-amplified sequence was first inserted into pCRII-TOPO vector and then subcloned into pYEXTHS-BN via BamHI-EcoRI sites using the In-Fusion HD Cloning kit (Clontech).
The resulting vectors containing FAR sequences N-terminally fused with 6×His tag were subsequently transformed into E. coli DH5α cells (Invitrogen). The plasmids were isolated from bacteria with Zyppy Plasmid Miniprep kit (Zymo Research) and Sanger sequenced prior to transformation into yeast. The protein-coding sequences of all studied FARs were deposited to GenBank (see Key Resources Table for accession numbers).
Functional assay of FARs in yeast
Request a detailed protocolExpression vectors carrying FAR-coding sequences were transformed into Saccharomyces cerevisiae strain BY4741 (MATa his3Δ1 leu2Δ0 met15Δ0 ura3Δ0) (Brachmann et al., 1998) using S.c. EasyComp Transformation Kit (Invitrogen). To test FAR specificity, yeasts were cultured for 3 days in 20 mL synthetic complete medium lacking uracil (SC−U) supplemented with 0.5 mM Cu2+ (inducer of heterologous gene expression), 0.2% peptone and 0.1% yeast extract. The yeast cultures were then washed with water and the cell pellets lyophilized before proceeding with lipid extraction. FAR specificities were determined with the FARs acting on natural substrates present in yeast cells and with individual fatty acyls added to the cultivation media, with the respective fatty alcohols present in the LGs of studied bumble bees. For this purpose, yeast cultures were supplemented with the following fatty acyls: 0.1 mM Z9,Z12-18:COOH (linoleic acid, Sigma-Aldrich), Z9,Z12,Z15-18:COOH (α-linolenic acid, Sigma-Aldrich) or Z15-20:Me solubilized with 0.05% tergitol. We chose Z15-20: as a representative monounsaturated >C20 fatty acyl substrate because Z15-20:OH is the most abundant monounsaturated fatty alcohol in B. terrestris LG (Figure 5).
The level of heterologous expression of bumble bee FARs was assayed by western blot analysis of the whole-cell extracts (obtained via sonication) using anti-6×His tag antibody-HRP conjugate (Sigma-Aldrich) and SuperSignal West Femto Maximum Sensitivity Substrate kit (Thermo Fisher Scientific).
Lipid extraction and transesterification
Request a detailed protocolLipids were extracted from bumble bee tissue samples under vigorous shaking using a 1:1 mixture of CH2Cl2/MeOH, followed by addition of an equal amount of hexane and sonication. The extracts were kept at −20°C prior to GC analysis.
Base-catalyzed transesterification was performed as described previously (Matousková et al., 2008) with modifications: the sample was shaken vigorously with 1.2 mL CH2Cl2/MeOH 2:1 and glass beads (0.5 mm) for 1 hr. After brief centrifugation to remove particulate debris, 1 mL supernatant was evaporated under nitrogen, and the residue was dissolved using 0.2 mL 0.5 M KOH in methanol. The mixture was shaken for 0.5 hr and then neutralized by adding 0.2 mL solution of Na2HPO4 and KH2PO4 (0.25 M each) and 35 μL 4 M HCl. The obtained FAMEs were extracted with 600 μL hexane and analyzed by gas chromatography.
For quantification purposes, either 1-bromodecane (10:Br) or 1-bromoeicosane (20:Br) were added to the extracts as internal standards.
Gas chromatography and fatty alcohol ratio determination
Standards of Z9,Z12,Z15-18:OH and Z15-20:OH were prepared from their corresponding acids/FAMEs by reduction with LiAlH4. The Z9-18:Me standard was prepared by reacting oleoyl chloride with methanol. Other FAME and fatty alcohol standards were obtained from Nu-Chek Prep and Sigma-Aldrich. The FA-derived compounds in extracts were identified based on the comparison of their retention times with the standards and comparison of measured MS spectra with those from spectral libraries. Double bond positions were assigned after derivatization with dimethyl disulfide (Carlson et al., 1989).
The fatty alcohol ratio is calculated according to Equation 1,
(1)
where n is the amount in moles and X is the fatty chain structure of certain length, degree of unsaturation and double bond position/configuration. The fatty acyl term in Equation 1 stands for all transesterifiable fatty acyls present in the sample, for example free FAs, fatty acyl-CoAs, and triacylglycerols, containing the same fatty chain structure. The fatty alcohol ratio thus represents the hypothetical degree of conversion of total fatty acyls (as if they were available as FAR substrates, that is fatty acyl-CoAs) to the respective fatty alcohol and reflects the apparent FAR specificity in the investigated bumble bee tissue or yeast cell.
GC-FID
Request a detailed protocolGC with flame-ionization detector (FID) was used for quantitative assessment of the FA-derived compounds. The separations were performed on a Zebron ZB-5ms column (30 m × 250 μm I. D. × 0.25 μm film thickness, Phenomenex) using a 6890 gas chromatograph (Agilent Technologies) with following parameters: helium carrier gas, 250°C injector temperature, and 1 mL.min−1 column flow. The following oven temperature program was used: 100°C (held for 1 min), ramp to 285°C at a rate of 4 °C.min−1 and a second ramp to 320°C at a rate of 20 °C.min−1 with a final hold for 5 min at 320°C. The analytes were detected in FID at 300°C using a makeup flow of 25 mL.min−1 (nitrogen), hydrogen flow of 40 mL.min−1, air flow of 400 mL.min−1 and acquisition rate of 5 Hz. The collected data were processed in Clarity (DataApex).
Comprehensive gas chromatography-mass spectrometry (GC×GC-MS)
Request a detailed protocolThe technique was used for initial identification of analytes by comparing their retention characteristics and mass spectra with those of synthetic standards and for quantification of the FA-derived compounds. The following conditions were employed using a 6890N gas chromatograph (Agilent Technologies) coupled to a Pegasus IV D time-of-flight (TOF) mass selective detector (LECO Corp.): helium carrier gas, 250°C injector temperature, 1 mL.min−1column flow, modulation time of 4 s (hot pulse time 0.8 s, cool time 1.2 s), modulator temperature offset of +20°C (relative to secondary oven) and secondary oven temperature offset of +10°C (relative to primary oven). Zebron ZB-5ms (30 m × 250 μm I. D. × 0.25 μm film thickness, Phenomenex) was used as a non-polar primary column and BPX-50 (1.5 m × 100 μm I. D. × 0.10 μm film thickness, SGE) was used as a more polar secondary column. The primary oven temperature program was as follows: 100°C (1 min), then a single ramp to 320°C at a rate of 4 °C.min−1 with a final hold for 5 min at 320°C.
The mass selective detector was operated in electron ionization mode (electron voltage −70 V) with a transfer line temperature of 260°C, ion source temperature of 220°C, 100 Hz acquisition rate, mass scan range of 30–600 u and 1800 V detector voltage. ChromaTOF software (LECO Corp.) was used to collect and analyze the data.
Synthesis of methyl Z15-eicosenoate
The Z15-20:CoA precursor, methyl Z15-eicosenoate (Z15-20:Me, 4), was synthesized by a new and efficient four-step procedure, starting from inexpensive and easily available cyclopentadecanone. The C1–C15 part of the molecule was obtained by Baeyer-Villiger oxidation of cyclopentadecanone, followed by subsequent methanolysis of the resulting lactone 1 and Swern oxidation of the terminal alcohol group of 2; the C16–C20 fragment was then connected to the aldehyde 3 by Wittig olefination.
All reactions were conducted in flame- or oven-dried glassware under an atmosphere of dry nitrogen. THF, CH2Cl2 and MeOH were dried following standard methods under a nitrogen or argon atmosphere. Petroleum ether (PE, 40–65°C boiling range) was used for chromatographic separations. TLC plates (silica gel with fluorescent indicator 254 nm, Fluka or Macherey-Nagel) were used for reaction monitoring. Flash column chromatographic separations were performed on silica gel 60 (230–400 mesh, Merck or Acros).
IR spectra were taken on an ALPHA spectrometer (Bruker) as neat samples using an ATR device. 1H and 13C NMR spectra were recorded in CDCl3 on an AV III 400 HD spectrometer (Bruker) equipped with a cryo-probe or an AV III 400 spectrometer (Bruker) equipped with an inverse broad-band probe at 400 MHz for 1H and 100 MHz for 13C. 1H NMR chemical shifts were provided in ppm using TMS as external standard; 13C NMR chemical shifts were referenced against the residual solvent peak. The connectivity was determined by 1H-1H COSY experiments. GC-MS (EI) measurements were performed on an Agilent 5975B MSD coupled to a 6890N gas chromatograph (Agilent Technologies). High-resolution MS (HRMS) spectra were measured on a Q-Tof micro spectrometer (resolution 100000 (ESI), Waters) or GCT Premier orthogonal acceleration TOF mass spectrometer (EI and CI, Waters).
1-Oxacyclohexadecan-2-one (1)
Request a detailed protocolCyclopentadecanone (500 mg, 2.23 mmol) was dissolved in dry CH2Cl2 (6 mL) and meta-chloroperbenzoic acid (mCPBA) (687 mg, 2.79 mmol, 70%) was added at 0°C. The reaction mixture was stirred at room temperature (r.t.), occasionally concentrated under a flow of nitrogen, and the solid residue was re-dissolved in dry CH2Cl2. After stirring for four days, the conversion was still not complete; additional mCPBA (164 mg, 667 μmol, 70%) was added at 0°C and stirring was continued at r.t. for 48 hr. The mixture was diluted with CH2Cl2 (20 mL), and the organic layer was washed with saturated NaHCO3 solution (5 × 5 mL) and brine (5 mL). The organic layer was dried over Na2SO4, filtered and evaporated. The crude product was purified by column chromatography (50 mL silica gel, PE/CH2Cl2 1:1) providing product 1 (426 mg, 80%) as a colorless waxy solid.
1: Melting point (m.p.) <30°C. Rf (PE/Et2O 95:5) = 0.5. IR (film): ν = 2925, 2855, 1733, 1459, 1385, 1349, 1234, 1165, 1108, 1070, 1013, 963, 801, 720 cm−1. HRMS (+EI TOF) m/z: (C15H28O2) calc.: 240.2089, found: 240.2090. 1H NMR (400 MHz, CDCl3) δ = 4.13 (t, J = 5.7 Hz, 2H, H16), 2.33 (t, J = 7.0 Hz, 2H, H3), 1.72–1.56 (m, 4H, H4, H15), 1.48–1.37 (m, 2H, H14), 1.36–1.23 (m, 18H, H5–H13). 13C NMR (100 MHz, CDCl3) δ = 174.2, 64.1, 34.6, 28.5, 27.9, 27.28, 27.26, 27.1, 26.8, 26.5, 26.2, 26.1, 26.0, 25.3, 25.1.
Methyl 15-hydroxypentadecanoate (2)
Request a detailed protocolMeOK (74 μL, 208 μmol, 2.81M in MeOH) was added dropwise at 0°C to a mixture of lactone 1 (50 mg, 208 μmol), dry THF (0.5 mL) and MeOH (1 mL). The mixture was stirred at r.t. for 48 hr, by which point the reaction was complete as indicated by TLC. The solution was quenched with a few drops of water and diluted with Et2O (5 mL). After stirring for 30 min, the layers were separated and the aqueous layer was extracted with Et2O (3 × 3 mL). The combined organic layers were washed with brine and water, dried over Na2SO4, filtered and evaporated to obtain nearly pure product. Purification by column chromatography (5 mL silica gel, PE/EtOAc 9:1) provided product 2 (55 mg, 97%) as a colorless solid.
2: m.p. 47–48°C. Rf (PE/Et2O 95:5) = 0.2. IR (film): ν = 3285, 2917, 2849, 1740, 1473, 1463, 1435, 1412, 1382, 1313, 1286, 1264, 1240, 1217, 1196, 1175, 1117, 1071, 1061, 1049, 1025, 1013, 992, 973, 926, 884, 731, 720, 701 cm−1. HRMS (+ESI) m/z: (C16H32O3Na) calc.: 295.2244, found: 295.2245. 1H NMR (400 MHz, CDCl3) δ = 3.64 (s, 3H, OCH3), 3.61 (t, J = 6.7 Hz, 2H, H15), 2.28 (t, J = 7.5 Hz, 2H, H2), 1.72 (s, 1H, OH), 1.59 (quint, J = 7.1 Hz, 2H, H3), 1.54 (quint, J = 7.1 Hz, 2H, H14), 1.37–1.14 (m, 20H, H4–H13). 13C NMR (101 MHz, CDCl3) δ = 174.5, 63.1, 51.6, 34.2, 32.9, 29.71 (3C), 29.68 (2C), 29.5 (2C), 29.4, 29.3, 25.9, 25.1.
Methyl 15-oxopentadecanoate (3)
Request a detailed protocolDry DMSO (110 μL, 1.54 mmol) was added at −78°C dropwise to a mixture of oxalyl chloride (90 μL, 1.03 mmol) and CH2Cl2 (2 mL) in a 25 mL flask, and the reaction mixture was stirred for 15 min. The hydroxy ester 2 (140 mg, 0.51 mmol) in dry CH2Cl2 (2 mL) was added dropwise via a cannula; the white, turbid reaction mixture was stirred for 40 min, and dry triethylamine (432 μL, 3.08 mmol) was added dropwise. The mixture was stirred at –78°C for 1 hr and warmed to 0°C over 30 min at which point the reaction was complete according to TLC. The reaction mixture was diluted with CH2Cl2 (10 mL), quenched with saturated NH4Cl solution (5 mL) and water (5 mL), and warmed to r.t. The layers were separated and the aqueous layer was extracted with CH2Cl2 (3 × 10 mL). The combined organic layers were washed with brine, dried over MgSO4, filtered and evaporated. The crude product was purified by flash chromatography (10 mL silica gel, PE/EtOAc 95:5) giving aldehyde 3 (109 mg, 78%) as a colorless waxy solid.
3: m.p. <37°C. Rf (PE/EtOAc 9:1) = 0.4. IR (film): ν = 2923, 2852, 2752, 1738, 1465, 1436, 1362, 1315, 1243, 1197, 1172, 1120, 1017, 985, 958, 883, 811, 719 cm−1. HRMS (+CI TOF) m/z: (C16H31O3) calc.: 271.2273, found: 271.2277. 1H NMR (400 MHz, CDCl3) δ = 9.76 (t, J = 1.9 Hz, 1H, H15), 3.66 (s, 3H, OCH3), 2.41 (td, J = 7.4, 1.9 Hz, 2H, H14), 2.29 (t, J = 7.5 Hz, 2H, H2), 1.67–1.56 (m, 4H, H3,H13), 1.35–1.20 (m, 18H, H4-H12). 13C NMR (100 MHz, CDCl3) δ = 203.1, 174.5, 51.6, 44.1, 34.3, 29.72, 29.70 (2C), 29.58, 29.56, 29.5, 29.4, 29.31, 29.29, 25.1, 22.2.
Methyl Z15-eicosenoate (4, Z15-20:Me)
Request a detailed protocolNaHMDS (614 μL, 0.614 mmol, 1.0 M in THF) was added dropwise at −55°C over 10 min to a suspension of high vacuum-dried (pentyl)triphenylphosphonium bromide (282 mg, 0.68 mmol) (Prasad et al., 2014) in dry THF (3 mL) in a flame dried round-bottomed Schlenk flask. The bright orange reaction mixture was stirred while warming to −40°C for 50 min, and a solution of aldehyde 3 (92 mg, 0.34 mmol) in dry THF (1.5 mL) was added dropwise via cannula at −45°C. Stirring was continued for 1 hr, and the reaction mixture was warmed to r.t. over 90 min. The reaction mixture was diluted with PE (25 mL); filtered through a short silica gel plug, which was washed with PE; and evaporated. The crude product was purified by flash chromatography (silica gel, gradient PE/EtOAc 100:0 to 95:5) to give methyl ester 4 (88 mg, 79%) as a colorless oil.
4: Rf (PE/Et2O 95:5) = 0.6. IR (film): ν = 3005, 2922, 2853, 1743, 1699, 1684, 1653, 1541, 1521, 1507, 1489, 1436, 1362, 1196, 1169, 1106, 1017, 880, 722 cm−1. GC-MS (EI) tR [60°C (4 min) → 10 °C/min to 320°C (10 min)] 21 min; m/z (%): 324 (4) [M+], 292 (26), 250 (10), 208 (9), 152 (7), 123 (12), 111 (22), 97 (48), 87 (40), 83 (52), 74 (56), 69 (70), 59 (14), 55 (100), 41 (43), 28 (26). HRMS (+EI TOF) m/z: (C21H40O2) calc.: 324.3028, found: 324.3026. 1H NMR (401 MHz, CDCl3) δ = 5.39–5.30 (m, 2H, H15,H16), 3.66 (s, 3H, OCH3), 2.30 (t, J = 7.5 Hz, 2H, H2), 2.07–1.96 (m, 4H, H14,H17), 1.61 (quint, J = 7.5 Hz, 2H, H3), 1.37–1.14 (m, 24H, H4-H13,H18,H19), 0.89 (t, J = 7.2 Hz, 3H, H20). 13C NMR (100 MHz, CDCl3) δ = 174.5, 130.1, 130.0, 51.6, 34.3, 32.1, 29.9, 29.81, 29.79, 29.74, 29.70, 29.68, 29.6, 29.5, 29.4, 29.3, 27.4, 27.1, 25.1, 22.5, 14.2.
Statistical analysis
Request a detailed protocolAll lipid quantifications in yeast and in bumble bee LGs and FBs, and RT-qPCR transcript quantifications in bumble bee tissues were performed using three biological replicates (in addition, technical duplicates were used for RT-qPCR); the number of biological replicates is indicated as N in figures and tables. The results are reported as mean value ±S.D. Significant differences were determined by one-way analysis of variance (ANOVA) followed by post-hoc Tukey’s honestly significant difference (HSD) test or by a two-tailed t-test as indicated in figures and in Results section.
Data availability
Complete short read (Illumina HiSeq2500) data from B. lucorum and B. lapidarius were deposited in the Sequence Read Archive (https://www.ncbi.nlm.nih.gov/sra) with BioSample accession numbers SAMN08625119, SAMN08625120, SAMN08625121, and SAMN08625122 under BioProject ID PRJNA436452.
-
BioProjectID PRJNA436452. Complete short read (Illumina HiSeq2500) data from B. lucorum and B. lapidarius.
-
BioProjectID PRJNA252240. Tetragonula carbonaria transcriptomes.
-
BioProjectID PRJNA45869. Bombus terrestris genome.
-
BioProjectID PRJNA13343. Apis mellifera genome.
-
BioProjectID PRJNA274144. Camponotus floridanus genome.
-
BioProjectID PRJNA271903. Acromyrmex echinatior genome.
-
BioProjectID PRJNA20073. Nasonia vitripennis genome.
-
BioProjectID PRJNA301748. Polistes canadensis genome.
-
BioProjectID PRJNA62691. Melipona quadrifasciatatranscriptome.
-
BioProjectID PRJNA252285. Bombus rupestris transcriptomes.
-
BioProjectID PRJNA61101. Bombus impatiens genome.
-
BioProjectID PRJNA273397. Harpegnathos saltator genomes.
-
BioProjectID PRJNA87021. Megachile rotundata transcriptome.
References
-
Basic local alignment search toolJournal of Molecular Biology 215:403–410.https://doi.org/10.1016/S0022-2836(05)80360-2
-
Codon usage: nature's roadmap to expression and folding of proteinsBiotechnology Journal 6:650–659.https://doi.org/10.1002/biot.201000332
-
Pheromone-gland-specific fatty-acyl reductase in the adzuki bean borer, ostrinia scapulalis (Lepidoptera: Crambidae)Insect Biochemistry and Molecular Biology 39:90–95.https://doi.org/10.1016/j.ibmb.2008.10.008
-
Chemical ecology of bumble beesAnnual Review of Entomology 59:299–319.https://doi.org/10.1146/annurev-ento-011613-161949
-
Studies on natural odoriferous compounds: vii. recognition of two forms of Bombus lucorum L. (Hymenoptera, Apidae) by analysis of the volatile marking secretion from individual malesZoon 1:31–42.
-
Transposable elements in gene regulation and in the evolution of vertebrate genomesCurrent Opinion in Genetics & Development 19:607–612.https://doi.org/10.1016/j.gde.2009.10.013
-
The role of desaturases in the biosynthesis of marking pheromones in bumblebee malesInsect Biochemistry and Molecular Biology 43:724–731.https://doi.org/10.1016/j.ibmb.2013.05.003
-
Exploring complex pheromone biosynthetic processes in the bumblebee male labial gland by RNA sequencingInsect Molecular Biology 25:295–314.https://doi.org/10.1111/imb.12221
-
Mammalian wax biosynthesis. I. identification of two fatty acyl-Coenzyme A reductases with different substrate specificities and tissue distributionsThe Journal of Biological Chemistry 279:37789–37797.https://doi.org/10.1074/jbc.M406225200
-
SoftwareR: A Language and Environment for Statistical ComputingGBIF.
-
Mauve: multiple alignment of conserved genomic sequence with rearrangementsGenome Research 14:1394–1403.https://doi.org/10.1101/gr.2289704
-
The birth-and-death evolution of multigene families revisitedGenome Dynamics 7:170–196.https://doi.org/10.1159/000337119
-
Molecular evolution and functional diversification of fatty acid desaturases after recurrent gene duplication in DrosophilaMolecular Biology and Evolution 26:1447–1456.https://doi.org/10.1093/molbev/msp057
-
BookBumblebees - Behaviour, Ecology and ConservationOxford: Oxford University Press.
-
A micro-scale process for high-throughput expression of cDNAs in the yeast saccharomyces cerevisiaeProtein Expression and Purification 25:372–378.https://doi.org/10.1016/S1046-5928(02)00029-3
-
Characterization and functional assay of a fatty acyl-CoA reductase gene in the scale insect, ericerus pela chavannes (Hemiptera: coccoidae)Archives of Insect Biochemistry and Physiology 97:e21445.https://doi.org/10.1002/arch.21445
-
The evolution of gene duplications: classifying and distinguishing between modelsNature Reviews Genetics 11:97–108.https://doi.org/10.1038/nrg2689
-
The role of retrotransposons in gene family expansions in the human and mouse genomesGenome Biology and Evolution 8:2632–2650.https://doi.org/10.1093/gbe/evw192
-
A stingless bee uses labial gland secretions for scent trail communication ( Trigona recursa smith 1863)Journal of Comparative Physiology A: Sensory, Neural, and Behavioral Physiology 190:233–239.https://doi.org/10.1007/s00359-003-0489-9
-
Hexyl decanoate, the first trail pheromone compound identified in a stingless bee, trigona recursaJournal of Chemical Ecology 32:1555–1564.https://doi.org/10.1007/s10886-006-9069-0
-
The fatty acyl-CoA reductase waterproof mediates airway clearance in DrosophilaDevelopmental Biology 385:23–31.https://doi.org/10.1016/j.ydbio.2013.10.022
-
Lineage-specific gene expansions in bacterial and archaeal genomesGenome Research 11:555–565.https://doi.org/10.1101/gr.GR-1660R
-
Orthologs, paralogs, and evolutionary genomicsAnnual Review of Genetics 39:309–338.https://doi.org/10.1146/annurev.genet.39.073003.114725
-
Volatile components of the cephalic marking secretion of male bumble beesActa Chemica Scandinavica 24:1481–1483.https://doi.org/10.3891/acta.chem.scand.24-1481
-
Observations on scent marking by bombus Latr. and Psithyrus Lep. males (Hym. Apidae) and localization of site of production of the secretionZoon 1:23–30.
-
Fast gapped-read alignment with bowtie 2Nature Methods 9:357–359.https://doi.org/10.1038/nmeth.1923
-
CDD: ncbi's conserved domain databaseNucleic Acids Research 43:D222–D226.https://doi.org/10.1093/nar/gku1221
-
A delta9 desaturase from bombus lucorum males: investigation of the biosynthetic pathway of marking pheromonesChembiochem : A European Journal of Chemical Biology 9:2534–2541.https://doi.org/10.1002/cbic.200800374
-
Characterization of acyl-CoA-binding protein (ACBP) in the pheromone gland of the silkworm, bombyx moriInsect Biochemistry and Molecular Biology 31:603–609.https://doi.org/10.1016/S0965-1748(00)00165-X
-
Ultrafast approximation for phylogenetic bootstrapMolecular Biology and Evolution 30:1188–1195.https://doi.org/10.1093/molbev/mst024
-
Mapping and quantifying mammalian transcriptomes by RNA-SeqNature Methods 5:621–628.https://doi.org/10.1038/nmeth.1226
-
Plasmalogens: biosynthesis and functionsProgress in Lipid Research 40:199–229.https://doi.org/10.1016/S0163-7827(01)00003-0
-
Evolutionary dynamics of olfactory and other chemosensory receptor genes in vertebratesJournal of Human Genetics 51:505–517.https://doi.org/10.1007/s10038-006-0391-8
-
Evolutionary history of the hymenopteraCurrent Biology 27:1013–1018.https://doi.org/10.1016/j.cub.2017.01.027
-
Inactive enzyme-homologues find new function in regulatory processesJournal of Molecular Biology 340:399–404.https://doi.org/10.1016/j.jmb.2004.04.063
-
Mechanisms of gene duplication and amplificationCold Spring Harbor Perspectives in Biology 7:a016592.https://doi.org/10.1101/cshperspect.a016592
-
The genome and methylome of a subsocial small carpenter bee, ceratina calcarataGenome Biology and Evolution 8:1401–1410.https://doi.org/10.1093/gbe/evw079
-
Large gene family expansion and variable selective pressures for cathepsin B in aphidsMolecular Biology and Evolution 25:5–17.https://doi.org/10.1093/molbev/msm222
-
Age-dependent changes in structure and function of the male labial gland in Bombus terrestrisJournal of Insect Physiology 54:204–214.https://doi.org/10.1016/j.jinsphys.2007.09.003
-
A fatty acyl-CoA reductase highly expressed in the head of honey bee (apis mellifera) involves biosynthesis of a wide range of aliphatic fatty alcoholsInsect Biochemistry and Molecular Biology 40:641–649.https://doi.org/10.1016/j.ibmb.2010.06.004
-
Insect pheromones--an overview of biosynthesis and endocrine regulationInsect Biochemistry and Molecular Biology 29:481–514.https://doi.org/10.1016/S0965-1748(99)00016-8
-
Identification of a pheromone blend attractive toManduca sexta (L.) males in a wind tunnelArchives of Insect Biochemistry and Physiology 10:255–271.https://doi.org/10.1002/arch.940100402
-
Biotechnological potential of insect fatty acid-modifying enzymesZeitschrift Für Naturforschung C 72:387–403.https://doi.org/10.1515/znc-2017-0031
-
Chemotaxonomical characterisation of males bombus lucorum (Hymenptera: apidae) collected in czech republicEuropean Journal of Entomology 127:111–115.https://doi.org/10.14411/eje.2001.017
-
Evolution by gene duplication: an updateTrends in Ecology & Evolution 18:292–298.https://doi.org/10.1016/S0169-5347(03)00033-8
Article and author information
Author details
Funding
Czech Science Foundation (15-06569S)
- Michal Tupec
- Aleš Buček
- Jiří Kindl
- Irena Valterová
Ministerstvo skolstvi, mladeze a telovychovy CR (NPU LO 1302)
- Michal Tupec
- Aleš Buček
- Petra Wenzelová
- Iva Pichová
The funders had no role in study design, data collection and interpretation, or the decision to submit the work for publication.
Acknowledgements
This work was supported by the Czech Science Foundation (grant no. 15–06569S) and by the Ministry of Education of the Czech Republic (project n. LO1302). Computational resources were provided by the CESNET LM2015042 and the CERIT Scientific Cloud LM2015085, provided under the program ‘Projects of Large Research, Development, and Innovations Infrastructures’ and by the Okinawa Institute of Science and Technology. MT was supported by Charles University in Prague (project n. SVV260427/2018). We thank Dr. Stefan Jarau for stimulating discussions. We also thank Prof. Baldwyn Torto and two anonymous reviewers for their constructive comments and suggestions.
Copyright
© 2019, Tupec et al.
This article is distributed under the terms of the Creative Commons Attribution License, which permits unrestricted use and redistribution provided that the original author and source are credited.
Metrics
-
- 1,668
- views
-
- 234
- downloads
-
- 33
- citations
Views, downloads and citations are aggregated across all versions of this paper published by eLife.
Citations by DOI
-
- 33
- citations for umbrella DOI https://doi.org/10.7554/eLife.39231
Download links
A two-part list of links to download the article, or parts of the article, in various formats.
Downloads (link to download the article as PDF)
Open citations (links to open the citations from this article in various online reference manager services)
Cite this article (links to download the citations from this article in formats compatible with various reference manager tools)
Expansion of the fatty acyl reductase gene family shaped pheromone communication in Hymenoptera
eLife 8:e39231.
https://doi.org/10.7554/eLife.39231


