Quantitative analysis of auxin sensing in leaf primordia argues against proposed role in regulating leaf dorsoventrality
- University of Sydney, Australia
- Sainsbury Laboratory, University of Cambridge, United Kingdom
- University of Cambridge, United Kingdom
- Lund University, Sweden
Figures
Figure 1
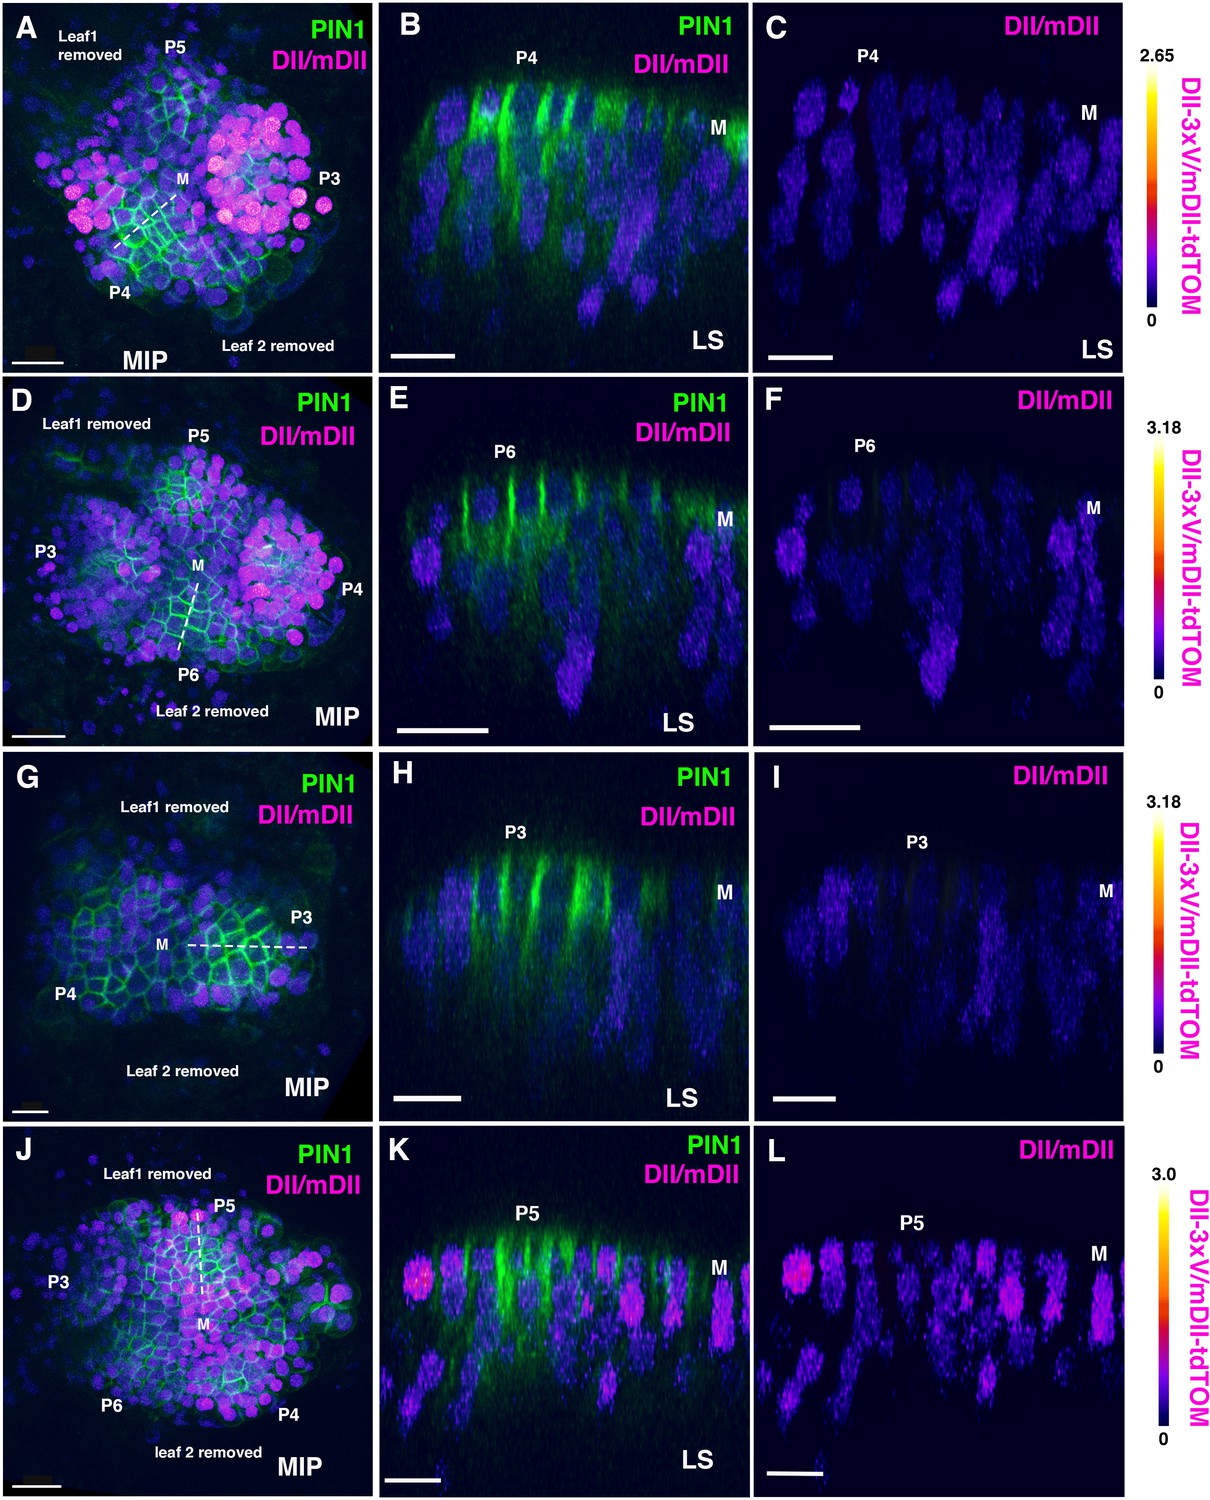
Distribution of DII/mDII ratio intensities in incipient leaf primordia (third, fourth or fifth).
(A, D, G, J) Confocal projections of Arabidopsis seedlings aged 4 or 5 DAS (days after stratification) showing DII/mDII ratio intensity distributions (magenta) along with PIN1-GFP (green) in third, fourth or fifth leaves. (B–C, E–F, H–I, K–L) Corresponding median longitudinal optical sections of incipient primordia along the dashed lines in (A,D,G,J) showing DII/mDII ratio intensity distributions (magenta) along with PIN1-GFP (green) (B, E, H, K) and DII/mDII ratio intensity distributions only (magenta) (C, F, I, L) . Primordia are numbered starting oldest (P3) to youngest (P6). Scale bars 20 μm (B and D), 15 μm (A, C, and F-H) and 10 μm (E). M marks the meristem.
Figure 2 with 3 supplements
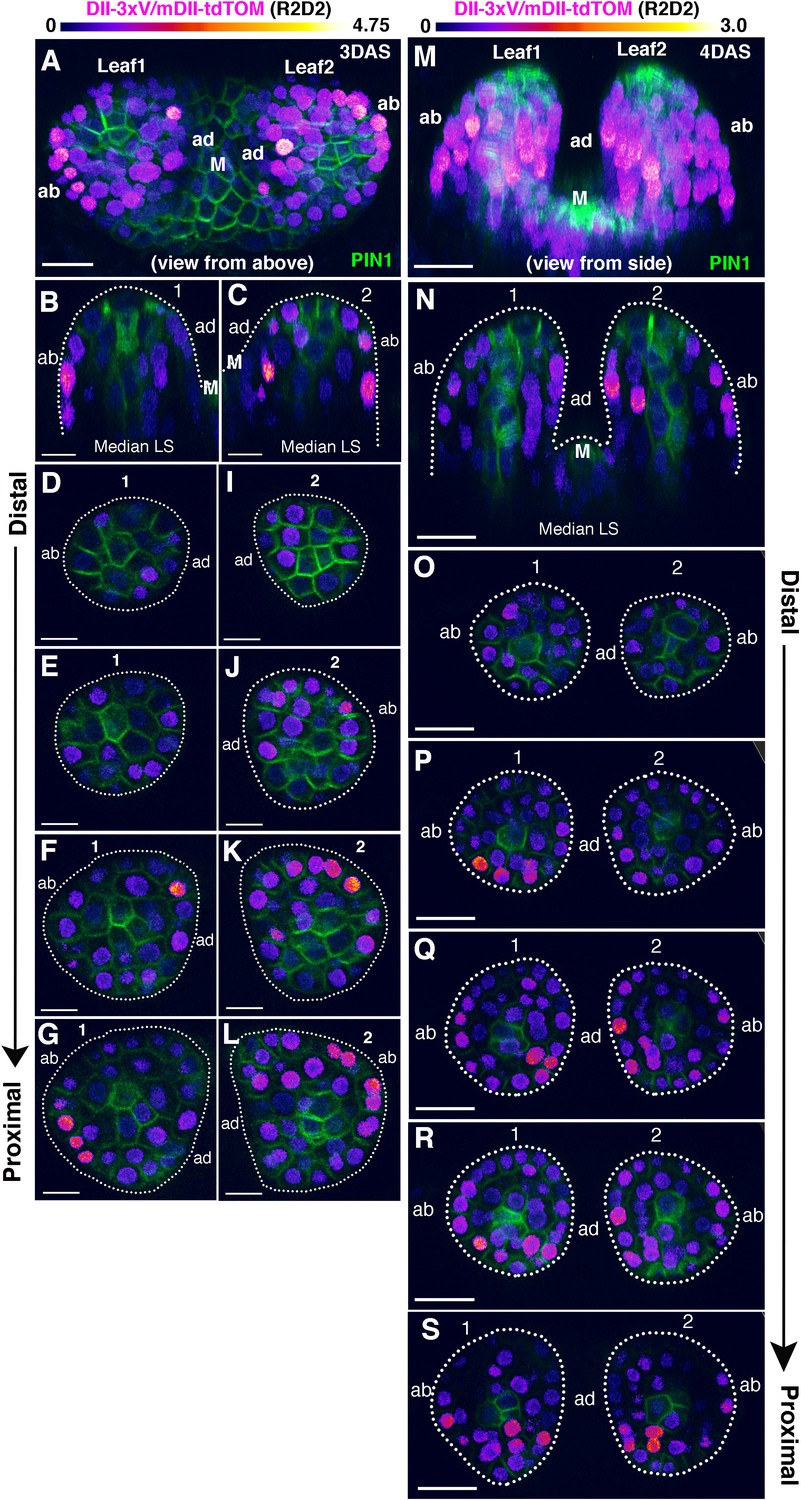
Distribution of DII/mDII ratio intensities within initiating leaf primordia (first and second).
(A and M) Confocal projections of Arabidopsis seedlings aged 3 and 4 DAS (days after stratification) showing DII/mDII ratio intensity distributions (magenta) along with PIN1-GFP expression (green) in the first two leaves. (B, C, N) Corresponding median longitudinal optical sections of first two leaves in (A) (B and C) and in (M) (N). Note no obvious asymmetry in DII/mDII ratio intensities on the adaxial vs abaxial sides of the leaves at 3DAS or 4DAS. (D–L) Optical reconstructions of cross-sections of leaves in (A) along the distal (D) to proximal axis (L). (O–S) Optical reconstructions of cross-sections of leaves in (M) along the distal (O) to proximal axis (S). Note variability in DII/mDII ratio intensities h associated with nuclei within the adaxial and abaxial domains of individual leaves. Scale bars 15 μm (A), 10 μm(B-L), 20 μm (M–S). M marks the meristem.
Figure 2—figure supplement 1

Additional examples of 3DAS old seedlings showing Distribution of DII/mDII ratio intensities within initiating leaf primordia (first and second).
(A, F, L) Confocal projections (view from above) of Arabidopsis seedlings aged 3 DAS showing DII/mDII ratio intensity distributions (magenta) along with PIN1-GFP expression (green) in the first two leaves. (B, G, M) Corresponding median longitudinal optical sections of first two leaves in (A), (F) and (L) respectively. (C–E) Optical reconstructions of cross-sections of leaves in (A) along the distal to proximal axis. (H–K) Optical reconstructions of cross-sections of leaves in (F) along the distal to proximal axis. (N–P) Optical reconstructions of cross-sections of leaves in (L) along the distal to proximal axis. Note variability in DII/mDII ratio intensities associated with nuclei within the adaxial and abaxial domains of individual leaves. Scale bars 20 μm (A, F, L,G, M–P), 15 μm(B-E), (H–K). M marks the meristem.
Figure 2—figure supplement 2
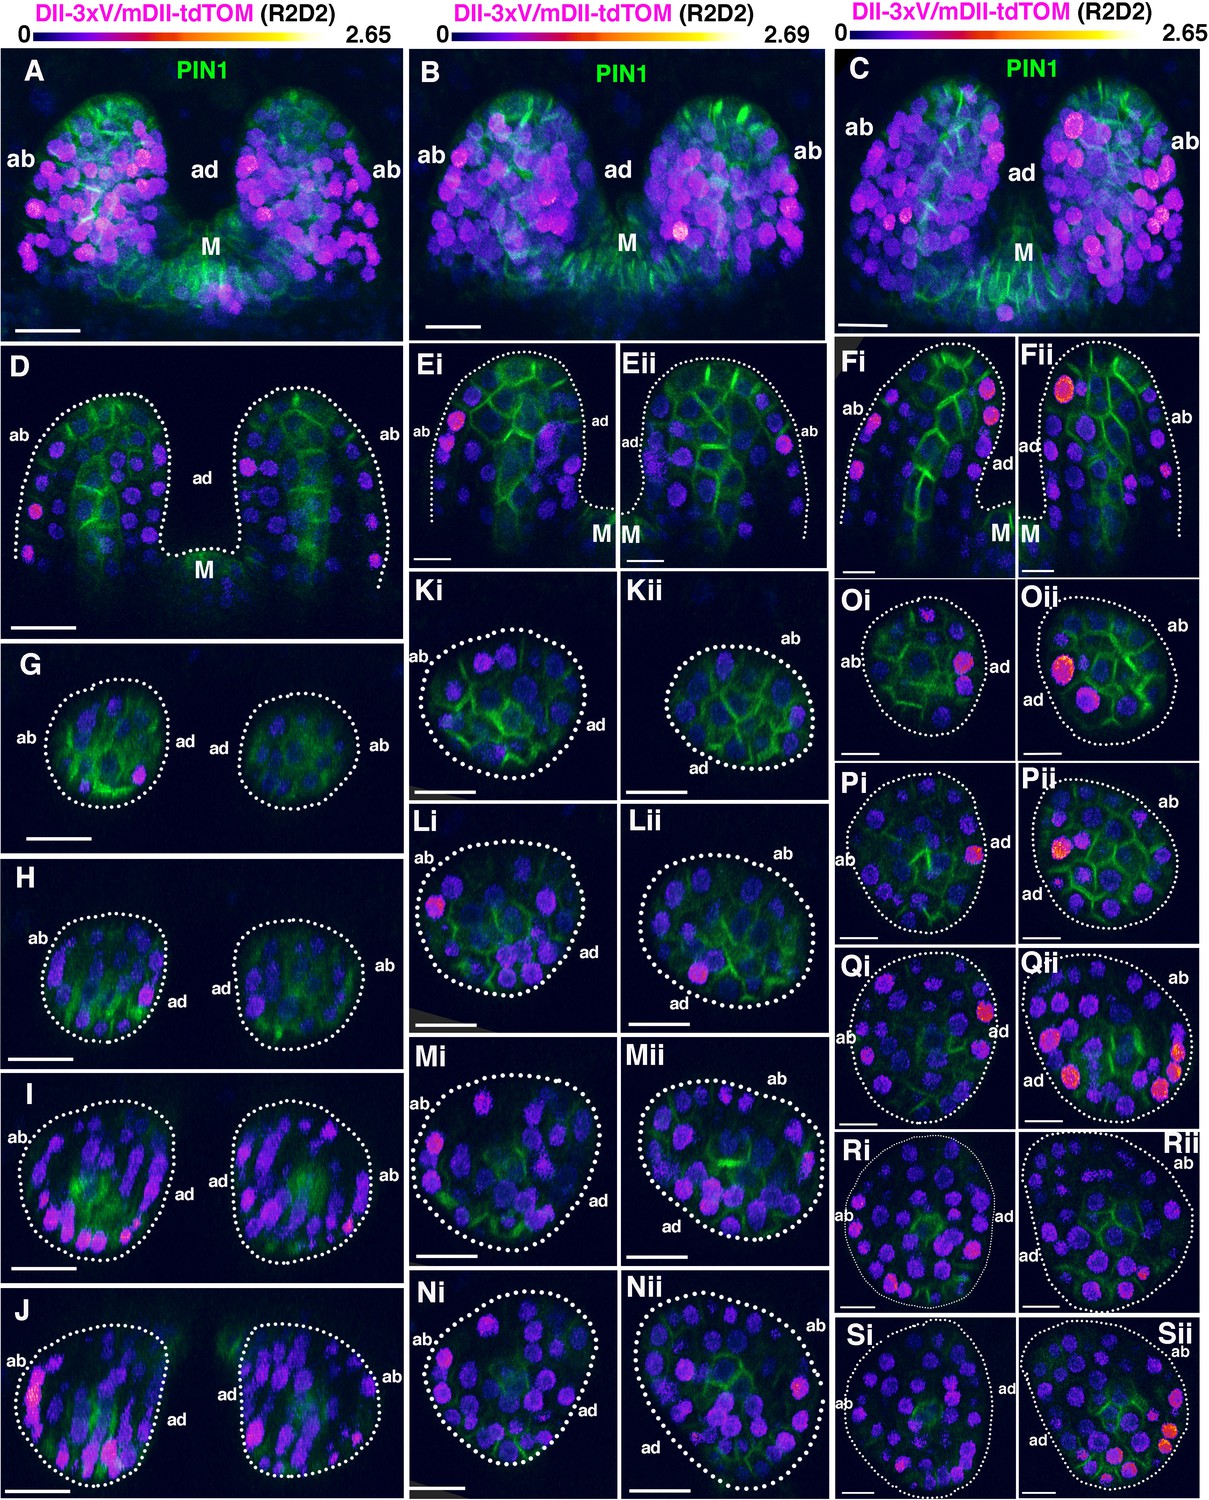
Additional examples of 4DAS old seedlings showing the distribution of DII/mDII ratio intensities within initiating leaf primordia (first and second).
(A–C) Confocal projections (view from side) of Arabidopsis seedlings aged 4DAS showing DII/mDII ratio intensitiy distributions (magenta) along with PIN1-GFP expression (green) in first two leaves. (D, Ei-Eii and Fi-Fii) Corresponding median longitudinal optical sections of first two leaves in (A), (B) and (C) respectively. (G-J) Optical reconstructions of cross sections of leaves in (A) along the distal to proximal axis. (Ki-Nii) Optical reconstructions of cross-sections of leaves in (B) along the distal to proximal axis. (Oi-Sii) Optical reconstructions of cross-sections of leaves in (C) along the distal to proximal axis. Note variability in DII/mDII ratio intensities ass-ociated with nuclei within the adaxial and abaxial domains of individual leaves. Scale bars 20 μm (A, D, G–J), 15 μm(B, (C, K–N), 10 μm (E, F, O–S). M marks the meristem.
Figure 2—figure supplement 3
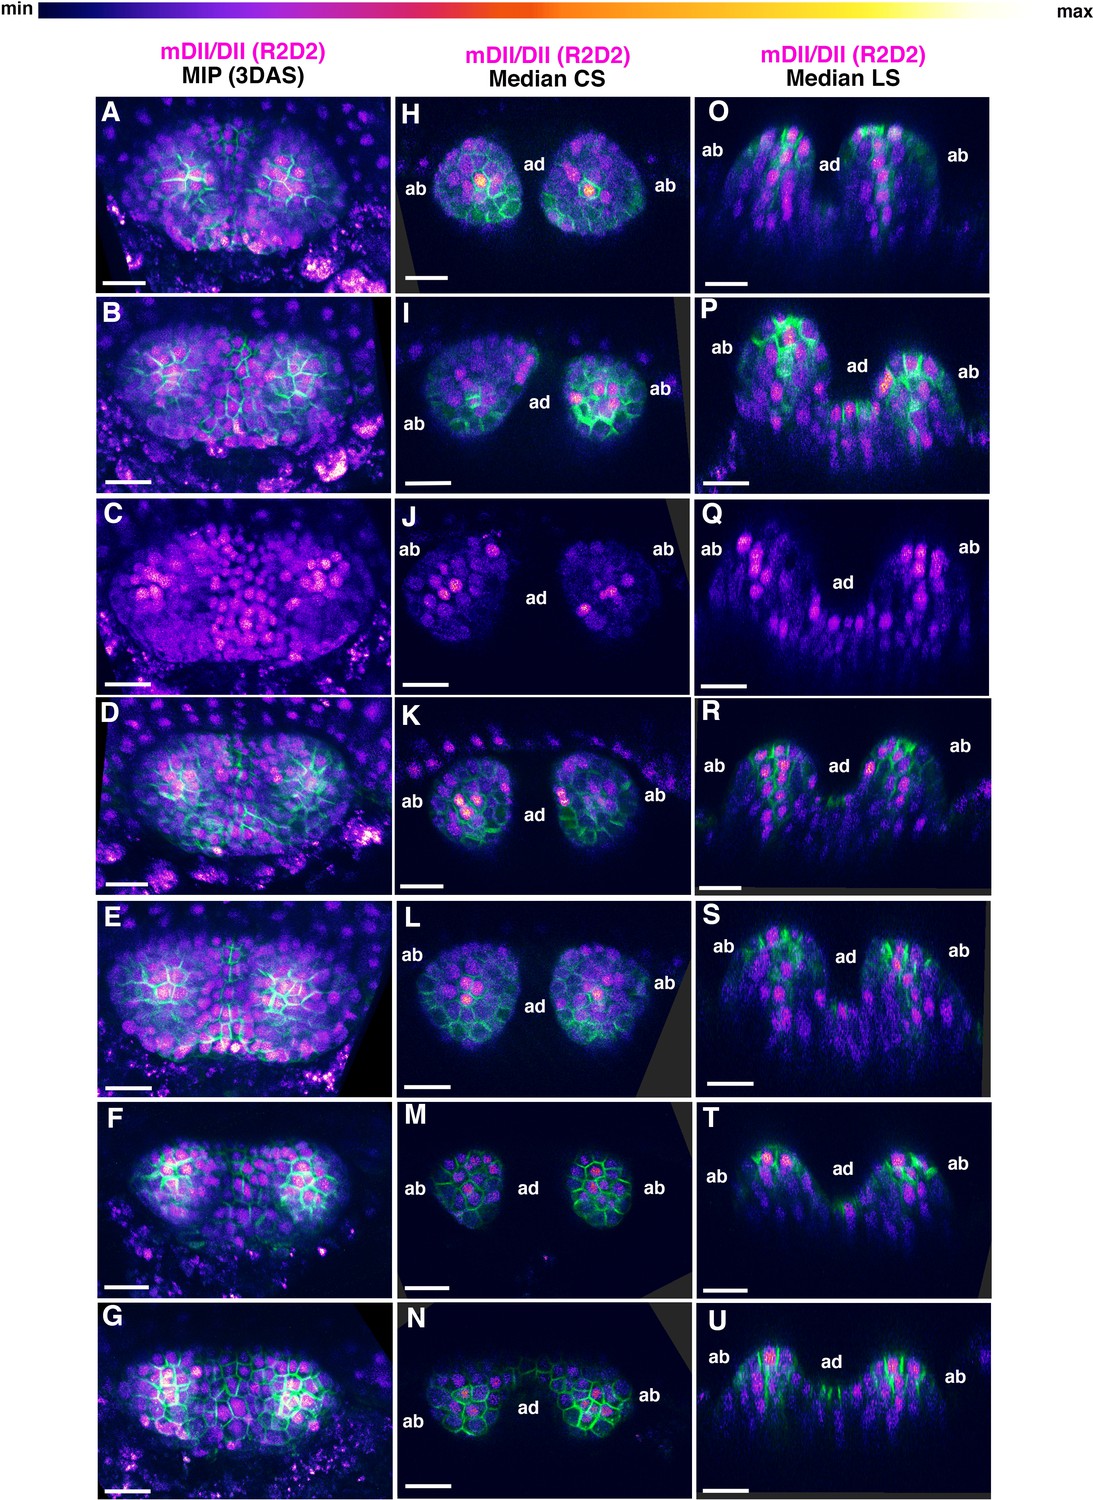
Examples of mDII/DII ratio intensity distributions in the first two leaves of 3DAS old Arabidopsis seedlings.
(A–G) Confocal projections of Arabidopsis seedlings aged 3DAS (days after stratification) showing mDII/DII ratio intensity distributions (magenta) along with PIN1-GFP expression (green). (H–N) Median transverse optical sections of (A–G). (O–U) Median longitudinal optical sections of (A–G). Scale bars 20 μm (A–U).
Figure 3 with 1 supplement

Quantification of DII/mDII ratio intensities within the nuclei of the first two leaves in 4DAS old seedlings.
(A) Representative example of adaxial and abaxial volume estimation and cropping. Snapshot of a single optical slice from a z stack of 4DAS old seedlings showing manual demarcation of adaxial and abaxial cells for cropping (yellow outlines) along the domain of PIN1-GFP expression (gray) in the vasculature. (B) Example of resulting nuclear categorisation after cropping, grouped by abaxial (blue), adaxial (yellow), and discarded tissue (magenta). (C–E) Quantification steps in 3D nuclei, illustrating the initial signal (C), subsequent nuclear segmentation (D), and the resulting DII/mDII ratio within the nuclear volumes (E). (F and G) Violin plots of the distributions of the ratios of mean expressions for abaxial and adaxial nuclei after quality filtering, per seedling and all data pooled together. Jitters show the individual data points (F), and internal boxplots the median values and distribution quartiles, with whiskers extending to 1.5 times the interquartile range (IQR) (G). (H) Ranked ratio Area Under the Curve (AUC) plot and score for the distributions. Abaxial n = 1475, adaxial n = 2006, accumulated over 10 seedlings (20 leaves). Distribution values are given as the ratio of normalised mean DII-3xVENUS-N7 over mean mDII- tdTomato (R2D2) expression within the segmented nuclear volumes.
Figure 3—figure supplement 1
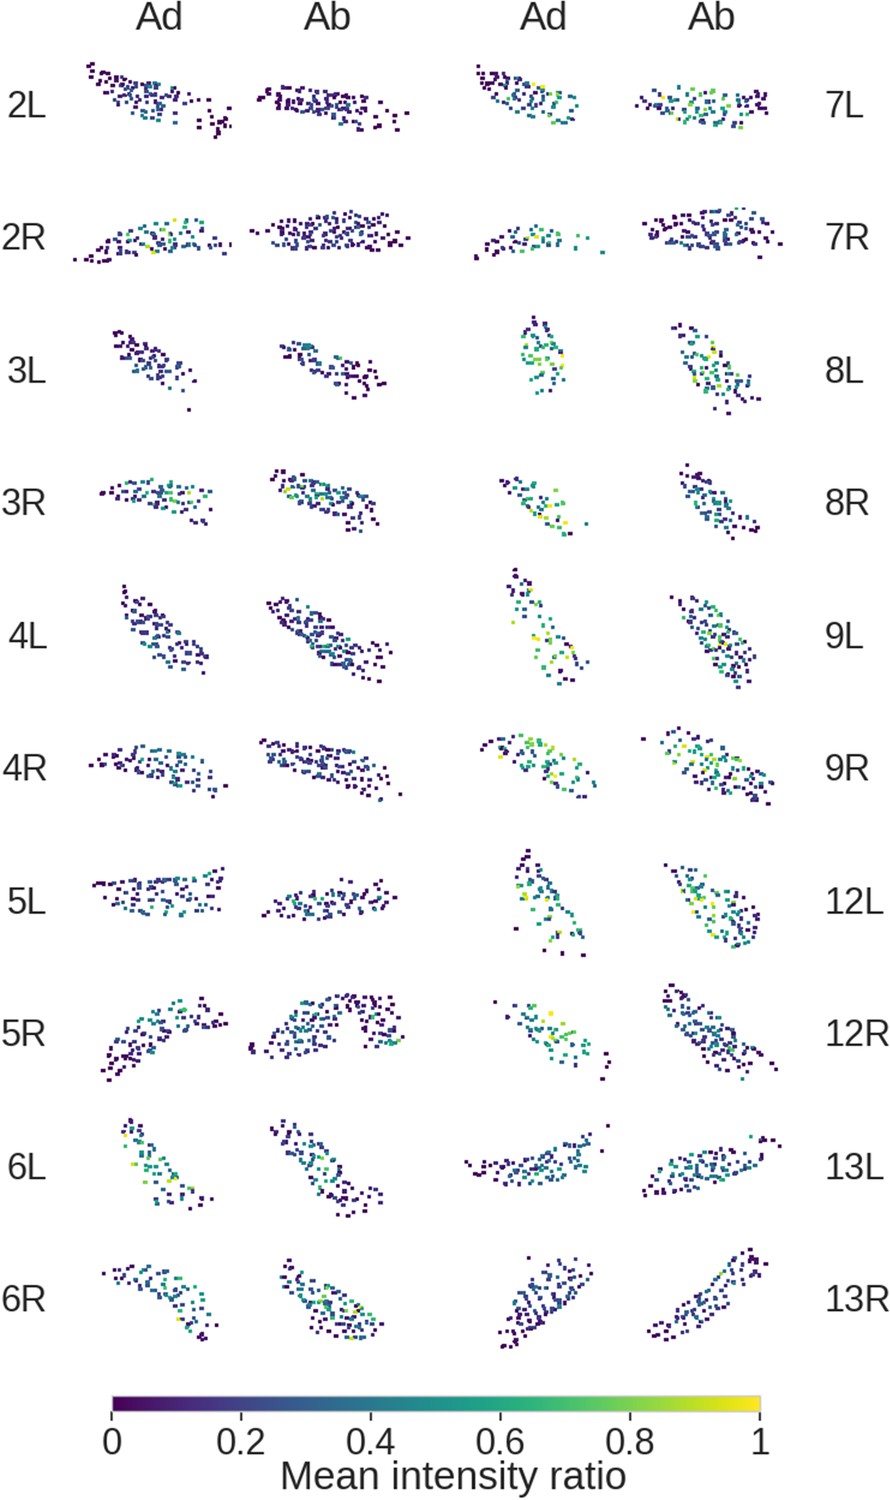
- Spatial distributions of negative auxin readout Maximal Z-projection of segmented nuclear centroids for 10 seedlings (20 leaves) at 4DAS, coloured by signal ratio after filtering.
Centroids are shown as 5 × 5 pixel squares. Integers indicate corresponding seedling. L, Left leaf. R, Right leaf. Ad, axaxial; Ab, abaxial.
Figure 4 with 4 supplements
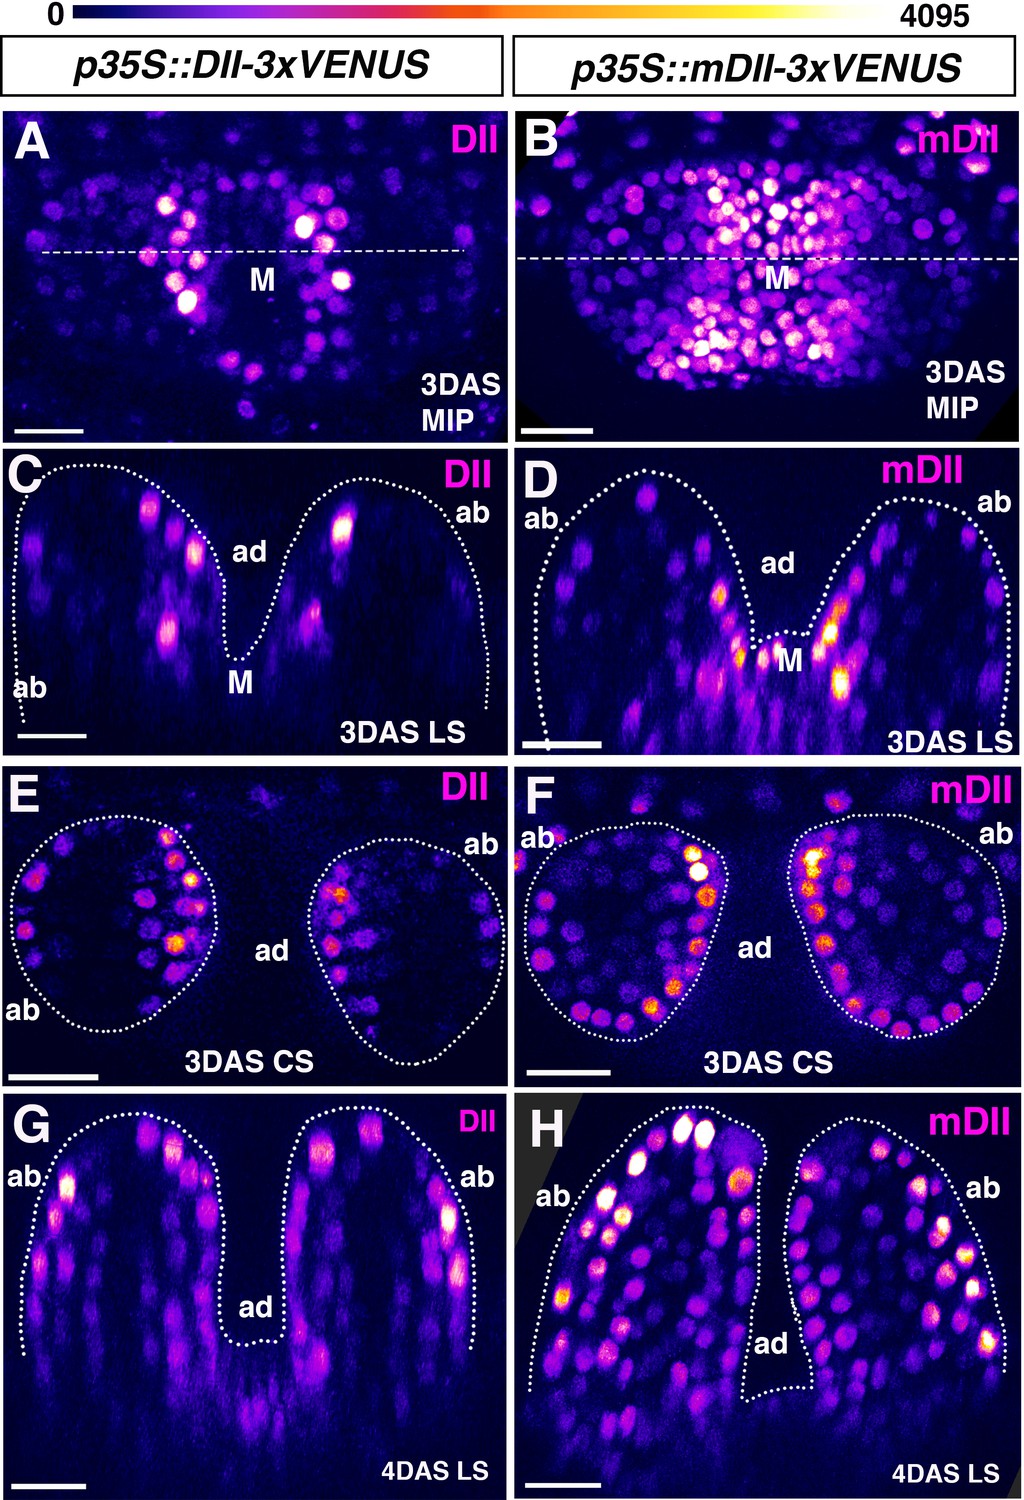
Signal intensity distribution in young leaves generated by p35S driven auxin sensor and control.
(A and B) Confocal projections of Arabidopsis seedlings aged 3DAS (days after stratification) showing expression pattern of p35S::DII-VENUS (magenta) (A) and p35S::mutatedDII-VENUS (mDII, magenta) (B). (C and D) Longitudinal reconstructed optical sections of (A and B), respectively, along the dashed lines. (E and F) Representative examples of transverse reconstructed optical sections of 3DAS Arabidopsis seedlings showing DII-VENUS expression (E) and mDII-VENUS expression (F). DII-VENUS is more strongly expressed adaxially indicating low auxin sensing on the adaxial side of the leaves relative to the abaxial side. However, mDII-VENUS also shows high expression on the adaxial side of the leaf (compare E with F) and in the shoot meristem. (G and H) Representative examples of longitudinal reconstructed optical sections of 4DAS Arabidopsis seedlings showing DII-VENUS expression (G) and mDII-VENUS expression (H). At this stage, the DII-VENUS shows a more uniform expression and absence of expression in the vasculature. mDII-VENUS also shows a similar pattern to DII but is also expressed in the vasculature (H). Scale bars 15 μm (A and C) 20 μm B, (D, E–H). Figure Supplements.
Figure 4—figure supplement 1
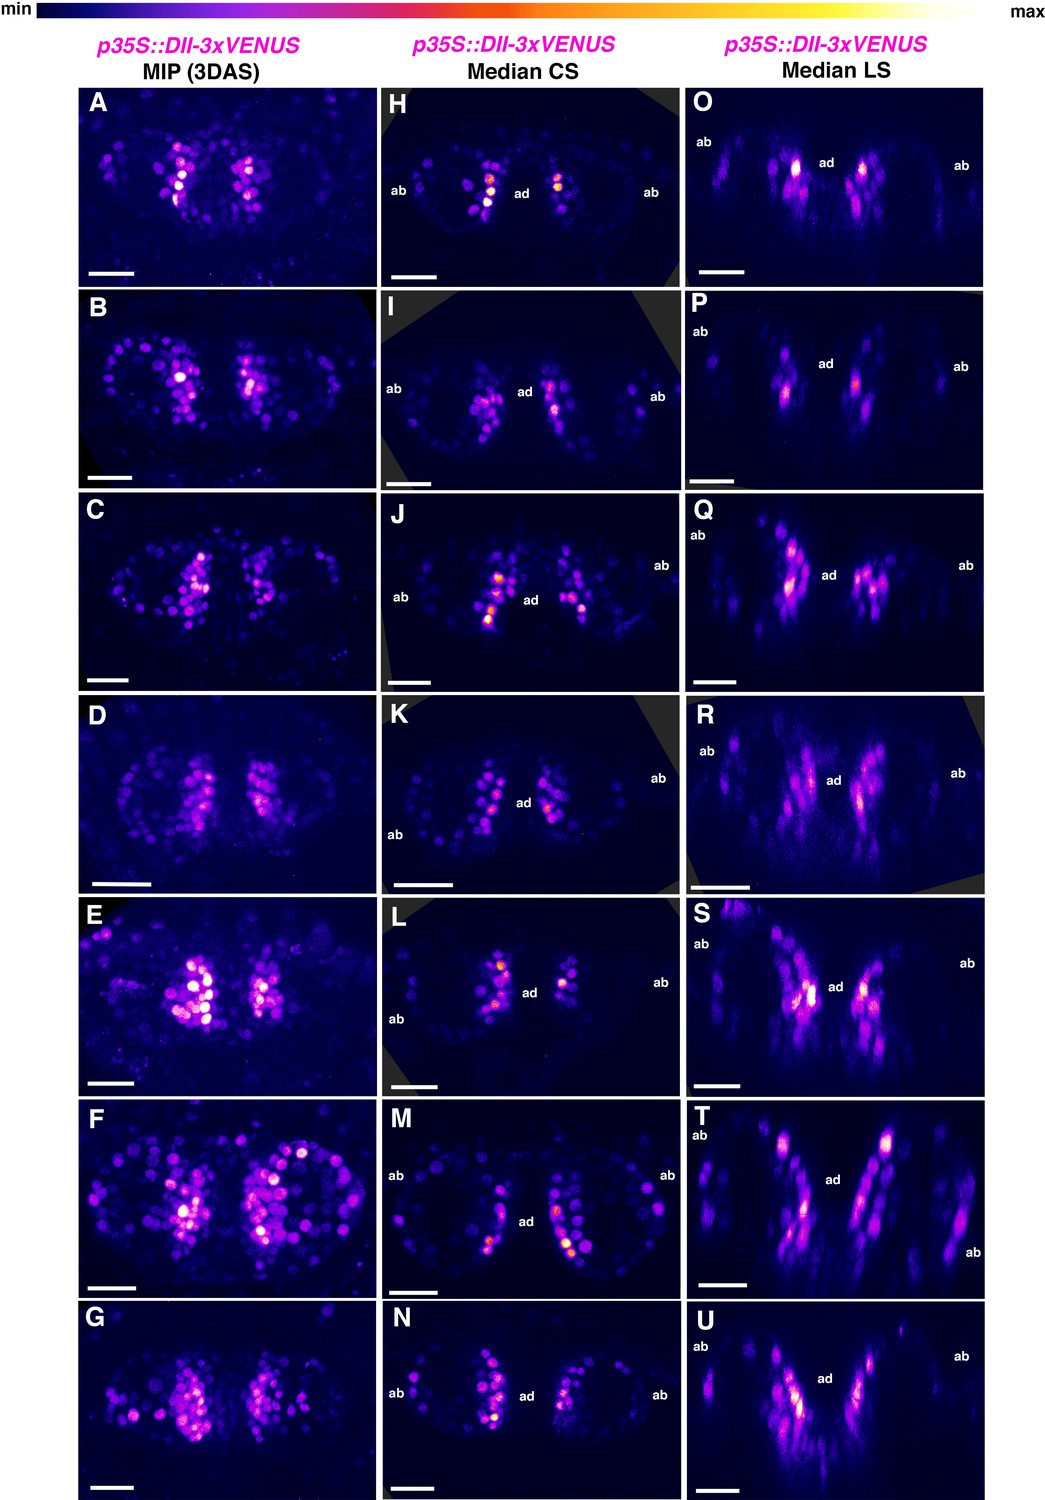
Additional examples p35S::DII-3xVENUS-N7 expression in 3DAS old Arabidopsis seedlings.
(A–G) Confocal projections of Arabidopsis seedlings aged 3DAS (days after stratification) showing expression pattern of p35s::DII-3xVENUS-N7 sensor (magenta). (H–N) Median transverse optical sections of (A–G). (O–U) Median longitudinal optical sections of (A–G). Scale bars 20 μm (A–U).
Figure 4—figure supplement 2
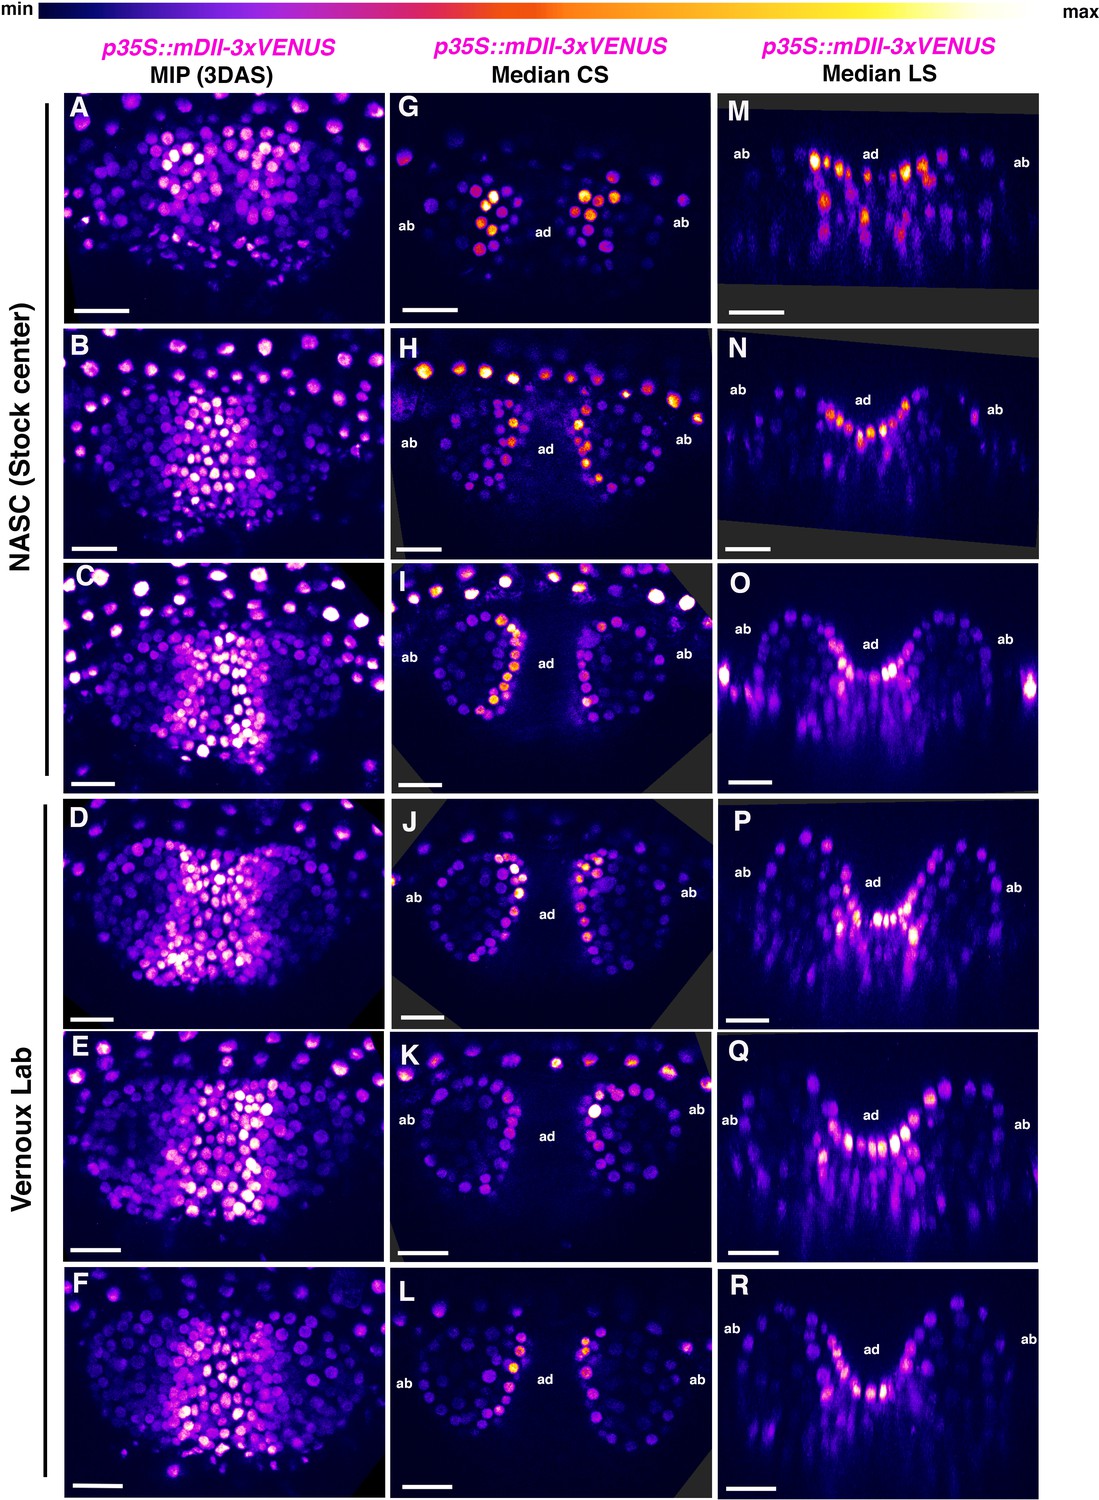
Additional examples of p35S::mDII-3xVENUS-N7 expression in 3DAS old Arabidopsis seedlings.
(A–F) Confocal projections of Arabidopsis seedlings aged 3DAS (days after stratification) showing expression pattern of p35S::mDII-3xVENUS-N7 sensor (magenta). Note that plants generated from two different seed sources showed similar expression patterns. (G–L) Median transverse optical sections of (A–F). (M–R) Median longitudinal optical sections of (A–G). Scale bars 20 μm (A–R).
Figure 4—figure supplement 3
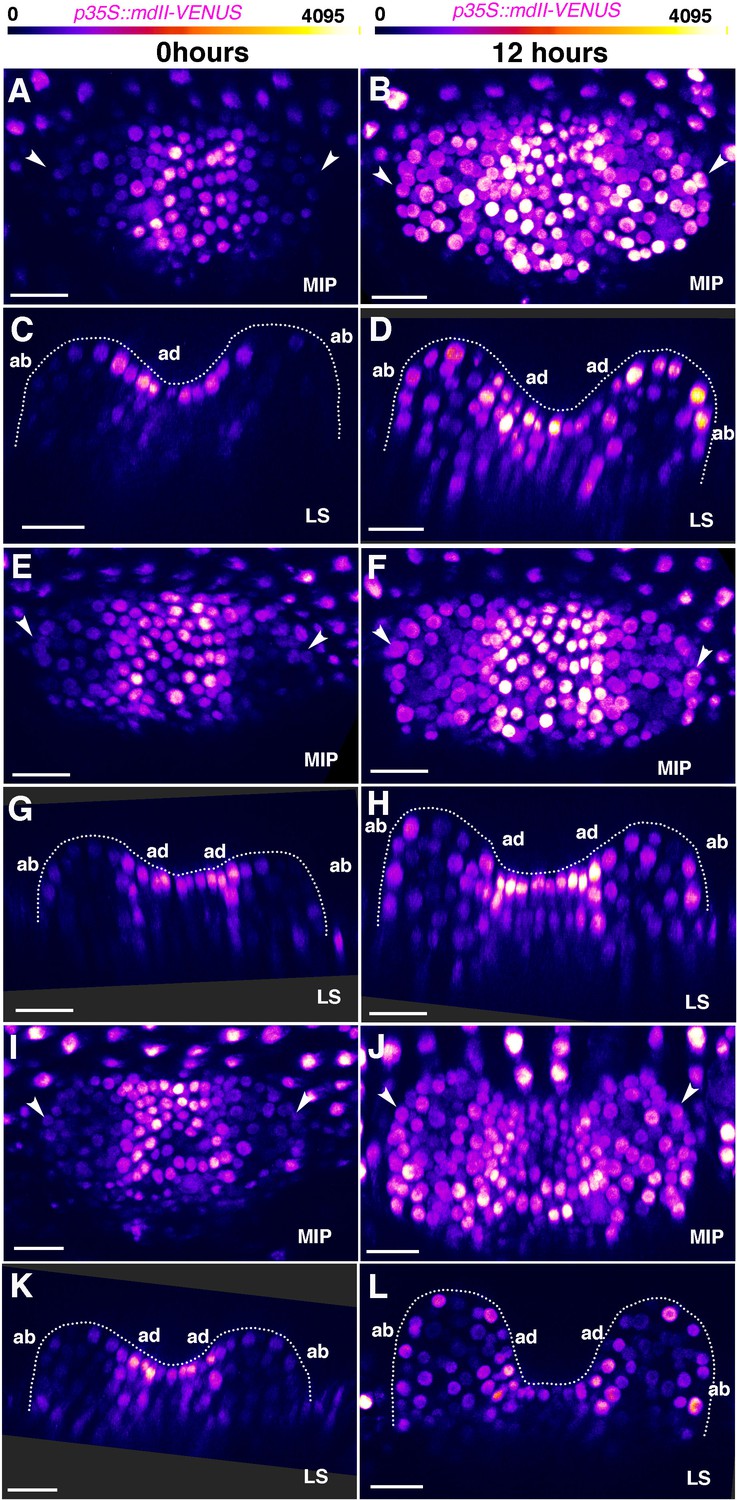
Changes in p35S::mDII-V expression in young leaves over 12 hours.
(A, E, I) Confocal projections of seedlings 3DAS showing expression pattern of p35S::mDII-V (magenta) within the first two leaves at 0 hr. (C, G, K) Longitudinal optical sections of (A), (E), (I) respectively. Note relatively weak mDII expression on the abaxial side of the leaves than the adaxial side (also arrowheads in (A), (E), (I)). (B, F, J) Confocal projections of seedlings in (A, E, I) respectively showing expression pattern of p35S::mDII-V (magenta) within the first two leaves at 12 hr. (D, H, L) Longitudinal optical sections of (B), (F), (J) respectively. Note appearance of increased mDII expression on the abaxial side of the leaf compared to 0 hr (also arrowheads in (B), (F), (J). (n = 20/20 leaves, 10 seedlings). Scale bars 20 μm (A–L).
Figure 4—figure supplement 4

Response of different auxin sensors to external auxin application.
(A–F) Confocal projections (A–C) and transverse optical reconstructions (D–F) of Arabidopsis seedlings, 3DAS, showing mDII/DII ratio intensity distributions (magenta) along with PIN1-GFP expression (green) (A,D), DII-VENUS sensor (magenta) (B,E) and mDII-VENUS sensor (magenta) (C, F) within the first two leaves before auxin application. (G–L) Confocal projections (G–I) and transverse optical reconstructions (J–L) of Arabidopsis seedlings, 3DAS, showing mDII/DII ratio intensities (magenta) along with PIN1-GFP expression (green) (G, J), DII-VENUS sensor (magenta) (H, K) and mDII-VENUS sensor (magenta) (I, L) 1 hr after the application of 5 mM NAA. Note, the high mDII/DII ratio intensity indicates an increased and broadening of auxin levels after NAA application (compare D and J) (n = 3/3 seedlings, six leaves). DII-VENUS shows an attenuated expression within 1 hr of auxin application (compare B,E with H,K) (n = 4/4 seedlings, eight leaves). mDII-VENUS levels do not decrease upon auxin application (compare C,F with I,L) (n = 4/4 seedlings, eight leaves). Scale bars 20 μm (A–L).
Additional files
-
Transparent reporting form
- https://doi.org/10.7554/eLife.39298.014
Download links
A two-part list of links to download the article, or parts of the article, in various formats.
Downloads (link to download the article as PDF)
Open citations (links to open the citations from this article in various online reference manager services)
Cite this article (links to download the citations from this article in formats compatible with various reference manager tools)
Quantitative analysis of auxin sensing in leaf primordia argues against proposed role in regulating leaf dorsoventrality
eLife 8:e39298.
https://doi.org/10.7554/eLife.39298


