Cryo-EM structure of the benzodiazepine-sensitive α1β1γ2S tri-heteromeric GABAA receptor in complex with GABA
- Oregon Health and Science University, United States
Figures
Figure 1 with 8 supplements
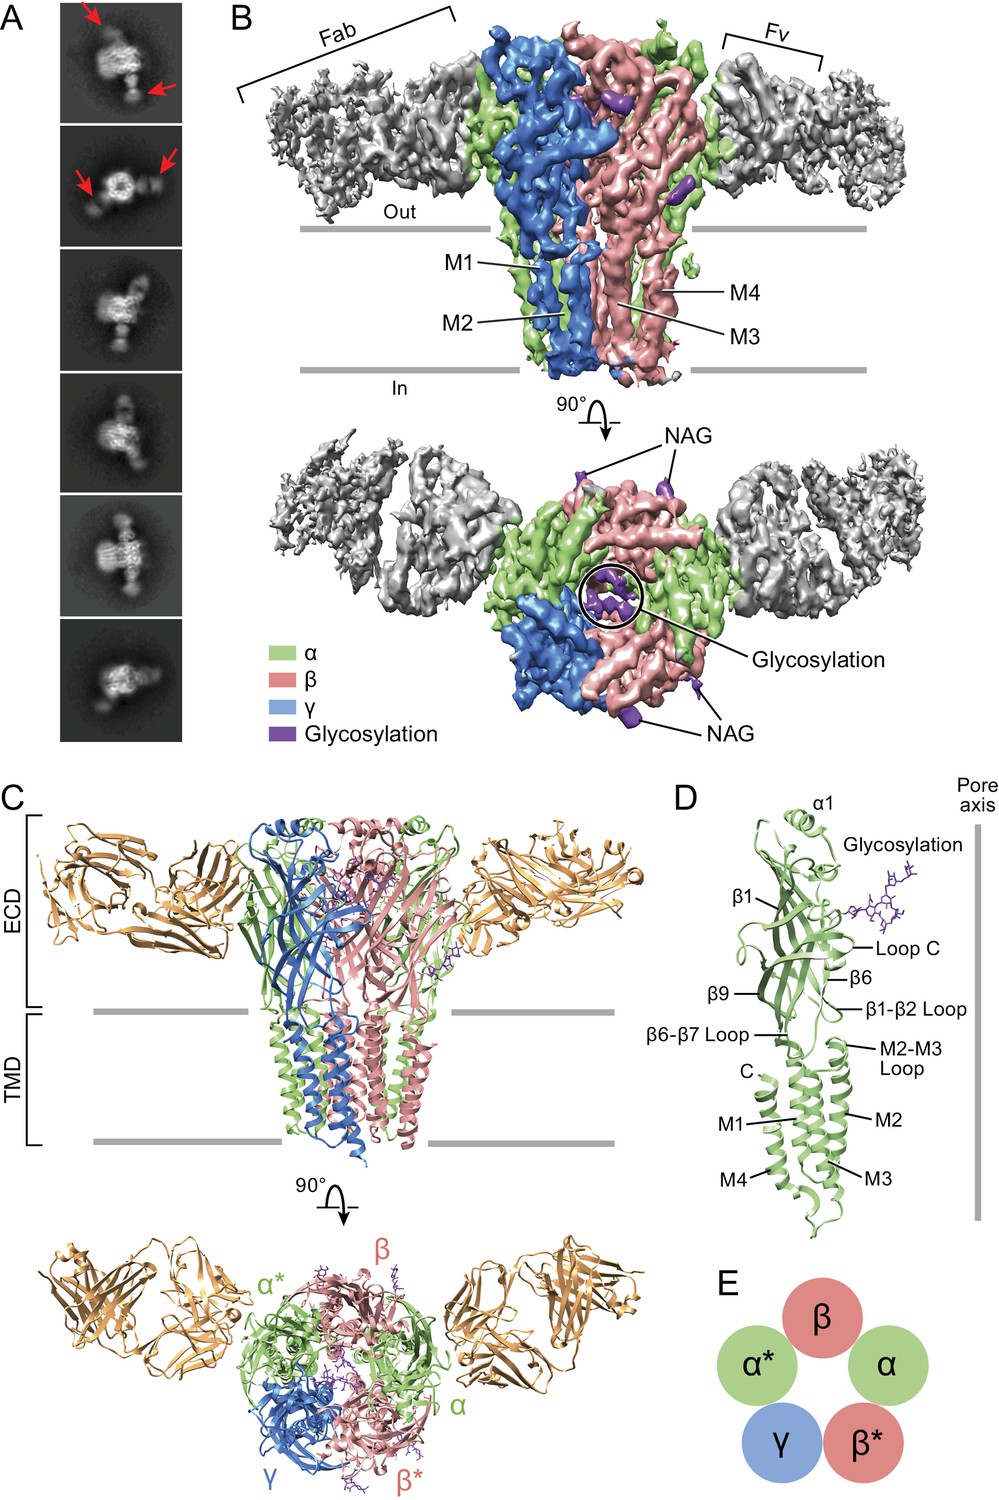
Architecture of the α1β1γ2SEM GABAA receptor.
(a) 2D class averages. Red arrows indicate 8E3 Fab bound to α subunits. (b) The cryo-EM map of the entire receptor viewed parallel to membrane plane. The α, β and γ subunits are colored by lime, salmon and marine, respectively. (c) Cartoon representation of the receptor viewed parallel to the membrane plane. The extracellular domain (ECD) and transmembrane domain (TMD) are indicated. (d) Cartoon representation of an α subunit. (e) Schematic representation of subunit arrangement, viewed from the extracellular side of the membrane.
Figure 1—figure supplement 1
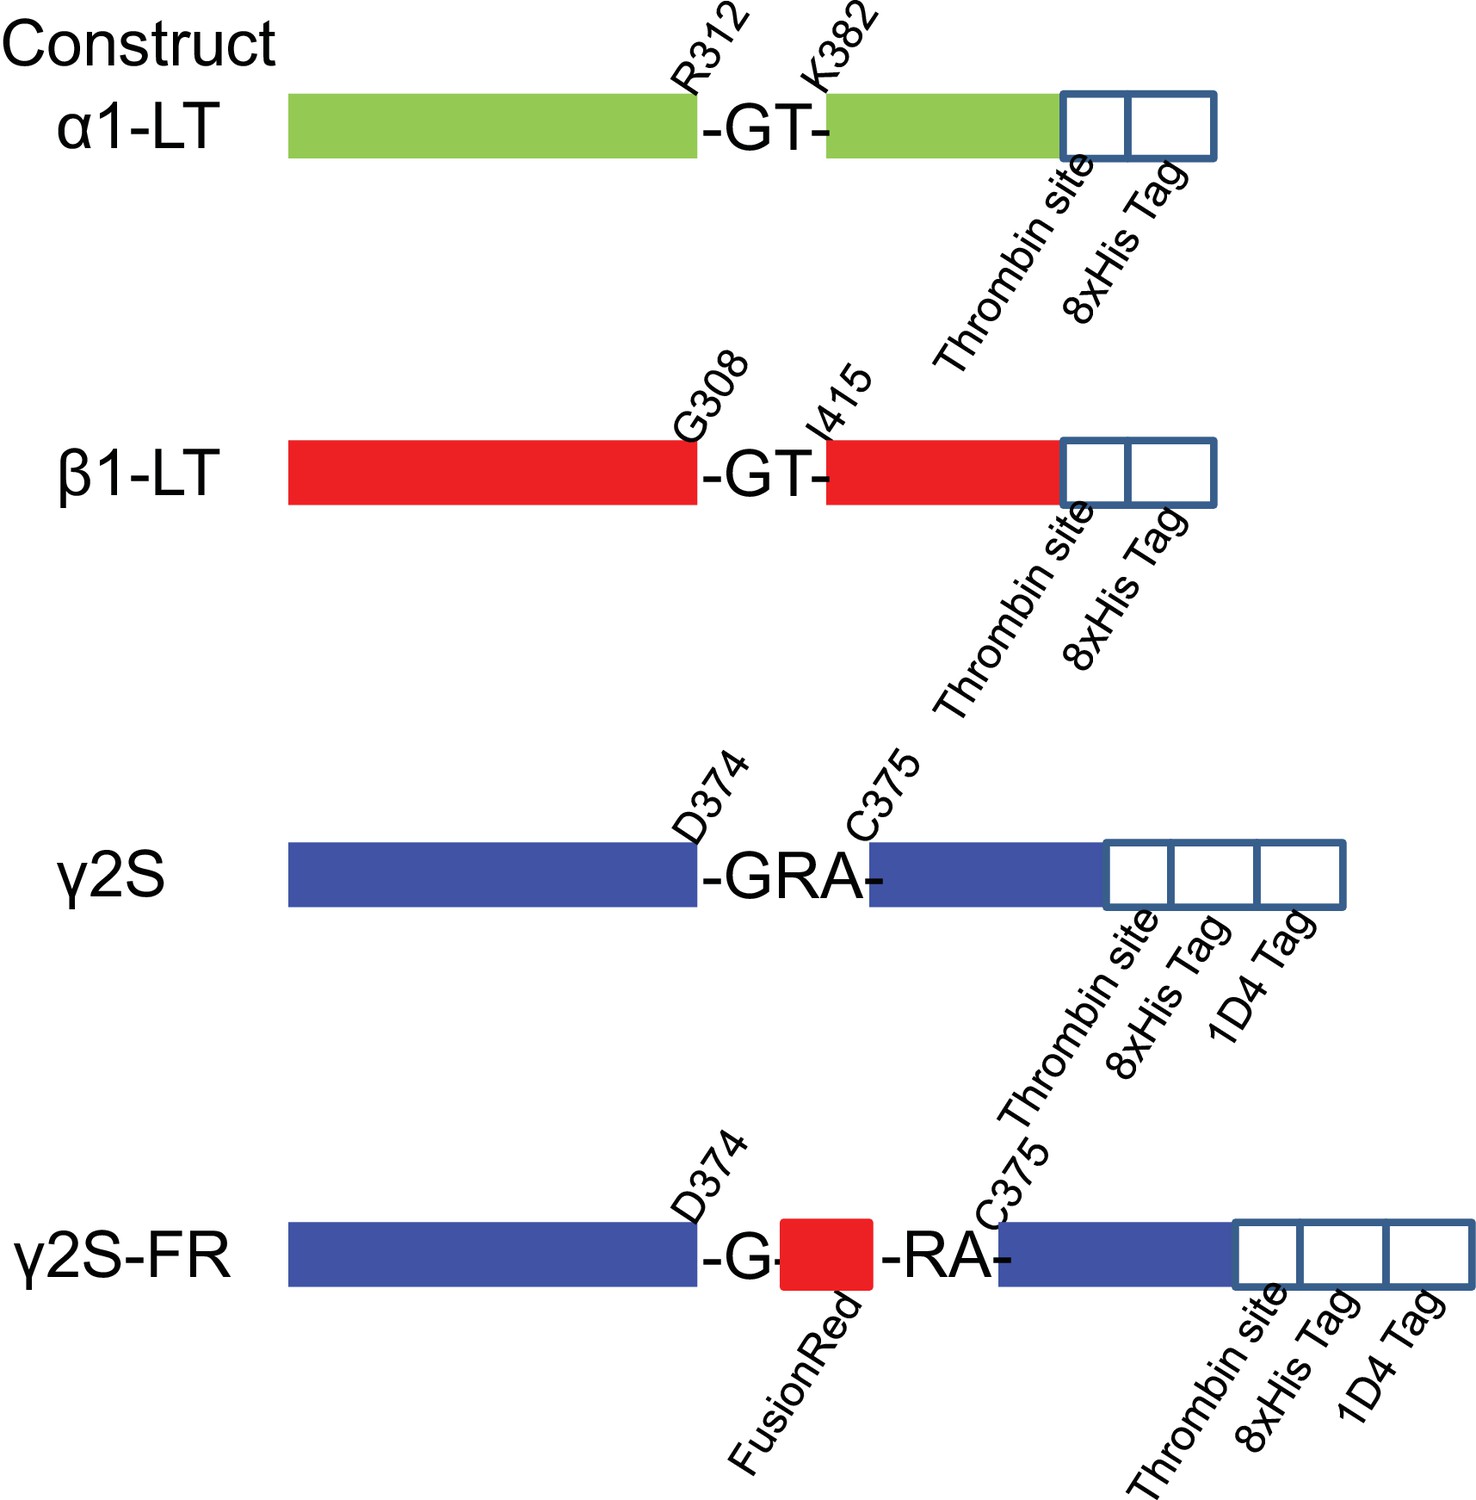
Schematics for the constructs used in this study.
https://doi.org/10.7554/eLife.39383.003
Figure 1—figure supplement 2
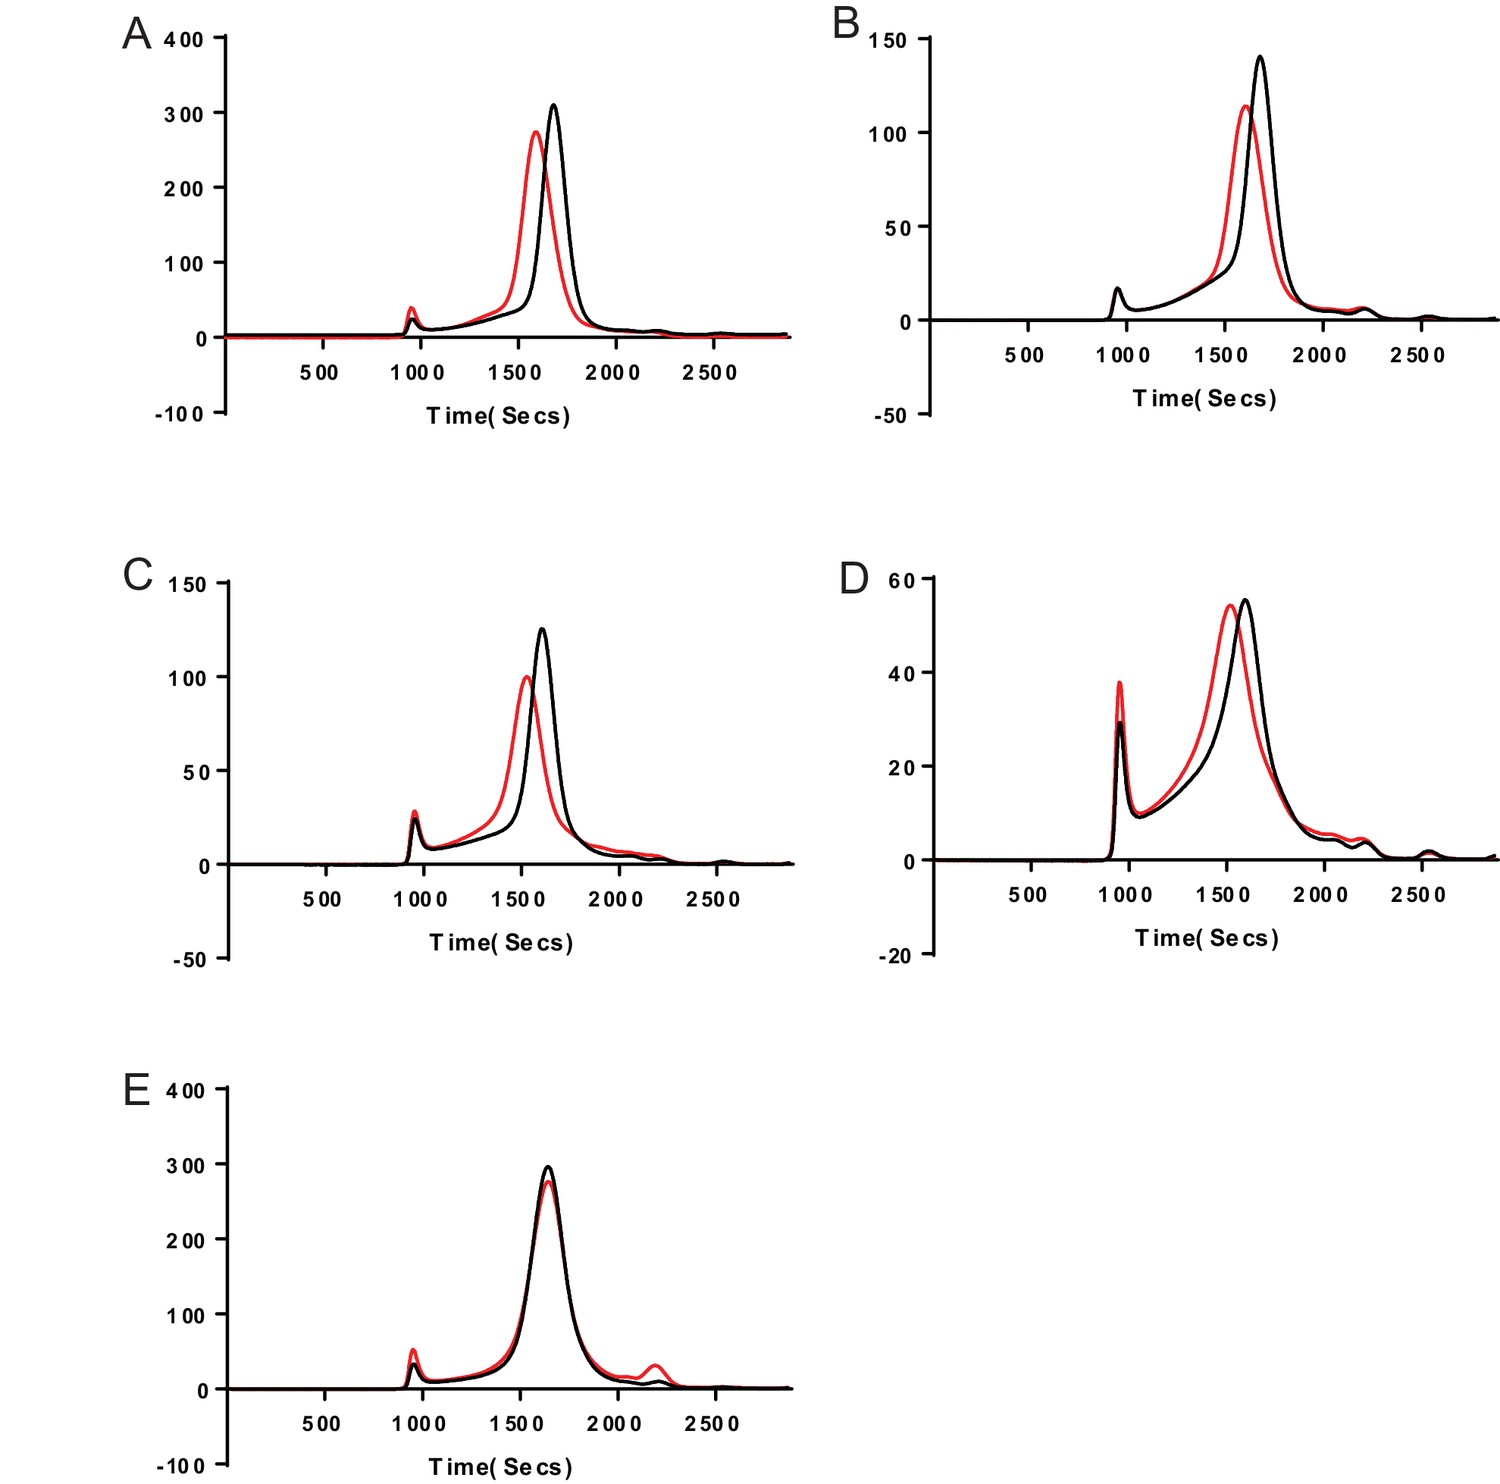
Representative FSEC traces showing the subunit specificity of the 8E3 antibody.
Cells expressing various subunit combinations of subunits (a) α1β1, (b) α1β1γ2S, (c) α1β2, (d) α1β2γ2S, and (e) α6β2γ2S were solubilized and analyzed by fluorescence-detection-size-exclusion chromatography (FSEC) either alone (black trace) or with 8E3 Fab (red trace). The α subunit in each case is GFP tagged within the M3/M4 loop. Excitation and emission wavelengths were 480 and 510 nm respectively. Shifts in FSEC traces confirm that the presence of the α1 subunit is required for 8E3 binding.
Figure 1—figure supplement 3

Analysis of α1β1γ2SEM receptor function.
(a) Representative whole-cell patch-clamp recording from TSA-201 cells expressing α1β1EM/γ2S-FR receptors activated by 5 μM GABA in the presence or absence of 1 μM Diazepam. (b) Summary of electrophysiology data representing potentiation by 1 μM Diazepam in the presence or absence of 25 nM Fab; n = 6 cells for both experiments. Unpaired t-test with Welch’s correction, p=0.0040% and 95% confidence interval (CI) = −4.861 to −1.466. Midline and error bars represent mean and SEM, respectively. (c) Dose-response data for GABA from TSA-201 cells expressing α1β1EM/γ2S-FR receptors. EC50 = 28.68 μM (95% CI = 21.38–38.49 μM) or 22.51 μM (95% CI = 12.69–39.93 μM) GABA in the presence or absence of 25 nM Fab, respectively. Error bars represent SEM and n = 6 cells for both experiments. (d) and (e), Saturation binding curve of [Methyl-3H]flunitrazepam (d) and [3H]muscimol (e) to α1β1γ2SEM receptor Fab complexes; the plotted result is from a representative experiment. Kd = 5.49 nM (95% CI = 4.25–7.05 nM) or 109.3 nM (95% CI = 91.76–129.7 nM) for [Methyl-3H]flunitrazepam and [3H]muscimol, respectively. Error bars represent SEM.
Figure 1—figure supplement 4
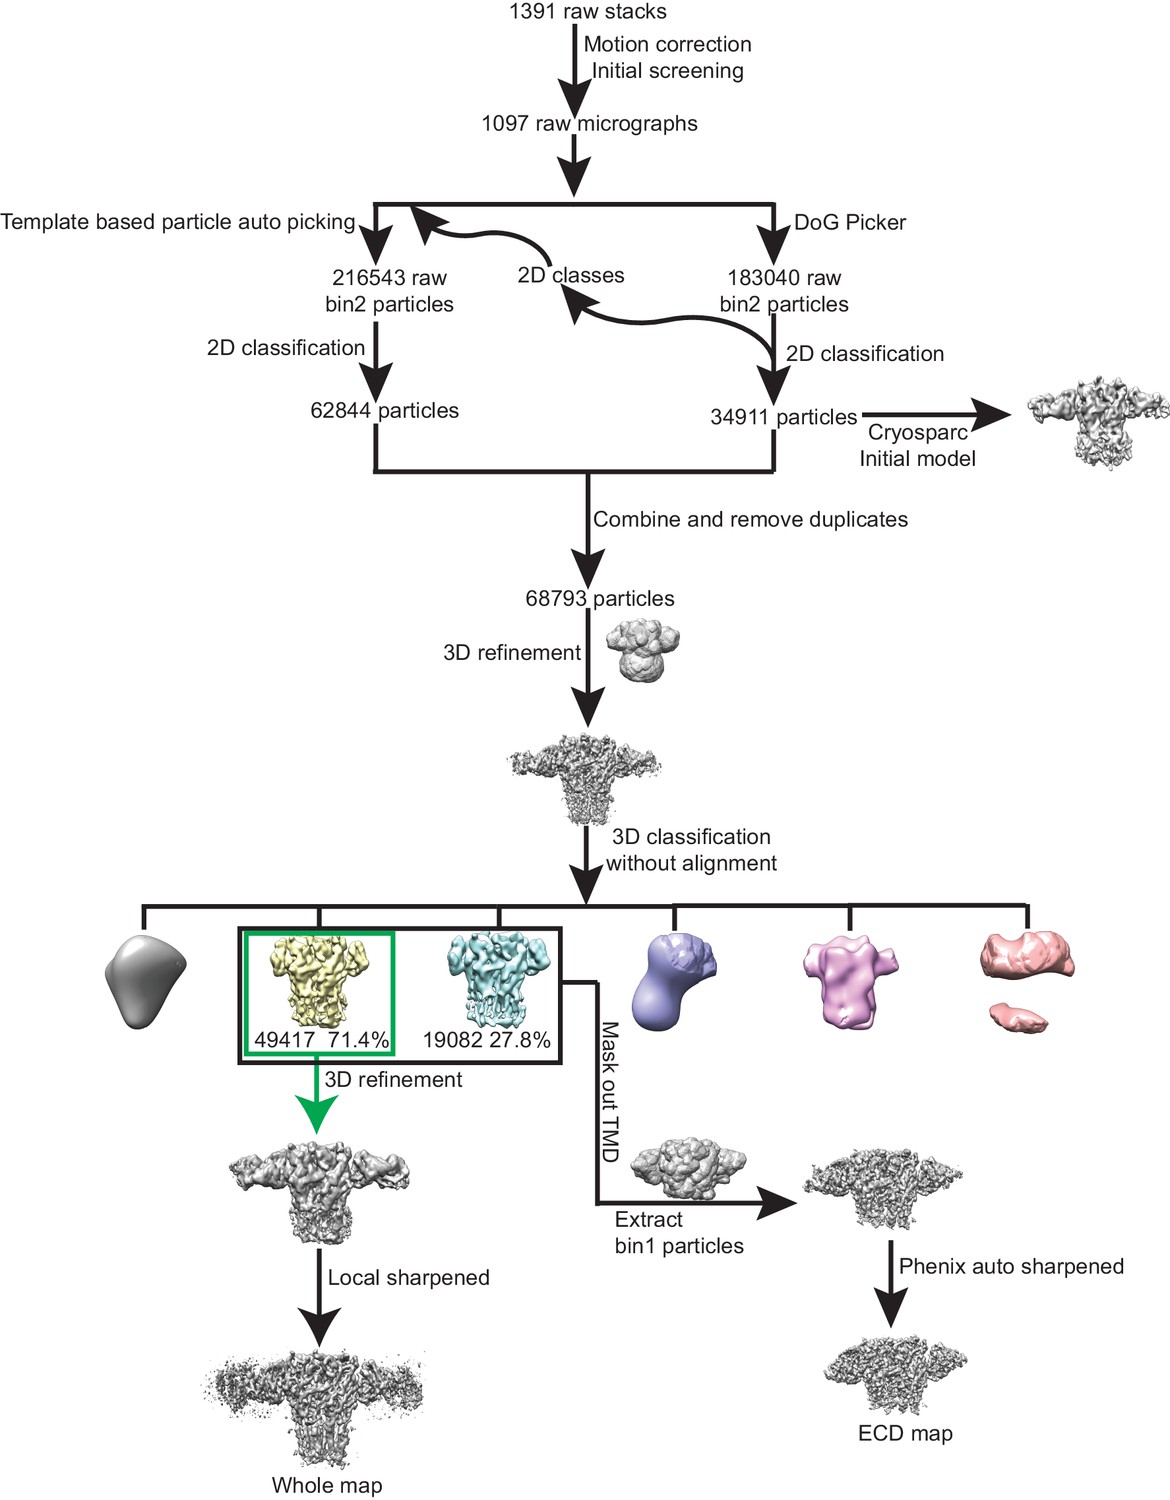
The processing workflow of cryo-EM data analysis of tri-heteromeric GABAA receptor data set.
https://doi.org/10.7554/eLife.39383.006
Figure 1—figure supplement 5
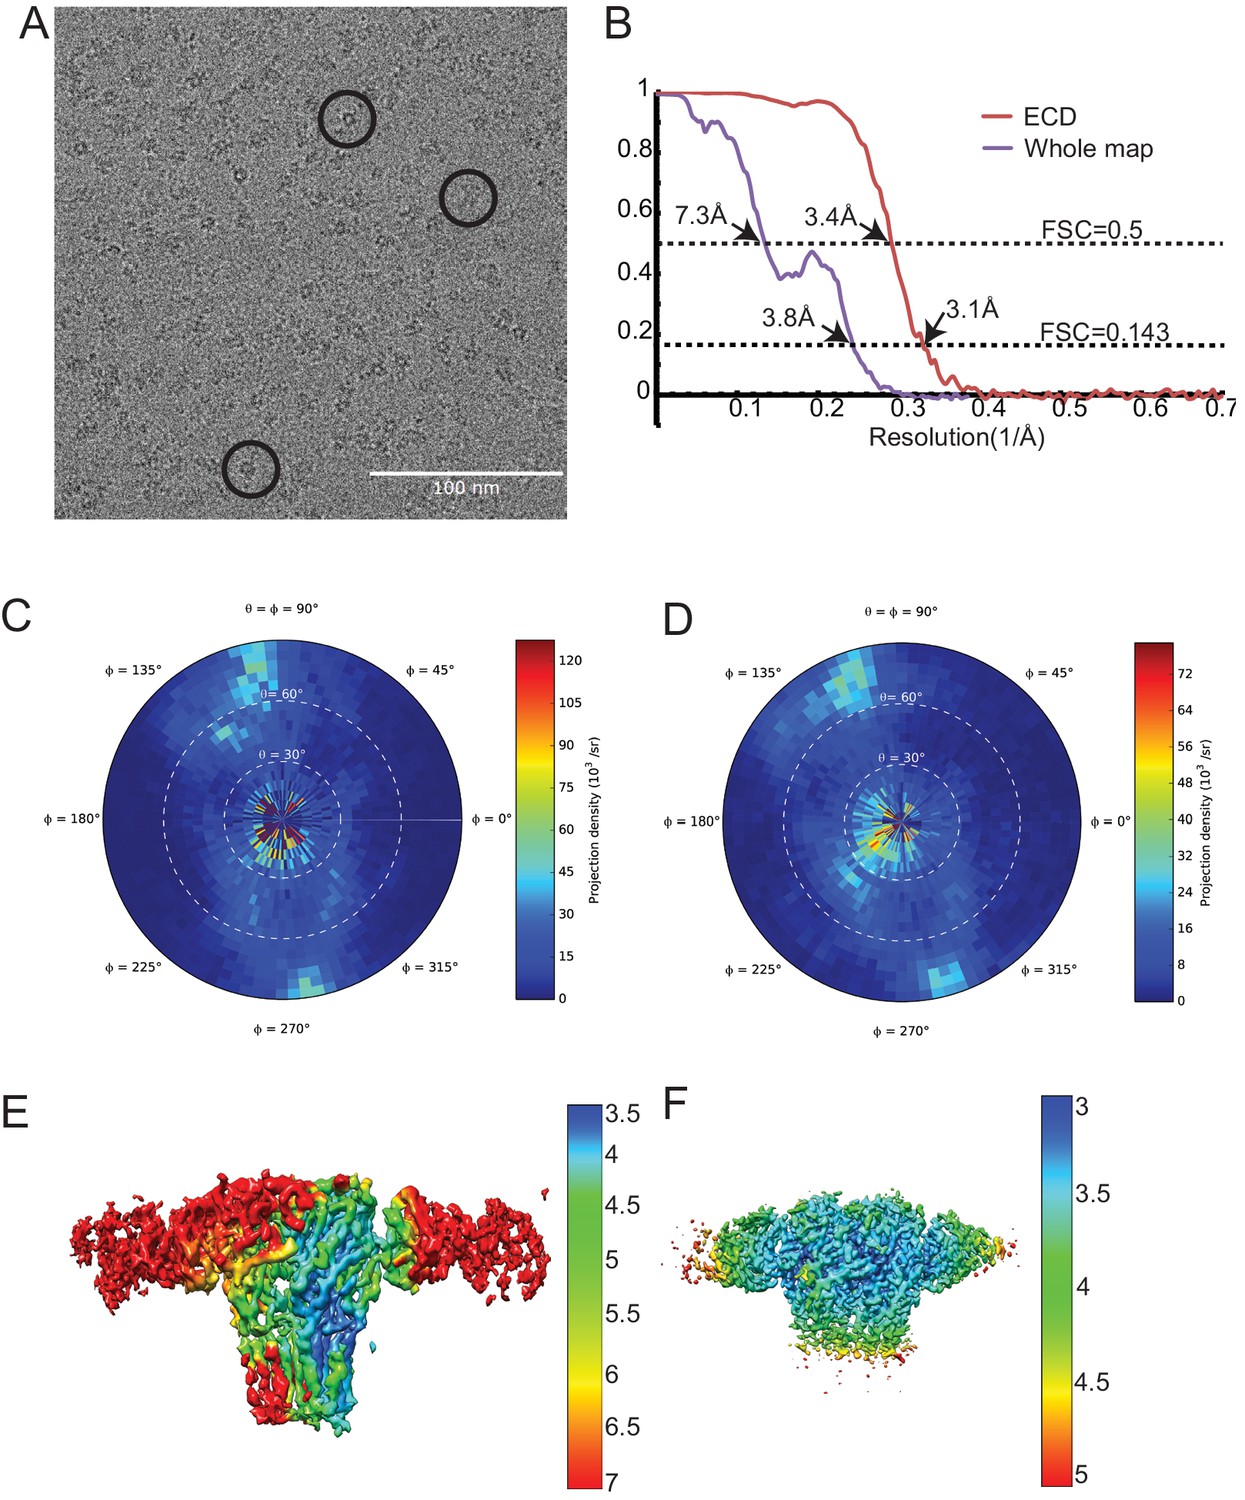
Cryo-EM analysis of the tri-heteromeric data set.
(a) Typical micrograph of tri-heteromeric GABAA receptor. (b) FSC curves for the whole map and ECD map. The resolution is determined using the gold standard FSC standard. FSC 0.5 is also labeled. Purple and red curves represent whole map and ECD map curve, respectively. The resolution for the whole map and the ECD map is 3.8 and 3.1 Å, respectively. (c) and (d) The particle angular distribution for the whole map and the ECD map, respectively. (e) and (f) The local resolution map for the whole map and the ECD map, respectively.
Figure 1—figure supplement 6
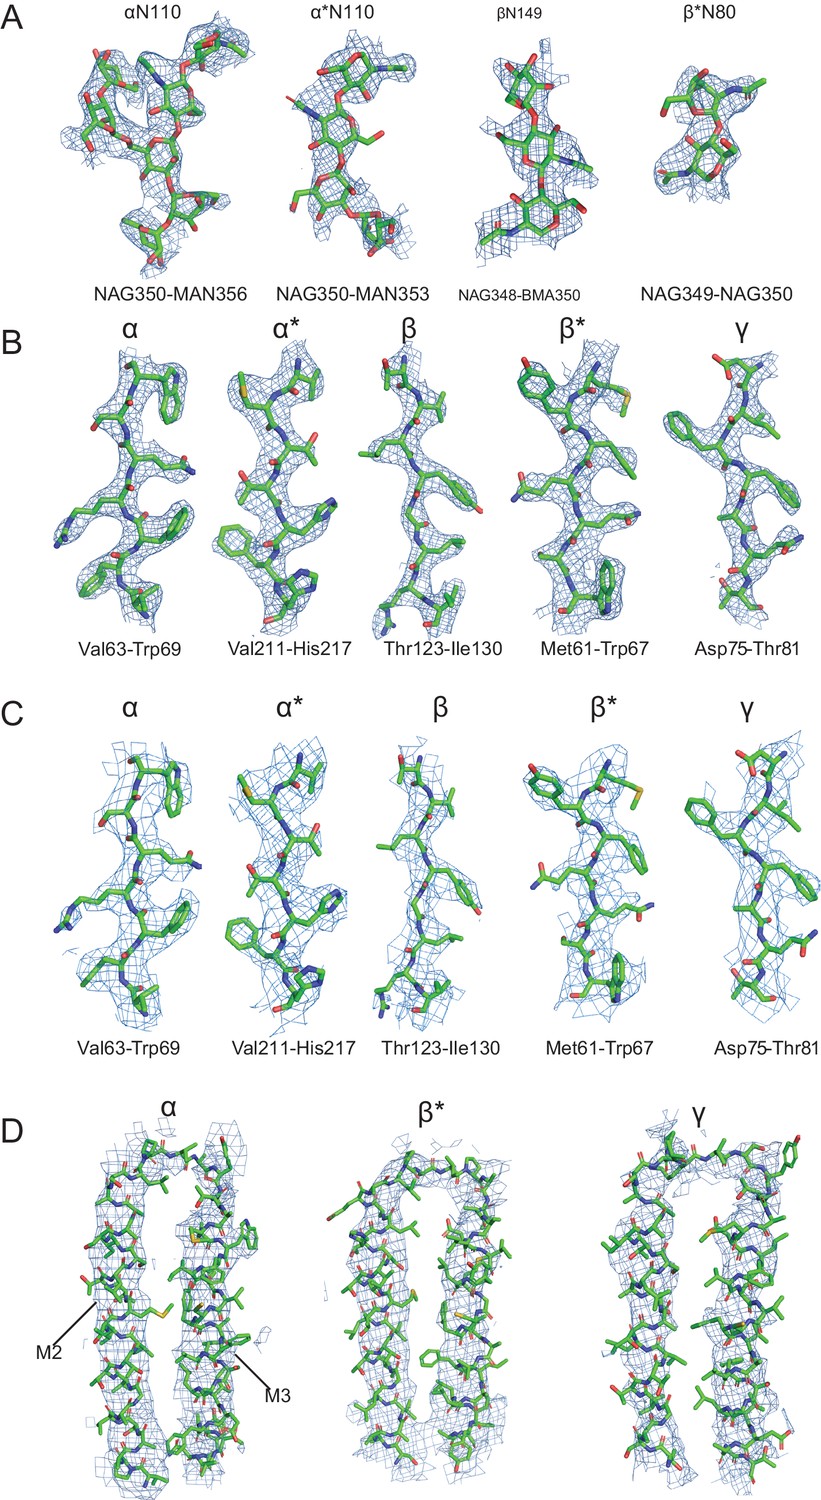
Representative densities for the 'ECD' and 'whole' cryo-EM maps.
(a) Glycosylation densities located on the α and α* subunits, derived from modification of Asn 110 and protruding into the extracellular vestibule of the channel of the receptor are shown. The glycosylation densities on the exterior surface of the receptor and located on the β (Asn 149) and β* (Asn 80) subunit are depicted, contoured at 5.5 σ. These densities are from the ECD map. (b) Representative densities from the α, β and γ subunits from the ECD map, contoured at 11 σ. (c) Illustrative densities from the α, β and γ subunits from the whole map, contoured at 5.5 σ. (d) M3 and M4 densities for the α, β and γ subunits from the whole map, contoured at 4.5 σ.
Figure 1—figure supplement 7
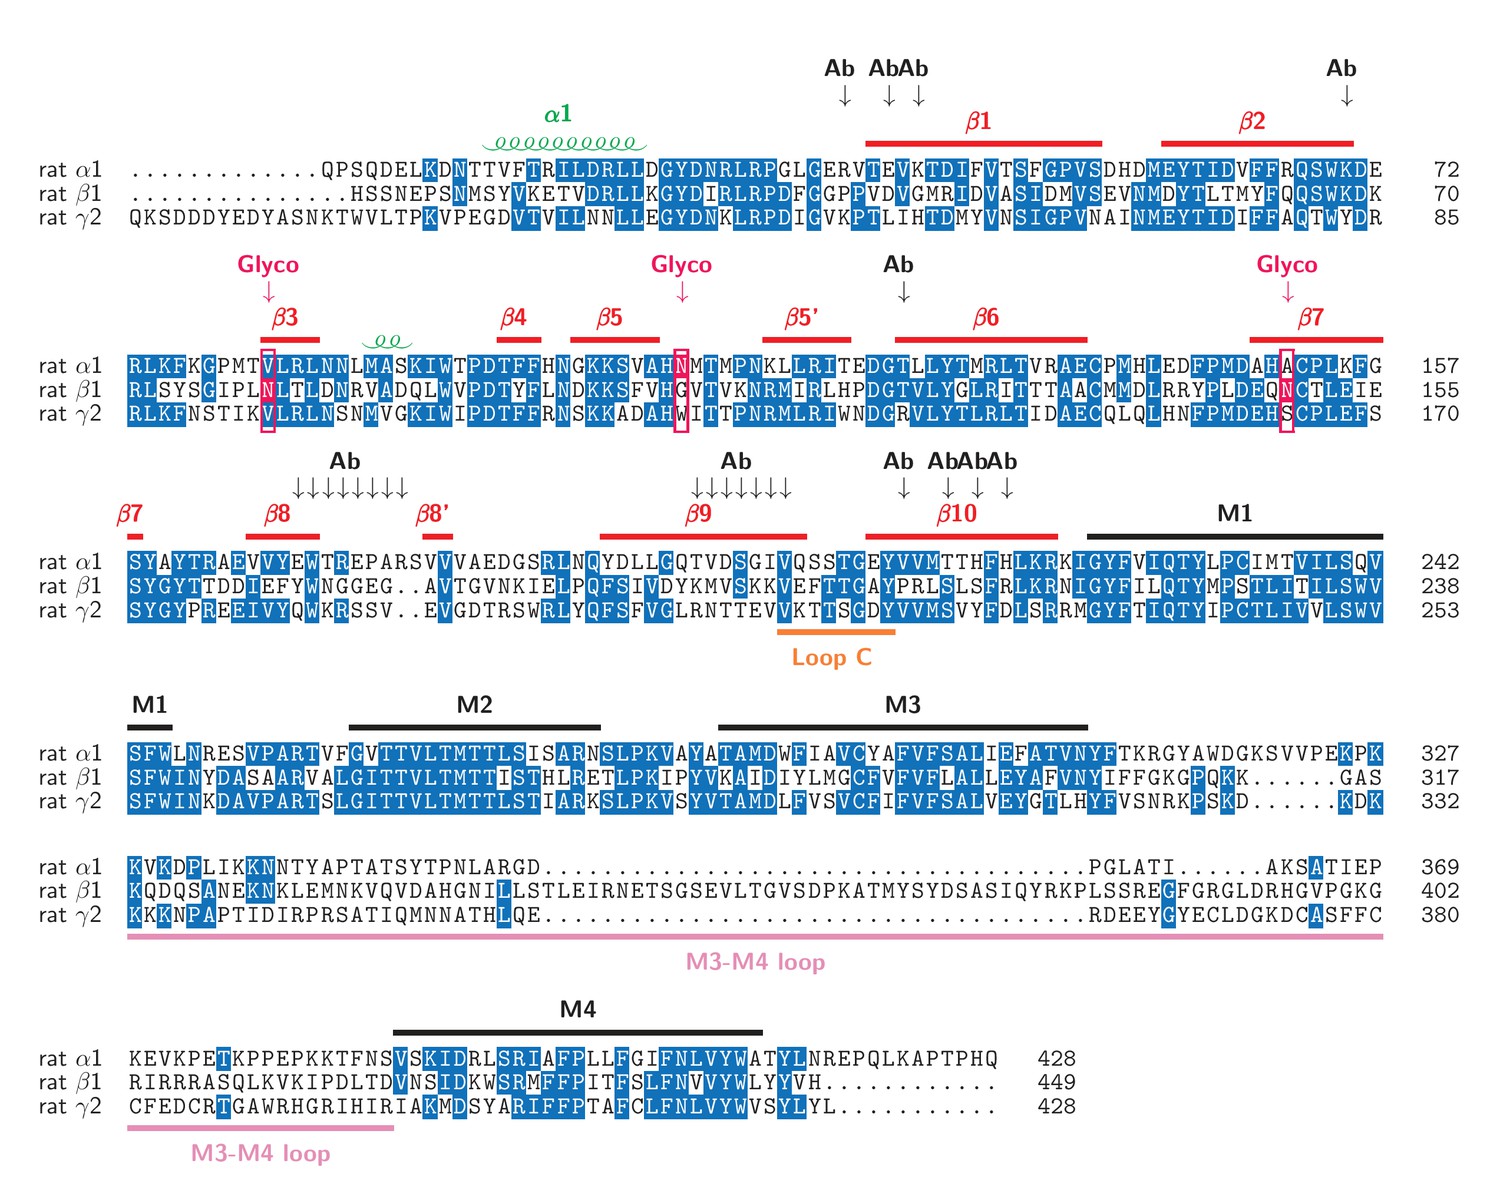
Sequence alignment of the α1, β1, γ2S sequence with secondary structure assignment marked.
The glycosylation sites are marked with a red arrow, the corresponding position is boxed and the glycosylated residue is shown in a red background; the antibody binding sites (based on analysis of buried surface area) are indicated with a black arrow and represent antibody binding in the α subunit. Numbering for the α1, β1, γ2S subunits is maintained as per the mature peptide.
Figure 1—figure supplement 8
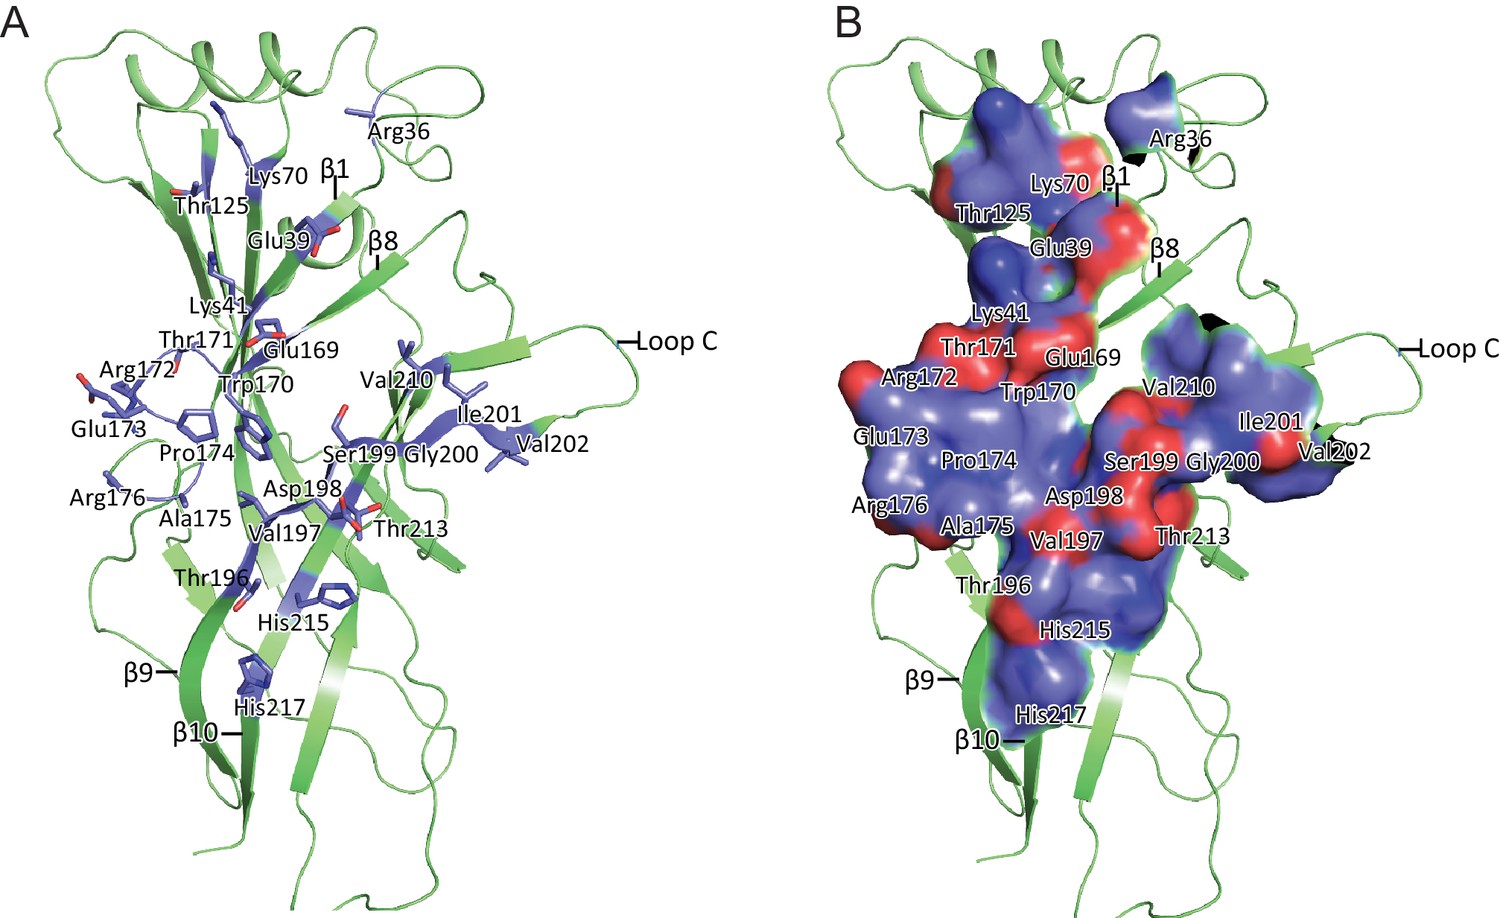
8E3 fab binding to the α1β1γ2SEM receptor.
The 8E3 fab binds specifically on the α subunit to residues located on the β-sheets 1, 8, 9 and 10. Analysis for the buried surface area was done by placing a model of Fab in the ECD electron density map and analyzing the resulting model on the PDBePISA web server. Interface residues are shown as sticks (a) and surface representation (b).
Figure 2

Intersubunit interactions.
(a) The interface region between the α and β subunits, with the boxed area enlarged in panels b-f and the viewing angle indicated by an arrow, the region with fenestration between the subunits is marked with an asterisk. The α and α* subunits are colored in salmon, β and β* are colored in lime, and γ is colored in marine and shown as cartoon. Side chains for amino acids for which specific interactions were observed are shown with interactions depicted in dashed lines. In (b) is the α(+)/β(-) interface, (c) the β(+)/α*(-) the interface, (d) the α*(+)/γ(-) interface, (e) the γ(+)/β*(-) interface and (f) the β*(-)/α(-) interface.
Figure 3 with 4 supplements

Neurotransmitter binding sites.
(a) Top down view of the receptor looking from the extracellular side. The α and α* subunits are colored in salmon, β and β* are colored in lime, and γ is colored in marine. GABA molecules are shown in sphere representation. (b) View of the binding site between the β*(+)/α(-) subunits viewed parallel to the membrane. Dashed lines indicate hydrogen bonds, cation-π interactions and salt bridges. The β*(+) and α(-) subunits are colored in salmon and lime, respectively. The residues in the β*(+) and α(-) subunits and GABA are depicted in salmon, lime and yellow sticks, respectively. (c) View of the binding site between the α(+)/β(-) subunits viewed parallel to the membrane. Subunits and residues are depicted in the same color code as in (b). The residues differing from the corresponding residues in the β*(+)/α(-) binding site are indicated with red stars. (d) View of the binding site between the γ (+)/β*(-) subunits looking parallel to the membrane. Residues in the γ(+) and β*(-) binding site are shown in marine and salmon sticks, respectively. The residues differing from the corresponding residues in the β*(+)/α(-) binding site are indicated with red stars. (e) View of the binding site between the α*(+)/γ(-) binding site viewed parallel to the membrane. Residues in the α*(+) and γ(-) binding site are shown in lime and marine sticks, respectively. The residues differing from the corresponding residues in β*(+)/α(-) are indicated with red stars. (f) Similar view of the diazepam binding site as in panel (e).
Figure 3—figure supplement 1
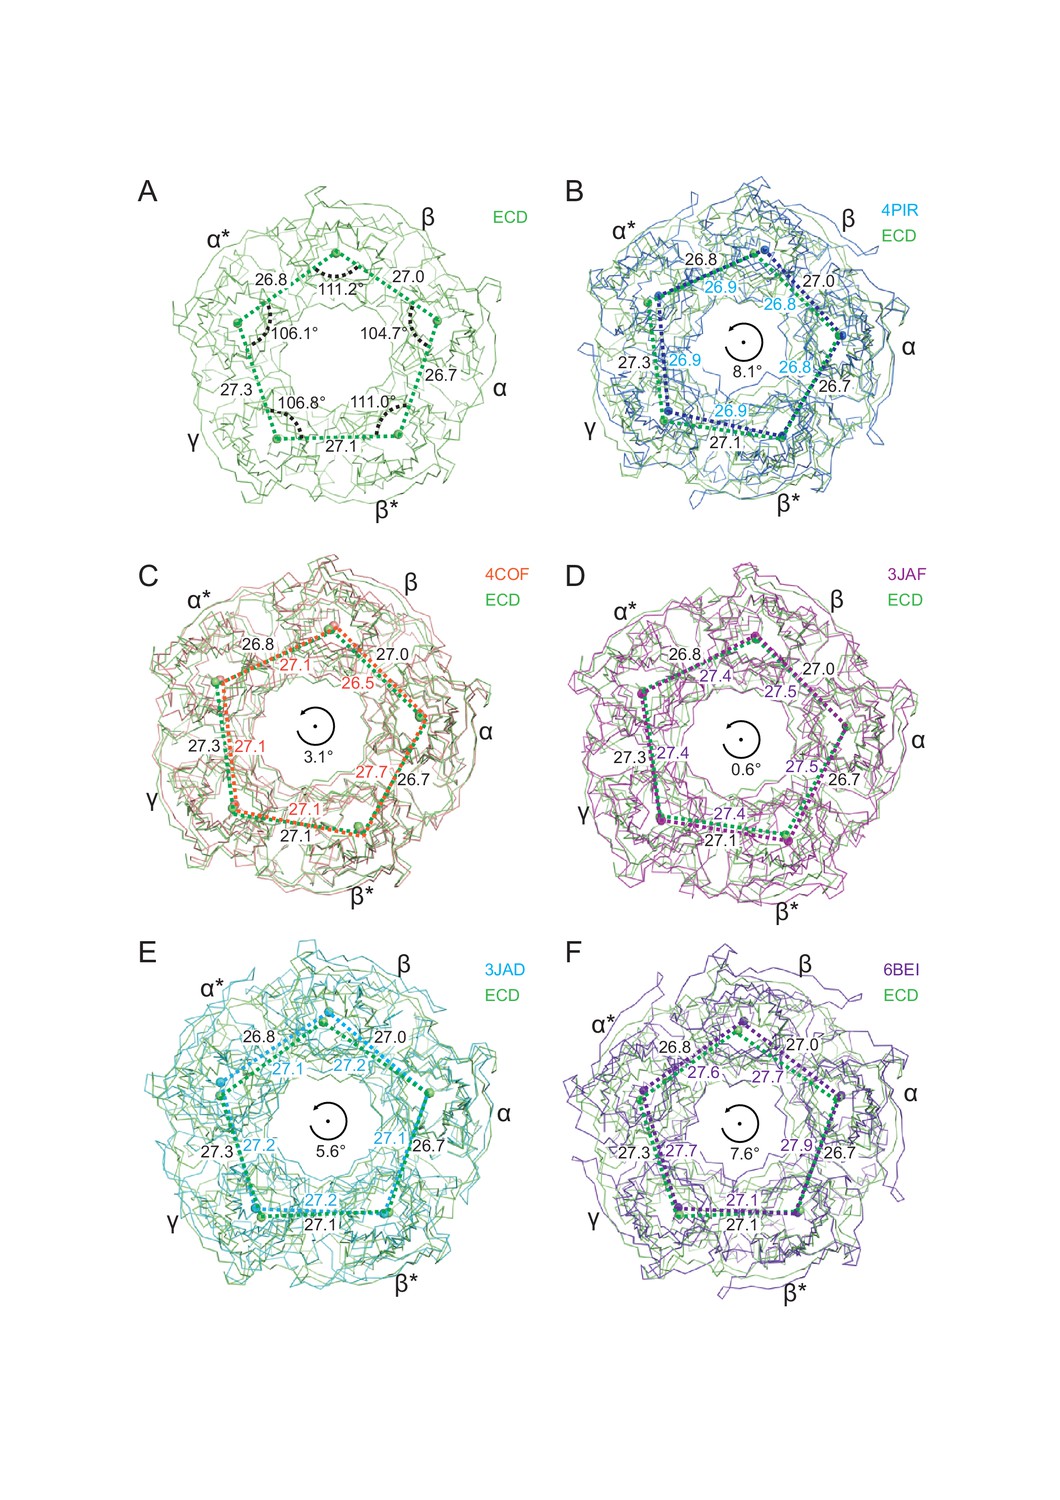
Superposition of the tri-heteromeric GABAA receptor ECD structure with the 5-HT3A receptor structure (PDB code: 4PIR and 6BE1), the homo GABAA β3 structure (PDB code: 4COF), the strychnine bound glycine receptor structure (PDB code: 3JAD), and the ivermectin-glycine bound glycine receptor structure (PDB code: 3JAF).
The Cα traces from chain A are used to do the alignment. (a) The distances between the nearby centers of mass, together with the angles of the pentagon of centers of mass, are shown. (b) The ECD structure is in lime and 4PIR is in marine. Lime and marine balls indicate the centers of mass of one subunit for the ECD structure and 4PIR, respectively. The distances between the two nearby centers of mass are labeled. The distances related to the ECD are labeled outside of the pentagon and the distances labeled inside the pentagon are for 4PIR. The angle indicates the approximate rotation of the pentagon formed by the five centers of mass between the ECD and 4PIR. (c), (d), (e) and (f) similar to (a), the distances between the nearby two centers of mass are shown overlapping with the ECD structure.
Figure 3—figure supplement 2
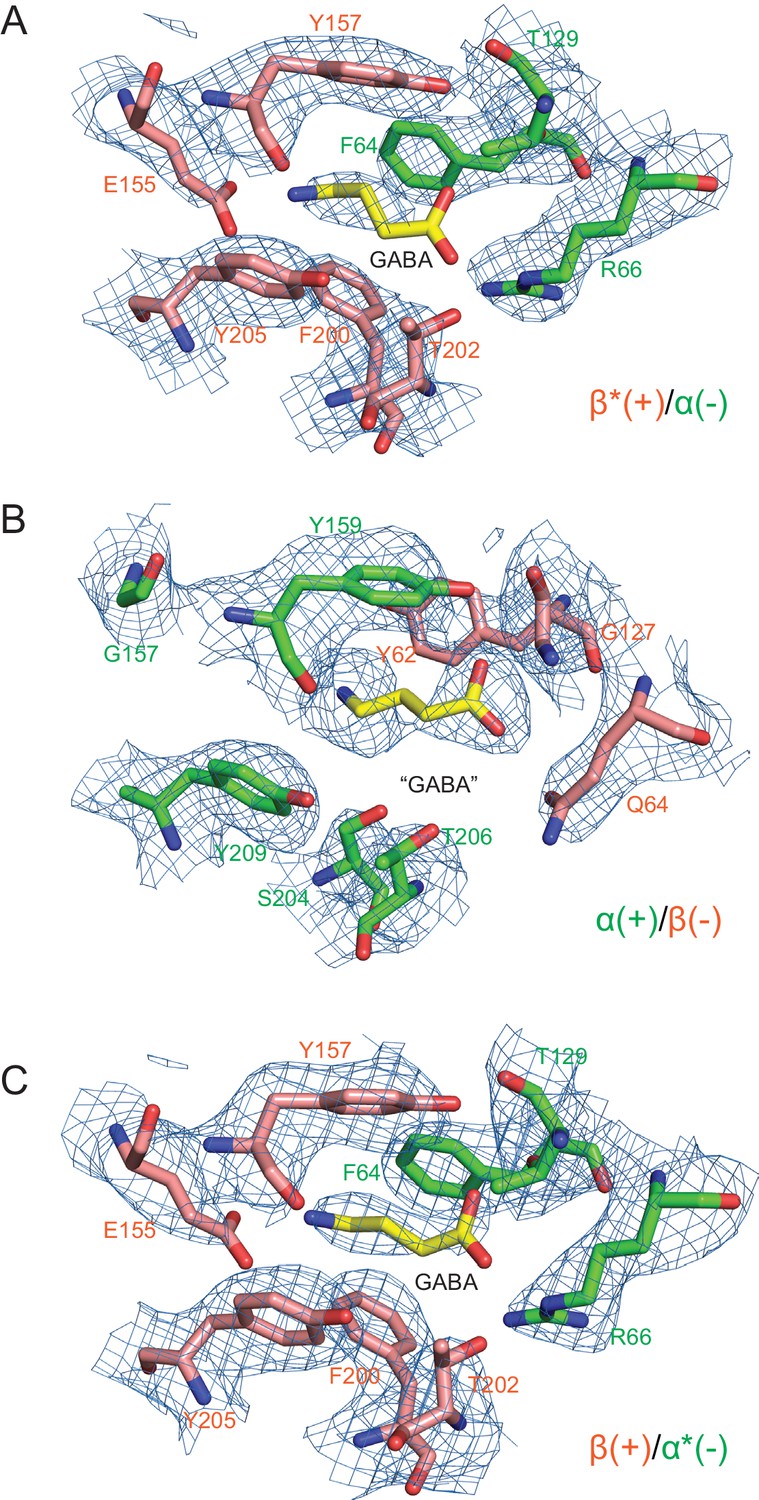
Densities surrounding the GABA binding pocket.
Three non-protein densities were found between the interfaces of subunits, (a) for the β*(+)/α(-) interface, (b) for the α(+)/β(-) interface and (c) for the β(+)/α*(-). GABA molecules were placed in these densities colored with yellow bonds, blue nitrogen and red oxygen. To fit the GABA molecules to their respective density features we utilized the shapes of the density features and the surrounding chemical environments. The resulting structural models resulted in a good fit of GABA to the density and chemically reasonable ligand-protein interactions.
Figure 3—figure supplement 3
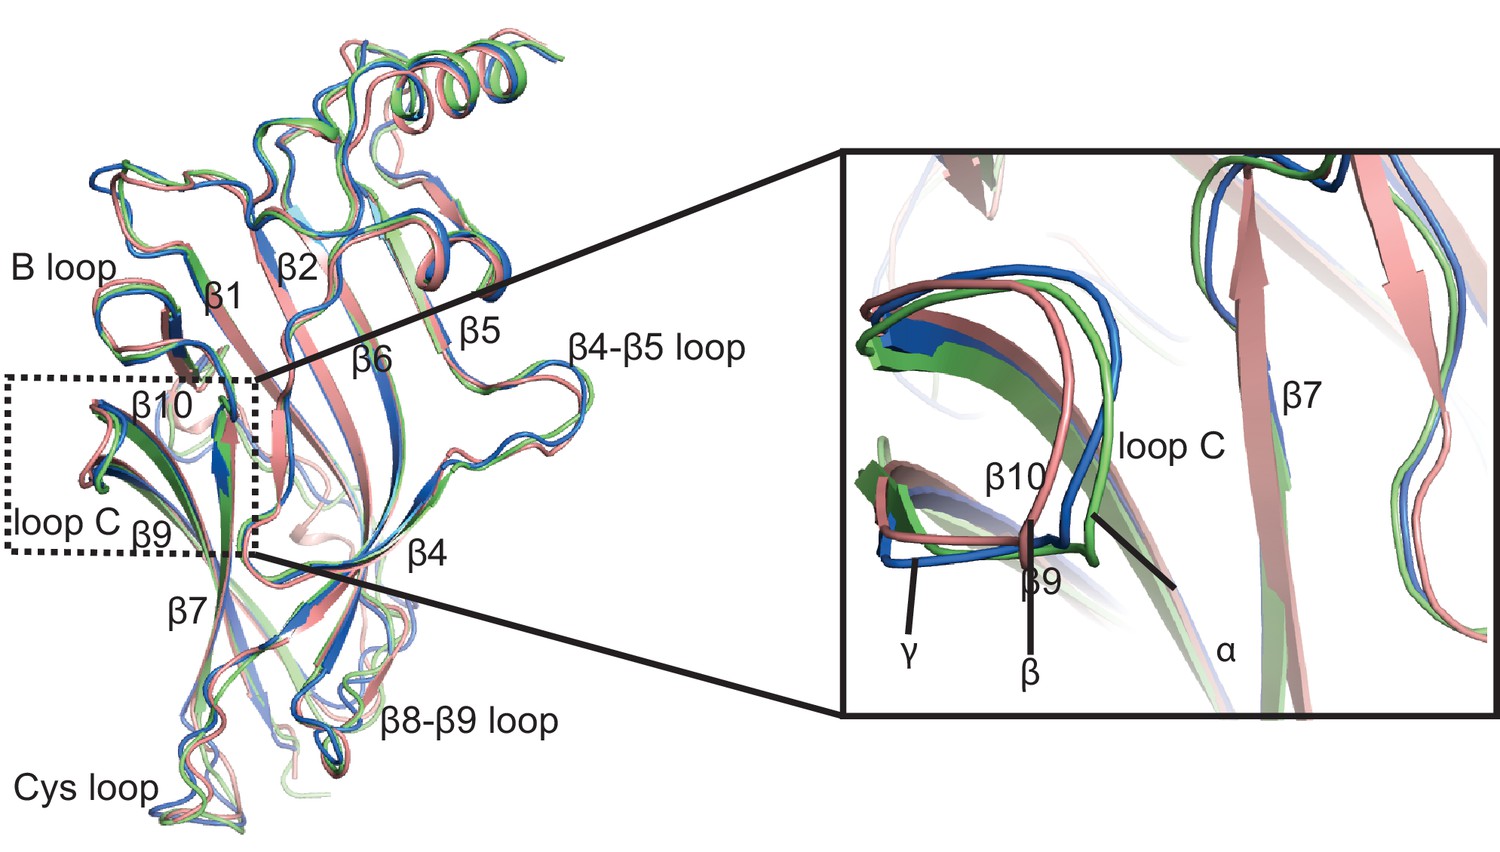
Superposition of the ECD between α, β* and γ subunits.
α, β and γ subunits are colored in salmon, lime and marine, respectively. The ligand binding site is indicated with a black dash frame.
Figure 3—figure supplement 4
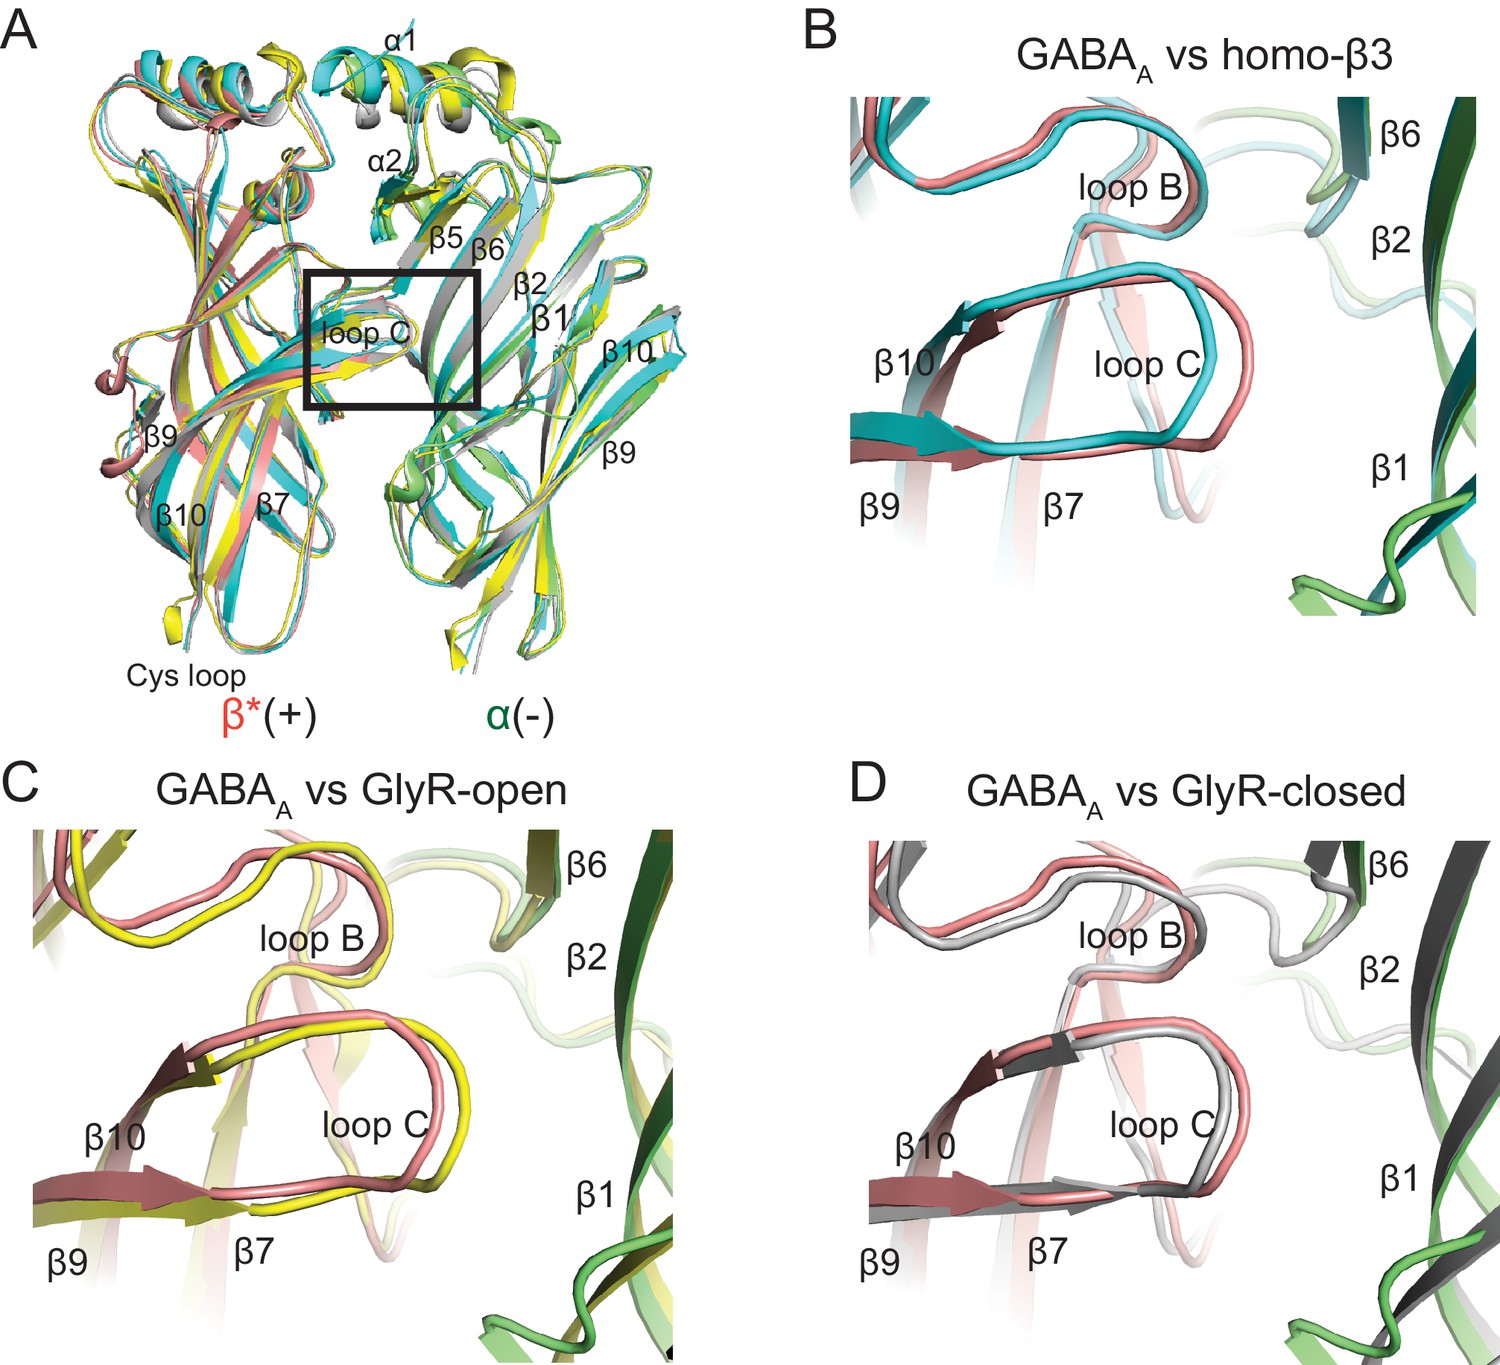
Superposition of the ECD of β*/ α subunits with the structure for human β3 GABAA (PDB code: 4COF), GlyR-open (PDB code: 3JAE) and GlyR-closed (PDB code: 3JAD) to illustrate the configuration of loop C in each structure.
(a) Overall comparison of ECD of β*/ α subunits with the human β3 GABAA, GlyR-open and GlyR-closed. β*(+) and α(-) are colored in salmon and lime. Human-β3, GlyR-open and GlyR-closed are colored in cyan, yellow and gray, respectively. Loop C was highlighted with a black frame. The enlarged view of loop C is shown in (b), (c) and (d).
Figure 4 with 1 supplement
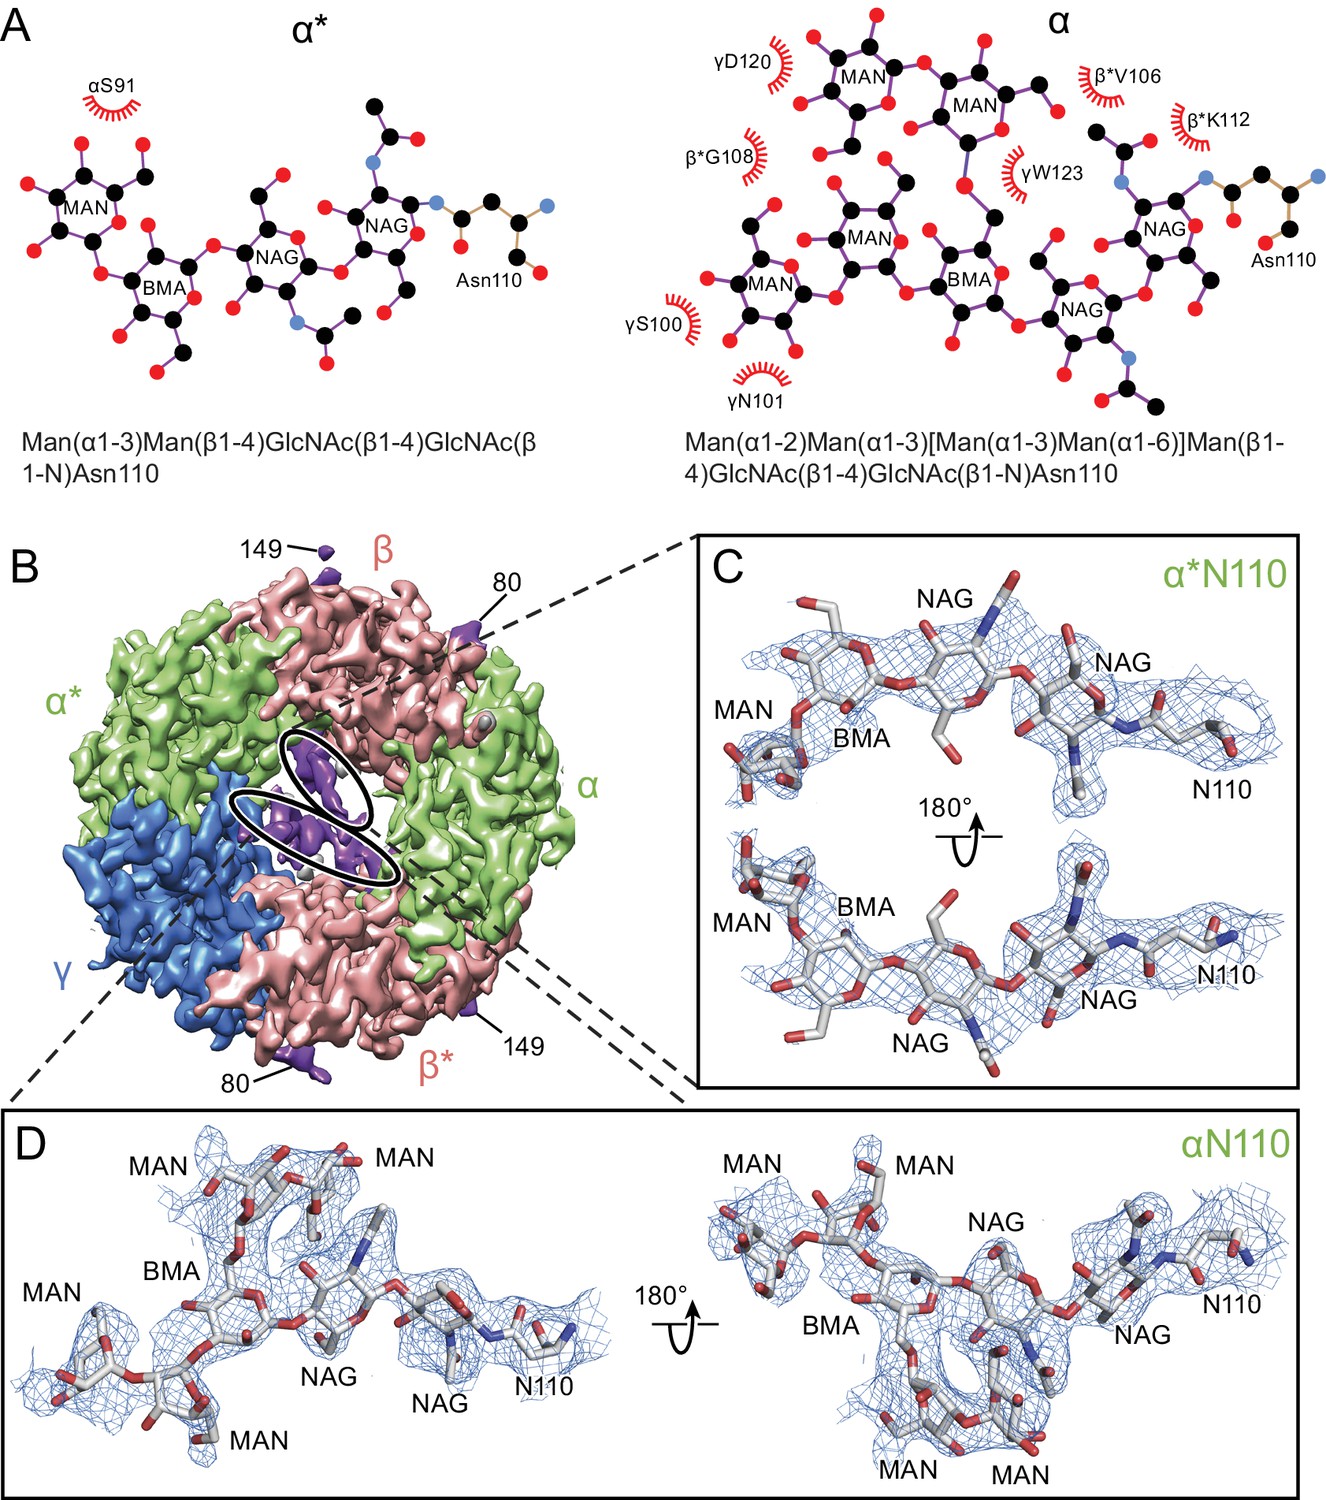
Glycosylation sites in the extracellular vestibule.
(a) Schematic of the sugar chain chemical structure for the Asn110 modification. The amino acids interacting with the sugar chains are also shown. The names of the carbohydrates are given at the bottom of the panel (Gamian, 1992). (b) Top down view of ECD map. The α, β and γ subunits are colored by light green, salmon and blue, respectively. The glycosylation densities are colored by purple. The related Asn residue numbers are labeled. (c) Two views of the density of the glycosylation from the α* subunit, isolated and fitted with four sugar molecules. Asn110 and the name of sugars are labeled. (d) Similar panel to (c), showing the density of the glycosylation on the α subunit fit with a carbohydrate chain containing seven sugar residues.
Figure 4—figure supplement 1
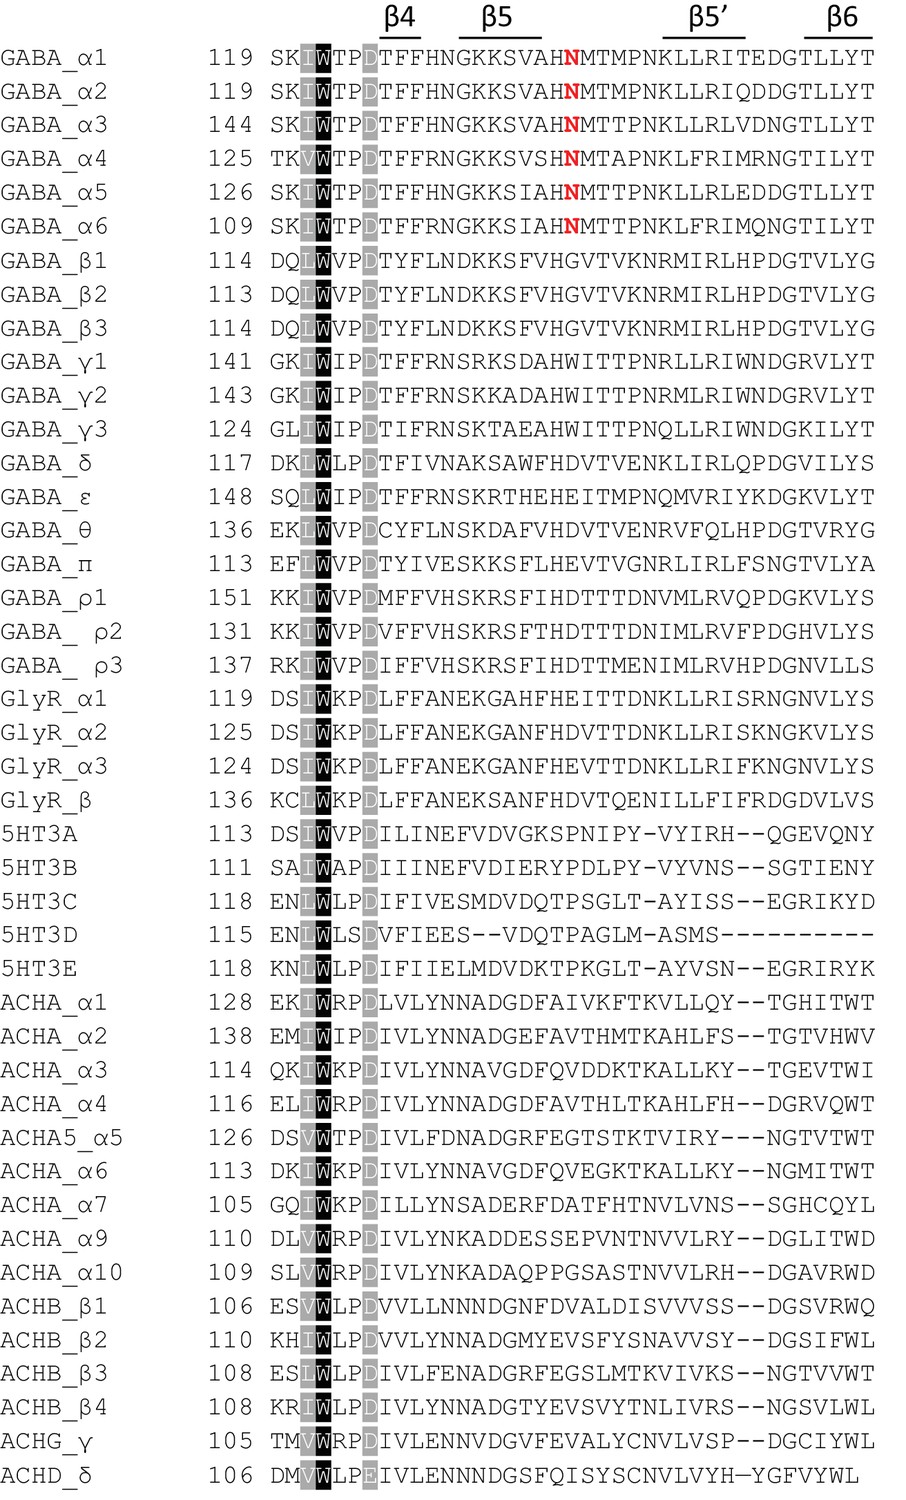
Sequence alignment of the human Cys-loop receptors.
Sequences were downloaded from swiss-prot with the following identifiers: P14867, P47869, P34903, P48169, P31644, Q16445, P18505, P47870, P28472, Q8N1C3, P18507, Q99928, O14764, P78334, Q9UN88, O00591, P24046, P28476, A8MPY1, P23415, P23416, O75311, P48167, P46098, O95264, Q8WXA8, Q70Z44, A5X5Y0, P02708, Q15822, P32297, P43681, P30532, Q15825, P36544, Q9UGM1, Q9GZZ6, P11230, P17787, Q05901, P30926, P07510, Q07001. Fully conserved positions are shaded black and partially conserved positions are shaded gray. Numbering shown is based on the swiss-prot record and represents the numbering for the nascent peptide. The unique α-specific glycosylation site is colored in red.
Figure 5
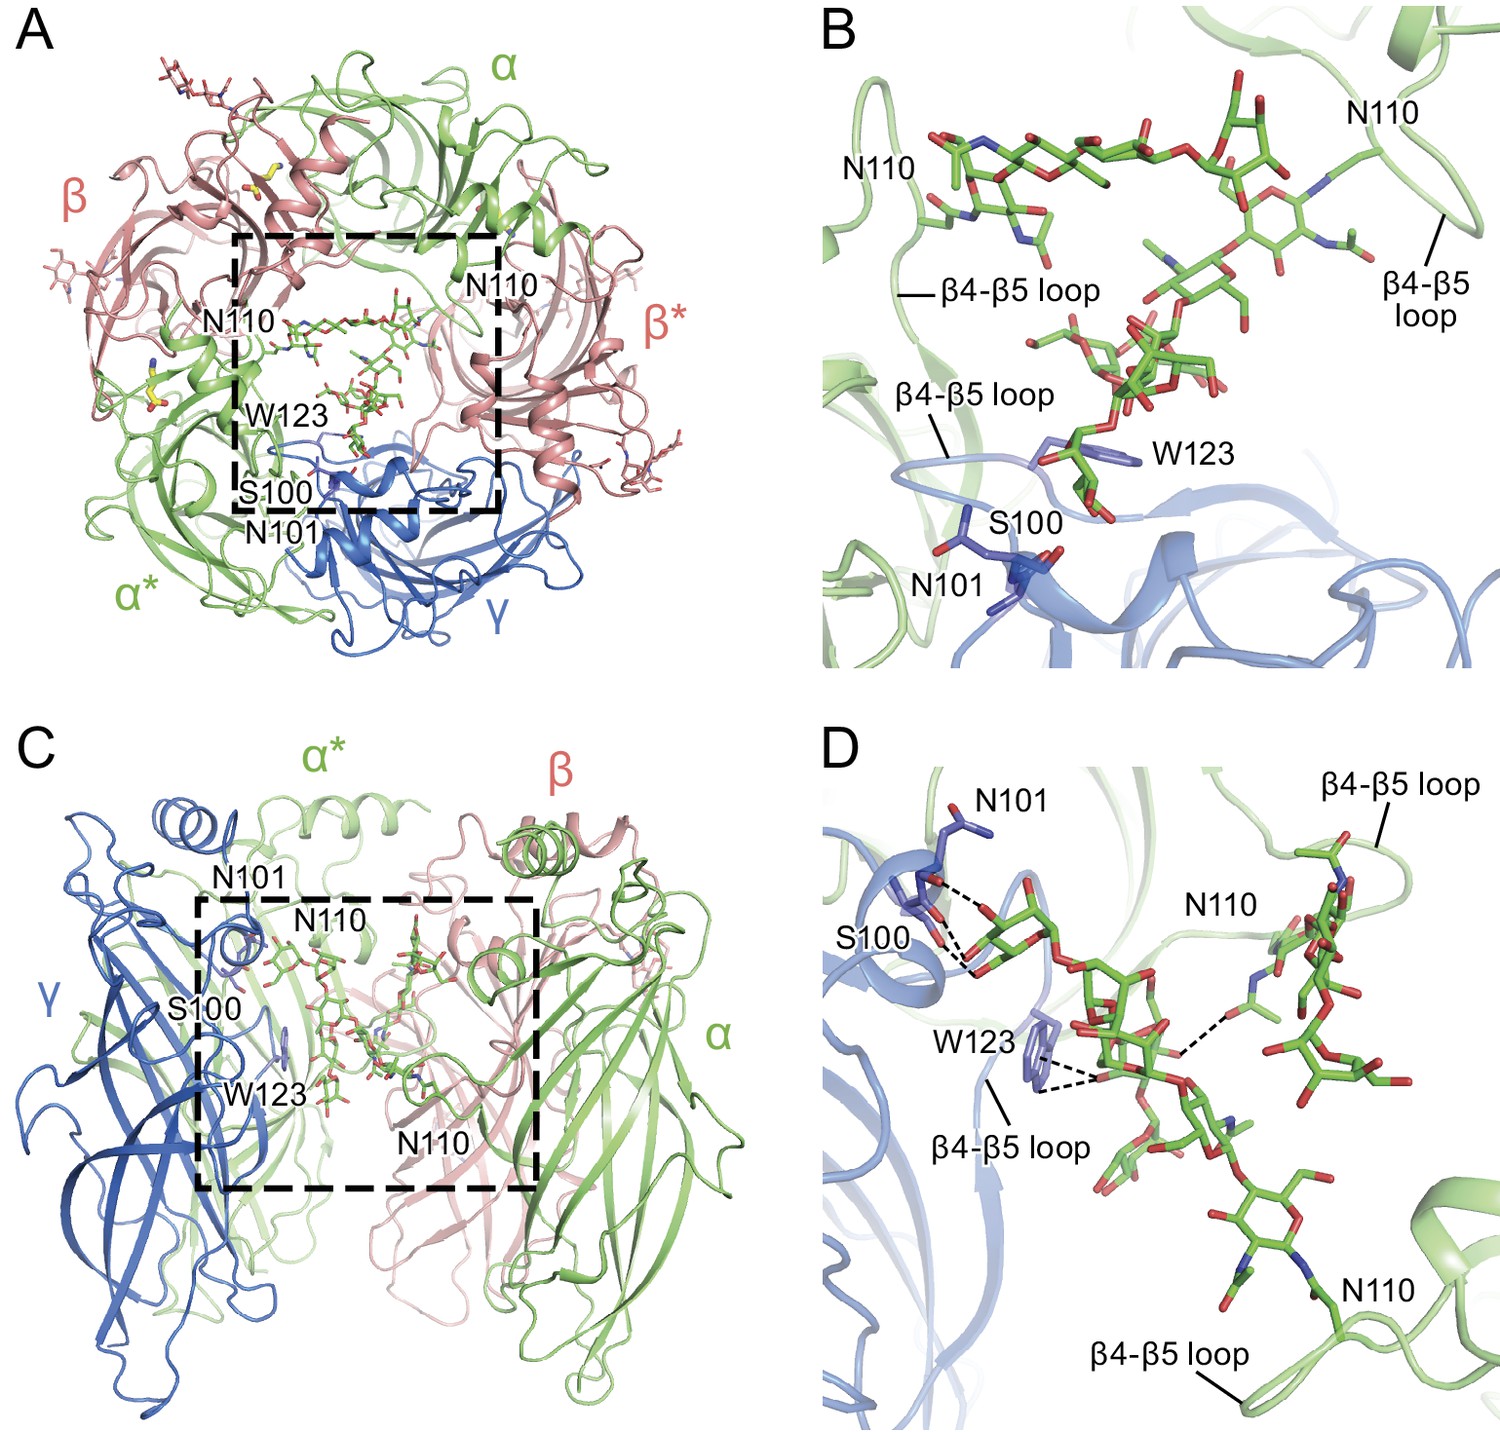
α-Subunit glycosylation and interaction with key residues.
(a) Top-down view of the glycosylation pocket parallel to the membrane. The α and α* subunits are colored in salmon, the β and β* subunits are in lime and the γ subunit is in marine. Glycosylation from the α/α* and β/β* subunits are shown in green and salmon sticks. Interacting residues from the γ subunit are depicted in stick representation (marine). (b) Enlarged view of the glycosylation pocket indicated by the dash-outlined frame in (a). The β and β* subunits are removed for clarity. (c) Side view of the glycosylation pocket perpendicular to the membrane. The β* subunit was removed for clarity. (d) Enlarged view of the glycosylation pocket from the dash-outlined frame in (c). The β and β* subunits were removed for clarity.
Figure 6
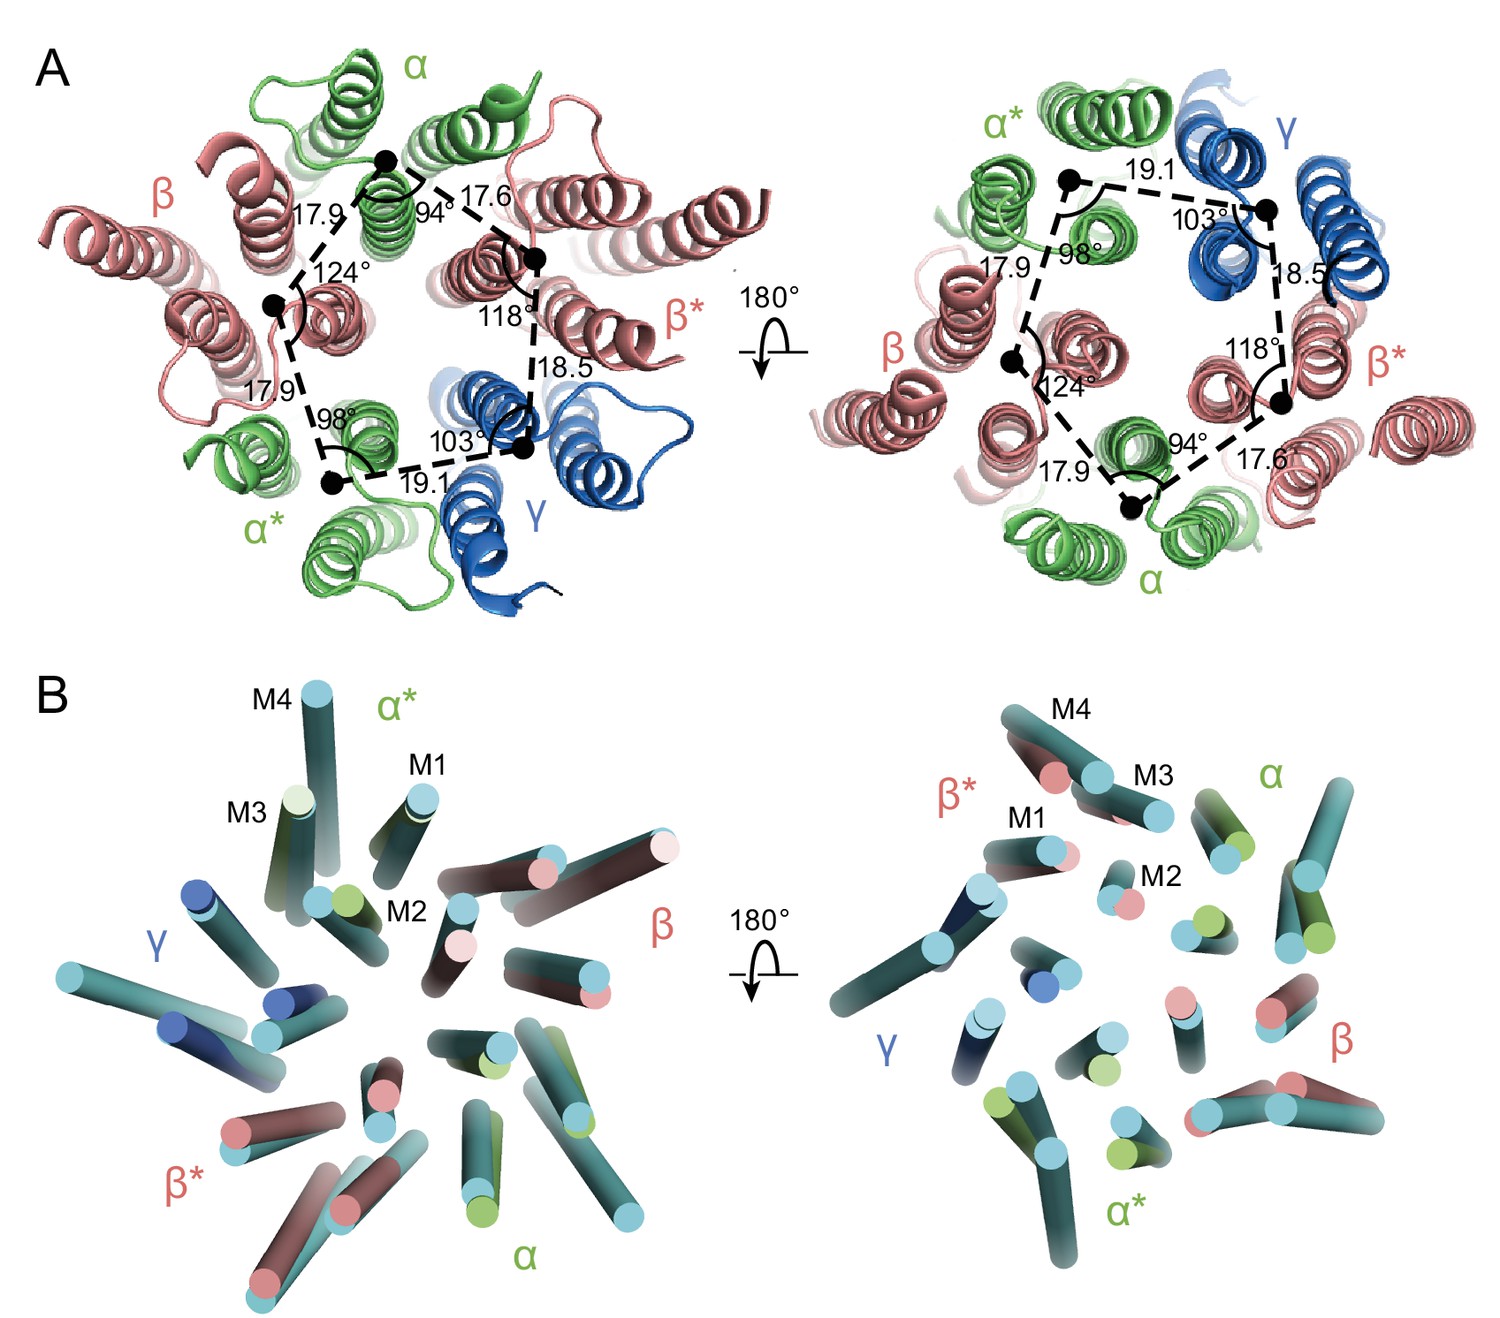
Asymmetry in the TMD.
(a) View of the TMD from the extracellular (left panel) side or from the intracellular side (right panel) of the membrane. The α and α* subunits are colored in salmon, β and β* are colored in lime, and γ is colored in marine. Center of mass of M1, M2 and M3 helices for each subunit, shown as a solid black circle, was generated by Pymol. Distances are in Å. (b) Superposition of the TMD in the GABAA receptor with human β3 (PDB code: 4COF). The TMD of the human β3 is colored in cyan.
Figure 7
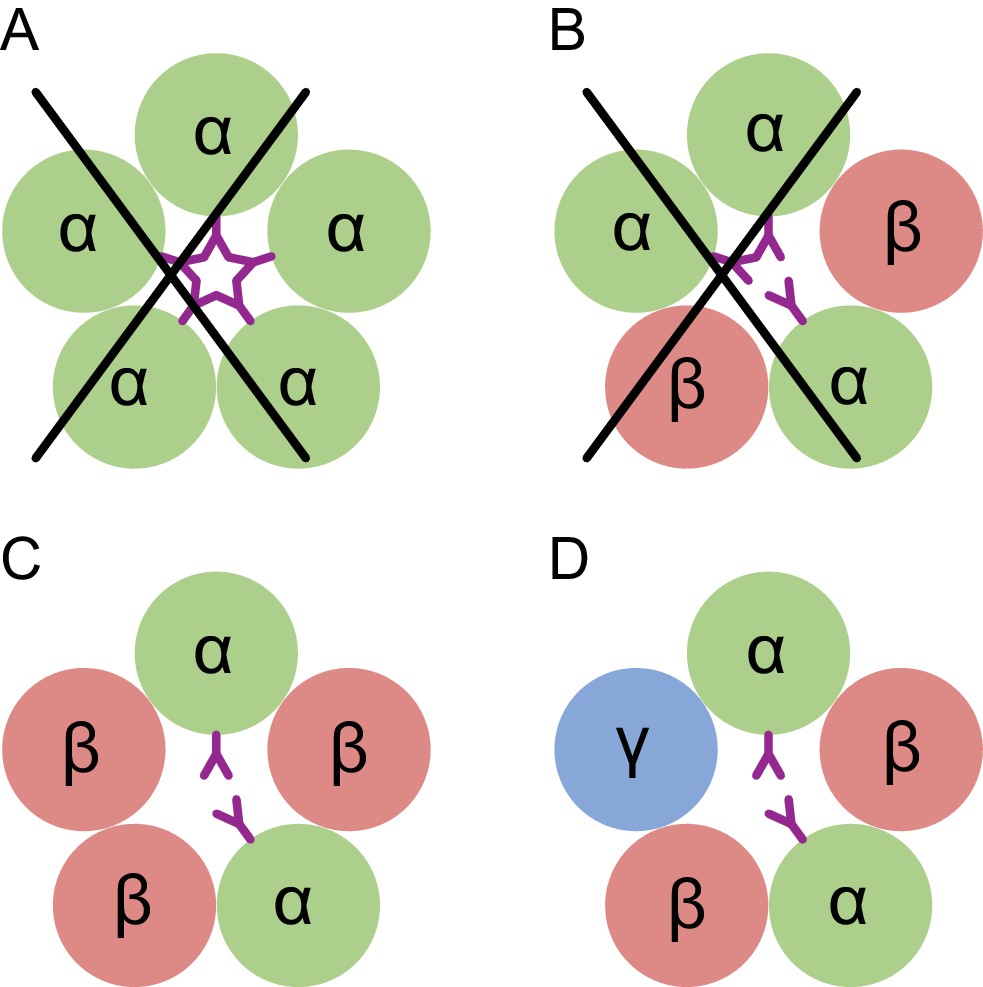
Conceptual schematic of tri-heteromeric receptor assembly.
Steric clashes prevent the formation of a pentameric receptor with more than 2 α subunits, while other combinations are allowed. Individual subunits are marked and shown as circles. The glycosylation of the α subunit at position Asn110 is shown as a purple ‘Y’.
Tables
Key resources table
| Reagent type (species) or resource | Designation | Source or reference | Identifiers | Additional information |
|---|---|---|---|---|
| Gene (Rattus norvegicus) | GBRB1_RAT | Synthetic | UniProtKB - P15431 | |
| Gene (Rattus norvegicus) | GBRA1_RAT | Gift from Dr. David S. Weiss | UniProtKB - P62813, Gene ID 29705 | |
| Gene (Rattus norvegicus) | GBRG2_RAT | Gift from Dr. David S. Weiss | UniProtKB - P18508, Gene ID 29709 | |
| Cell line (Homo Sapiens) | TSA201 | ATCC | ATCC Cat# CRL-11268, RRID:CVCL_1926 | |
| Antibody | 8E3 | OHSU VGTI, Monoclonal Antibody Core | Isotype: IgG2b, kappa | |
| Recombinant DNA reagent | pEG BacMam | doi: 10.1038/nprot.2014.173 | ||
| Chemical compound, drug | GABA | Sigma | CAT NO. A5835 | |
| Software, algorithm | Relion-2.1 | doi: 10.1016/j.jsb.2012.09.006 | RRID:SCR_016274 | https://www2.mrc-lmb.cam.ac.uk/relion/index.php?title=Main_Page |
| Software, algorithm | MotionCor2 | doi:10.1038/nmeth.4193 | http://msg.ucsf.edu/em/software/motioncor2.html | |
| Software, algorithm | Pymol | PyMOL Molecular Graphics System, Schrödinger, LLC | RRID:SCR_000305 | http://www.pymol.org/ |
| Software, algorithm | UCSF Chimera | doi:10.1002/jcc.20084 | RRID:SCR_004097 | http://plato.cgl.ucsf.edu/chimera/ |
| Software, algorithm | Bsoft | doi:10.1006/jsbi.2001.4339 | https://lsbr.niams.nih.gov/bsoft/ | |
| Software, algorithm | Localscale | doi:10.7554/eLife.27131 | https://git.embl.de/jakobi/LocScale | |
| Software, algorithm | Phenix | doi:10.1107/S2059798318006551 | RRID:SCR_014224 | https://www.phenix-online.org/ |
| Software, algorithm | Molprobity | doi:10.1107/S0907444909042073 | RRID:SCR_014226 | http://molprobity.biochem.duke.edu |
| Software, algorithm | cryoSparc | doi:10.1038/nmeth.4169 | https://cryosparc.com/ | |
| Software, algorithm | Gctf | doi:10.1016/j.jsb.2015.11.003 | https://www.mrc-lmb.cam.ac.uk/kzhang/Gctf/ | |
| Software, algorithm | DoG picker | doi: 10.1016/j.jsb.2009.01.004 | https://omictools.com/dog-picker-tool |
Additional files
-
Supplementary file 1
Statistics of data collection, 3D reconstruction and model.
- https://doi.org/10.7554/eLife.39383.022
-
Supplementary file 2
Statistics of solvent accessible surface area.
- https://doi.org/10.7554/eLife.39383.023
-
Transparent reporting form
- https://doi.org/10.7554/eLife.39383.024
Download links
A two-part list of links to download the article, or parts of the article, in various formats.
Downloads (link to download the article as PDF)
Open citations (links to open the citations from this article in various online reference manager services)
Cite this article (links to download the citations from this article in formats compatible with various reference manager tools)
Cryo-EM structure of the benzodiazepine-sensitive α1β1γ2S tri-heteromeric GABAA receptor in complex with GABA
eLife 7:e39383.
https://doi.org/10.7554/eLife.39383


