The distribution of antibiotic use and its association with antibiotic resistance
- Harvard T.H. Chan School of Public Health, United States
- Brigham and Women’s Hospital, Harvard Medical School, United States
- University of Toronto, Canada
- Boston Children’s Hospital, United States
- Harvard Medical School, United States
Figures
Figure 1 with 1 supplement
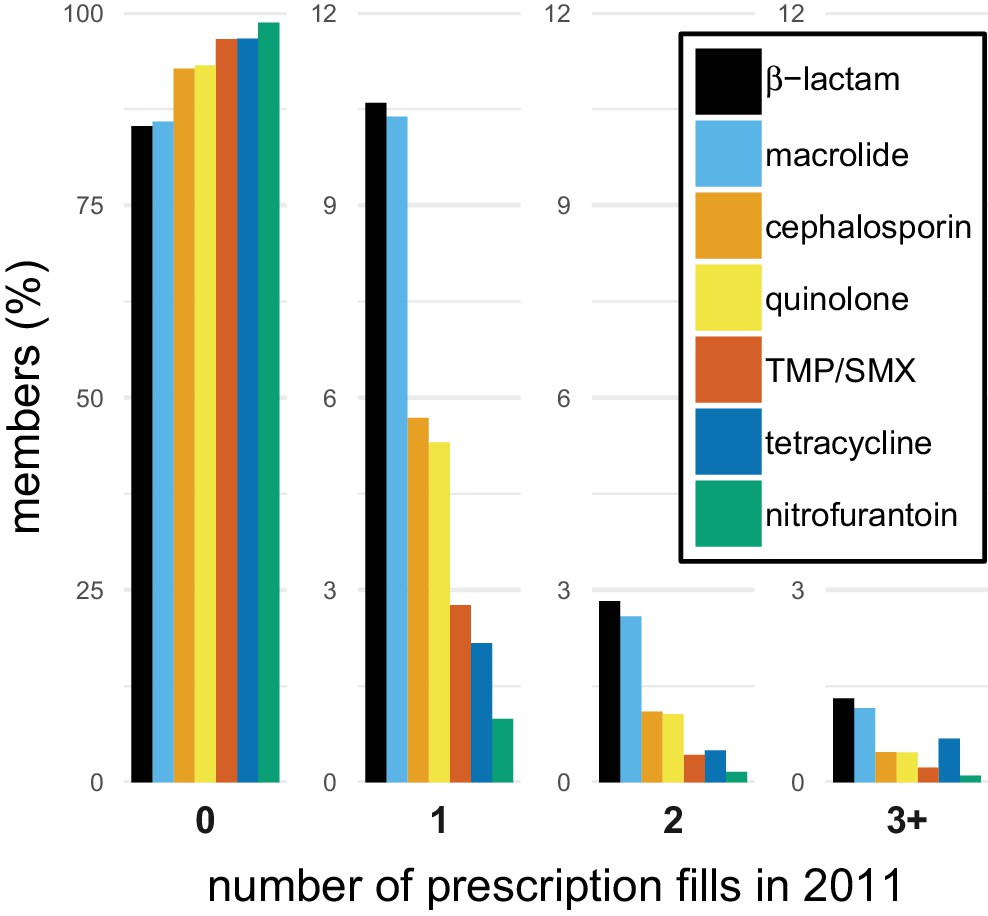
The distribution of antibiotic use within individuals.
Bars indicate the proportion of members in the MarketScan data with different numbers of prescription fills in 2011 for each of the drug groups. TMP/SMX: trimethoprim/sulfamethoxazole.
Figure 1—figure supplement 1
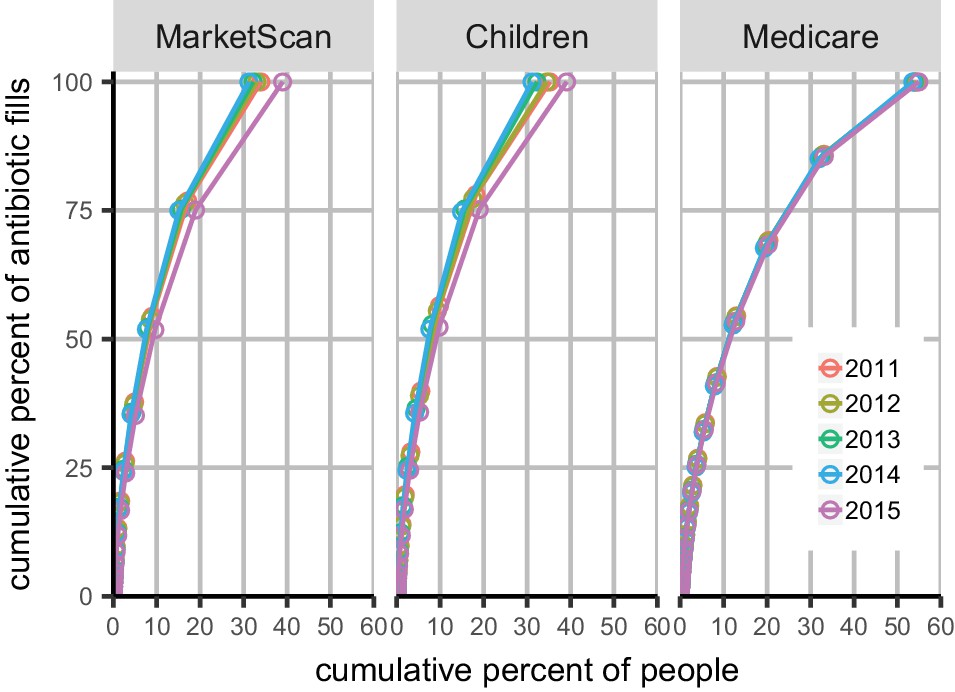
Cumulative distribution of antibiotic use.
Each point represents a group of people with a certain number of associated claims for any antibiotic, starting at the left with the members with the greatest number of claims. The upper-right line segment shows members with one claim, the next segment shows members with two claims, etc. Colors indicate data years. Panels indicate study population. MarketScan: main data set. Children: MarketScan data including only members 15 and younger.
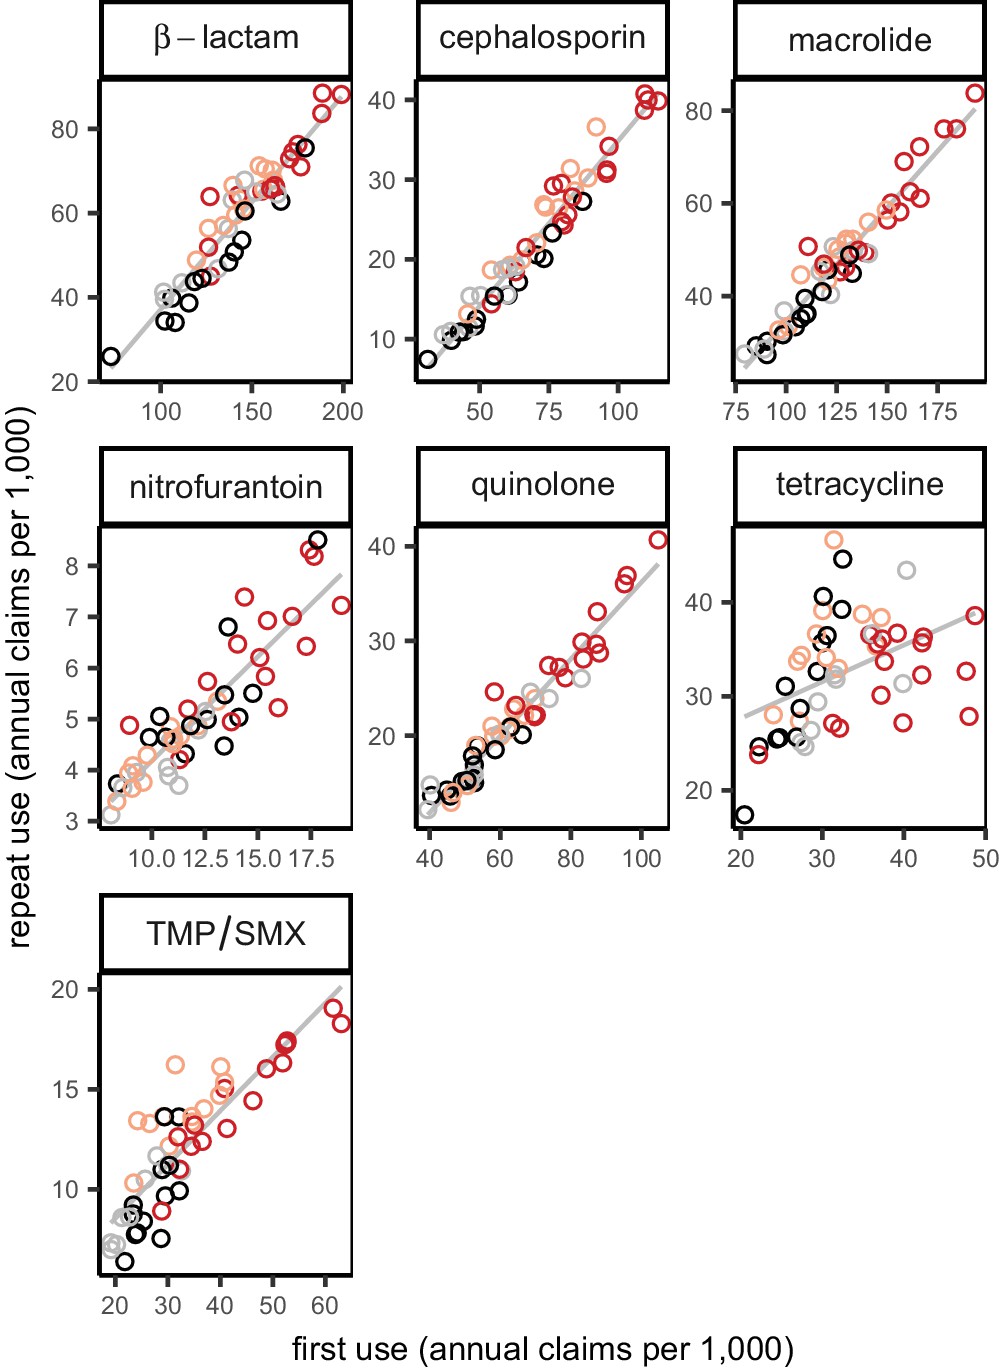
Figure 2 with 3 supplements
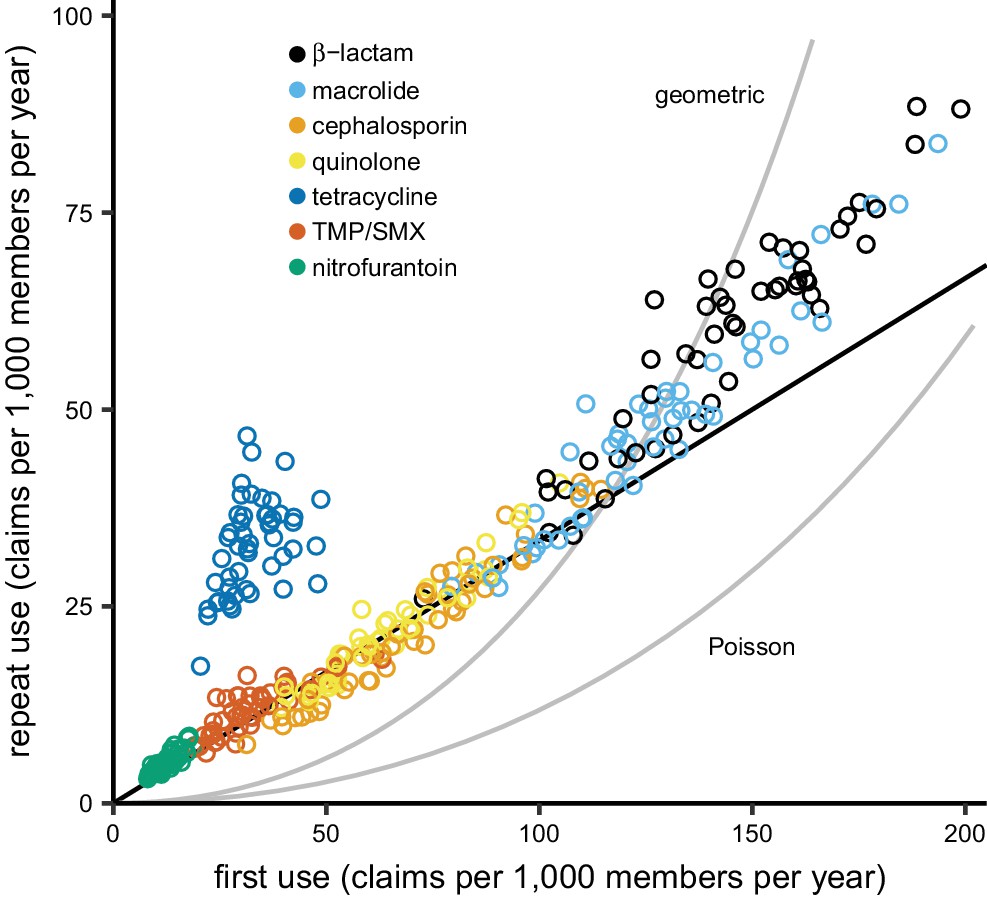
The distribution of antibiotic use across US states.
Each point indicates first use and repeat use of a single drug group in a single US state (averaged over the data years). Points falling on the black line have three times as much first use as repeat use (i.e. repeat use is one-quarter of total use). The curves show the relationships between first use and repeat use expected from the Poisson and geometric distributions. TMP/SMX: trimethoprim/sulfamethoxazole.
Figure 2—figure supplement 1
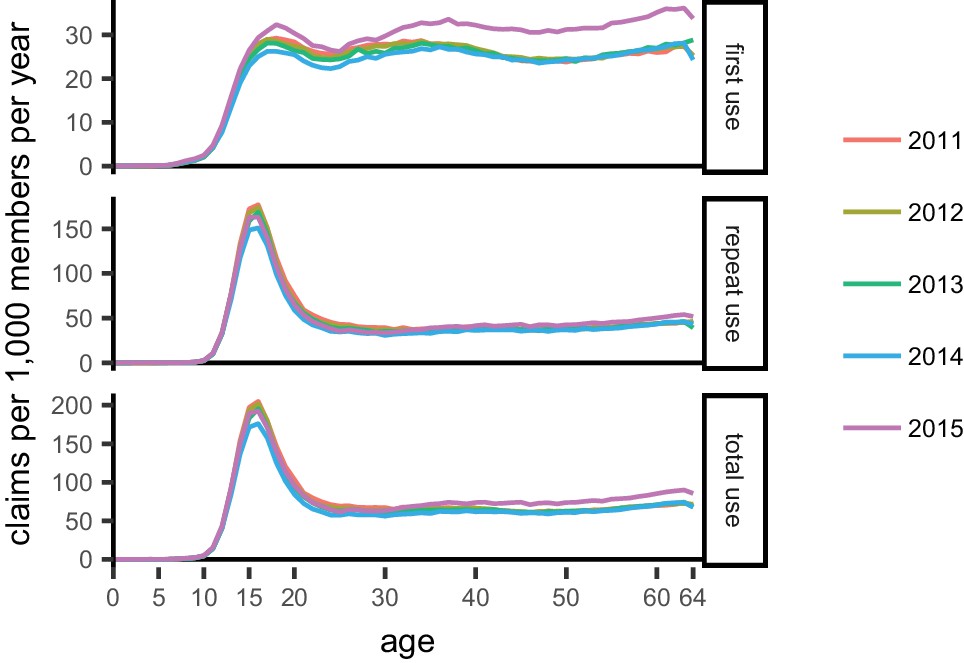
Distribution of tetracycline use by age.
Colors indicate data years.
Figure 2—figure supplement 2

Distribution of antibiotic use by population.
Each point represents average use of a drug group in a state across data years. Children: MarketScan data including only members 15 and younger.
Figure 2—figure supplement 3
Distribution of antibiotic use by region.
Each point shows use for a drug group in a state, averaged over data years. Colors indicate US Census region (red, South; light red, Midwest; gray, Northeast; black, West). Line shows unweighted linear best fit.
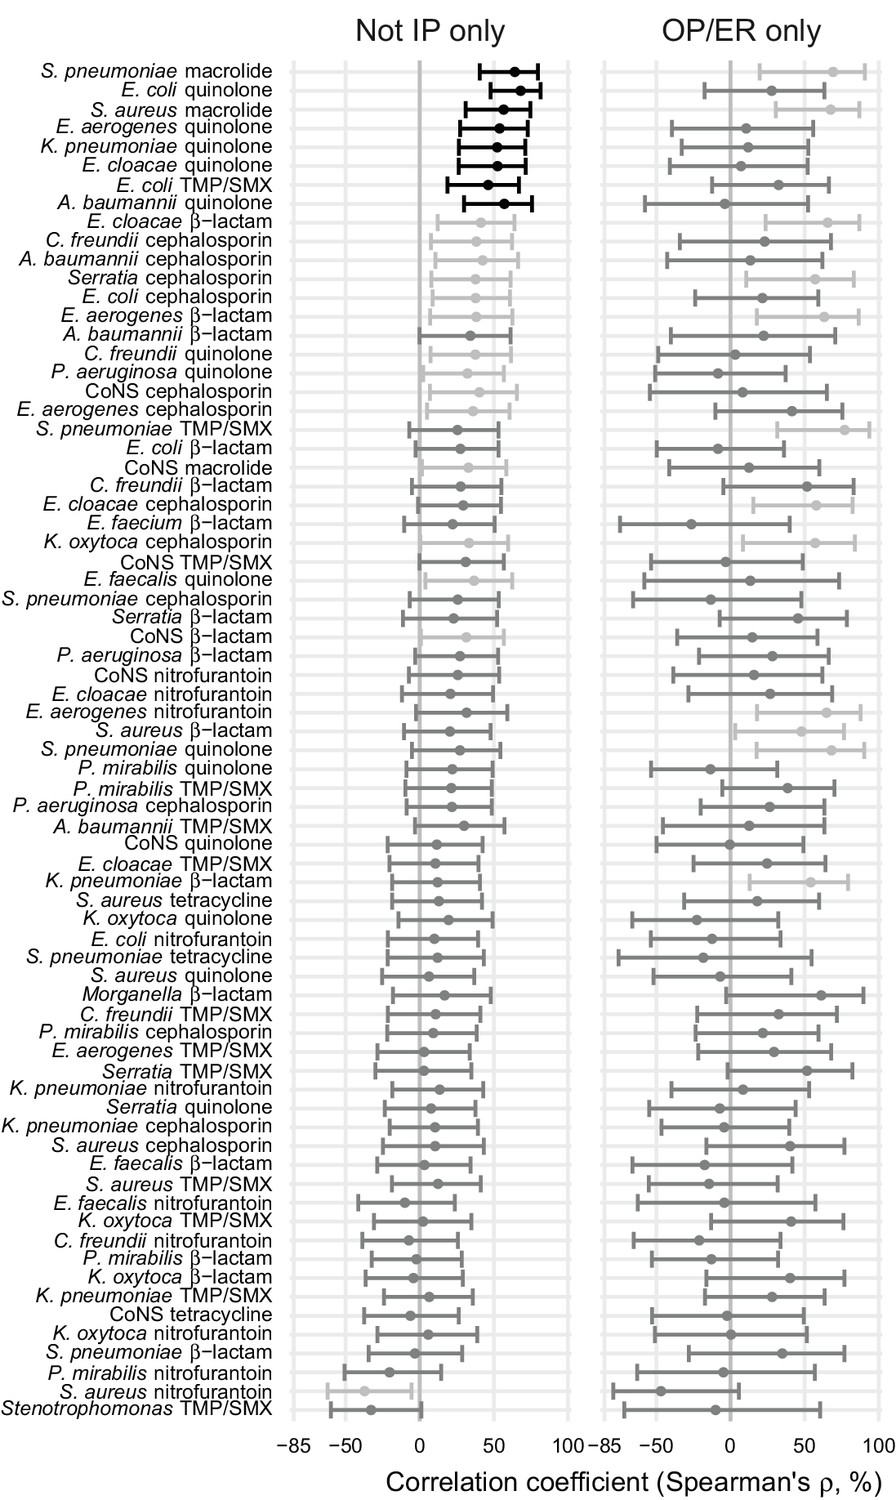
Figure 3 with 1 supplement

Correlations between total antibiotic use and resistance are biased toward positive values.
Error bars show 95% confidence intervals. The color strip visually displays the drug groups. Statistical significance is indicated by color of the points (black, significant at FDR = 0.05, two-tailed; dark gray, significant at α = 0.05, two-tailed; light gray, not significant). TMP/SMX: trimethoprim/sulfamethoxazole. CoNS: coagulase-negative Staphylococcus.
-
Figure 3—source data 1
Antibiotic use data.
For each data source (MarketScan or Medicare), data subset or population among MarketScan records, state (with masked ID), and drug group, annual first and repeat claims per 1000 members. Main: main data set. Children: members at most 15 years old. Days supply: first and repeat use are reported as days supply, not claims. Multiyear: among members in the data for all four data years.
- https://doi.org/10.7554/eLife.39435.010
-
Figure 3—source data 2
Antibiotic resistance data.
For each adequately-represented pathogen and drug group (see Materials and methods) and state (with masked ID matching the antibiotic use data), the proportion of isolates collected in that state susceptible to that drug.
- https://doi.org/10.7554/eLife.39435.011
Figure 3—figure supplement 1
Correlations between total antibiotic use and resistance using subsets of the resistance data.
Error bars show 95% confidence intervals. Statistical significance is indicated by color of the points (black, significant at FDR = 0.05, two-tailed; dark gray, significant at α = 0.05, two-tailed; light gray, not significant). IP: inpatient. OP/ER: outpatient/emergency room. TMP/SMX: trimethoprim/sulfamethoxazole. CoNS: coagulase-negative Staphylococcus.
Figure 4
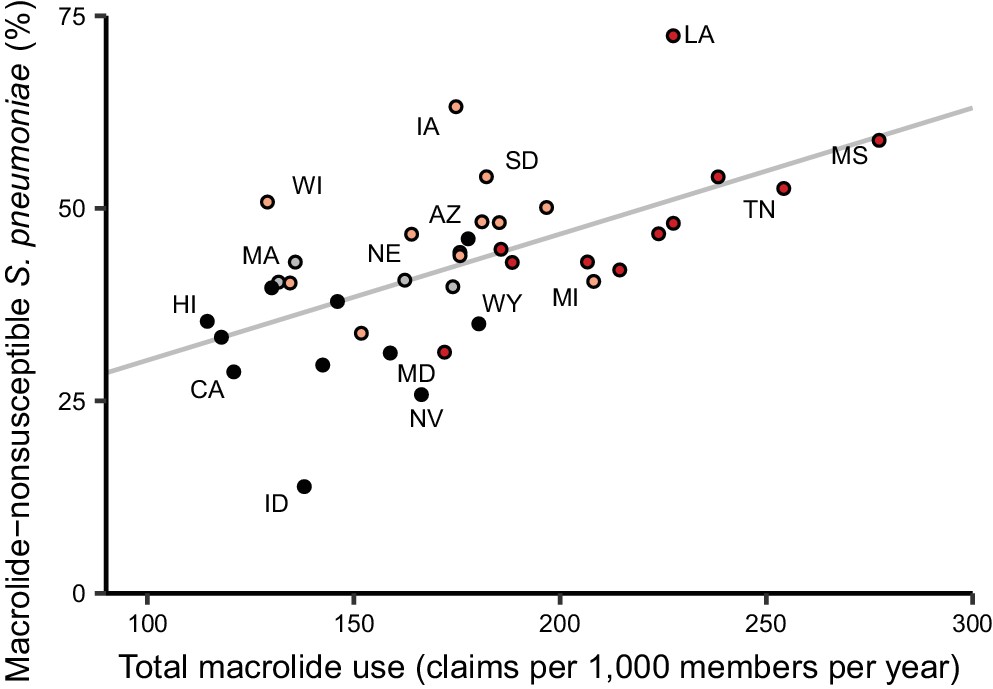
Total macrolide use and macrolide resistance among Streptococcus pneumoniae correlate across US states.
Labels indicate selected states. Colors indicate US Census region (red, South; light red, Midwest; gray, Northeast; black, West). Line shows unweighted linear best fit. Southern states have highest macrolide use and resistance.
Figure 5
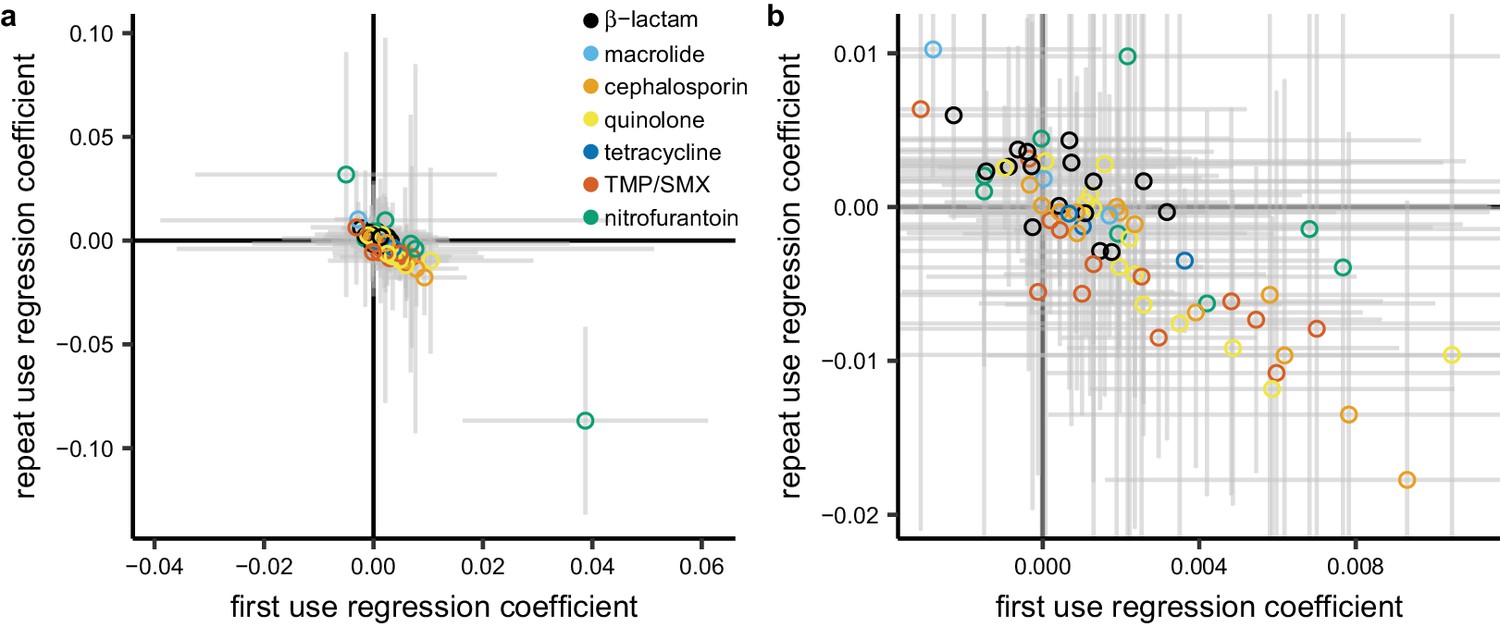
Repeat use tends to be negatively associated with resistance when controlling for first use.
Each point represents a pathogen-antibiotic combination. The position of the point shows the two coefficients from the multiple regression. The units of the coefficients are proportion resistant per annual claim per 1000 people. Color indicates drug group. Error bars show 95% CIs. (a) All data. (b) Same data, showing only the center cluster of points.
Additional files
-
Supplementary file 1
Supplemental tables.
- https://doi.org/10.7554/eLife.39435.014
-
Transparent reporting form
- https://doi.org/10.7554/eLife.39435.015
Download links
A two-part list of links to download the article, or parts of the article, in various formats.
Downloads (link to download the article as PDF)
Open citations (links to open the citations from this article in various online reference manager services)
Cite this article (links to download the citations from this article in formats compatible with various reference manager tools)
The distribution of antibiotic use and its association with antibiotic resistance
eLife 7:e39435.
https://doi.org/10.7554/eLife.39435


