Integrated externally and internally generated task predictions jointly guide cognitive control in prefrontal cortex
- Stanford University, United States
- Duke University, United States
Figures
Figure 1
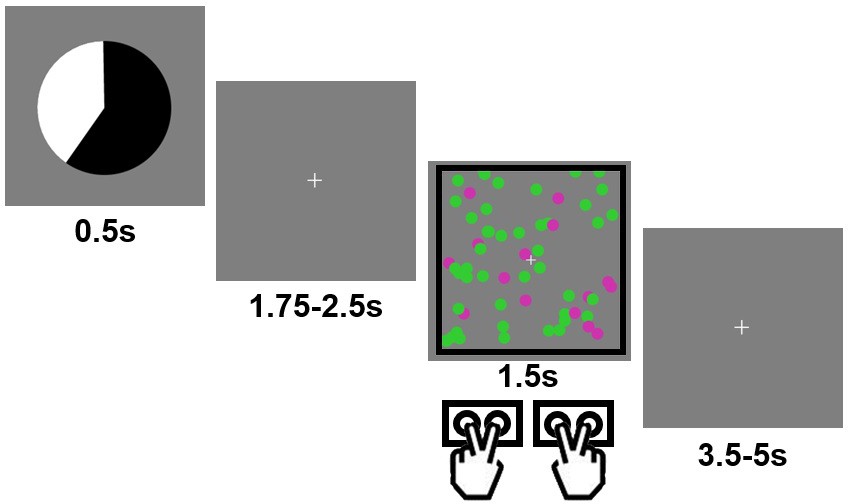
Example trial in the experimental task.
Each trial started with a pie chart, whose proportions of black/white area predicted the probability of encountering a black vs. white frame surrounding the forthcoming cloud of moving, colored dots. The frame color cued the task to be performed (color vs. motion categorization).
Figure 2
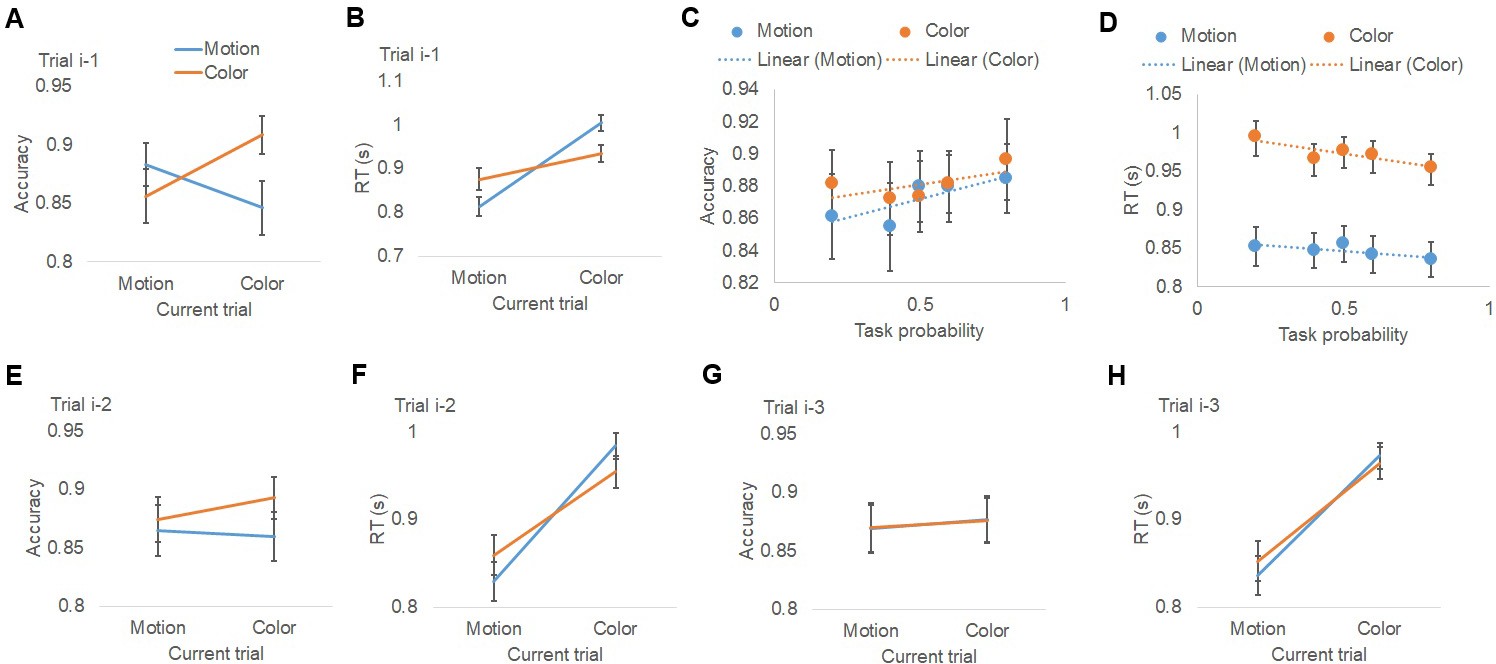
Behavioral results.
(A, B) Group mean (±MSE) of accuracy (A) and RT (B), plotted as a function of task on the previous trial (i-1) and current trial. Results for trials i-2 and i-3 are plotted similarly in (E, F) and (G, H), respectively. (C, D) Group mean (±MSE) of accuracy (C) and RT (D), plotted as a function of (i) the pre-cue’s prediction of encountering the actual task and (ii) the task on the current trial.
Figure 3
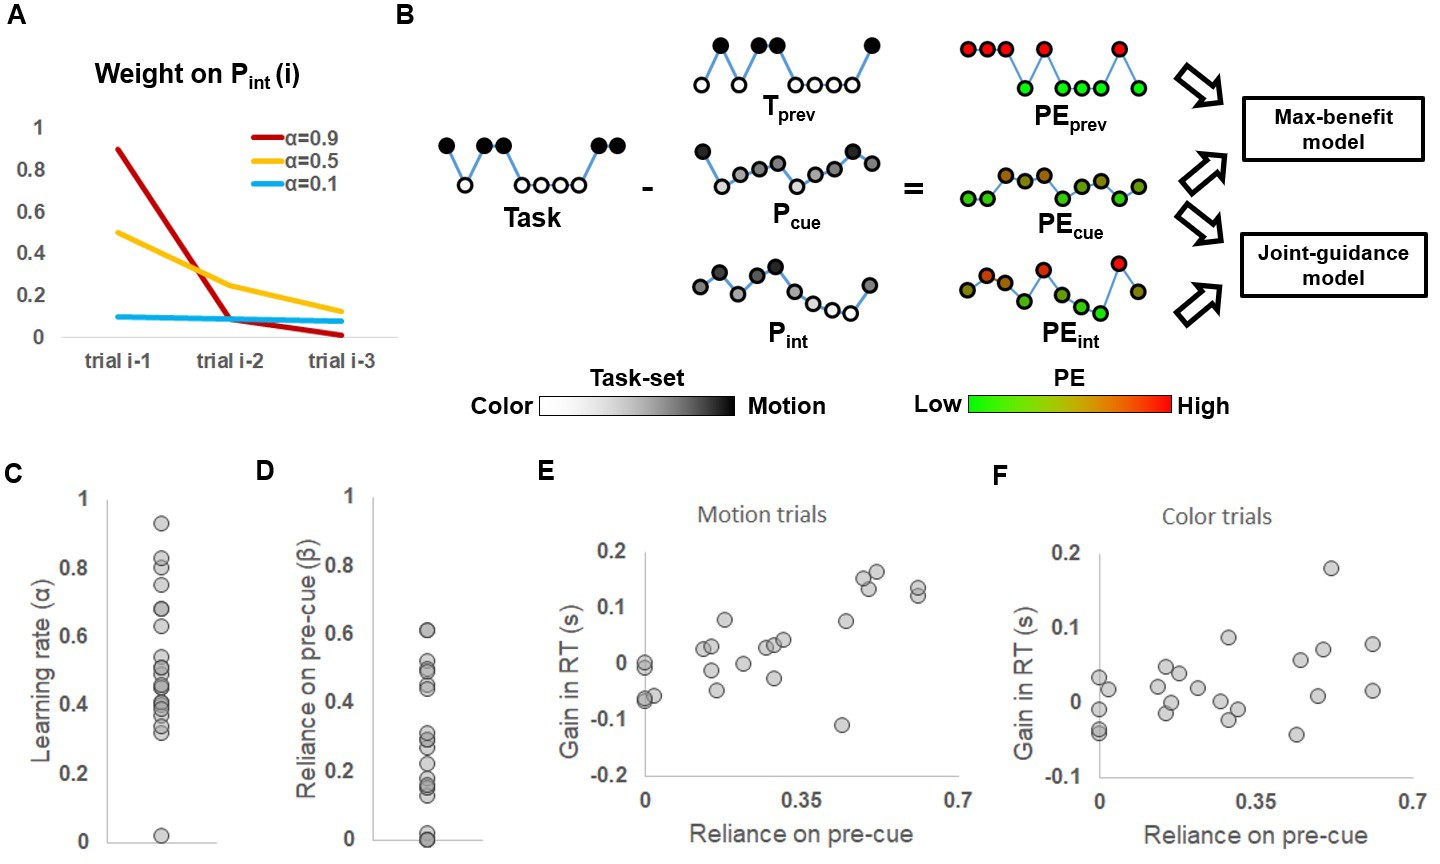
Model-based behavioral results.
(A) Weights of older trials on determining Pint, plotted as a function of different learning rates. (B) Illustration of model comparison. Given a trial sequence of tasks and the time course of a model variable (depicted as a string of nodes, with the height and brightness of the nodes coding the task-set), its corresponding time course of (unsigned) PE (with the height and the color of the nodes coding the magnitude of the PE) was calculated. The max-benefit model consisted of PEprev and PEcue; and the joint-guidance model consisted of PEint and PEcue. (C) Distribution of individual learning rates. (D) Distribution of the reliance on pre-cue relative to the self-generated task prediction. (E, F) Gain in RT when the pre-cue was informative relative to when the pre-cue was non-informative, plotted as a function of the reliance on pre-cue. (E) and (F) show results for motion and color trials, respectively.
Figure 4 with 2 supplements
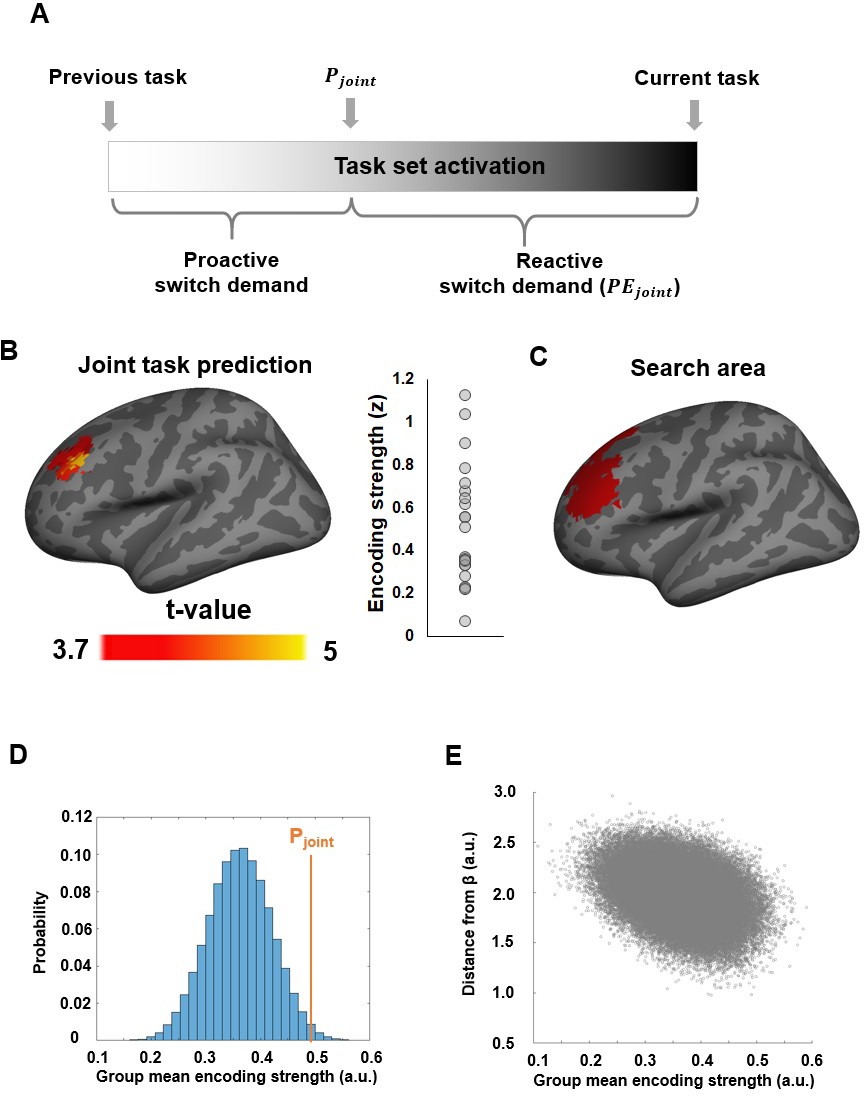
Neural representation of the joint task prediction.
(A) Illustration of how Pjoint is translated into proactive and reactive switch demand in relation to previous and forthcoming task demand. (B) Left: An MFG region showing significantly above-chance encoding of the joint task prediction. Right: Individual ROI-mean encoding strength (in z-score). (C) The dlPFC ROI (in red) defined by any linear combination of Pcue and Pintrepresentation. (D) Histogram showing the encoding strength of pseudo-Pjoint based on randomly sampled β parameters using fMRI data in (B). (E) Encoding strength shown in (D), plotted as a function of the distance from Pjoint.
Figure 4—figure supplement 1
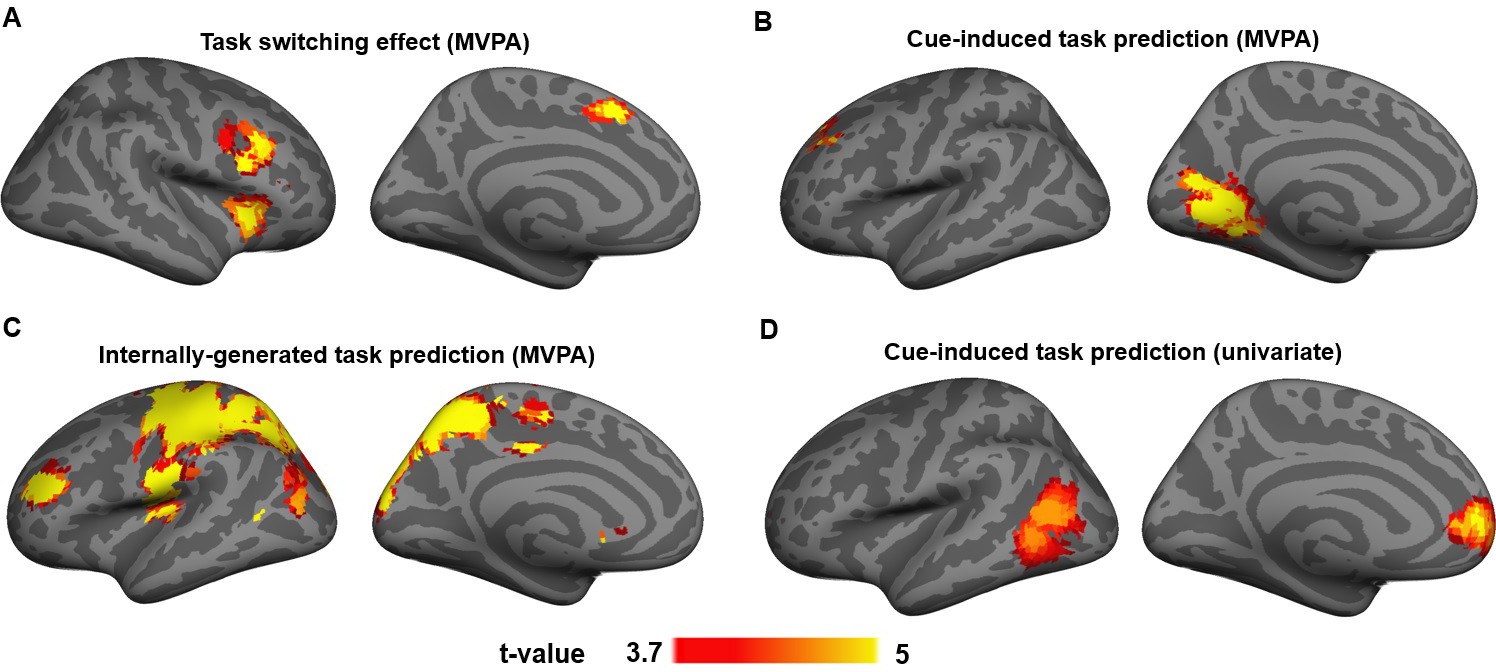
To validate the MVPA approach, we first leveraged the classic task switching effect observed in the behavioral data, and tested whether task transitions (task-repeat trials vs. task-switch trials) could be decoded from fMRI data time-locked to the onset of the task cue and stimulus, as shown in previous studies (Jimura et al., 2014; Qiao et al., 2017).
(A) This analysis revealed significant decoding of task transition (p<0.05, corrected) in bilateral dmPFC, caudal right inferior frontal gyrus, and right anterior insula. These regions have been consistently implicated in task switching in previous fMRI studies (for review, see Ruge et al., 2013). We next sought to identify brain regions that encoded cue-induced and internally generated task predictions at the time of the pre-cue onset. MVPA revealed reliable encoding (p<0.05, corrected) of Pcue in frontal and visual cortex. (B) Specifically, task predictions based on the explicit cue were represented left superior frontal gyrus (BA 9), as well as in bilateral anterior calcarine fissure and lingual gyrus (LG, Figure 4—figure supplement 1B). (C) By contrast, encoding of the internally generated task predictions (Pint) was found in a wider set of regions, including bilateral superior parietal cortex, precuneus and middle cingulate cortex, the left caudate head, left middle frontal gyrus, and motor/somatosensory cortex. These regions were spatially distinct from the regions representing explicit cue-induced task prediction. (D) The encoding of the externally generated task predictions using univariate analysis revealed a different pattern from (B), suggesting that the MVPA findings in (B) are not purely driven by univariate effects.
Figure 4—figure supplement 2
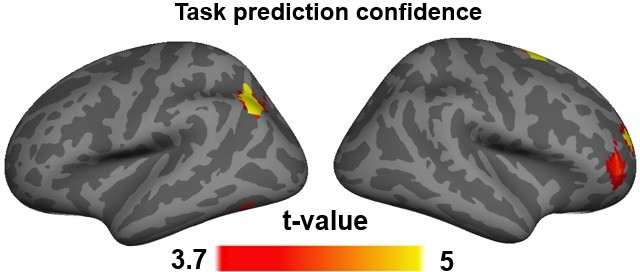
In addition to the expected task-set, Pjoint can also be thought of as indicating the confidence of the prediction, with the lowest degree of confidence reflected by Pjoint = 0.5 (i.e., no preference for either task).
We can therefore quantify task prediction confidence as |Pjoint – 0.5|. Searchlight activity patterns at the onset of the pre-cue displayed above-chance encoding of the confidence of task prediction in left IPL/IPS, left lingual gyrus, right superior frontal gyrus and right FPC.
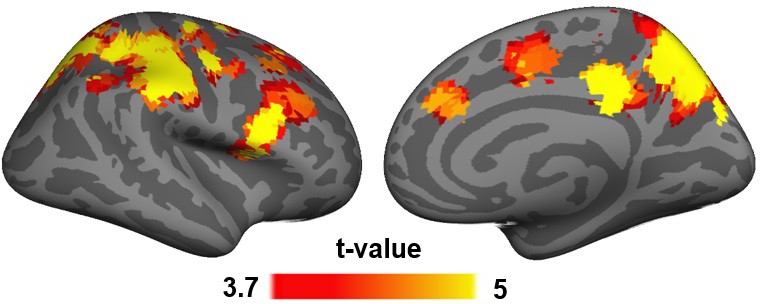
Figure 5

Neural encoding of proactive task switch demand.
(A) T-statistics maps of brain regions showing significantly above-chance encoding of proactive task switch demand at the onset of the pre-cue. (B) Individual ROI-mean encoding strength of proactive task switch demand.
Figure 6 with 1 supplement
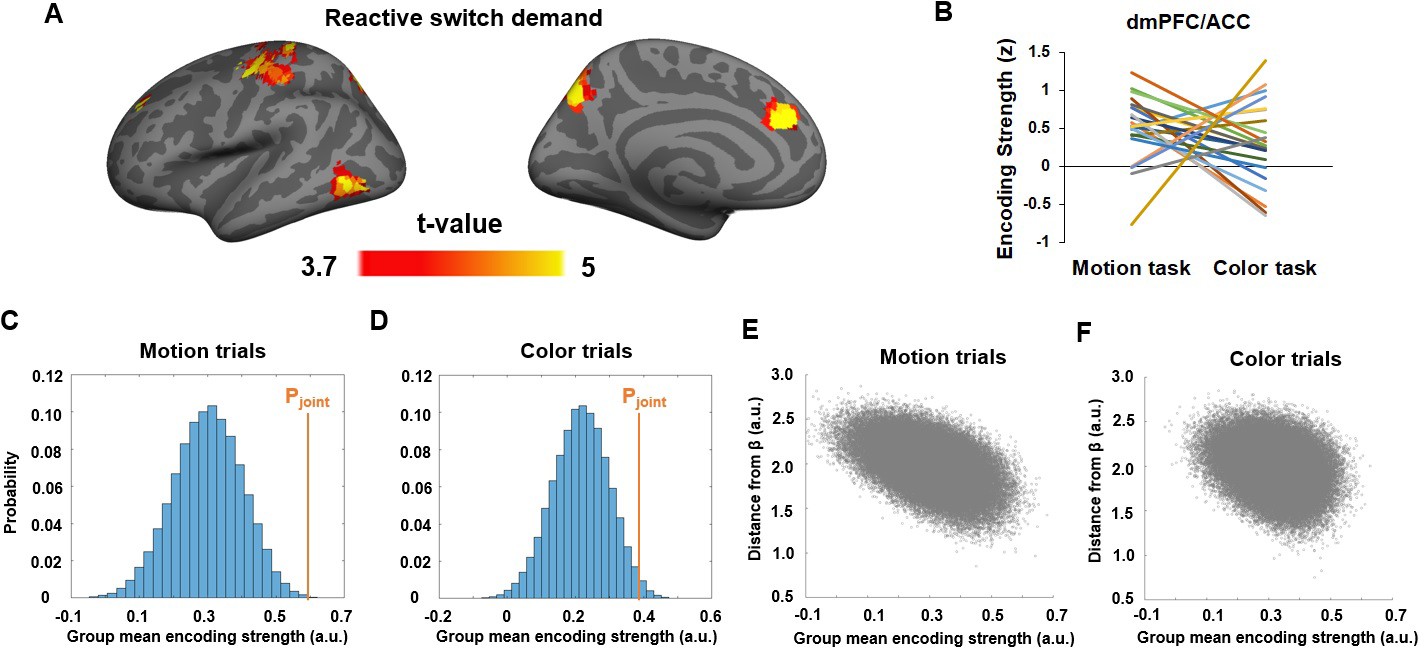
Neural representation of the joint task prediction error (PEjoint).
(A) T-statistics maps of brain regions showing significantly above-chance encoding of PEjoint. (B) Encoding strength (z-score) of PEjoint in the dmPFC/ACC cluster, plotted as a function of task. Each line represents one subject. (C,D) Histogram showing the encoding strength of pseudo-PEjoint based on randomly sampled β parameters and fMRI data in the dmPFC/ACC cluster in motion (C) and color (D) trials. (E) Encoding strength shown in (C), plotted as a function of the distance from PEjoint. (F) Encoding strength shown in (D), plotted as a function of the distance from PEjoint.
Figure 6—figure supplement 1
MVPA results showing neural representation of prediction error of internal task prediction at the onset of the task stimulus.
https://doi.org/10.7554/eLife.39497.012
Figure 7

Illustration of the MVPA procedure.
Training data were used to estimate the weights that fit (either linear-fitting or logistic regression) voxel-wise estimated fMRI activity (A1) to model estimates (y1) in a trial-by-trial manner. The weights were then applied to test fMRI data (A2) to predict the hypothetical BOLD signal in test data (y2). The goodness of prediction, or presentation strength, is measured by the correlation between predicted BOLD signal (Simy2) and y2.
Tables
Table 1
Descriptive statistics (group mean ± MSE) of behavioral data.
https://doi.org/10.7554/eLife.39497.004| Task prediction | 0.2 | 0.4 | 0.5 | 0.6 | 0.8 |
|---|---|---|---|---|---|
| Color trial accuracy | 0.88 ± 0.02 | 0.87 ± 0.02 | 0.87 ± 0.02 | 0.88 ± 0.02 | 0.90 ± 0.03 |
| Color trial RT (s) | 1.00 ± 0.02 | 0.97 ± 0.02 | 0.98 ± 0.02 | 0.97 ± 0.02 | 0.96 ± 0.02 |
| Motion trial accuracy | 0.86 ± 0.03 | 0.86 ± 0.03 | 0.88 ± 0.02 | 0.88 ± 0.02 | 0.88 ± 0.02 |
| Motion trial RT (s) | 0.85 ± 0.03 | 0.85 ± 0.02 | 0.86 ± 0.02 | 0.84 ± 0.02 | 0.84 ± 0.02 |
Table 2
Summary of model variables used in this study.
Abbreviations: T = task; cur = current trial; prev = previous trial; p=prediction; int = internal.
| Variable | Meaning | Definition/range |
|---|---|---|
| Tcur | Task required on the current trial | 0 if motion task; 1 if color task. |
| Tprev | Task required on the previous trial | Same as above |
| i | Trial index | |
| Pcue | Probability of encountering a color task indicated by the pre-cue | 0.2, 0.4, 0.5, 0.6 or 0.8, depending on pre-cue |
| α | Learning rate | [0, 1] |
| Pint | Internally generated task prediction | (1 - α)Pint(i-1) + αTprev |
| Pjoint | Joint task prediction | (1-β)Pint +βPcue |
| PEcue | Prediction error of Pcue | |Tcur - Pcue| |
| PEint | Prediction error of Pint | |Tcur - Pint| |
| PEprev | Task switch effect | |Tcur - Tprev| |
| PEjoint | Prediction error Pjoint | |Tcur - Pjoint| |
| Modulation of PEcue on RT | ||
| Modulation of PEint on RT | ||
| β | scaled reliance on the pre-cue | |
| Randomly sampled reliance on the pre-cue | ||
| Proactive switch demand | |Tprev - Pjoint| | |
| Confidence of joint task prediction | |Pjoint – 0.5| | |
| Proactive interference effect | |Pint-Pcue| |
Additional files
-
Transparent reporting form
- https://doi.org/10.7554/eLife.39497.014
Download links
A two-part list of links to download the article, or parts of the article, in various formats.
Downloads (link to download the article as PDF)
Open citations (links to open the citations from this article in various online reference manager services)
Cite this article (links to download the citations from this article in formats compatible with various reference manager tools)
Integrated externally and internally generated task predictions jointly guide cognitive control in prefrontal cortex
eLife 7:e39497.
https://doi.org/10.7554/eLife.39497


