Biophysical models reveal the relative importance of transporter proteins and impermeant anions in chloride homeostasis
- University of Cape Town, South Africa
- Cape Town University, South Africa
- University of Oxford, United Kingdom
- University of Iowa, United States
Figures
Figure 1 with 2 supplements
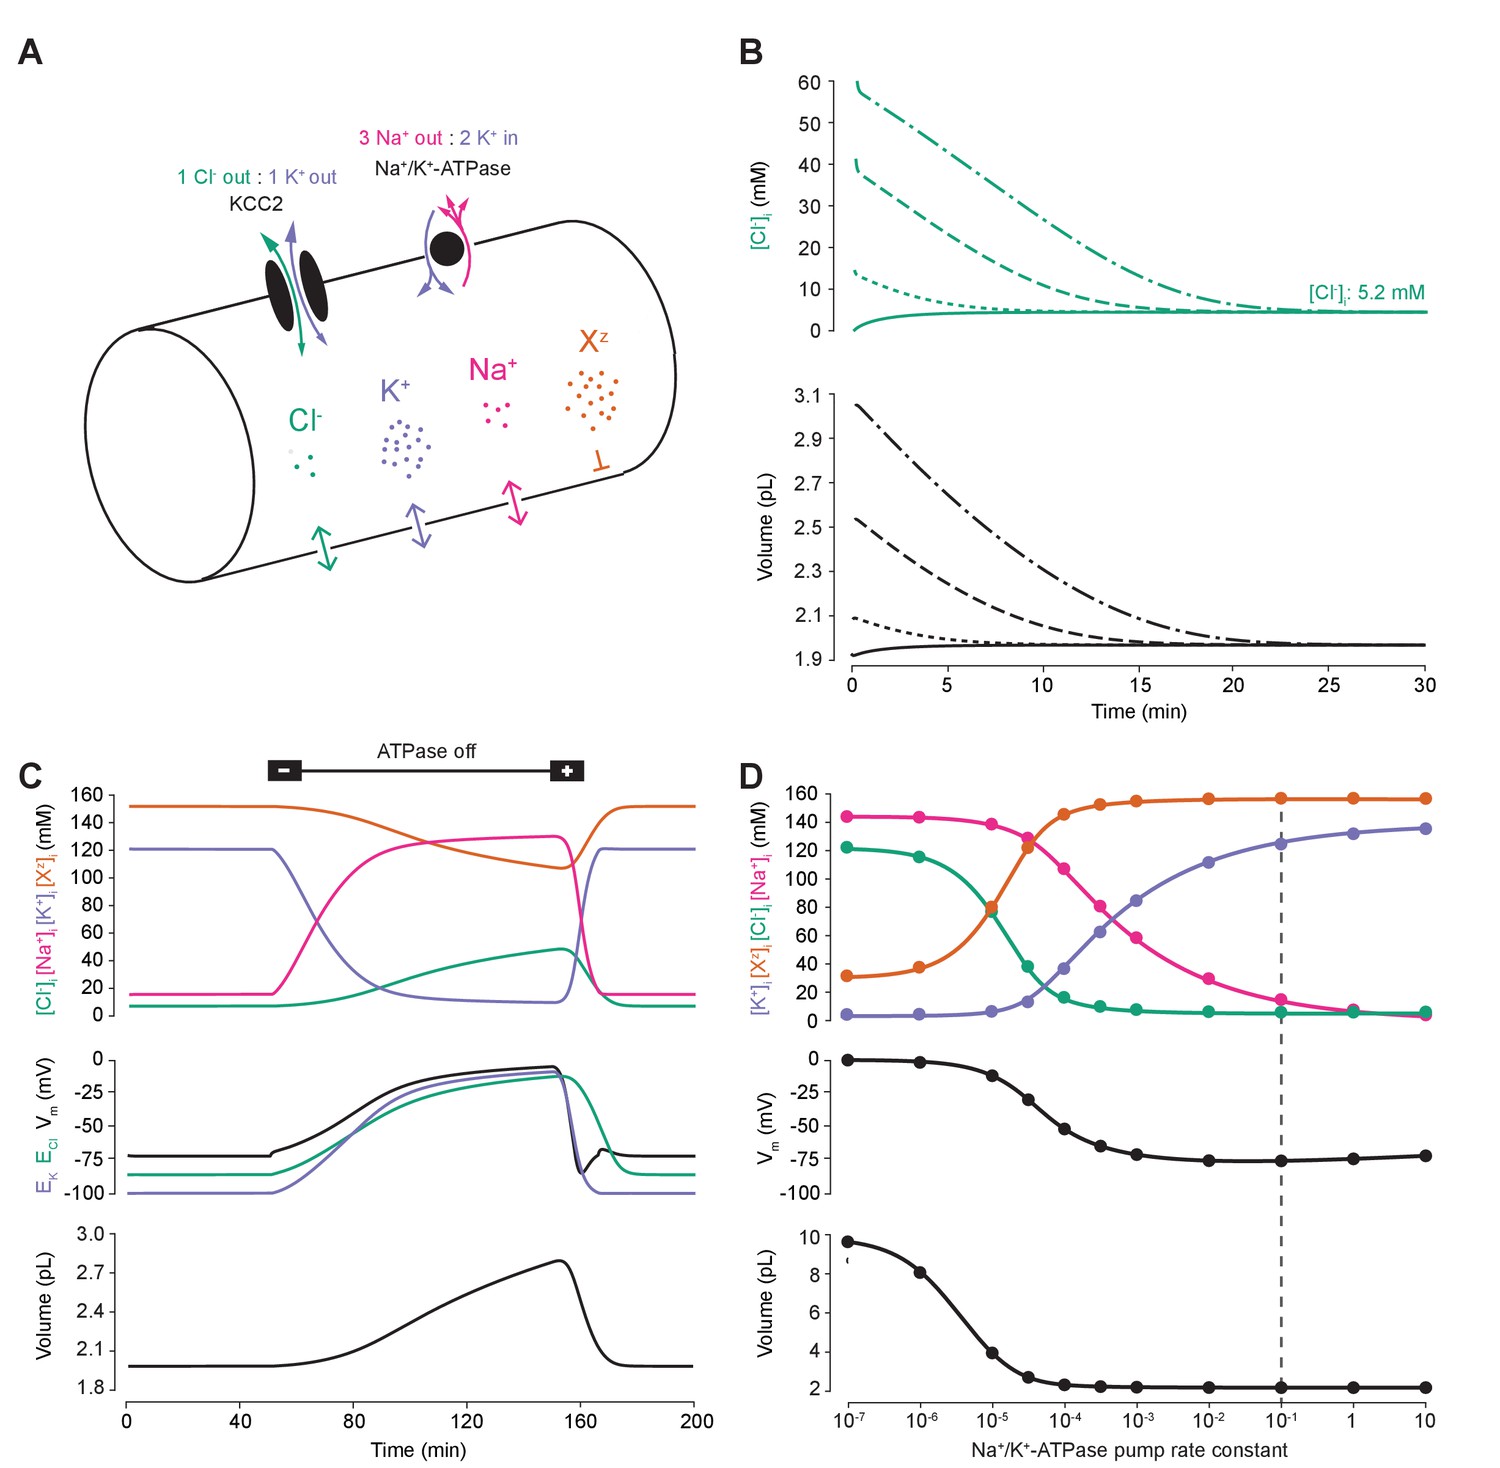
A biophysical model of ion dynamics based on the pump-leak mechanism demonstrates the importance of the sodium-potassium ATPase for setting transmembrane ion gradients including chloride.
(A) A single-cell compartment was modeled as a cylinder with volume changes equivalent to changes in cylindrical radius. Dynamics of membrane permeable potassium (purple, K+), sodium (pink, Na+) and chloride (green, Cl-) ions were included. Impermeant anions (orange, Xz) had a mean intracellular charge z of -0.85. The KCC2 transporter moved Cl- and K+ in equal parts according to the transmembrane gradient for the two ions. The Na+/ K+ ATPase transported 3 Na+ ions out for 2 K+ ions moved into the cell. (B) Regardless of intracellular starting concentrations of the permeable ions, the model converged to identical steady state values for all parameters without needing to include any means for ‘sensing’ ion concentration, volume or voltage. We show the result for Cl- as a time series of [Cl-]i (top panel) and volume (bottom panel). (C) The ATPase plays a key role in maintaining steady state ion concentration, membrane voltage (Vm) and volume. Switching off the ATPase results in a continuous increase in cell volume (bottom panel), membrane depolarization (middle panel) and ion concentration dysregulation (top panel with colours per ion as in ‘A’). All cellular parameters recovered when the ATPase was reactivated. (D) The model’s analytic solution showed exact correspondence with steady state values generated by numerical, time series runs (dots) for varying ATPase pump rates. Steady state values for the concentrations of the ions with colours as in ‘A’ (top panel); Vm (middle panel) and volume (bottom panel). The dashed line indicates the default ATPase pump rate used in all simulations unless specified otherwise. The result in ‘B’ was replicated with Hamada et al.’s experimentally validated model of the ATPase in Figure 1—figure supplement 1B, and the models’ respective pump fluxes are compared in Figure 1—figure supplement 1A. Note that although sufficient Na+/K+-ATPase activity is critical for steady state ionic gradients these variables are relatively stable near the default pump rate (dashed line), Figure 1—figure supplement 2.
Figure 1—figure supplement 1
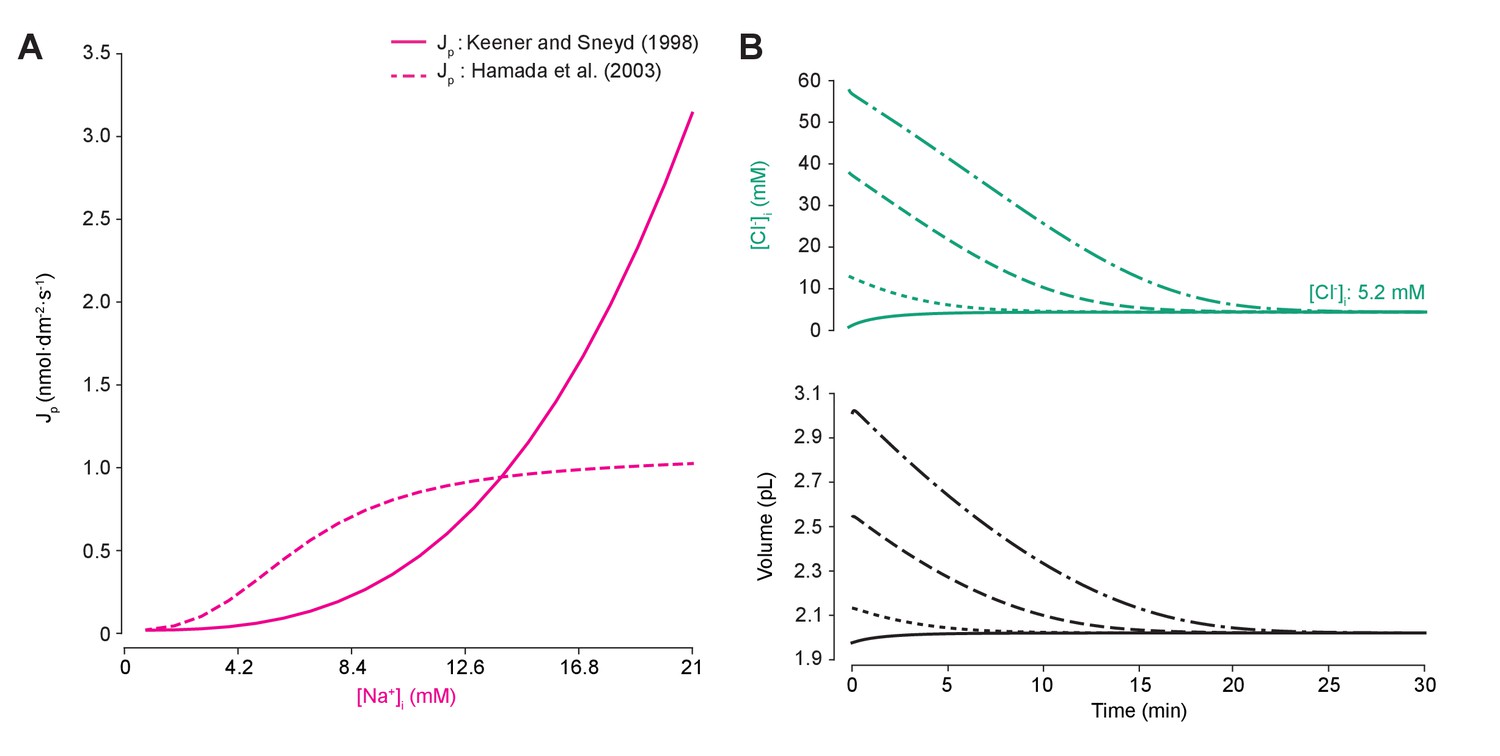
Different models of the sodium-potassium ATPase have distinct kinetic properties but produce similar qualitative effects.
(A) Comparison of pump rate of different ATPase models against input sodium concentration. The model by Keener and Sneyd (1998) (solid line) is explained in the main paper methods. The Hamada et al. (2003) method (dashed line) is based on experimental evidence fitted by Hill equations (Hamada et al., 2003). The simplified equation follows: , wherewas set such that the same steady state concentration of Na+ ions (and indeed of all ions) was achieved using either model, with units as for P the pump rate constant. (B) Figure 1B was run using the Hamada et al. (2003) model. As for the standard ATPase model, regardless of intracellular starting concentrations of the permeable ions, the model converged to identical steady state values for all parameters without needing to include any means for ‘sensing’ ion concentration, volume or voltage. We show the result for Cl- as a time series of [Cl-]i (top panel) and volume (bottom panel).
Figure 1—figure supplement 2
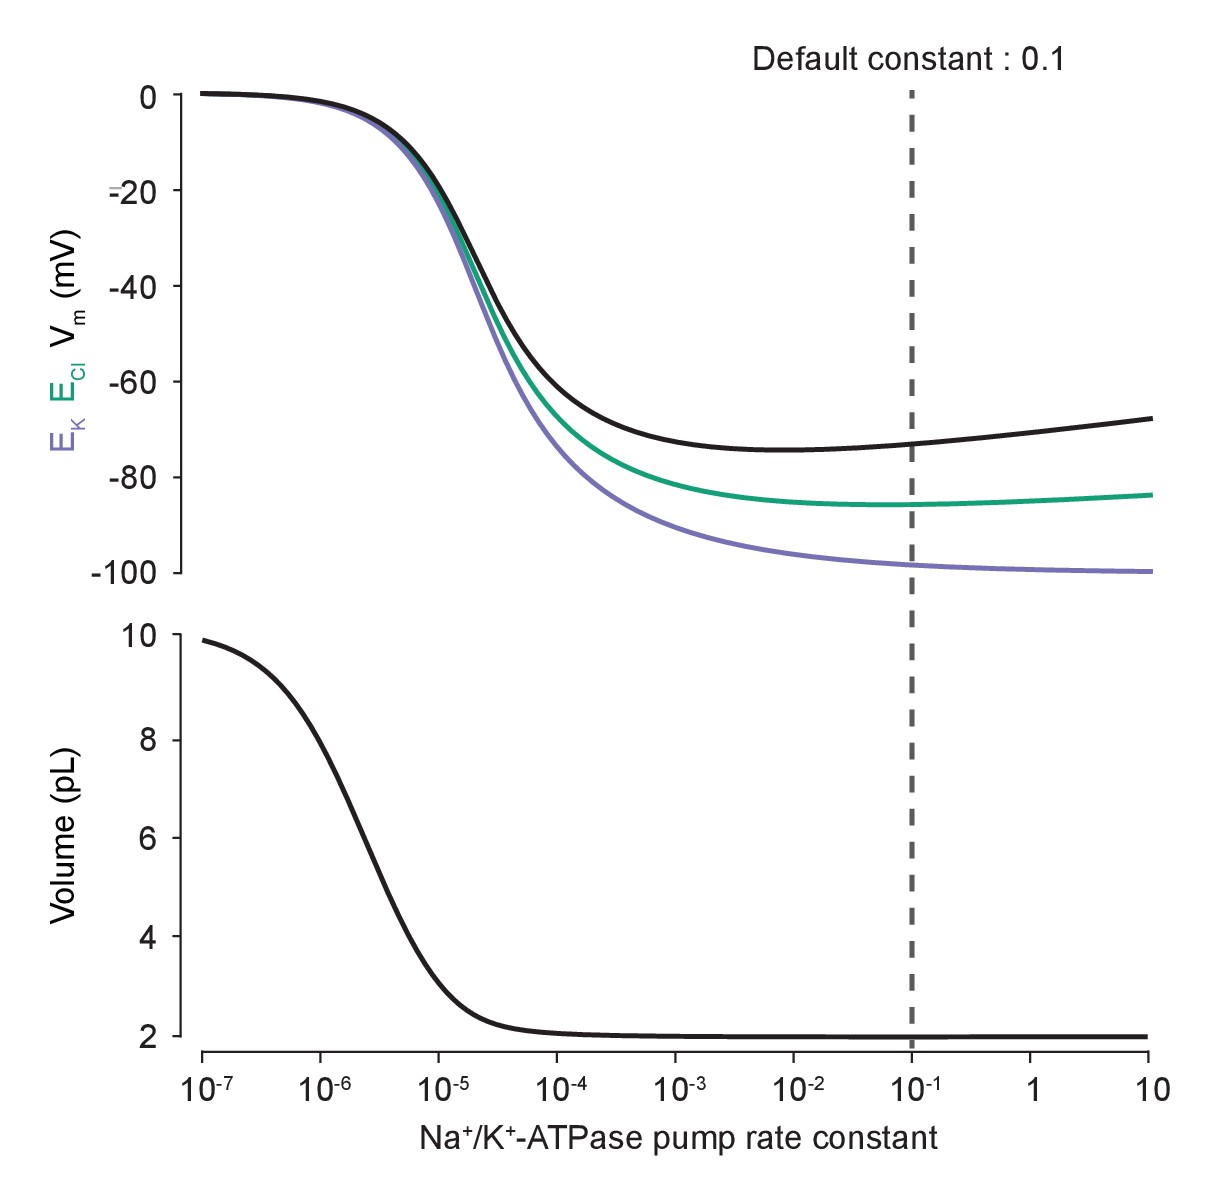
Changes in Na+/K+-ATPase activity near the model’s default pump rate produce minimal changes in ECl and Vm.
Steady-state EK (purple), ECl (green) and Vm (black, top panel) as well as volume (bottom panel) were calculated for different Na+/K+-ATPase pump rate constants using the analytical solution. Note that these variables are relatively stable near the default Na+/K+-ATPase pump rate (dashed line).
Figure 2 with 2 supplements
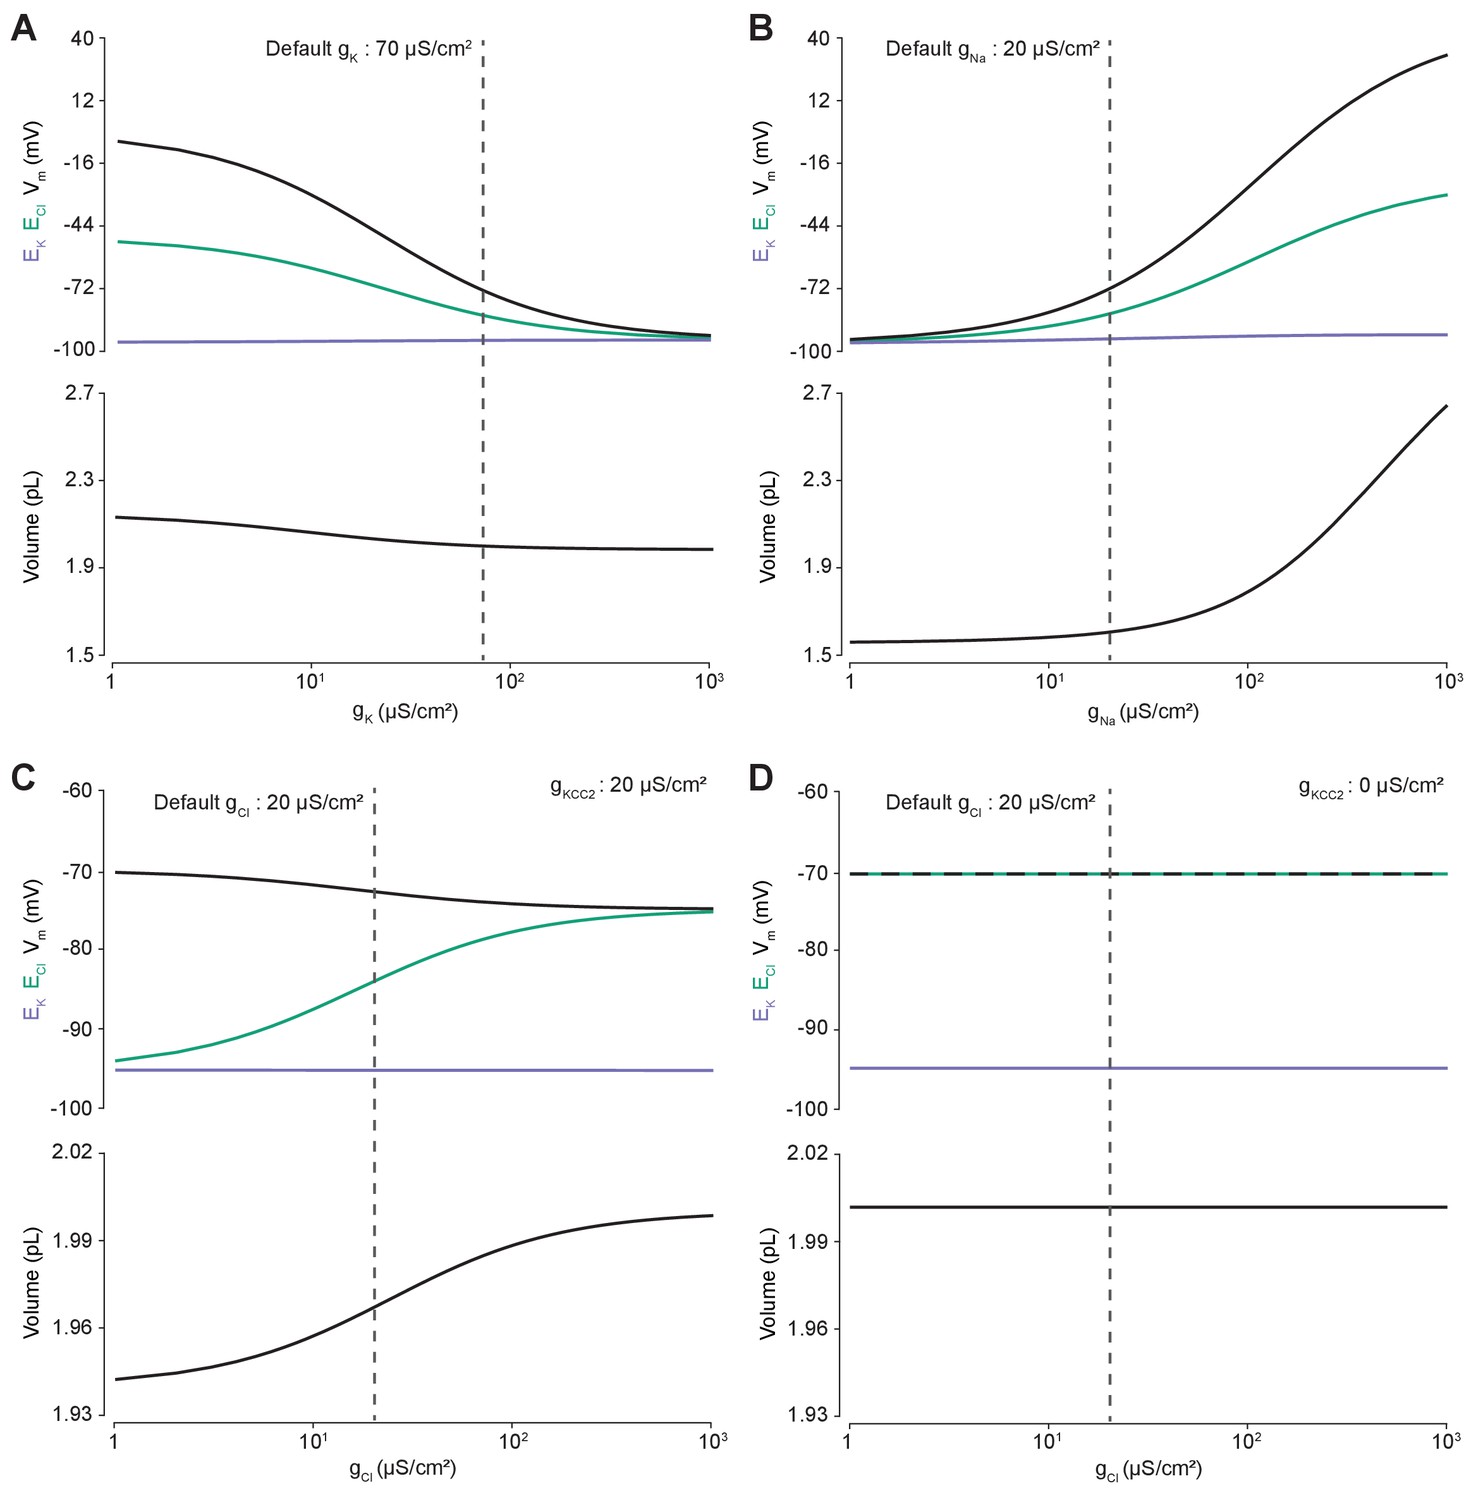
Membrane conductances affect steady-state intracellular chloride concentration only in the presence of cation-chloride cotransport.
Steady state values for different ionic conductance were calculated using the model’s analytic solution. (A) Steady state ECl (green), EK (purple), Vm (black) and volume w (bottom panel) were calculated at different K+ conductances (gK). Increasing gK resulted in a convergence of steady state ECl and Vm. (B) Increasing Na+ conductance (gNa) resulted in a progressive increase in steady state ECl, Vm and volume with a negligible increase in EK. Figure 2—figure supplement 2 demonstrates how increased K+ flux through the Na+/K+ ATPase matches passive K+ efflux to maintain EK. (C) In the presence of active cation-chloride cotransport (gKCC2 = 20 µS/cm2), increasing Cl- conductance shifted steady state ECl from EK toward Vm. (D) In the absence of KCC2 activity, gCl had no effect on steady state parameters. ECl equals Vm in all instances. Dashed lines indicate the default values for gK, gNa and gCl. In Figure 2—figure supplement 1 the classic dependence of the membrane potential on log([K+]o) is shown.
Figure 2—figure supplement 1
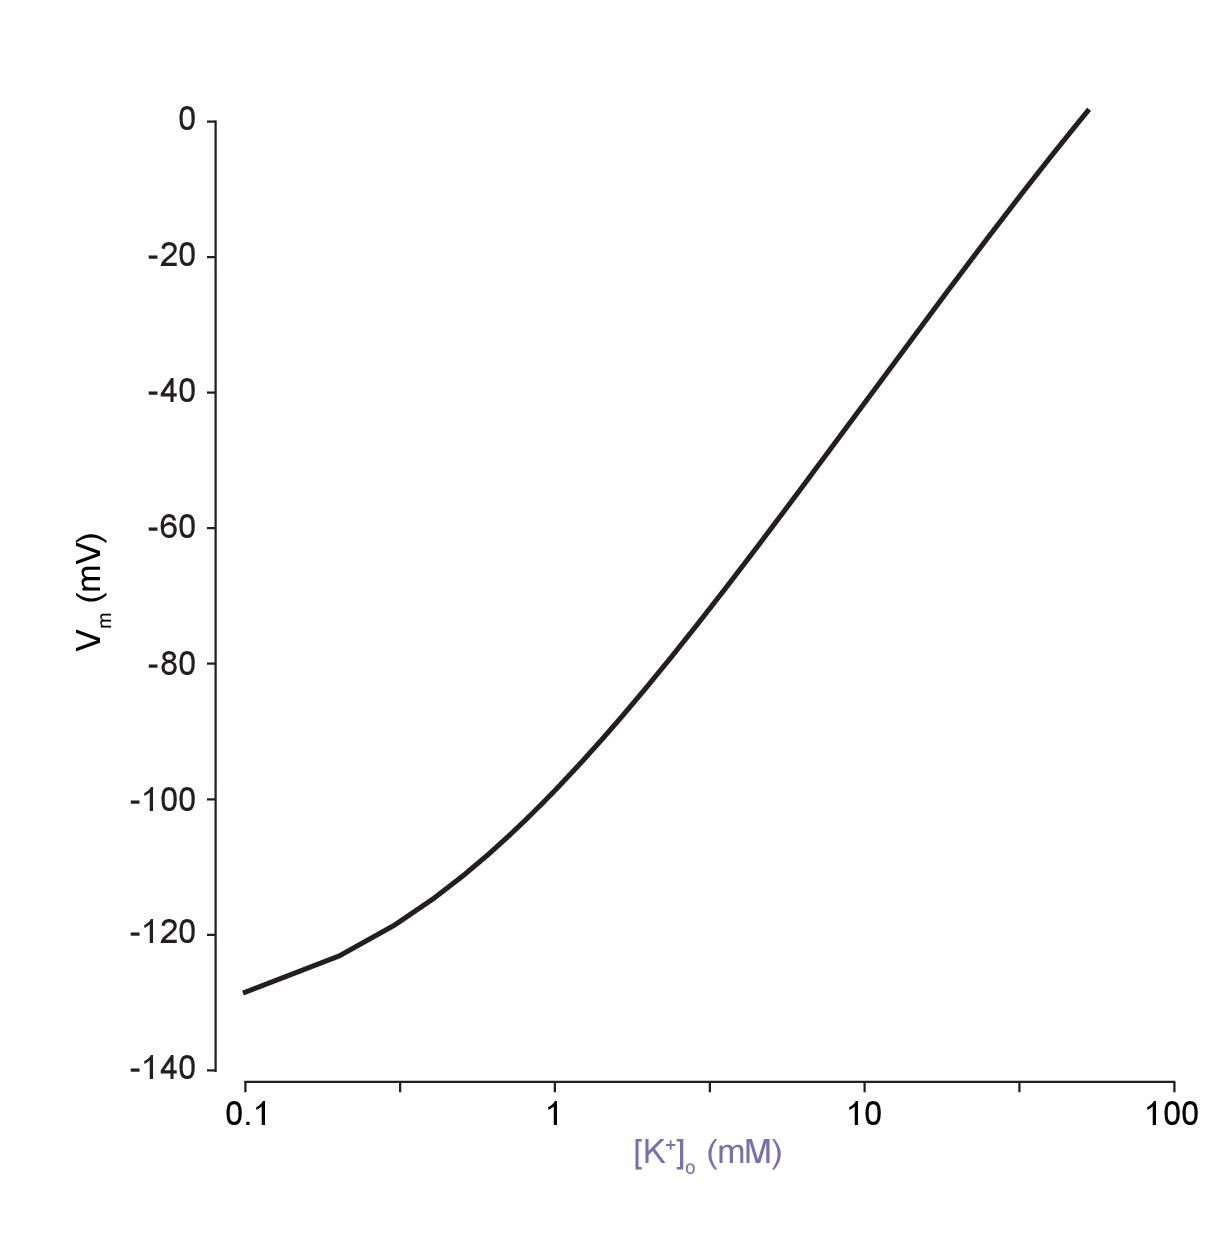
The classic dependence of membrane potential (mV) on the logarithm of extracellular potassium is reproduced using our model.
The analytical solution was used to explore the dependence of membrane potential on extracellular potassium concentration. In agreement with experimental results, the slope is non-linear at low [K+]o, which is not seen when using a pure Nernst-potential modelling approach.
Figure 2—figure supplement 2

K+flux is balanced by active and passive fluxes, dependent on Na+steady states.
Varying gNa in the analytical solution caused a reduction in ENa (top panel, pink) and non-zero increases in EK (middle panel, purple). The EK changes with increasing gNa are small because the increased K+ efflux through passive leak membrane channels accompanying membrane depolarisation (bottom panel, solid line) are compensated by increased ATPase K+ influx driven by the Na+ concentration changes (dashed line). KCC2 plays a smaller role (dotted line).
Figure 3 with 2 supplements
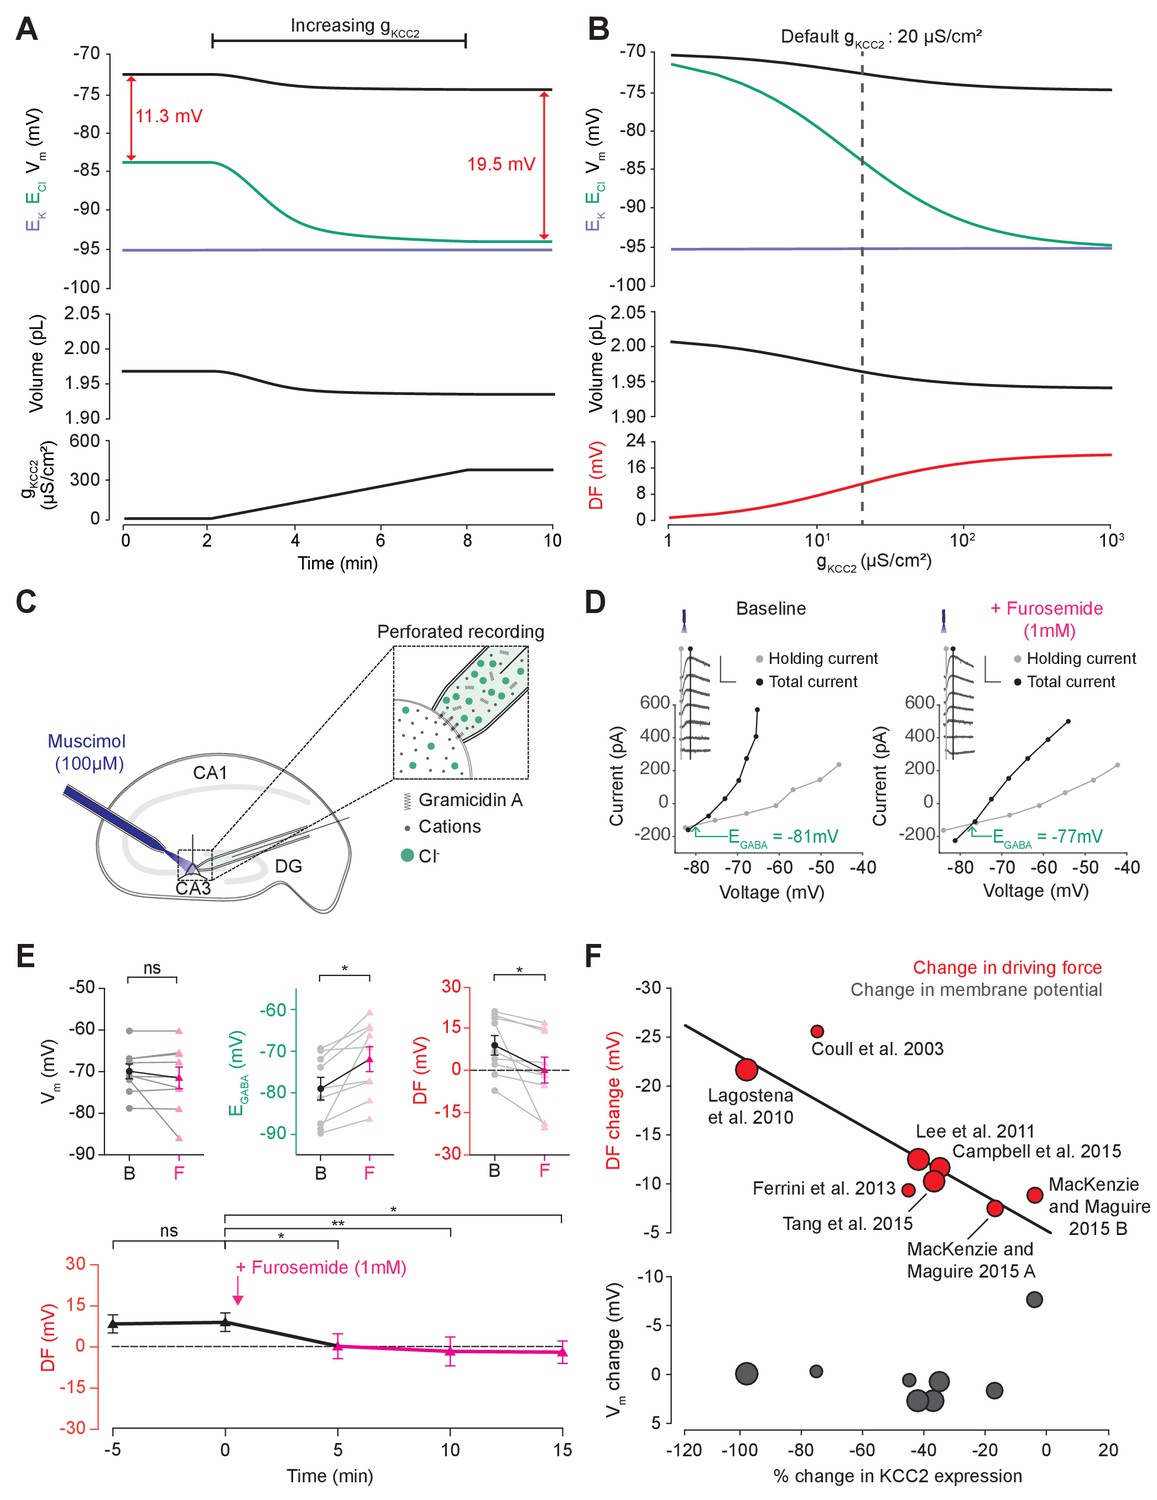
Cation-chloride cotransport sets the chloride reversal and driving force for transmembrane chloride flux.
(A) Increasing KCC2 activity in our model by increasing gKCC2 from 20 µS/cm2 to 370 µS /cm2 resulted in a persistent decrease in ECl (green), a minimal decrease in EK (purple), Vm (black) and volume w (bottom panel). This resulted in a permanent increase in the DF for Cl- via a change in ECl from −83.9 mV to −93.2 mV (red). (B) The steady state values for ECl, EK, Vm (top panel), volume (middle panel) and Cl- driving force (DF, bottom panel, red) at different KCC2 conductances. Increasing KCC2 activity resulted in a decrease in steady state ECl and an increase in DF. EK represented a lower bound on ECl at high KCC2 conductances. Similar results were noted for other kinetic models of KCC2 (Figure 3—figure supplements 1 and 2). (C) Schematic showing experimental setup. Gramicidin perforated patch-clamp recordings were performed on CA3 pyramidal cells from rat hippocampal organotypic brain slices. (D) Insets depict GABAAR currents elicited by somatic application (20 ms) of muscimol (10 μM) at different voltages. Calibration: 500 ms, 500 pA. Holding current (reflecting membrane current) and total current (reflecting membrane current plus the muscimol-evoked current) were measured at the points indicated by the vertical grey and back lines, respectively. Current-voltage (IV) plots were drawn to calculate changes in Vm, EGABA and DF before (left) and after (right) furosemide (pink) was applied. Voltages were corrected for series resistance error. (E) Top, population data showing significant changes in EGABA and DF but not Vm five minutes after furosemide application. Bottom, changes in DF over time show a significant decrease from baseline once furosemide was introduced. (F) Meta-analysis of experimental studies demonstrates a correlation between KCC2 activity (% change) and Cl- DF (mV, top plot, red) but not membrane potential (mV, bottom plot, grey), confirming the role of KCC2 for establishing the neuronal Cl- gradient in adult tissue. The data and scoring system used to generate the regression can be found in Supplementary file 2 (Tables S2-1 and S2-2 ‘ns’, non-significant; *p<0.05; **p<0.01. The data for ‘C’, ‘D’ and ‘E’ is provided in Figure 3—source data 1.
-
Figure 3—source data 1
Source data for Figure 3C–E.
Resting membrane potential, EGABA and driving force at time points as indicated relative to addition of 1 mM furosemide (at time 0 min), for each experiment.
- https://doi.org/10.7554/eLife.39575.012
Figure 3—figure supplement 1
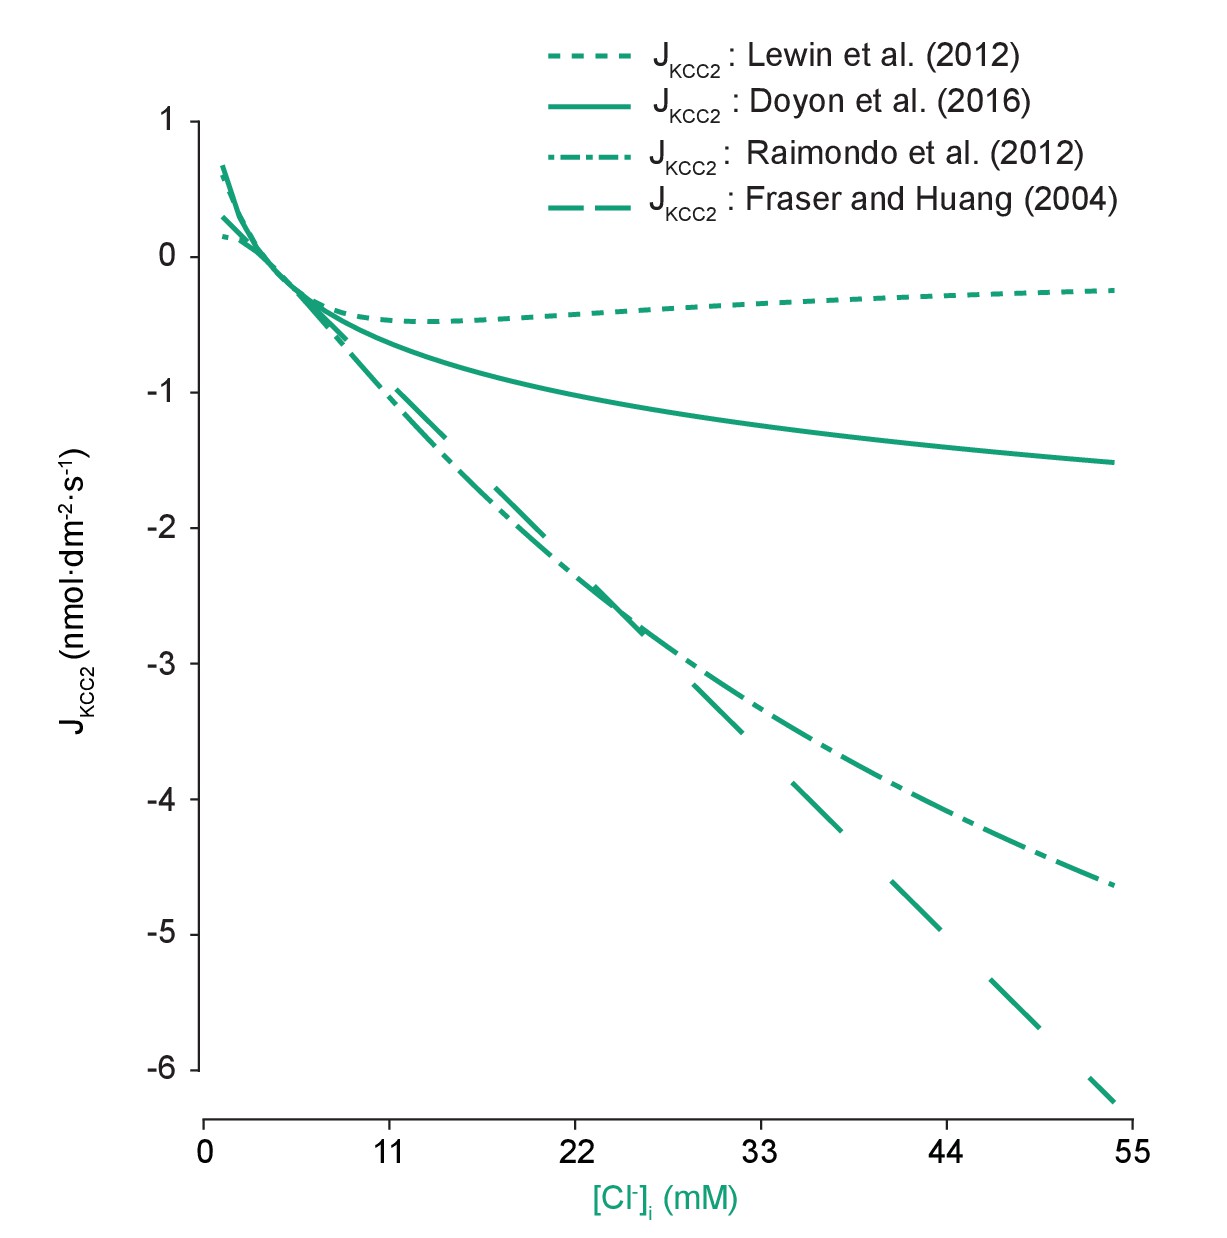
Models of KCC2 have different kinetic properties.
The pump rate velocity for different models of KCC2 were compared for differing intracellular chloride concentration. The equation employed in our model was based on Doyon et al. (2016) (solid line) and is described in the main text. Lewin et al. (2012) (dotted line) used the following equation in their computational model:, where . The model was based on a model of the renal distal tubule (Lewin et al., 2012). Here, it had a diminished absolute velocity compared to our model. The models of Raimondo et al. (2012) and Fraser and Huang (2004) (dashed and dash-dotted lines respectively) had similar velocities across our range of concentrations. Raimondo et al.’s model is based on a model for KCC2 derived using Michaelis-Menton kinetics and experiments, and incorporates new experimental values:, where (Raimondo et al., 2012). Fraser and Huang based their model on previous experimental evidence (Fraser and Huang, 2004). Their equation for KCC2 follows:, where and are the permeability constants for potassium and the pump respectively, the latter of which is tuned as needed. for each model was set such that the same steady state concentrations were achieved using any model with the other parameters kept constant.
Figure 3—figure supplement 2

KCC2 and ATPase models with different kinetics have similar properties when KCC2 is upregulated.
(A) Increasing KCC2 activity in our model using the Raimondo et al. (2012) model by increasing Vmax/JScale resulted in a persistent decrease in ECl (green), a minimal decrease in EK (purple), Vm (black) and volume w (bottom panel). This resulted in a permanent increase in the driving force for Cl-. The change in KCC2 strength was matched so that the final shift is similar to the usual shift in driving force gained using our standard KCC2 pump formulation. (B) When the ATPase model of Hamada et al. (2003) was used in the experimental set up in (A) rather than the usual ATPase model, the resulting driving force differed by only 0.1 mV from the usual value.
Figure 4 with 1 supplement
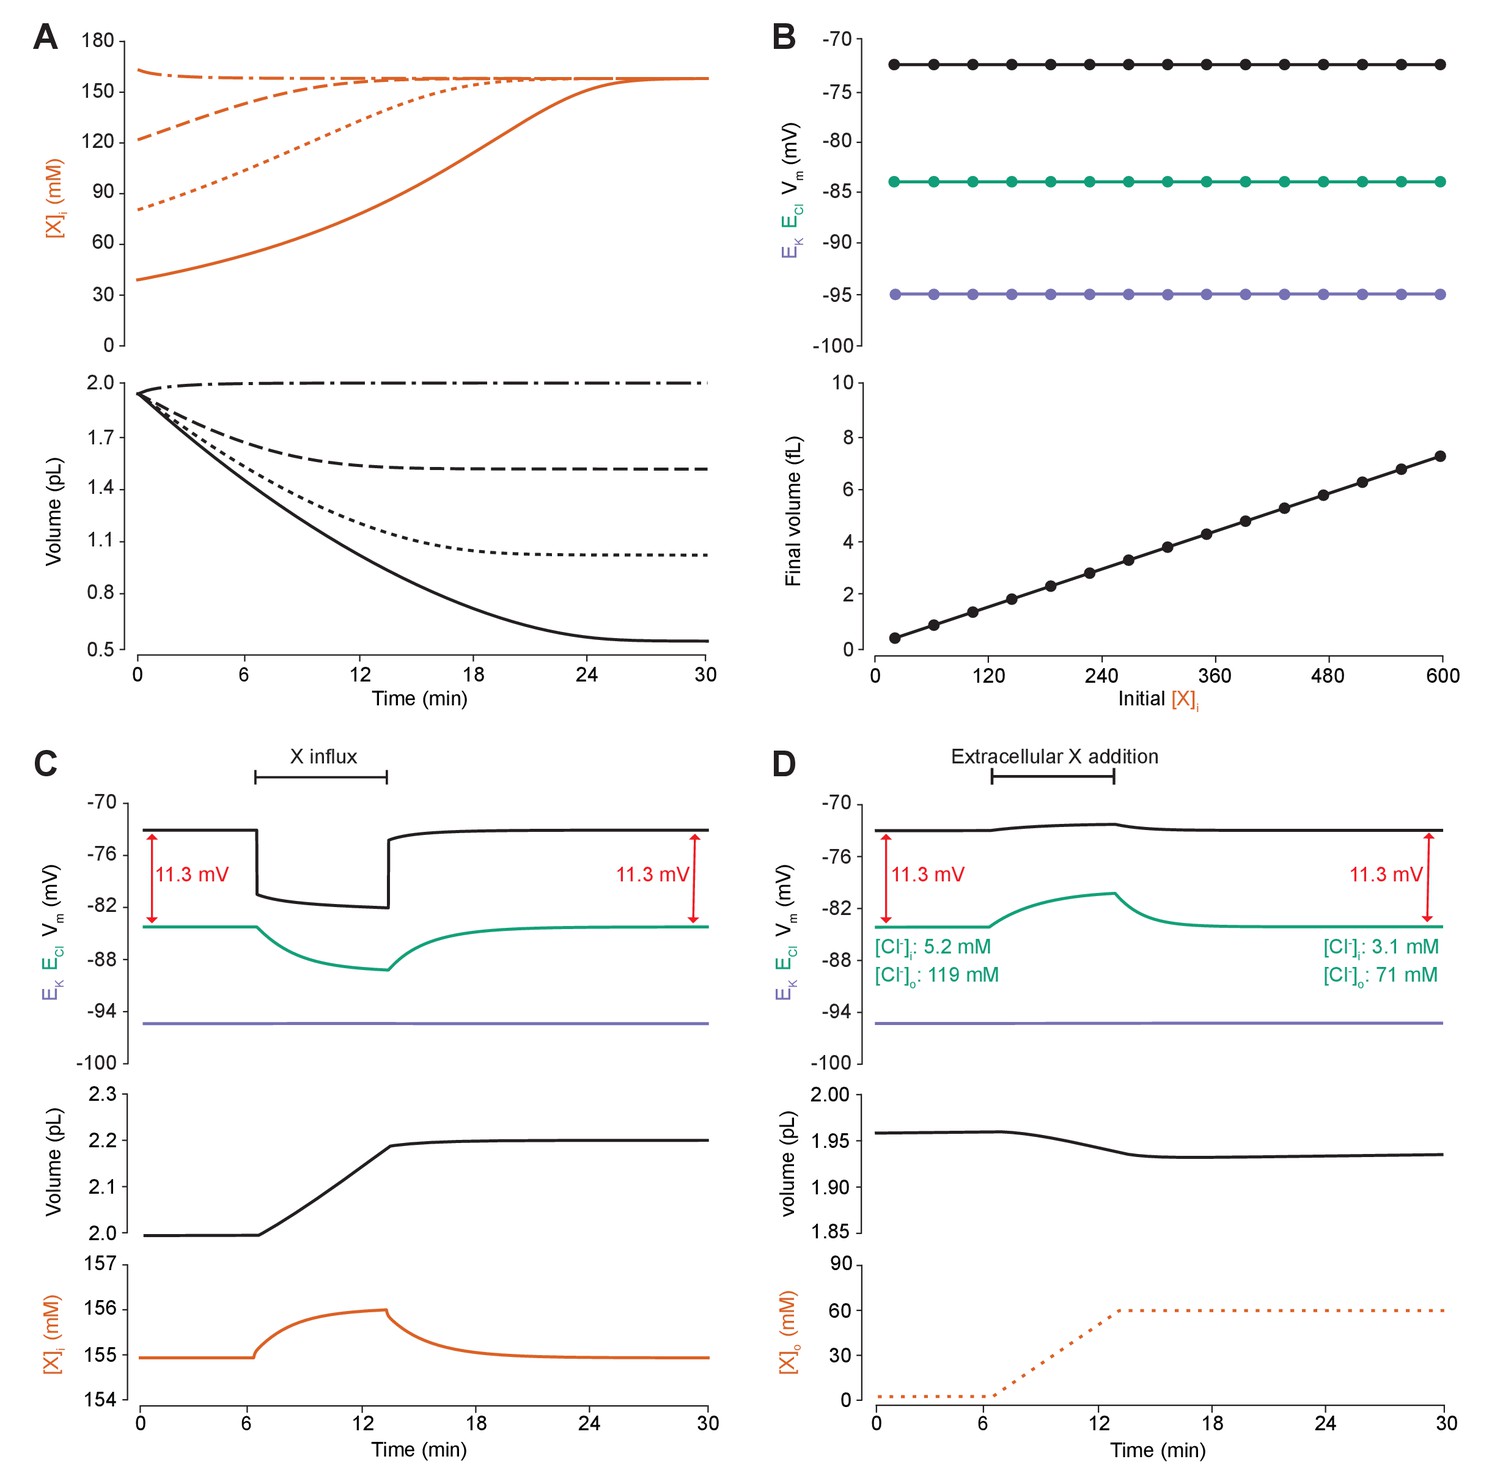
Adding intracellular or extracellular impermeant anions, without changing the mean charge of impermeant anions, does not affect the steady state gradient or driving force for chloride.
(A) Initiating the model with different starting concentrations of intracellular impermeant anions ([X]i) with the same mean charge z = −0.85 (orange, top panel), led to compensatory volume changes (bottom panel) which resulted in identical steady state concentrations. (B) Steady state ECl (green), EK (purple) and Vm (black) were identical regardless of initial [X]i. Final volume, however, was a linear function of initial [X]i (bottom panel). (C) Addition of impermeant anions of the mean charge (z = −0.85) caused transients shifts in ECl (green, top panel), EK (purple), Vm (black) as well as [X]i (orange, bottom panel) for the duration of the influx, and sustained increases in volume (black, middle panel). No persistent changes in ECl, EK or Vm were observed. The full time-dependent ionic and water fluxes for the experiment are shown in Figure 4—figure supplement 1, which shows that the inward flux of impermeant anions causes fluxes of all other ions. (D) Similarly, the addition of extracellular impermeant anions in an osmoneutral manner causes transient shifts in the permeable ion gradients (top panel, colours as in ‘C’), and sustained changes in cellular volume (black, middle panel) as well as the extracellular X and extracellular and intracellular Cl- concentrations.
Figure 4—figure supplement 1
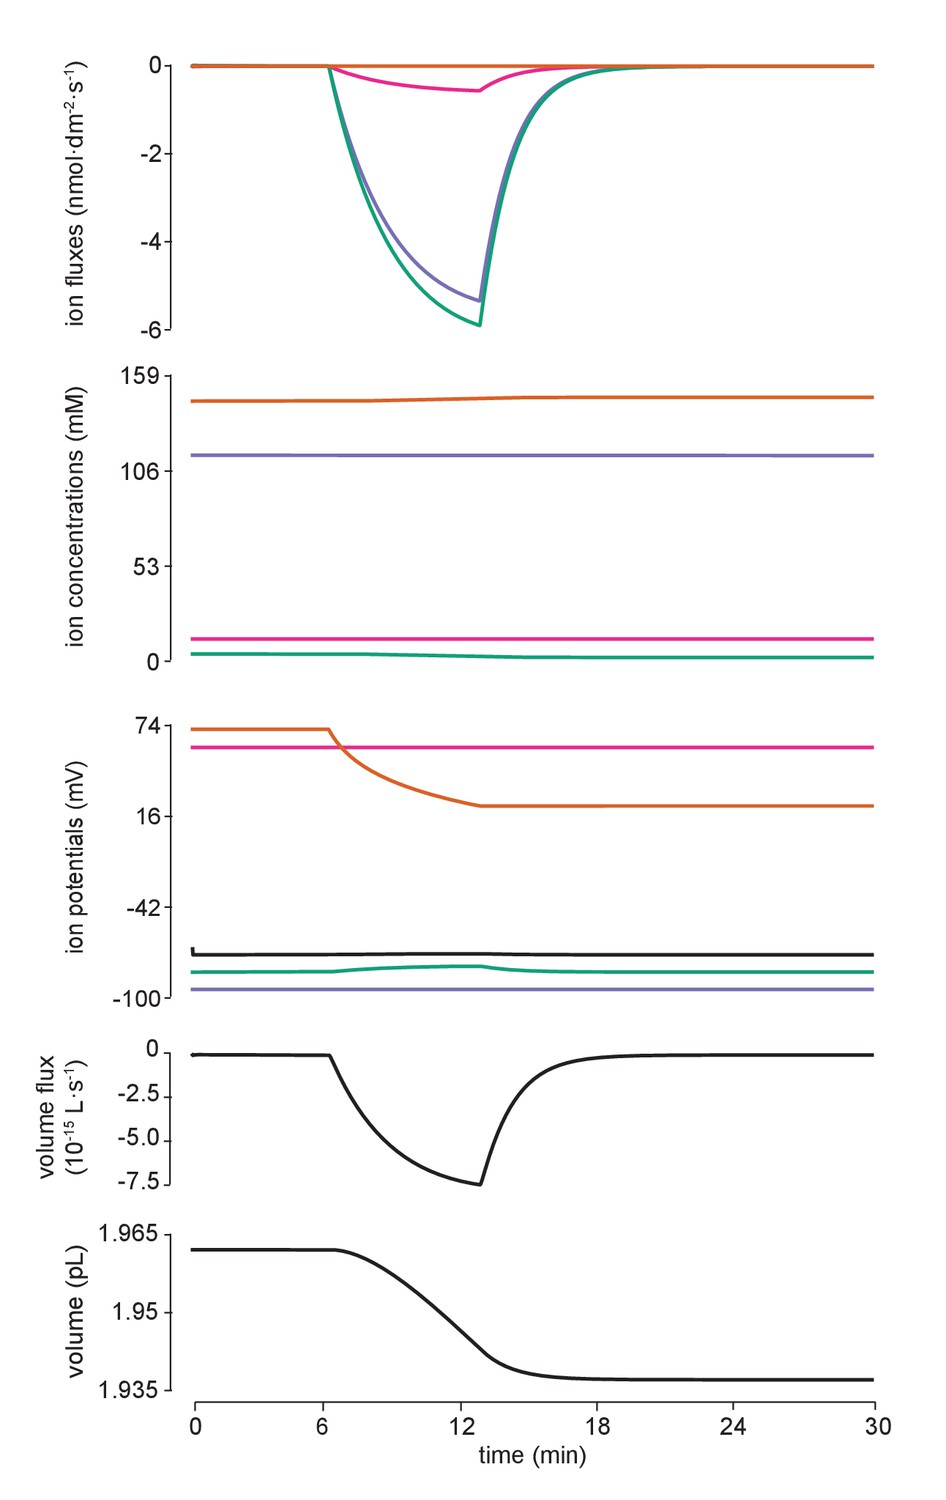
Flux of all ions for the manipulation in Figure 4c.
Detailed fluxes of all ions and changes to volume during addition of impermeant anions of average charge. The flux of ions across the membrane for potassium (purple, K+), sodium (pink, Na+), chloride (green, Cl-) and impermeant anions (orange, (X) are shown in the top panel. Concentration and reversal potential changes are depicted in the second and third panels from the top. Whilst there is a large inward (intracellular) flux of impermeant anions as dictated by the experiment, this is not solely mitigated by fluxes of chloride, the other intracellular anion, but also by potassium and sodium fluxes as well as the movement of water (ie volume changes). The rate of change in volume (representing water movement) is shown in the fourth panel from the top while the bottom panel depicts volume itself.
Figure 5 with 1 supplement
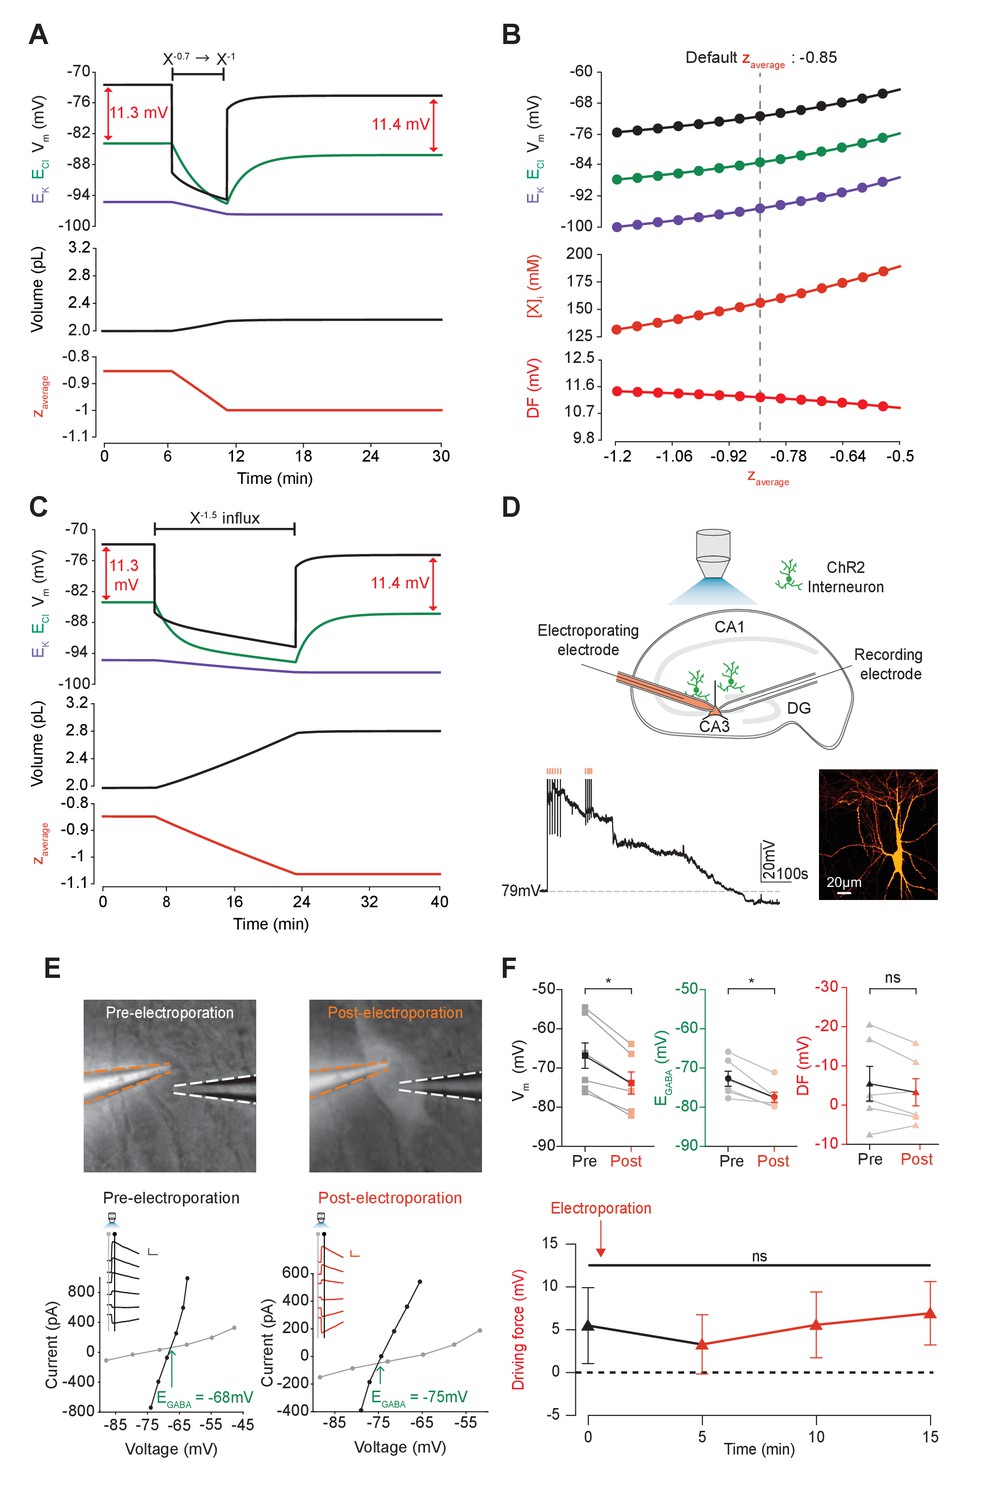
Adjusting the mean charge of impermeant anions shifts the chloride reversal potential with negligible effects on the driving force for chloride.
(A) Decreasing the mean charge of impermeant anions from −0.85 (the default value) to −1 (orange, bottom panel), without changing the absolute number of intracellular impermeant anions caused a persistent decrease in ECl (green, top panel), EK (purple) and Vm with moderate increases in volume (middle panel) in our default single compartment model. Negligible changes in Cl- driving force (∆DF = 0.16 mV, red) were observed. (B) Analytic solution (solid lines) for different impermeant anion mean charge (z) exactly matches the steady state values from numerical, time series runs (dots) based on adjusting z as in ‘A’. Steady state ECl, EK, Vm (top panel) and [X]i (middle) increased with increasing z, while changes in z resulted in very small changes in Cl- DF (bottom, red). The vertical dashed line indicates the values at the chosen default z of −0.85. (C) Influx of a species of impermeant anions with a charge of −1.5, that decreased the mean charge z (bottom panel) from −0.85 to −1 and increased the number of impermeant anions also caused persistent decreases of ECl, EK and Vm as in ‘A’, but with larger increases in cell volume (middle panel). Again, very small persistent changes in Cl- DF were observed. The volume changes for different flux amounts and charges are illustrated in Figure 5—figure supplement 1. (D) Top, schematic of the experimental setup where whole-cell recordings were made from CA3 pyramidal cells in mouse organotypic brain slices. Impermeant anions (orange) were delivered via electroporation of the negatively charged fluorescent dextran Alexa Flour 488 via a pipette positioned near the soma of the recorded cell. GABAAR currents were elicited via photo-activation (100 ms, 470 nm LED via objective) of ChR2-expressing GAD2+ interneurons (green cells) in the presence of 5 μM CGP-35348 to block GABABRs. Lower trace, current clamp recording showing Vm changes during electroporation of anionic dextran. Confocal image demonstrating cell-localized fluorescence of the anionic dextran electroporated in ‘E’. (E) Top, widefield images with electroporation pipette (orange dashed lines) and the recording pipette (white dashed lines). Note increased fluorescence in the soma after electroporation. Below, insets show GABAAR currents evoked by photo-activation of GAD2+ interneurons at different holding potentials. Calibration: 1 s, 100 pA. Holding current (reflecting membrane current) and total current (reflecting membrane current plus the GABAAR current) were measured at the points indicated by the vertical grey and black lines, respectively. IV plots were used to calculate Vm, EGABA and DF before (left) and after (right) electroporation. (F) Top, population data showing significant decreases in mean Vm and EGABA but not DF five minutes after electroporation. Below: changes in DF over time. Point at which electroporation occurred marked with orange arrow. ‘ns’, non-significant; *p<0.05. The data for ‘D’, ‘E’ and ‘F’ is provided in Figure 5—source data 1.
-
Figure 5—source data 1
Source data for Figure 5D–F.
Resting membrane potential, EGABA and driving force at time points as indicated relative to electroporation of anionic dextran (at time 0 min), for each experiment.
- https://doi.org/10.7554/eLife.39575.017
Figure 5—figure supplement 1
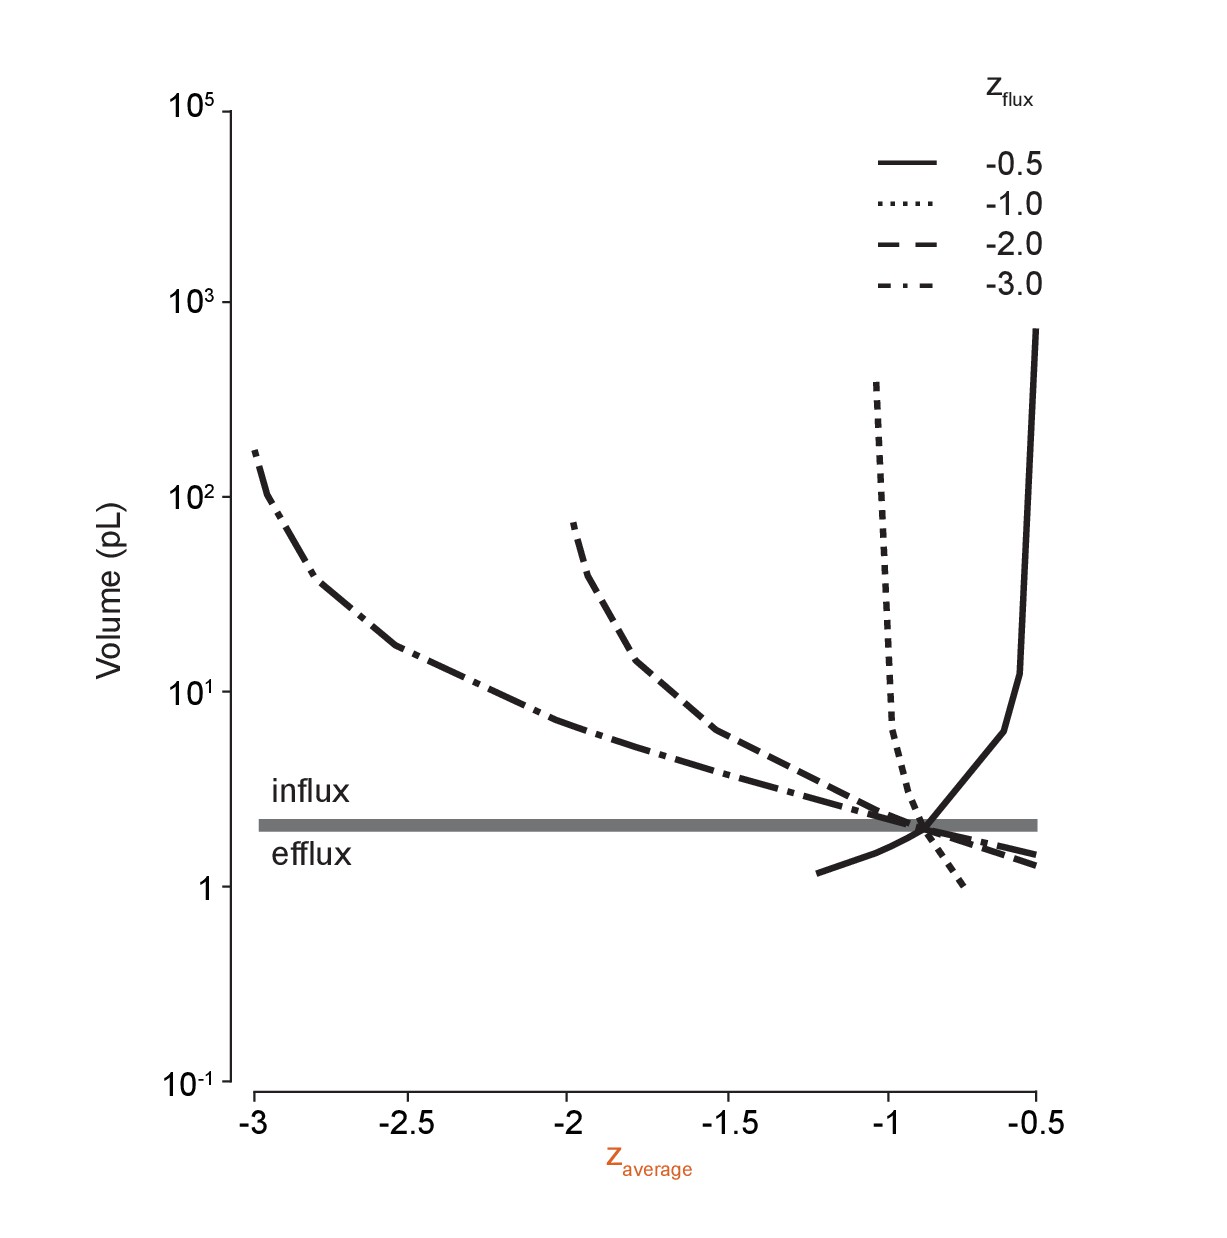
Large volume shifts occur when average impermeant charge is changed via temporary anion species flux across the membrane.
Repeating the methodology in Figure 5C for ion species with different charges (zflux) demonstrates the effect of driving shifts in the average intracellular impermeant charge on cell volume. Generating even small shifts in average z by adding or removing impermeant anions can cause large changes in cell volume.
Figure 6 with 1 supplement
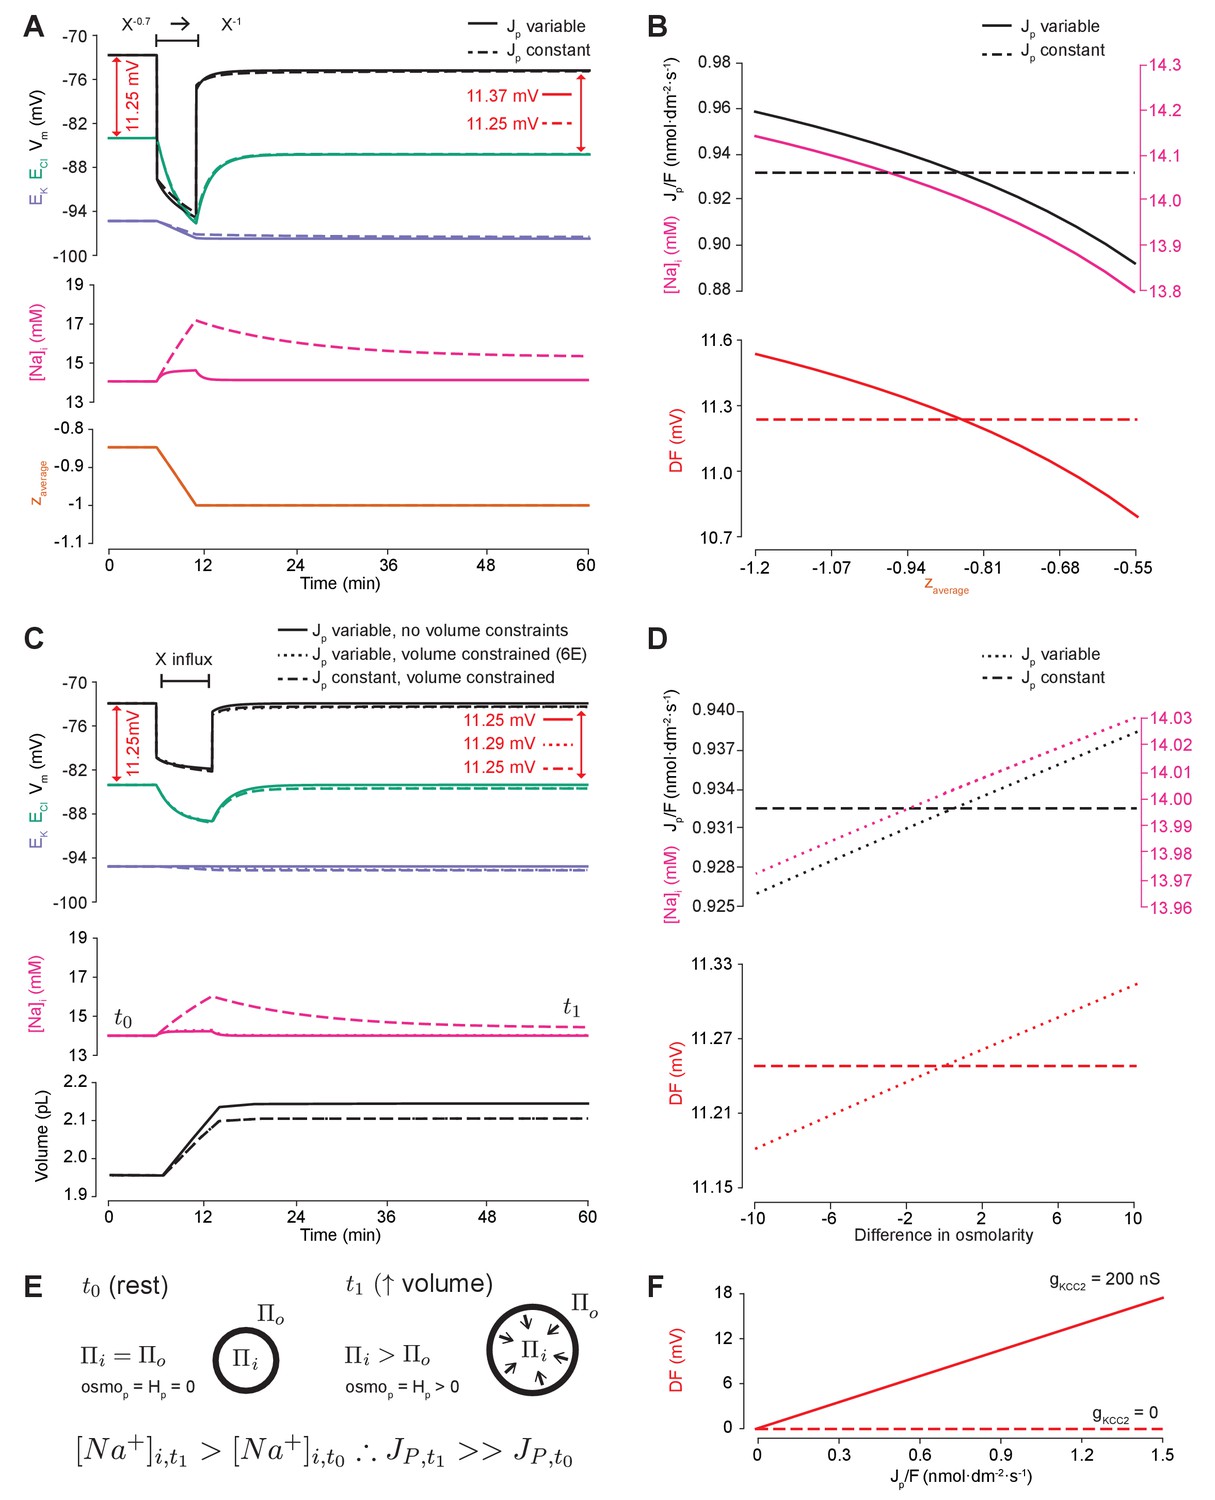
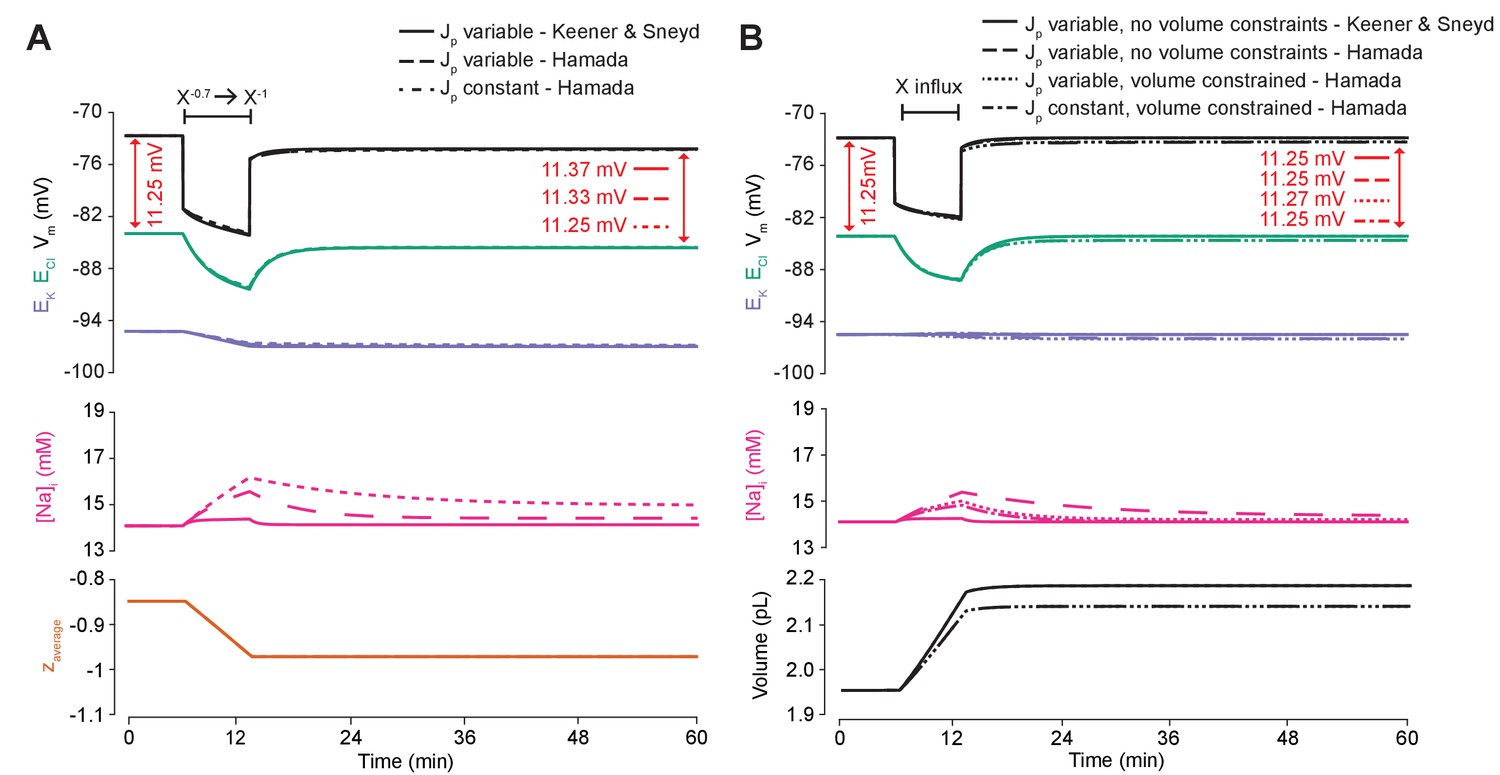
Impermeant anions drive small shifts in chloride driving force by modifying the Na+/K+-ATPase pump rate under conditions of active chloride cotransport.
(A) ECl (green), EK (purple) and Vm (black) (top panel), [Na+]i (pink, middle panel) and mean impermeant anion charge z (orange, lower panel) over time in the default single compartment model. Changing z from −0.85 to −1 generated small, persistent Cl- driving force (DF) shifts (arrows, red) only when the effective ATPase pump rate (Jp) was variable (solid line) and not when Jp was kept constant (dashed line). (B) Solving analytically across different values of z with either a variable Jp (solid lines) or a constant Jp (dashed line), demonstrates the direct relationship between Na+ (pink), effective pump rate (Jp) (top panel) and DF (lower panel, red). (C) ECl (green), EK (purple) and Vm (black) (top panel), [Na+]i (pink, middle panel) and cell volume (black, lower panel) over time in the default single-compartment model. Impermeant anions of the same charge as the mean charge of the cell were added. A volume constraint was incorporated by adding a hydrostatic force dependent on membrane tension (dashed lines), which resulted in an impermeable anion-induced transmembrane osmotic differential. This caused a small change in DF when Jp was variable (dashed line), but not when Jp was held constant (dotted lines). (D) Solving analytically across osmolarity differences demonstrates the direct relationship between Na+ (pink), effective pump rate (Jp) (top panel) and DF (lower panel). Note, the small changes in DF. (E) Schematic explaining the mechanism through which impermeant anion-induced cell swelling in the presence of volume constraints (i.e. membrane tension) result in steady states with equal but non-zero osmotic (osmoP) and hydrostatic pressures (HP), causing transmembrane osmotic differences (t1). This causes small changes in Na+, and hence Jp. (F) All Na+/K+-ATPase pump rate-related shifts in the DF require KCC2 activity; in the absence of activity (dashes), no shifts in driving force can occur. In Figure 6—figure supplement 1, we show that the results in (A) and (C) are similar when an experimentally-matched model of the Na+/K+-ATPase is used.
Figure 6—figure supplement 1
An ATPase model with different kinetics has similar properties to our model’s ATPase when average impermeant anion charge in the cell is changed, and is also dependent on the ATPase pump rate’s dependence on Na+.
(A) The experiment for Figure 6A was repeated using the usual ATPase model (solid line) compared to Hamada et al. (2003)’s model and is consistent with the results in the main text. ECl (green), EK (purple) and Vm (black) (top panel), [Na+]i (pink, middle panel) and average impermeant anion charge z (orange, lower panel) over time in the default single compartment model. Changing the average z from −0.85 to −1 generated small, persistent Cl- driving force shifts (arrows) only when the effective ATPase pump rate (Jp) was variable (solid and dashed line) for both pump models, and not when Jp was kept constant (dotted line). (B) The experiment for Figure 6C was repeated comparing the usual ATPase model (solid line) with Hamada et al., 2003’s model and is consistent with the results in the main text. ECl (green), EK (purple) and Vm (black) (top panel), [Na+]i (pink, middle panel) and cell volume (black, lower panel) over time in the default single-compartment model. Impermeant anions of the same average charge of the cell were added. A volume constraint on Hamada et al.’s model was incorporated by adding a hydrostatic force dependent on membrane tension (dotted lines), which resulted in an impermeable anion induced transmembrane osmotic differential. This caused a small change in Cl- driving force when Jp was variable (dotted line), but not when Jp was held constant (dash-dotted lines).
Figure 7
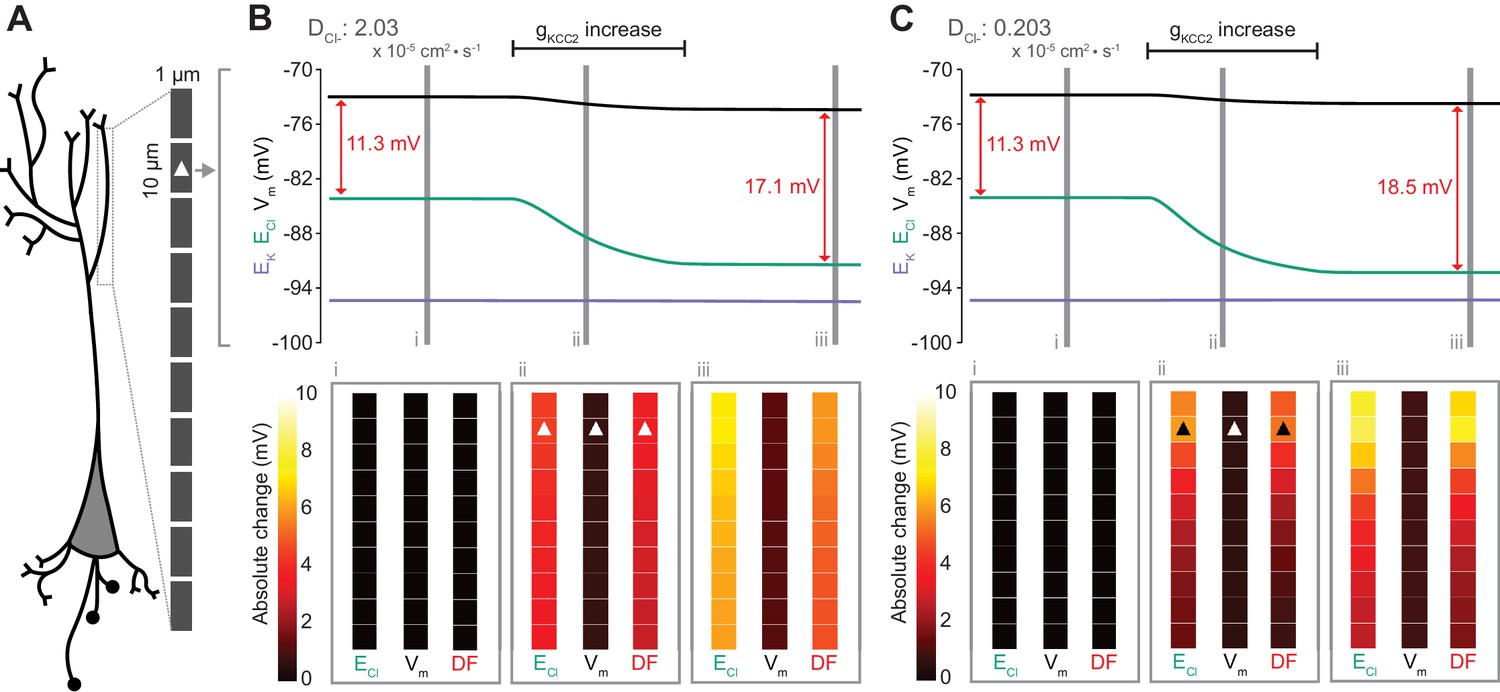
Local changes in KCC2 activity generate local differences in chloride reversal and driving force only under conditions of constrained chloride diffusion.
(A) Schematic depicting the multi-compartment model representing a virtual dendrite of length 100 μm. The virtual dendrite consists of 10 compartments of length 10 μm and initial radius 0.5 μm. Each compartment contains the same mechanisms and default parameterization as the single compartment model. All ions, except impermeant anions, could move between compartments by electrodiffusion. (B) Top panel, ECl (green), EK (purple), Vm (black) and DF (arrows, red) from the second from top compartment (indicated with a white triangle) where the conductance of KCC2 was increased. The insets depict the diameter, and absolute change from baseline of ECl, Vm and DF for all compartments before (i), during (ii) and after (iii) the activity of KCC2 was selectively increased. This resulted in ECl decreasing in all compartments with minimal changes to EK and V. Consequently, the Cl- DF (red) increased. In this case the diffusion constant for Cl- (DCl = 2.03×10⁻⁷ dm2.s−1) resulted in ECl and DF changes being widespread across the virtual dendrite. (C) Reducing the Cl- diffusion constant to 0.2 × 10⁻⁷ dm2.s−1 resulted in a localized effect of compartment-specific KCC2 activity increases on ECl and DF.
Figure 8
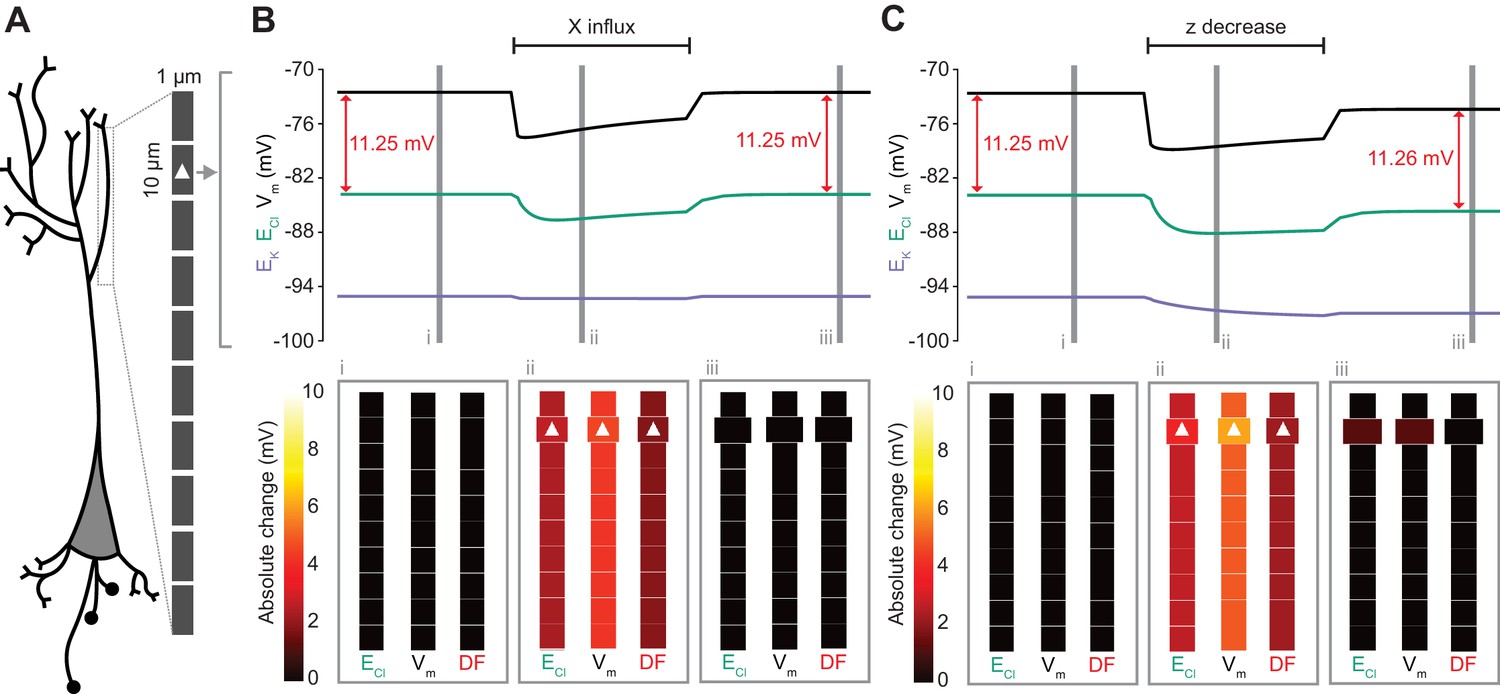
Local changes in impermeant anions do not establish the local driving force for chloride.
(A) Multi-compartment model of a 10 compartment 100 μm virtual dendrite as in Figure 7. (B) Top panel, ECl (green), EK (purple), Vm (black) and DF (arrows, red) within the compartment where additional impermeant anions were exclusively added (indicated with a white triangle). The insets depict the diameter, and absolute change from baseline for ECl, Vm and DF for each compartment of the virtual dendrite before (i), during (ii) and after (iii) impermeant anions were added. The selective addition of impermeant anions of default charge (z = −0.85) to the 2nd from top compartment resulted in transient but non-permanent shifts in ECl, Vm and the Cl- DF in all compartments. The volume of the compartment where impermeant anion addition occurred increased permanently. (C) Traces and insets as in ‘B’ showing the addition of impermeant anions of more negative charge in order to decrease z in the second from top compartment specifically. Note that during addition of impermeant anions, ECl, EK, Vm changed. We also observed persistent decreases in ECl and Vm in the compartment manipulated, with a negligible change in DF (0.01 mV). Again, impermeant anion addition resulted in an increase in the volume of the specific dendritic compartment manipulated.
Tables
Table 1
Constants, default parameters and usual steady state values for variables used in the biophysical models.
https://doi.org/10.7554/eLife.39575.022| Value | Description | |
|---|---|---|
| Constants | ||
| F | 96485.33 C/mol | Faraday constant |
| R | 8.31446 J/(K.mol) | Universal gas constant |
| T | 310.15 K | Absolute temperature (=37°C) |
| Parameters | ||
| Cm | 2 10−6 F/cm2 | Unit membrane capacitance (Qian and Sejnowski, 1989) |
| gNa | 20 µS/cm2 | Na+ leak conductance (Kager et al., 2000) |
| gK | 70 µS/cm2 | K+ leak conductance (Kager et al., 2000) |
| gCl | 20 µS/cm2 | Cl- leak conductance |
| gKCC2 | 20 µS/cm2 | KCC2 conductance (Doyon et al., 2016) |
| vw | 0.018 dm3/mol | Partial molar volume of water (Hernández and Cristina, 1998) |
| pw | 0.0015 dm/s | Osmotic permeability (Hernández and Cristina, 1998) |
| km | 25 N/dm | Variable for membrane tension (higher than reported (Dai et al., 1998): used in this paper to accentuate differences in osmolarity) |
| p | 0.1 C/(dm2.s) | Default pump rate constant |
| [Na+]o | 145 mM | Extracellular Na+ concentration |
| [K+]o | 3.5 mM | Extracellular K+ concentration |
| [Cl-]o | 119 mM | Extracellular Cl- concentration |
| [X-]o | 29.5 mM | Extracellular impermeant anion (X) concentration (Lodish et al., 2009; Raimondo et al., 2015) |
| DNa | 1.33 10−7 dm2/s | Na+ diffusion constant (Hille, 2001) |
| DK | 1.96 10−7 dm2/s | K+ diffusion constant (Hille, 2001) |
| DCl | 2.03 10−7 dm2/s | Cl- diffusion constant (Hille, 2001) |
| Variables (default steady state) | ||
| Vm | −72.6 mV | Membrane potential |
| [Na+]i | 14.0 mM | Intracellular Na+ concentration |
| [K+]i | 122.9 mM | Intracellular K+ concentration |
| [Cl-]i | 5.2 mM | Intracellular Cl- concentration |
| [Xz]i | 154.9 mM | Intracellular impermeant anion (X) concentration |
| z | −0.85 | Mean charge of intracellular X (Lodish et al., 2009; Raimondo et al., 2015) |
| w | 2.0 pL (single compartment) 0.078 pL (multi-compartment) | Volume |
Additional files
-
Supplementary file 1
Analytical solution derivation.
- https://doi.org/10.7554/eLife.39575.023
-
Supplementary file 2
Data and scoring methodology for the meta-analysis in Figure 3F.
- https://doi.org/10.7554/eLife.39575.024
-
Transparent reporting form
- https://doi.org/10.7554/eLife.39575.025
Download links
A two-part list of links to download the article, or parts of the article, in various formats.
Downloads (link to download the article as PDF)
Open citations (links to open the citations from this article in various online reference manager services)
Cite this article (links to download the citations from this article in formats compatible with various reference manager tools)
Biophysical models reveal the relative importance of transporter proteins and impermeant anions in chloride homeostasis
eLife 7:e39575.
https://doi.org/10.7554/eLife.39575


