Size control of the inner ear via hydraulic feedback
- Harvard Medical School, United States
- Harvard University, United States
Figures
Figure 1 with 2 supplements

Morphodynamic analysis of inner ear growth from 16 to 45 hpf using in toto imaging.
(A–D) Confocal micrographs of otic vesicle development at (A) 12 hpf, (B) 16 hpf, (C) 24 hpf, and (D) 45 hpf. Orange and blue contours demarcate otic vesicle and lumenal surfaces respectively. Embryos are double transgenic for highlighting membranes and nuclei (Tg(actb2:Hsa.H2B-tdTomato)hm25; Tg(actb2:mem-citrine)hm26). n = 10 embryos per data point. Error bars are SD. (E) Primary y-axis plots cell numbers (N, blue markers) and secondary axis plots average cell size (s, picoliters or pl, red markers). (F) Quantification of vesicle (, orange markers), lumenal (, blue markers), and tissue volumes (, green markers). (G) Primary y-axis plots lumenal surface area (, blue markers). Secondary axis plots average cell apical surface area (ψ, red markers) evaluated numerically by fitting quadratic polynomials to surface area () and cell number () data. (H) Quantification of wall thickness (, µm) at locations next to the hindbrain (medial, blue), ectoderm (lateral, red), and anterioposterior poles (poles, green). Related to Figure 1—figure supplement 1 and Figure 1—video 1.
Figure 1—figure supplement 1
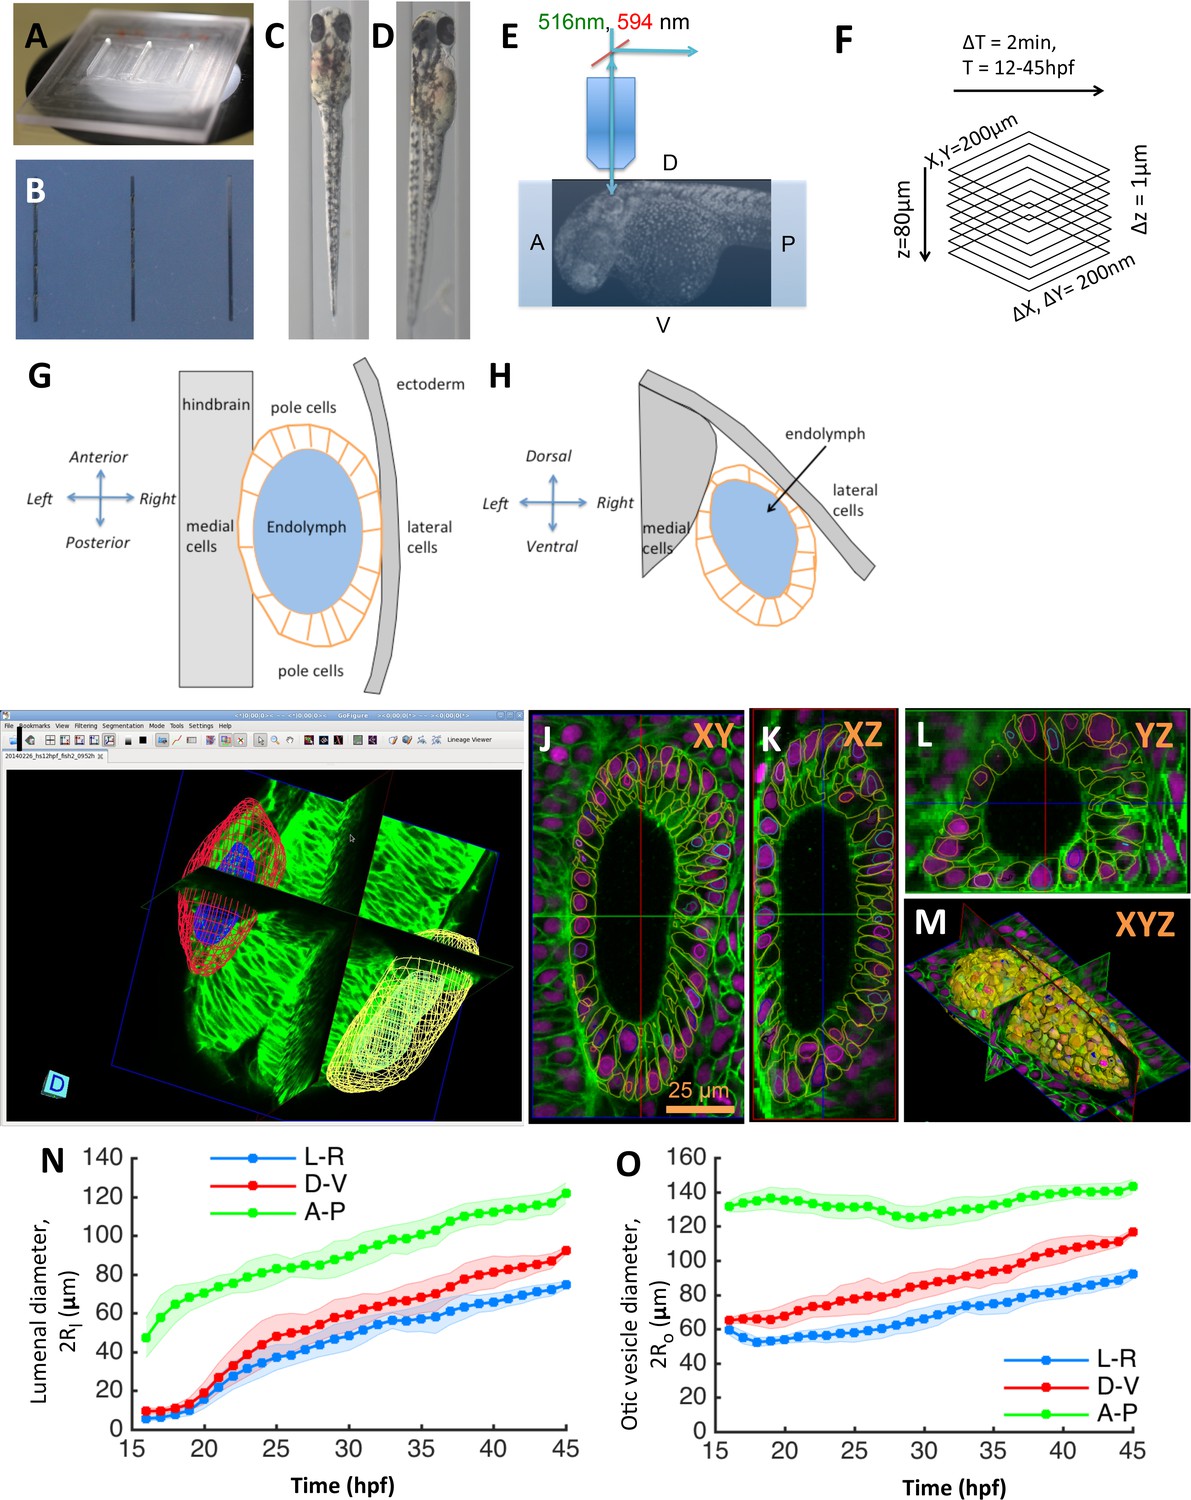
Zebrafish inner ear growth dynamics can be quantified using in toto imaging protocols.
(A) A ‘canyon’ template made of plexiglass with each canyon being 1.5 mm deep and 0.4 mm wide. (B) 1% agarose molds are cast using the template. Rows of zebrafish embryos from 16 to 45 hpf stages can be mounted in orientations that position the inner ear closest to the cover-slip for imaging. (C) Embryos are mounted in a dorsal orientation for imaging both ears simultaneously using a 20X, 1.0 NA objective. (D) Embryos are mounted in a dorsolateral orientation for obtaining higher-quality images (otic tissue depth along the path of light is minimized) using a 40X, 1.2 NA objective. (E) Transgenic zebrafish embryos expressing bright nuclear and membrane-specific fluorescent reporters are imaged using a confocal microscope in a time-lapse mode. Embryos are (Tg(actb2:Hsa.H2B-tdTomato)hm25; Tg(actb2:mem-citrine)hm26). (F) The acquired images typically cover a field-of-view of 200×200×80 µm. With a sampling of 0.2 × 0.2 × 1.0 µm, image dimensions are 1024 × 1024 × 80. In timelapse experiments, images are acquired every 2 min covering a developmental time-window ranging 12–45 hpf. (G–H) Diagram illustrating the standard (G) dorsal and (H) transverse views of the otic vesicle organ as indicated by the embryonic coordinate axis. The otic vesicle (orange) is situated in between the hindbrain and ectoderm tissues. The locations of the medial, lateral, and pole cell regions is as shown. (I–L) In toto images can be automatically processed using membrane and nuclei segmentation algorithms for estimating cell numbers, cell shapes, and protein expression at a single-cell resolution. Using GoFigure2, an open-source software for visualization, editing, and integrative analysis of in toto data, the segmentation meshes and tracks can be visualized along orthogonal image planes as shown in (I) XY, (J) YZ, (K) XZ, and as (L) triplanar 3D view. (M) Organ size and shape can be semi-automatically or manually processed by placing 2D contours along image planes in the GoFigure2 software platform. The software reconstructs surfaces from contours and computes volumes and surface areas. (N–O) Principal diameters of the lumenal cavity (N, ) and otic vesicle (O, ) quantified during growth show the vesicle is elongated along the anteroposterior axis while being approximately symmetric about left-right and dorsoventral axes. The principal diameters monotonically increase during growth and remain correlated. n = 10 embryos per data point. Error bars are SD.
Figure 1—video 1
Inflation of the otic vesicle.
2D+time confocal movie of zebrafish otic development. Labelling by (Tg(actb2:Hsa.H2B-tdTomato)hm25; Tg(actb2:mem-citrine)hm26) from 12 to 32 hpf. Each frame has a spatial-sampling of 0.2 µm with temporal-sampling of 2 min across frames. The movie shows the formation of the otic placode (12 hpf), polarization and epithelialization of the otic vesicle (12–16 hpf), lumenization (16hpf), and subsequent growth. Both initial lumenogenesis (12-16hpf) and growth (16–45 hpf) phases are accompanied by frequent cell division events. Cells divide by moving apically and re-integrating into the epithelium. At the same time, cells appear to shrink in volume as numbers increase. During growth, cells change shape into a squamous form that coincide with the accumulation of lumenal fluid. Cell shape change is non-uniform across the medial (squamous) and pole cells (columnar). Concomitantly, deformations in the adjacent hindbrain and ectoderm tissue are visible.
Figure 2
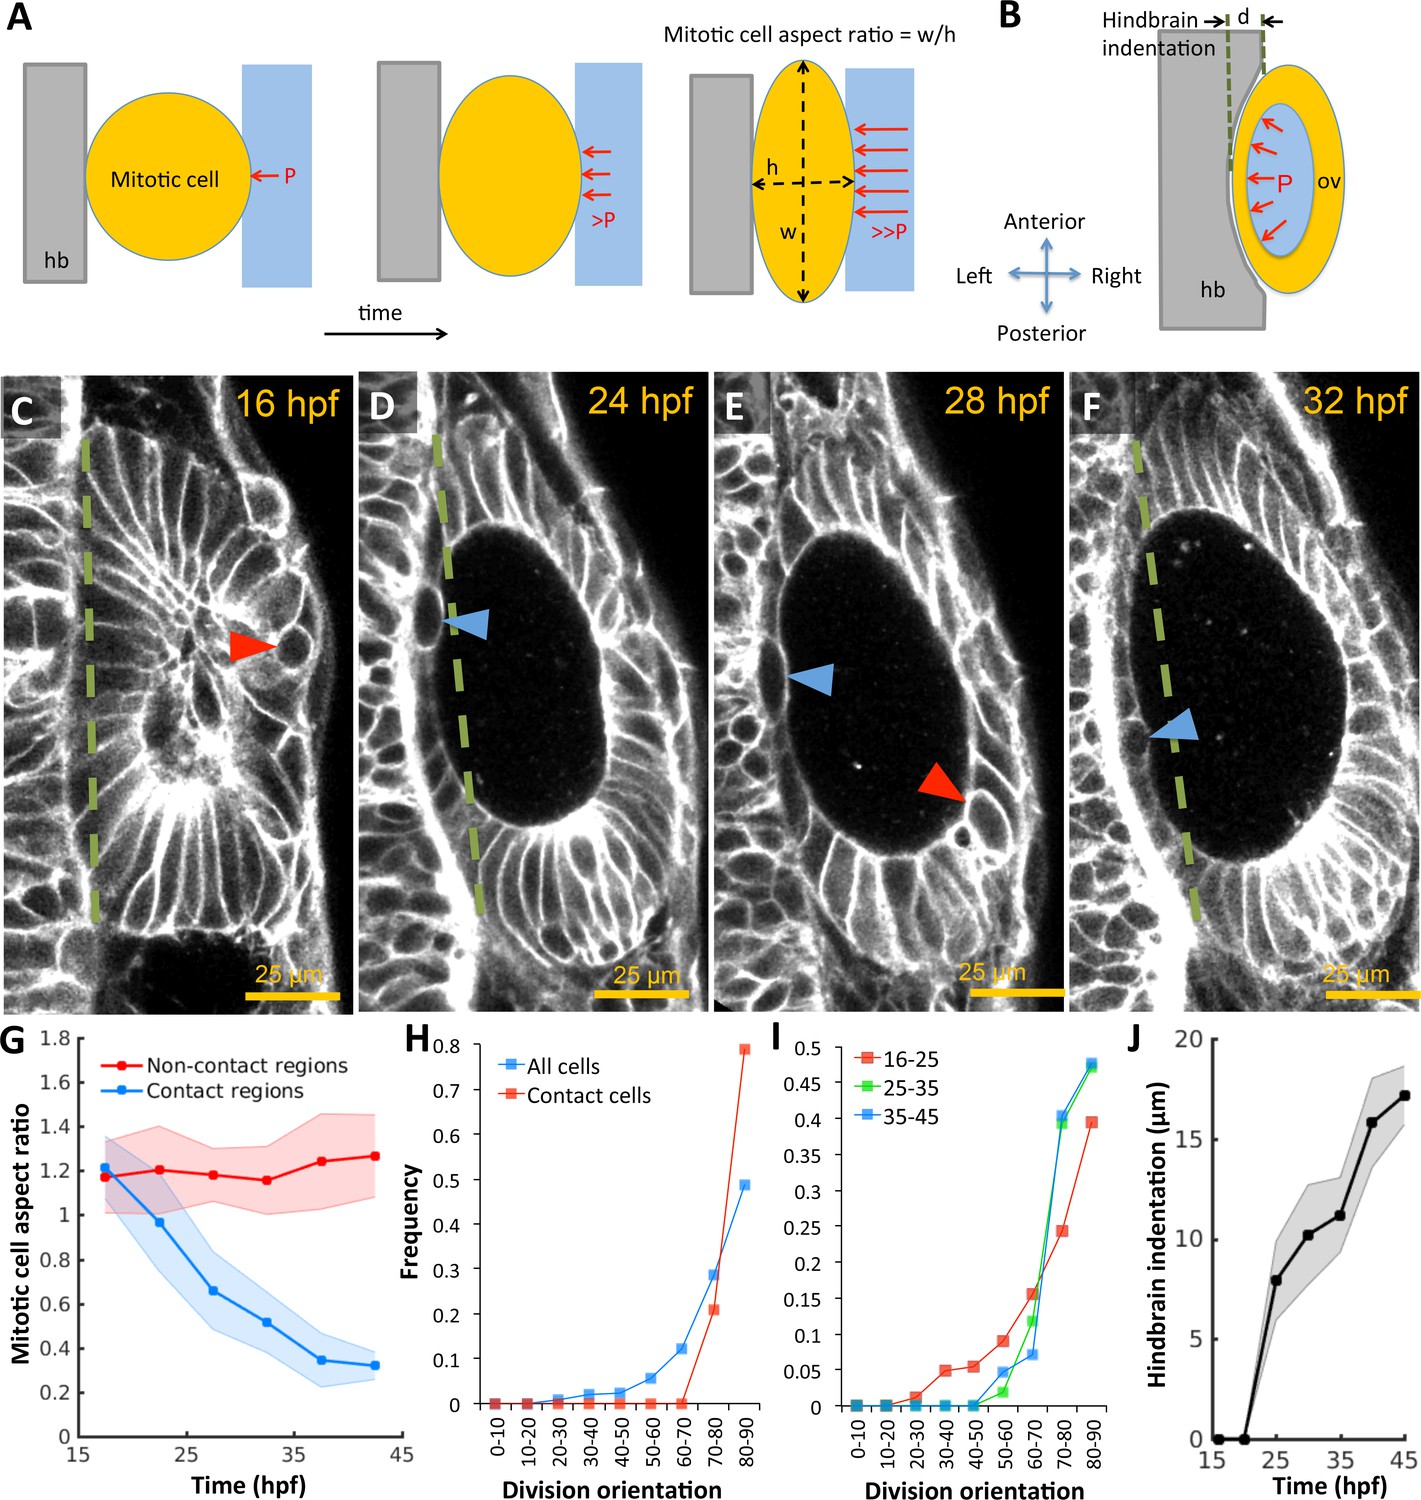
Otic vesicle growth is correlated with deformations in mitotic cell shapes and neighboring tissues that are indicative of pressure-driven strain.
(A) Diagram illustrating inhibition of mitotic rounding just prior to cytokinesis from lumenal pressure and reactionary support from hindbrain tissue (hb, grey). (B) Diagram illustrating the deformation of the adjacent hindbrain tissue (hb, grey) as the otic vesicle grows from internal pressure. (C–F) 2D confocal micrographs of the otic vesicle at (C) 16 hpf, (D) 24 hpf, (E) 28 hpf, and (F) 32 hpf highlighting the progressive deformation of adjacent hindbrain and ectoderm tissues relative to the dashed-green line. The red and blue arrow heads highlight the progressive deformation in the shape of mitotic cells at contact and non-contact regions, respectively. (G) Quantification of mitotic cell aspect ratios at contact regions (hindbrain-vesicle or ectoderm-vesicle interface, blue markers) and other non-contact regions (anterioposterior poles, red markers, n = 54 mitotic cells total, 5–10 embryos per timepoint, each embryo provided 0–2 mitotic events such that each datapoint represent 4–5 mitotic events, *p<1.0e-4 at 22 hpf and *p<1.0e-5 at 27 hpf, as determined by student t-test (unpaired)). Aspect ratio is measured as the ratio of apico-basal to lateral cell radii. (H) Distribution of division plane orientation relative to the lumenal surface-normal at contact and non-contact cell populations. (I) Distribution of division plane orientation for all cells across three stages 16–25, 25–35, and 35–45 hpf respectively. (J) Quantification of hindbrain deformation measured as the peak indentation depth (relative to the dashed green line segment in C-F). n = 10 embryos per data point. Error bars are SD.
Figure 3 with 2 supplements
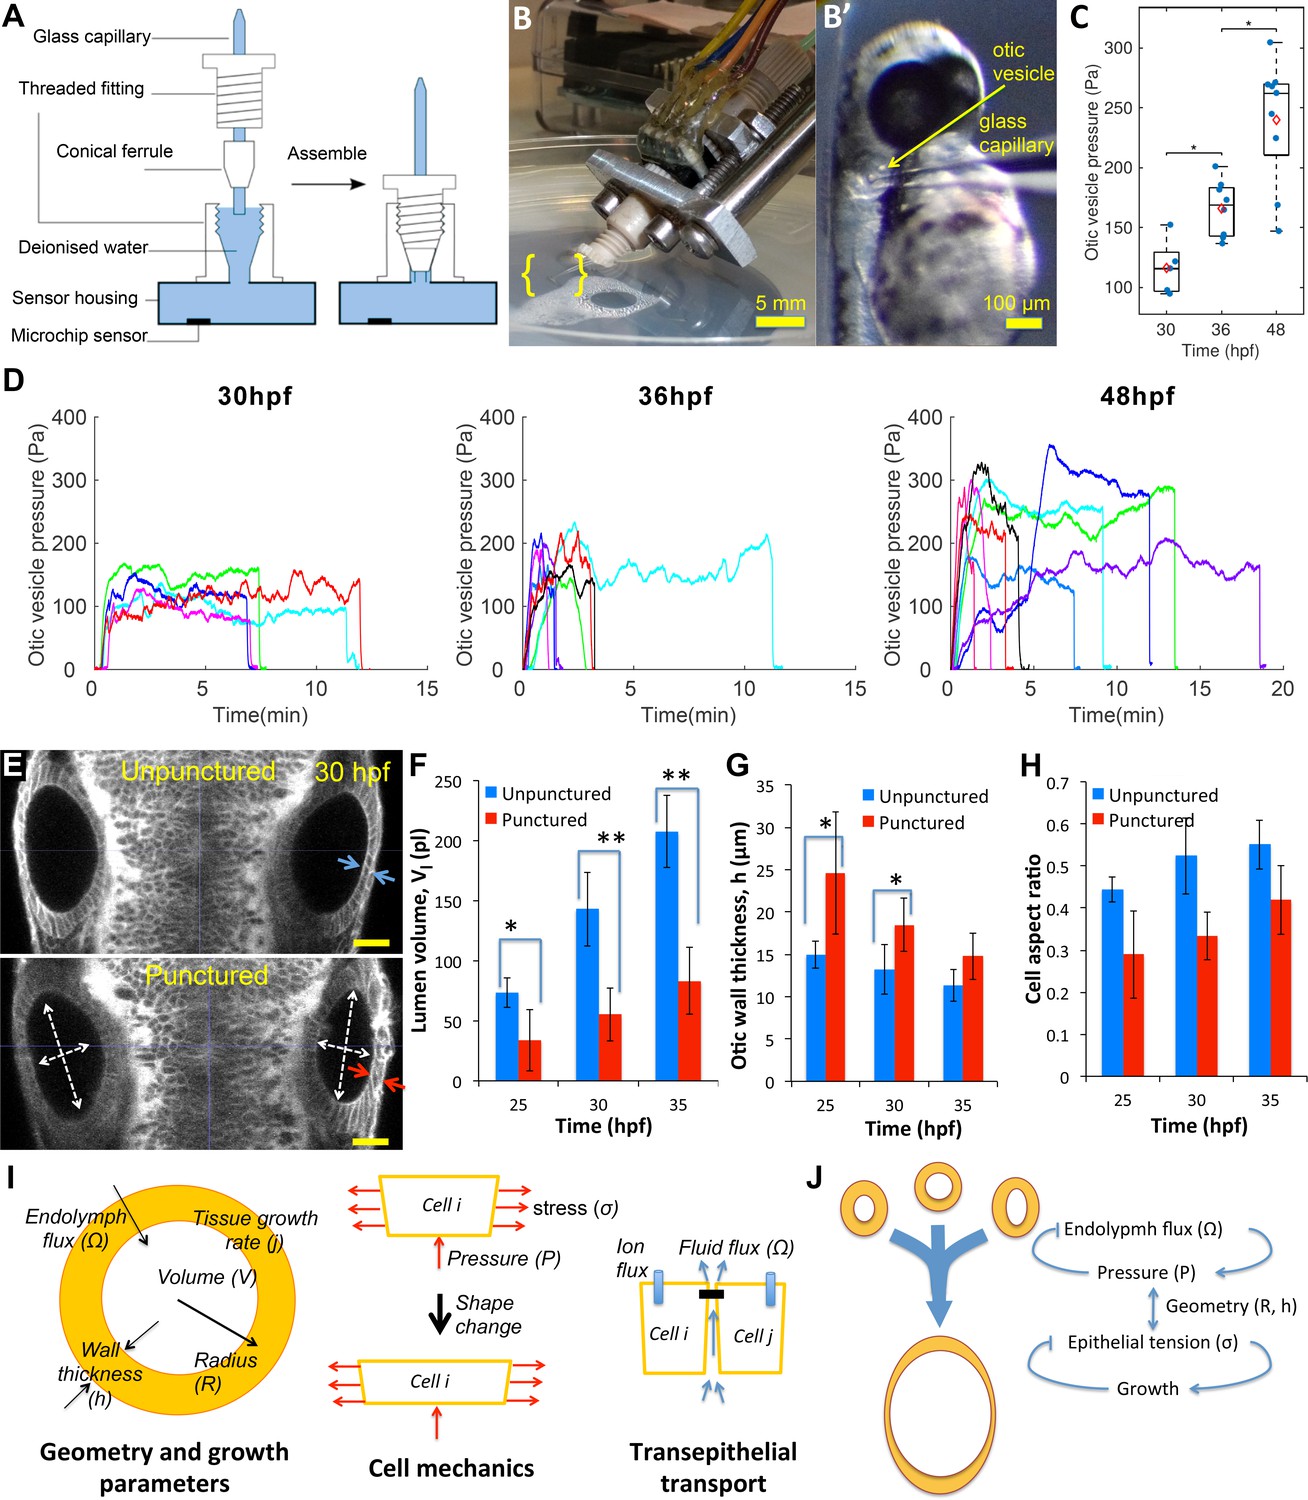
Lumenal pressure drives otic vesicle growth.
Pressure measurements in the otic vesicle using a piezo-resistive solid-state sensor. (A) Schematic drawing of the pressure probe assembly, not to scale. (B) The capillary-based probe is mounted on a micromanipulator and zebrafish embryos are immobilized and mounted in Danieau buffer. (B’) Under a stereo microscope, the glass capillary is inserted into the otic vesicle. (C) Otic vesicle pressures at different developmental stages of wild-type zebrafish embryos (red diamond: mean value. *p<5.0e-2). (D) Pressure was measured in otic vesicle at 30 hpf, 36 hpf, and 48 hpf. Presented trajectories were live readings from embryos immobilized with -bungarotoxin protein. Each color represents an individual test. (E) 2D confocal micrographs showing both ears at 30 hpf before (top) and after (bottom) unilateral puncture of the right vesicle. Changes in cell shape from squamous (blue arrows) to columnar (red arrows) are shown. Scale bar is 25 µm. (F–H) Quantification of changes from puncturing: (F) lumen volumes (, n = 10, *p<1.0e-4,**p<1.0e-5), (G) average vesicle wall thickness (, n = 10, *p<5.0e-3), and (H) average cell aspect-ratio (n = 10, error bars are SD). (I) Model relating vesicle geometry, growth rate, and fluid flux to pressure, tissue stress, and cell material properties. (J) Multi-scale regulatory control of otic vesicle growth linking pressure to fluid transport. Related to Figure 3—figure supplements 1–2.
Figure 3—figure supplement 1

Pressure probe calibration and characterizations.
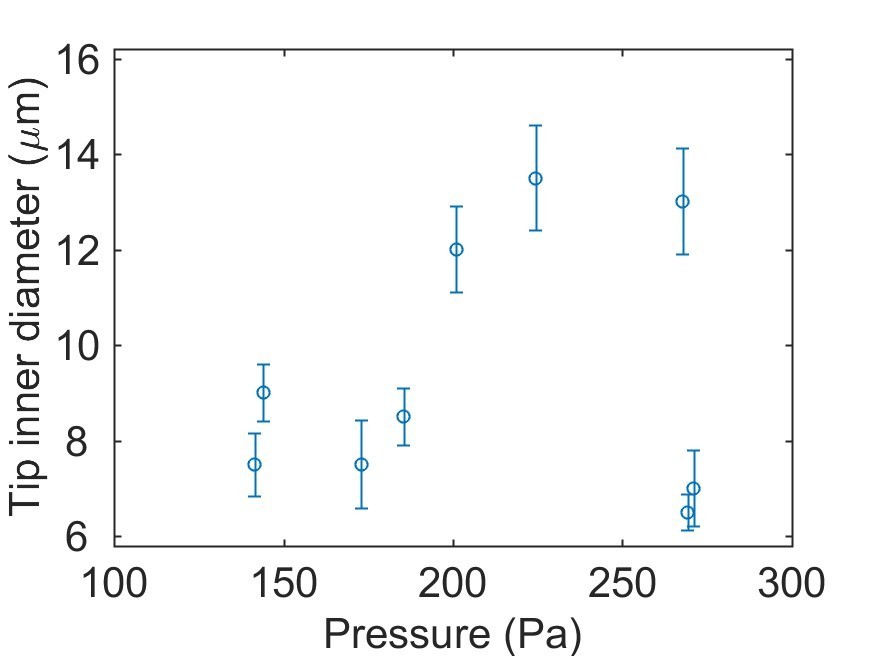
(A) The fabricated pressure probe was calibrated with hydrostatic pressure by reducing the submersion depth stepwise (inset, 1mmH2O = 9.8 Pa), which demonstrated good linearity. (B) The pressure probes were calibrated against combinations of the capillary inner diameter and the ionic composition of the bath medium. The probes were displaced stepwise (1.27mmH2O = 12.45 Pa, dotted line) and the histogram of pressure changes is shown. No dependence on the configurations is observed. (C–D) Calculations of membrane deformation on the piezoresistive sensing element. Colors represent different membrane thickness. (C) The numerical results are compared against analytical solutions for the deformation at the membrane center. (Inset) A selected solution is shown for a 5 µm membrane under 250 Pa pressure. The corresponding volume changes are shown in (D) and the volume of a 200 µm diameter sphere is plotted in dotted line as a reference. (E) Calculations of diffusive mixing between endolymph and capillary filling after puncturing. Their initial ionic concentrations are C0 and 0, respectively. The mean ionic concentration inside the vesicle C decreases over time t at a rate depending on the capillary inner diameter d. (Inset) Selected solutions are shown for d = 5, 15 µm in the first 5 min. (F) Stages in an otic vesicle pressure measurement. Upper: zooming into the first 1.5 min. I: the tip was placed near the vesicle. The hydrostatic pressure was used as the baseline. II: after puncturing, the pressure built up gradually. III: after reaching a plateau, the pressure fluctuated around a mean value. This value was taken as the measurement result. IV: Upon withdrawing the tip from the vesicle, the pressure dropped to the base line, proving that the probe had been sensing the hydrostatic pressure in the enclosed domain.
Figure 3—figure supplement 2
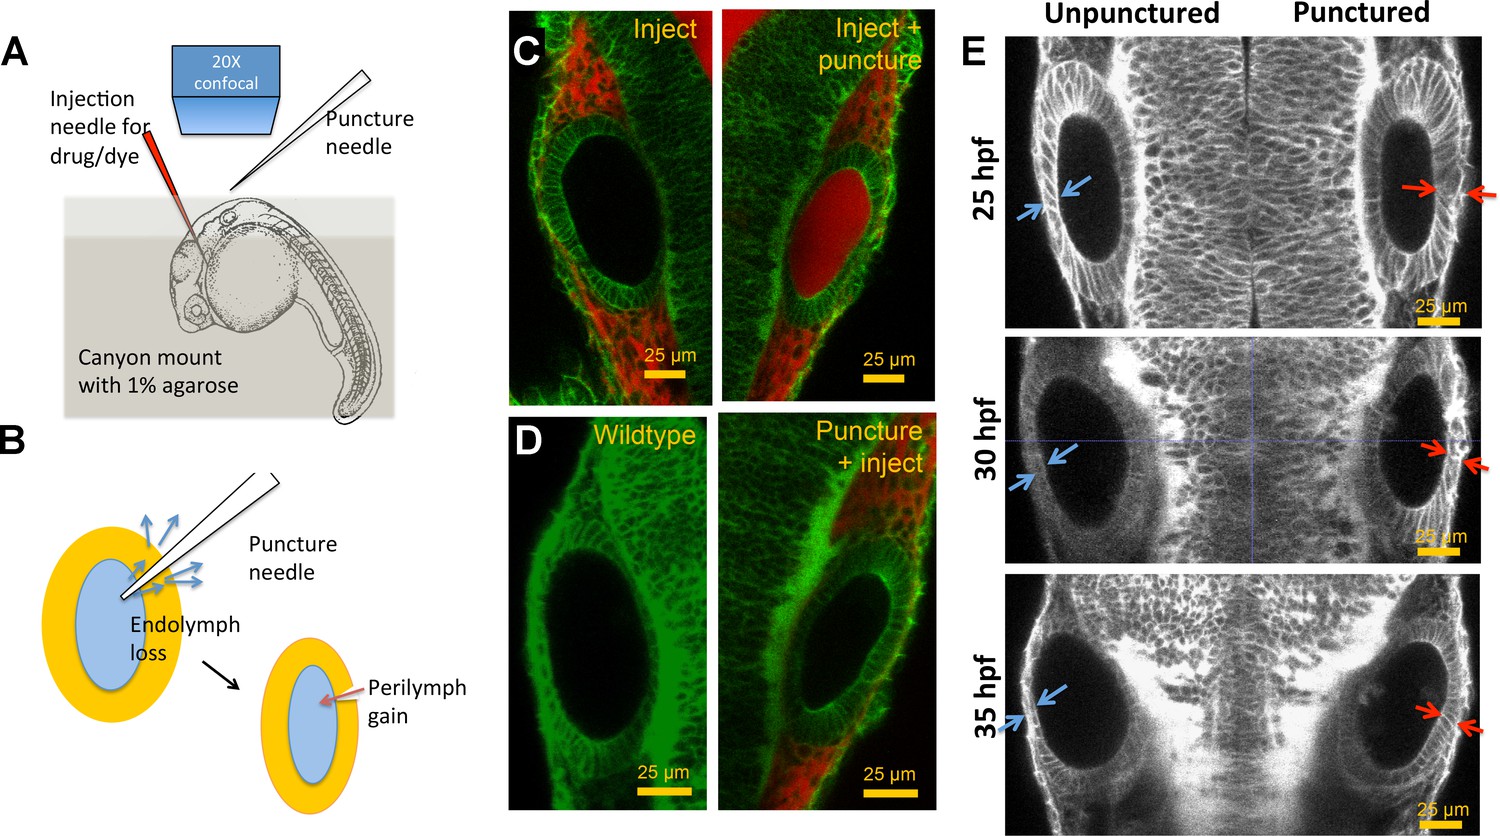
Otic vesicle puncturing experiments.
(A) Embryos are mounted in a canyon mount made with 1% agarose for confocal imaging of left and right vesicles with a 20X objective. Drugs or dyes are injected into the cardiac chamber and get distributed rapidly throughout the embryo including the perilymph surrounding the ear. (B) Schematic showing the route of lumenal fluid loss upon puncture and movement of dye from perilymph into the lumen. (C) 2.3 nl of 0.5 mM Alexa Fluor 594 tracer dye injected into the cardiac chamber at 30 hpf. The dye enters the circulation and is found to accumulate in the perilymph regions surrounding the vesicle. Puncturing of otic vesicle causes the dye to leak into the lumenal cavity. (D) Injection of dye five minutes post-puncture restricts dye transport to the perilymph, thus demonstrating the rapid sealing property of the otic tissue. (E) 2D confocal micrographs showing ear pairs in embryos with unilateral puncture of the right ear and staged at 25, 30, and 35 hpf. Cell shape change in unpunctured and punctured ears are highlighted using blue and red arrows respectively. Progressively through time, puncturing causes smaller transitions in cell shapes between ear pairs.
Figure 4 with 2 supplements
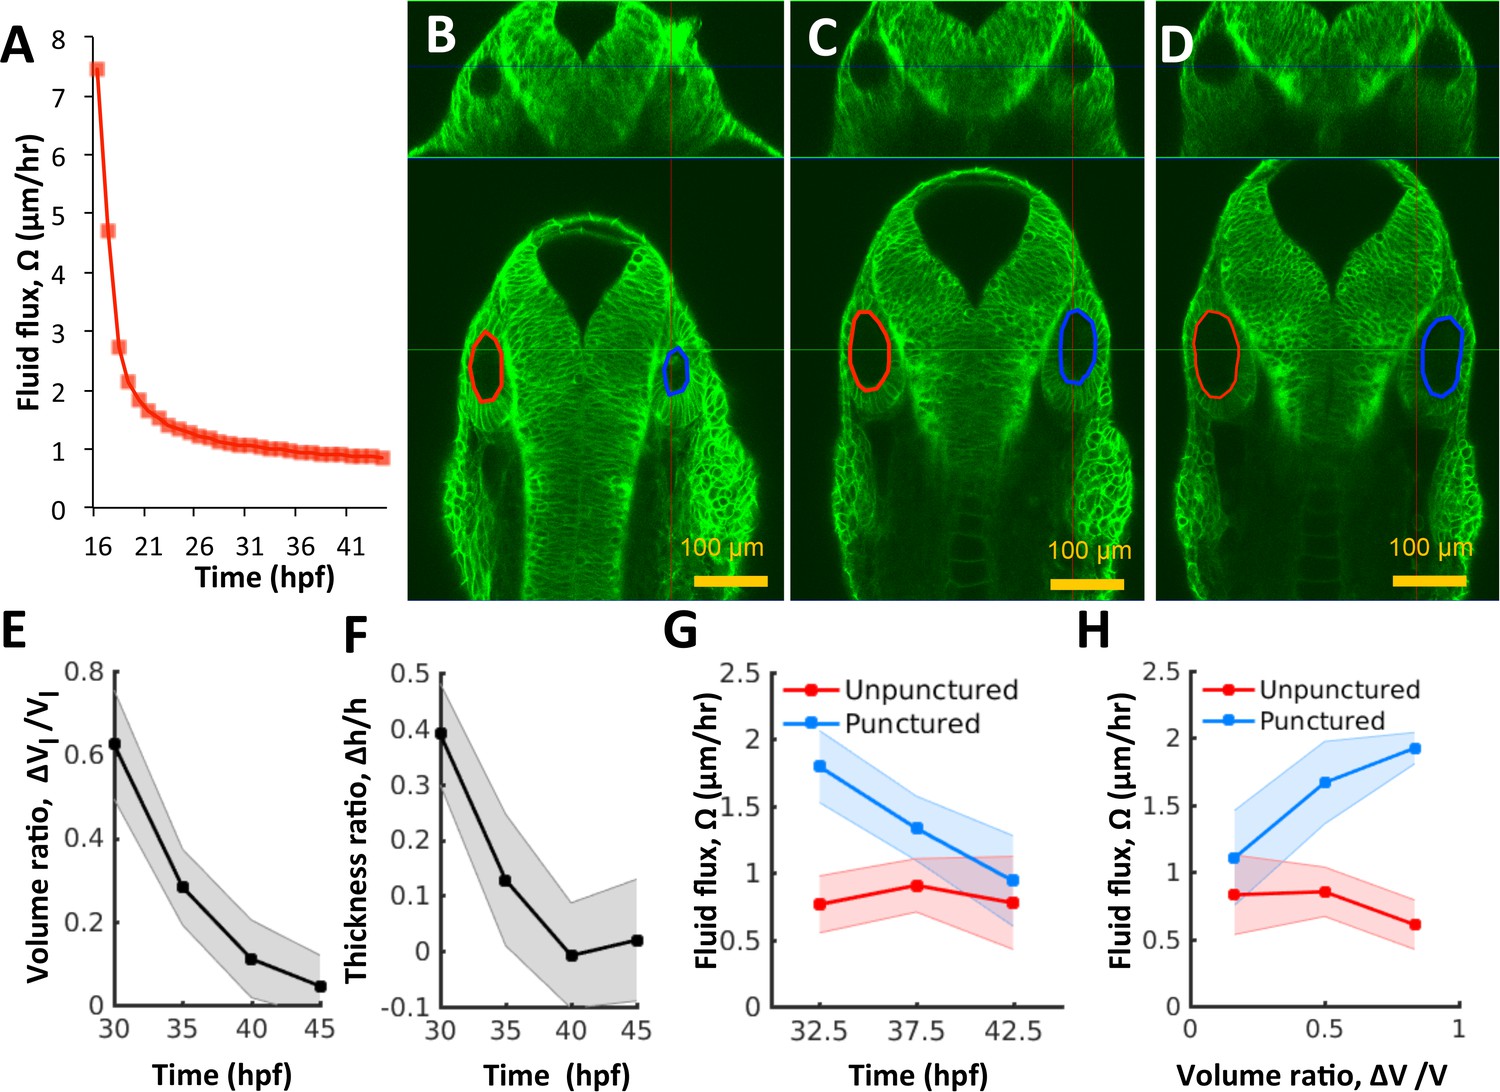
Pressure negatively regulates fluid flux.
(A) Numerical calculation of fluid flux () as a function of time using Equation 6 by fitting quadratic polynomials to volume and surface area data. (B–D) Confocal 2D micrographs with XZ (top) and XY (bottom) planes depicting the regeneration of a punctured right vesicle (blue) relative to the unpunctured vesicle (left) from (A) 30 hpf right after puncture, to (B) 32.5 hpf, and to (C) 35 hpf. (E–F) Quantification of the recovery of volume and wall thickness symmetry. The y-axis plots the difference in lumenal volumes normalized to the unpunctured lumenal volume (, E) and similarly for wall thickness (, F). Error bars are SD. (G) Fluid flux in the punctured ears (blue) and unpunctured ears (red). Error bars are SD. (H) Scatterplot showing as a function of volume asymmetry () in punctured (blue) and unpunctured (red) ears. n = 10 for each data point in (E–H) Related to Figure 4—figure supplement 1 and Figure 4—video 1.
Figure 4—figure supplement 1
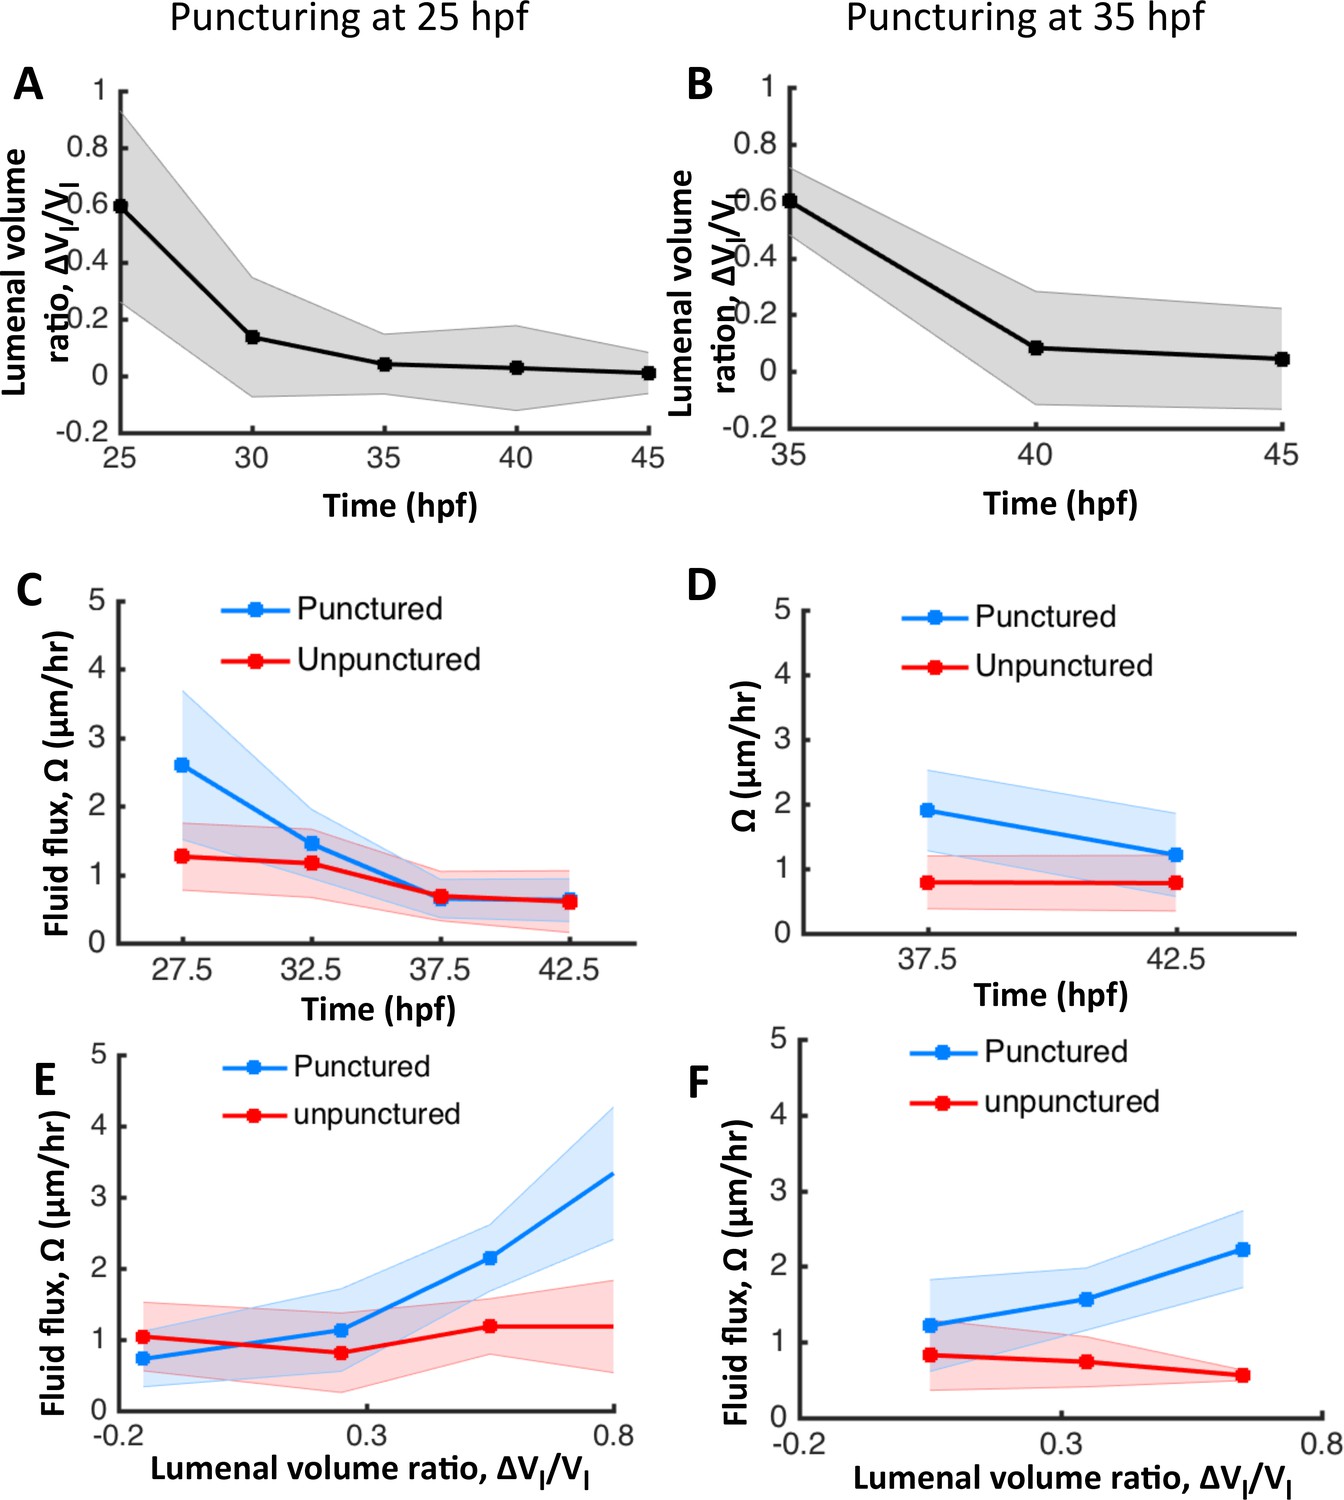
The otic vesicle regenerates to stage-specific volumes when punctured between 25–45 hpf.
In addition to experiments at 30 hpf reported in Figure 4, puncturing was conducted at 25 hpf (A, C, E) and 35 hpf (B, D, F). (A–B) Volume regeneration and establishment of contralateral symmetry after unilateral puncturing. The y-axis plots the difference in lumenal volumes normalized to the unpunctured volume (). (C–D) Lumenal fluid flux in punctured (blue) and unpunctured (red) vesicles during regeneration showing the increase in in punctured embryos and gradual decay to the unpunctured levels. (E–F) Plot showing as a function of . The data was pooled across multiple embryos for the punctured (blue) and unpunctured (red) ears throughout their regeneration period until 45 hpf. in punctured ears (blue) is positively correlated with while unpunctured ears (red) continued growing with an approximately constant flux.
Figure 4—video 1
Otic vesicle catch-up growth after puncture.
2D+time confocal movie of zebrafish otic vesicle regeneration from puncture. Labelling by (Tg(actb2:Hsa.H2B-tdTomato)hm25; Tg(actb2:mem-citrine)hm26) from 27 to 33 hpf. Each frame has a spatial-sampling of 0.4 µm along X-Y axis, 1.0 μm along the Z-axis, and with temporal-sampling of 5 min across frames. The movie shows the transverse (XZ) and saggital (XY) views. The right vesicle of the embryo was punctured prior to imaging. At the start of the imaging session, the right ear is significantly smaller that the left ear. The movie shows the rapid regeneration of the right vesicle to a developmentally appropriate size, as depicted by the left ear (control). At the end of the imaging session, both the ears are similar in size.
Figure 5 with 1 supplement
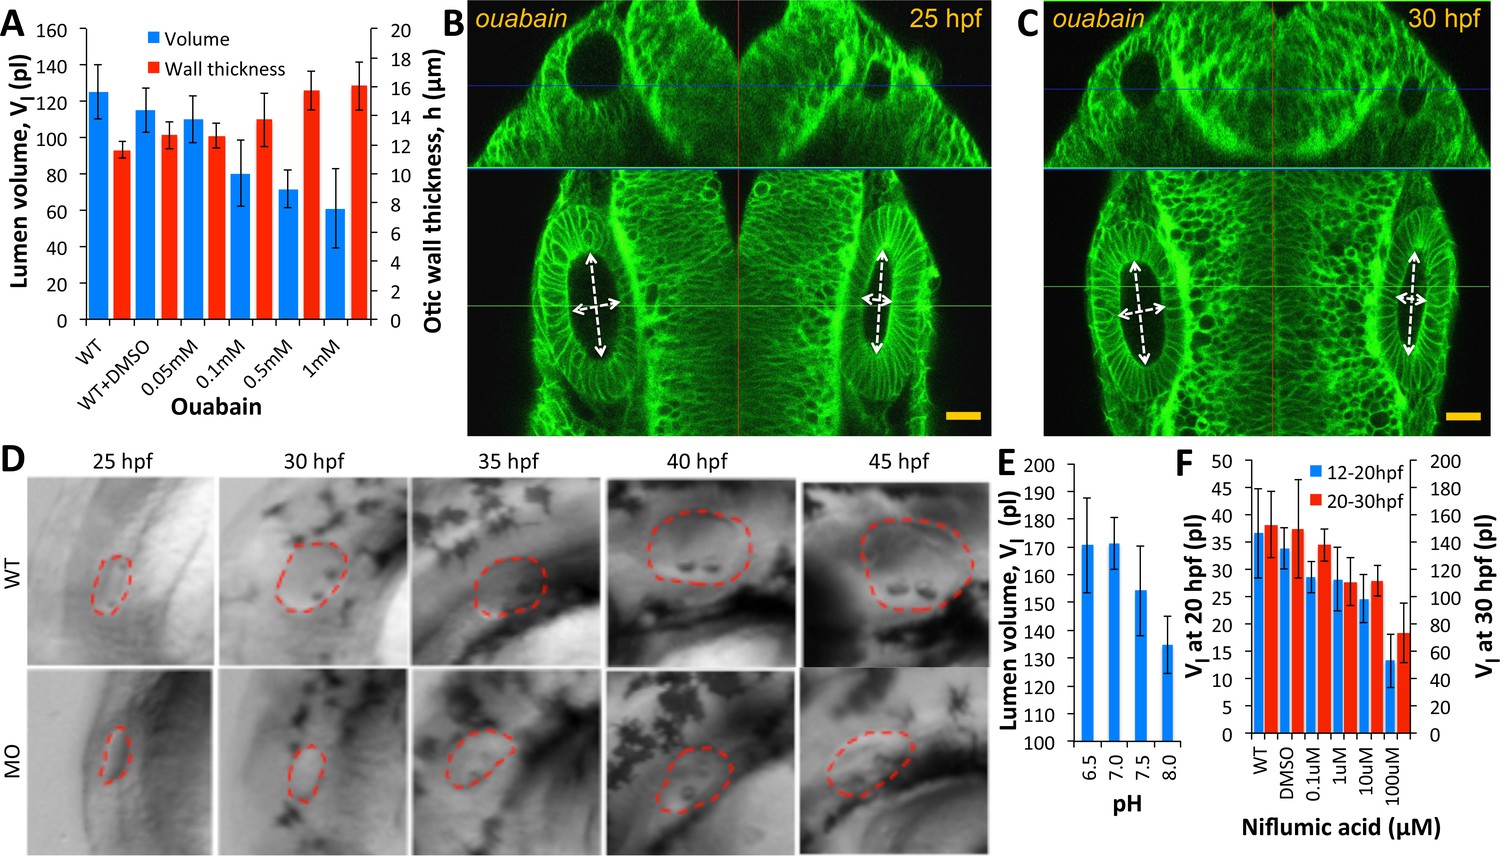
Ear size is affected by disruptions in ion transport.
(A) Quantification of lumenal volume () and wall thickness () at 30 hpf after ouabain treatment at 20 hpf. Error bars are SD. (B–C) Confocal micrographs showing the inhibition of growth in unpunctured (left) and punctured (right) vesicles after incubation in 100 µM ouabain to the buffer at 25 hpf. Scale bar 25 µm. (D) Brightfield images comparing the growth (25-45hpf) of the wild-type otic vesicle against the antisense morpholino (0.25 ng) targeting the translation of Na,K-ATPase α1a.1 mRNA. (E) Quantification of lumenal volumes at 30 hpf after acidification of buffer (pH of 6.5–8.0) at 12 hpf. (F) Dose-dependent decrease in lumenal volumes observed after the addition of Niflumic acid, a chloride channel inhibitor at 12 hpf (blue) or 20 hpf (red).n = 5 for each data point Related to Figure 5—video 1.
Figure 5—video 1
Abscence of both regular and catch-up growth when salt transporters inhibited.
2D+time confocal movie showing growth and regeneration inhibition from ouabain treatment. Labelling by (Tg(actb2:Hsa.H2B-tdTomato)hm25; Tg(actb2:mem-citrine)hm26) from 30 to 34 hpf. Each frame has a spatial-sampling of 0.4 µm along X-Y axis, 1.0 μm along the Z-axis, and with temporal-sampling of 5 min across frames. The movie shows the transverse (XZ) and saggital (XY) views. The embryo was soaked in 100μM ouabain to inhibit Na+-K+-ATPase. The right vesicle of the embryo was punctured prior to imaging. At the start of the imaging session, the right ear is significantly smaller that the left ear. Throughout the imaging session, regular growth in the left ear and regeneration of the right ear are completely inhibited.
Figure 6 with 5 supplements
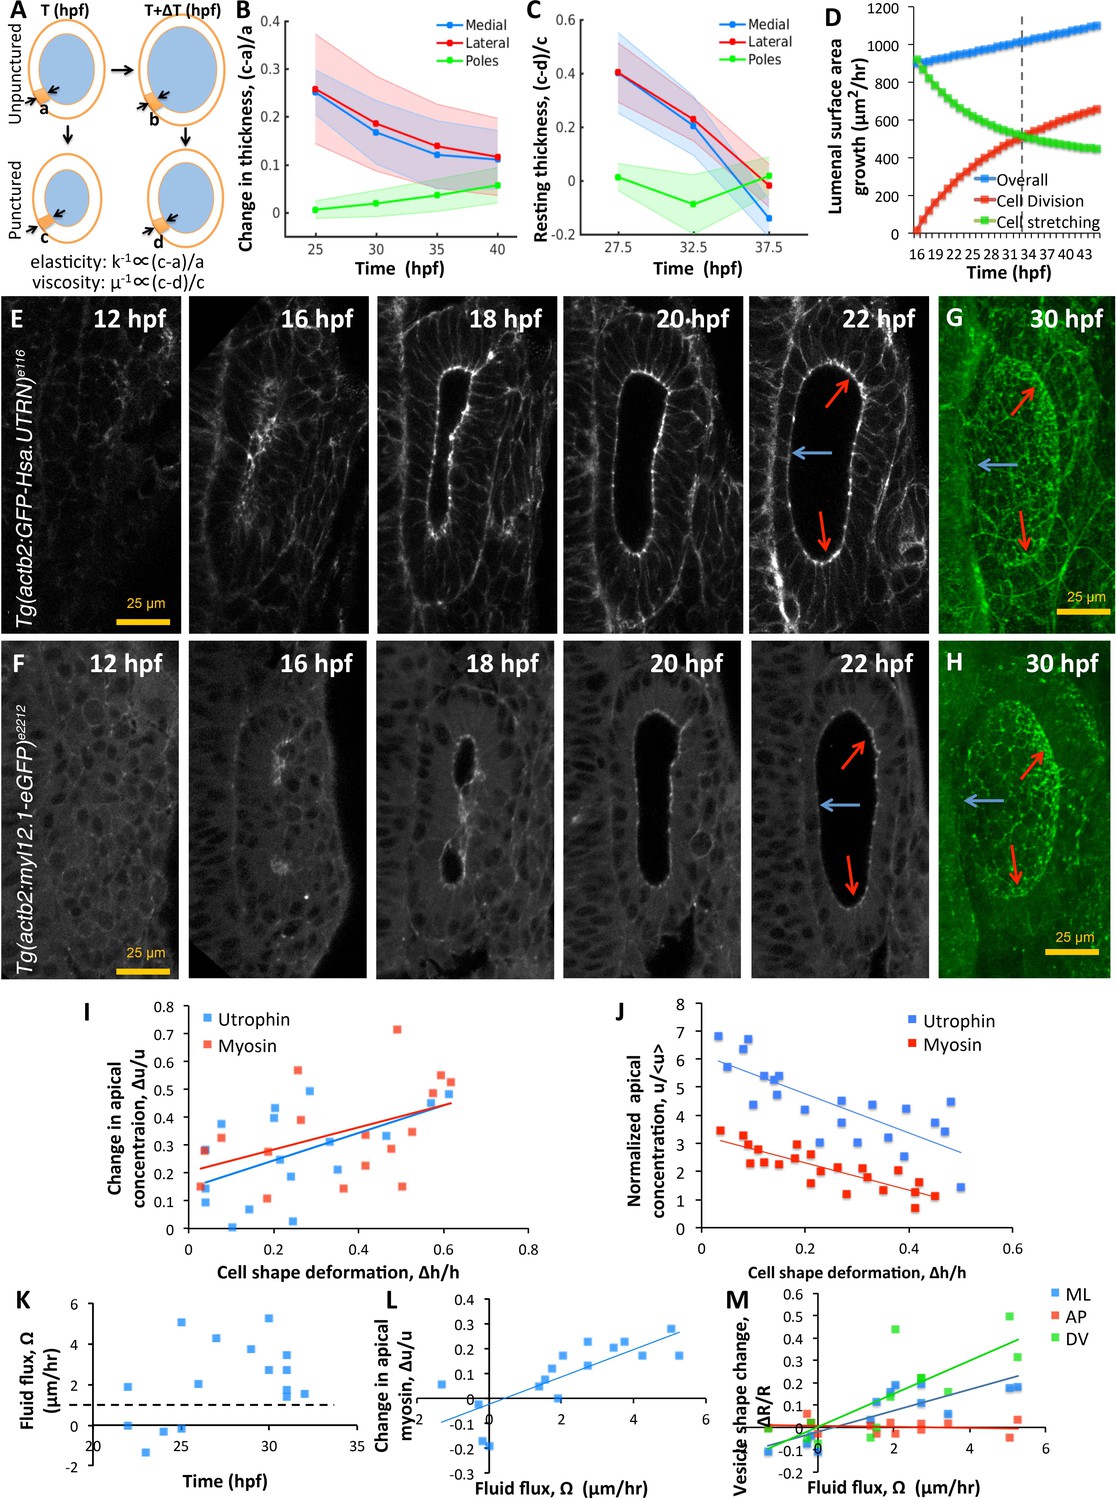
Spatial patterning of material properties results in regional thinning of tissue.
(A) Schematic for experimentally measuring tissue material properties (, ). The strain of a cell (highlighted in orange) before and after puncturing is inversely proportional to the elasticity modulus k. Changes in resting cell-shapes observed over time () is inversely proportional to the viscosity parameter µ. (B–C) Quantification of normalized change in wall thickness ( , (B) and resting wall thickness (, (C) post-puncture near the hindbrain (medial, blue), ectoderm (lateral, red), and anteroposterior regions (poles, green). Puncturing was done at 25, 30, 35, and 40 hpf. n = 5 for each data point in (B–C). (D) Overall lumenal surface area growth rate (blue markers) showing compensatory contributions from proliferation (red) and cell stretching (green). (E–F) Timelapse confocal imaging using Tg(actb2:GFP-Hsa.UTRN) and Tg(actb2:myl12.1-eGFP) embryos report the dramatic apical localization of F-actin (D) and Myosin II (E) respectively prior to lumenization through 12-16hpf. Through early growth between 16–22 hpf, cells at the poles and lateral regions (red arrows) retain their fluorescence while medial cells lose their fluorescence (blue arrows). (G–H) 3D rendering of F-actin (G) and myosin II (H, right) data at 30 hpf show co-localization to apicolateral cell junctions as cells stretch out. (I) Quantification of long-term cell shape deformation () between 16–22 hpf as a function of the rate of change in apical concentration () of F-actin (blue markers) and Myosin II (red). n = 22. (J) Quantification of the short-term puncture-induced deformation in cell shapes () as a function of the normalized apical concentration () of F-actin (blue markers) and Myosin II (red). < u > represents the mean apical fluorescent intensity across the vesicle. Error bars are SD, n = 22. (K) Quantification of fluid flux in embryos treated with 2 mM cytochalasin D at different developmental stages (hpf). Before 25 hpf, embryos failed to grow () or lose lumenal volume. After 25 hpf, embryos increased their secretion rate by 2-5X over wild-type values (dashed black line, 1 µm/hr, n = 15). (L) Quantification showing the change in apical Myosin II fluorescence () as positively correlated with fluid flux (, n = 16). (M) Quantification of vesicle shape change show maximal change in dorsoventral radius (green markers) compared to the mediolateral (blue) and anteroposterior radius (red, n = 12). Related to Figure 6—figure supplement 1 and Figure 6—videos 1–4.
Figure 6—figure supplement 1

Pole cells retain their aspect ratios as they move from high to low-curvature tissue regions between 25–30 hpf.
(A) Pole cells are tracked from 25 hpf (left) to 30 hpf (right) as they treadmill from high-curvature to low-curvature (dashed blue curves) tissue regions. Mean curvature of the lumenal surface is used as a measure of the local curvature. (B) Quantification of the cell aspect ratios and mean curvature shows that cells retain their shapes independent of the location on the lumenal surface (n = 10, **p<5.0e-5). Error bars are SD. (C) For the measurement of single-cell data on shape deformations in Figure 6I, mosaically labeled cells were tracked in Tg(actb2:GFP-Hsa.UTRN) before and after puncture. Dextran TexasRed was injected into a single blastomere of 16 cell stage embryos for tracking positions of cells before and after puncture. Confocal 3D image datasets were collected before and after puncture and co-registered. The confocal micrographs show XY, YZ, XZ, and a 3D triplanar view centered on the otic vesicle of a single embryo staged at 30 hpf before (top) and after puncture (bottom). Cells positive for TexasRed fluorescence (examples shown in red, blue, and white arrows) were matched before and after puncture. For each cell, the deformation and fluorescence localization were manually measured using the GoFigure2 software.
Figure 6—video 1
Spatiotemporal dynamics of F-actin localization.
A 2D+time confocal movie of zebrafish otic development from 12 to 32 hpf using Tg(actb2:GFP-Hsa.UTRN) (shown in red) embryos that depict the localization of F-actin (membrane show in green from Tg(actb2:mem-cherry2)). Each frame has a spatial-sampling of 0.2µm with temporal-sampling of 2 min across frames. The movie shows the formation of the otic vesicle (12–16 hpf) with apical localization of F-actin in cells. During growth (16-22hpf), F-actin is found to localize to apicolateral junctions between cells. In addition, mediolateral cells relatively lose their F-actin signal levels compared to cells at the sensory poles.
Figure 6—video 2
Spatiotemporal dynamics of myosin II localization.
A 2D+time confocal movie of zebrafish otic development from 12 to 32 hpf using Tg(actb2:myl12.1-eGFP) embryos depict Myosin II localization dynamics. Myosin II localization is expectedly correlated with that of F-actin (Figure 6—video 1). Each frame has a spatial-sampling of 0.2µm with temporal-sampling of 2 min across frames.
Figure 6—video 3
Deformation of the inflated otic vesicle after treatment with cytochalasin D.
A 2D+time confocal movie of zebrafish otic vesicle was captured at 25 hpf using Tg(actb2:myl12.1-eGFP) embryos treated with 100μM of cytochalasin D drug. The vesicle is found to dramatically reduce Myosin II apical intensity levels and change its DV/LR dimensions compared to the AP dimension. The red lines indicate dimensions at the start of the movie for comparison. Each frame has a spatial-sampling of 0.2µm with temporal-sampling of 1 min across frames for a total of thirty minutes.
Figure 6—video 4
Vesicle fails to grow upon treatment with cytochalasin D drug at 20 hpf.
A 2D+time confocal movie of zebrafish otic vesicle was captured at 20 hpf using Tg(actb2:myl12.1-eGFP) embryos treated with 100 µM of cytochalasin D drug. The vesicle is found to dramatically reduce Myosin II apical intensity levels and growth is inhibited.
Author response image 1
Tables
Key resources table
| Reagent type (species) or resource | Designation | Source or reference | Identifiers | Additional information |
|---|---|---|---|---|
| Strain, strain background (Danio rerio) | Tg(actb2:myl12.1-EGFP)e2212 | gift from CP Heisenberg's lab, PMID: 25535919 | e2212; ZFIN ID: ZDB-ALT-130108-2 | Behrndt et al., 2012 |
| Strain, strain background (Danio rerio) | Tg(actb2:GFP-Hsa.UTRN)e116 | gift from CP Heisenberg's lab, PMID: 25535919 | e116; ZFIN ID: ZDB-ALT-130206-3 | Behrndt et al., 2012 |
| Strain, strain background (Danio rerio) | Tg(actb2:mem-citrine-citrine)hm30 | Megason lab, PMID: 25303534 | hm30; ZFIN ID: ZDB-ALT-150209-1 | Xiong et al., 2014 |
| Strain, strain background (Danio rerio) | Tg(actb2:mem-citrine)/(actb2:Hsa.H2b-tdTomato)hm32 | Megason lab, PMID: 27535432 | hm32; ZFIN ID: ZDB-ALT-161213-1 | Aguet et al., 2016 |
| Strain, strain background (Danio rerio) | Tg(actb2:mem-citrine)/(actb2:Hsa.H2b-tdTomato)hm33 | Megason lab, PMID: 27535432 | hm33; ZFIN ID: ZDB-ALT-161213-2 | Aguet et al., 2016 |
| Strain, strain background (Danio rerio) | Tg(actb2:mem-mcherry2)hm29 | Megason lab, PMID: 23622240 | hm29; ZFIN ID: ZDB-ALT-120625-1 | Xiong et al., 2013 |
| Strain, strain background (Danio rerio) | AB | ZIRC, Eugene, OR | ZFIN ID: ZDB-GENO-960809-7 | |
| Chemical compound, drug | Dextran, Texas Red, 3000 MW | Thermo Fisher Scientific, Waltham, MA | D-3329 | |
| Chemical compound, drug | AlexaFluor 594 | Thermo Fisher Scientific, Waltham, MA | A10442 | |
| Chemical compound, drug | Oubain | Sigma Aldrich | 11018-89-6 | |
| Chemical compound, drug | Cytochlasin D | Sigma Aldrich | C8273 | |
| Chemical compound, drug | Niflumic acid | Sigma Alrich | 4394-00-7 | |
| Sequence-based reagent | Morpholino | Gene tools | 5'-gccttctcctcgtcccattttgctg-3' | Blasiole et al., 2003 |
| Commercial assay or kit | mMessage mMachine T7 ULTRA kit | Thermo Fisher Scientific, Waltham, MA | AM1345 | |
| Other | Board mount pressure sensor | Honeywell | HSCDANT001PG3A5 | pressure probe |
| Other | glass capillary | World Precision Instrument | 1B100-6 | pressure probe |
| Other | NanoPort Assembly Headless, 10-32 coned for 1/16" | idex-hs.com | n-333 | pressure probe |
| Other | Sleeve- 1517 Tefzel (ETFE) Tubing, ID 0.04", OD 1/16" | idex-hs.com | 1517 | pressure probe |
| Other | Arduino uno | sparkfun.com | R3 | pressure probe |
| Sequence-based reagent | pmtb-t7-alpha-bungarotoxin | addgene, Swinburne et al., 2015 | Addgene #69542 | |
| Software, algorithm | In toto image analysis toolkit (ITIAT) | Megason lab | https://wiki.med.harvard.edu/SysBio/Megason/GoFigureImageAnalysis | |
| Software, algorithm | Cmake | |||
| Software, algorithm | ITK libraries | www.itk.org | ||
| Software, algorithm | VTK libraries | www.vtk.org | ||
| Software, algorithm | GoFigure2 | Megason lab, in preparation | www.gofigure2.org | |
| Software, algorithm | Powercrust | Amenta et al., 2001 | https://github.com/krm15/Powercrust | |
| Software, algorithm | ACME software | Mosaliganti et al., 2012 | ||
| Software, algorithm | MATLAB (R2014A) | www.mathworks.com |
Additional files
-
Transparent reporting form
- https://doi.org/10.7554/eLife.39596.020
Download links
A two-part list of links to download the article, or parts of the article, in various formats.
Downloads (link to download the article as PDF)
Open citations (links to open the citations from this article in various online reference manager services)
Cite this article (links to download the citations from this article in formats compatible with various reference manager tools)
Size control of the inner ear via hydraulic feedback
eLife 8:e39596.
https://doi.org/10.7554/eLife.39596


