Multiple serine transposase dimers assemble the transposon-end synaptic complex during IS607-family transposition
- David Geffen School of Medicine, University of California at Los Angeles, United States
- University of California at Los Angeles, United States
Figures
Figure 1 with 1 supplement
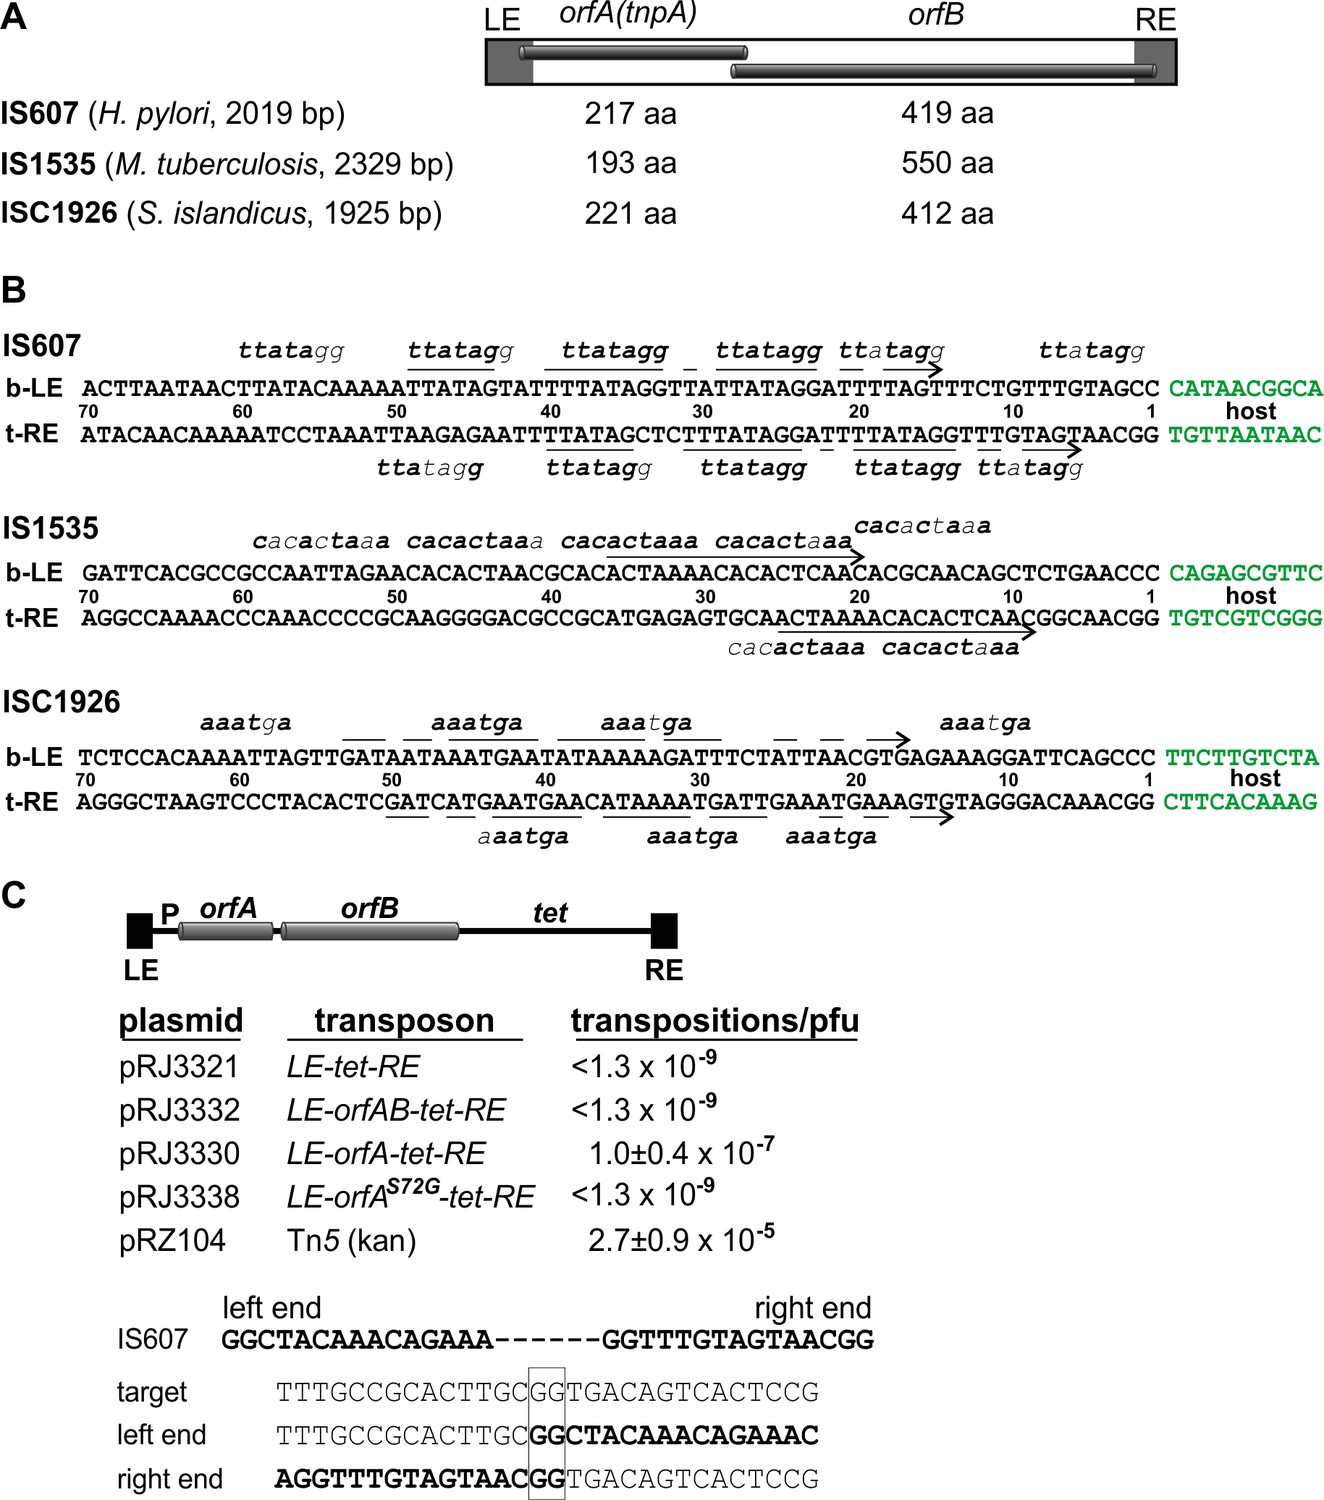
IS607-family transposons.
(A) Overall structure of IS607-family transposons with lengths given for the orfA and orfB coding regions (amino acid residues) of elements discussed in this paper. (B) DNA sequences at the ends of IS607-family transposons. The bottom strand of the left end (b–LE) and top strand of the right end (t–RE) are aligned with flanking host DNA sequences in green. Arrows highlight common sequences (inverted repeats) between the ends, and short sequence motifs (bold type are matches) for individual elements are denoted above and below the end sequences (for IS607 and ISC1926, sequence motif lengths can be extended with A or T on either side). The transposon-host borders for each of these elements have been reassigned based on alignments with related elements in their respective genomes and sequence analysis of transposition events (IS607 and ISC1926). The termini contain a GG, and the unoccupied host target sequences also contain a GG at the exchange site (e.g., panel C). (C) Transposition by IS607 in E. coli. Top: reconstructed IS607 transposons used in the transposition assays. OrfA and orfB, when present, are transcribed from the E. coli lac promoter (P) and contain ribosome binding sites. Middle: transposition frequencies onto phage λ of IS607 derivatives. Average and standard deviations are given for IS607orfA (n = 6) and Tn5 (n = 3) as a comparative control. Bottom: an example of a λ::IS607orfA transposition product. Sequences of the IS607 ends (bold), the unoccupied target, and the left and right end junctions after insertion of IS607orfA are shown. The site of DNA exchange is boxed. Additional insertion site sequences and a compilation are given in Figure 1—figure supplement 1.
Figure 1—figure supplement 1
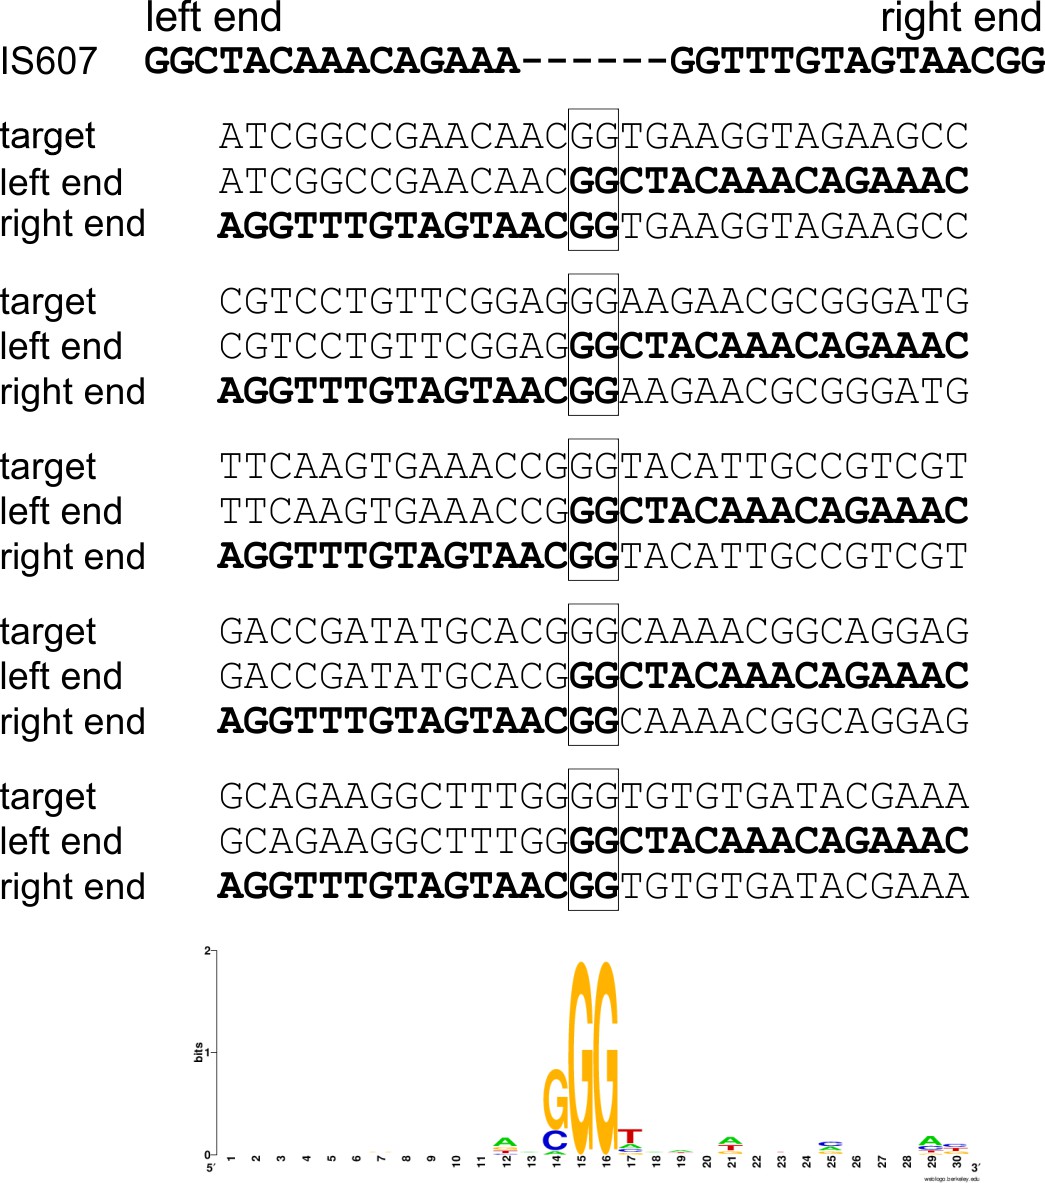
Sequence analysis of IS607 insertion sites.
Additional insertion site sequences of λ::IS607orfA transposition events are listed. Below is a sequence logo (https://weblogo.berkeley.edu) derived from 21 target sites from this work (orfA only, eight sites) and from Kersulyte et al. (orfA+B, F plasmid pOX38 target, 13 sites; Kersulyte et al., 2000). No preferential target sequence is evident outside of (G/C)GG.
Figure 2 with 2 supplements
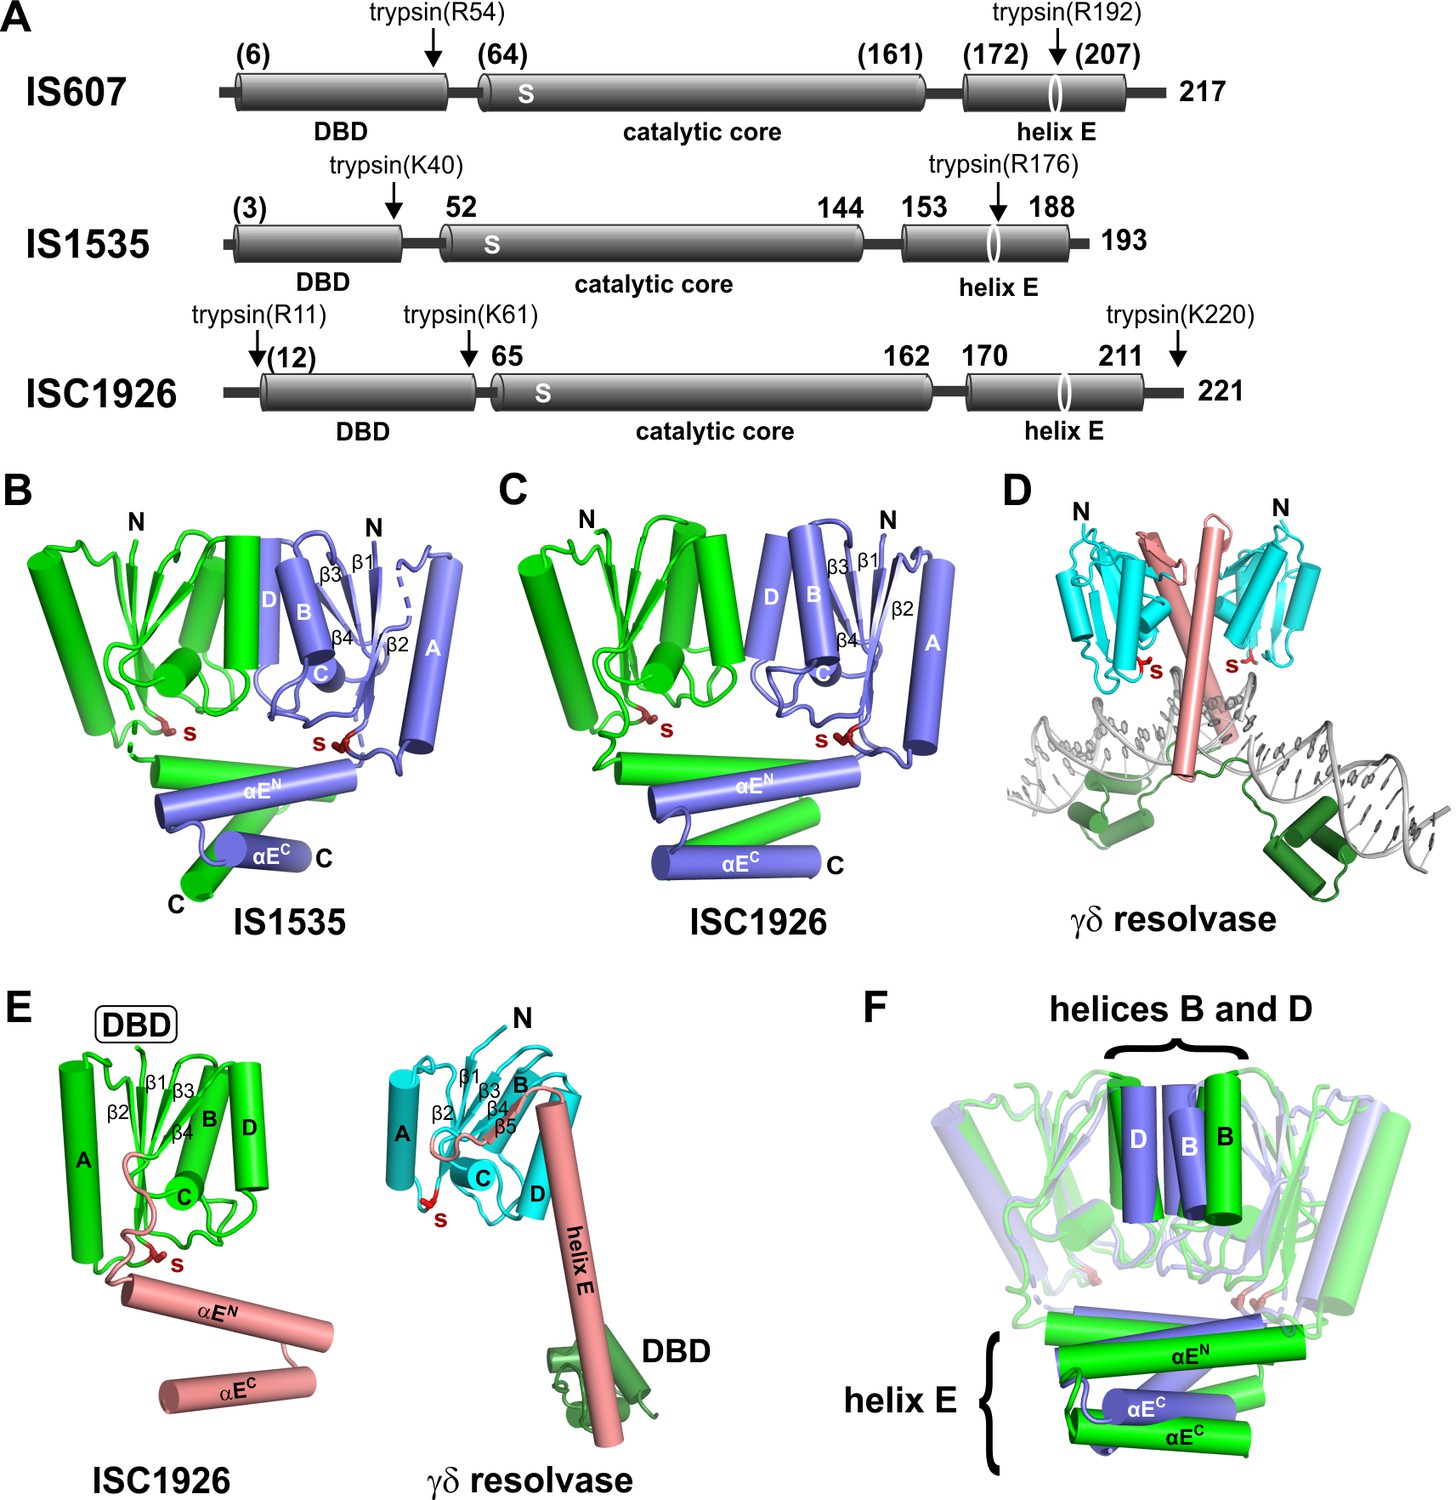
Structures of TnpA proteins.
(A) Domain architecture of TnpA proteins. Domain structures were derived from partial proteolysis/mass spectrometry (Figure 2—figure supplement 1), X-ray crystallography for TnpAIS1535 and TnpAISC1926, and Phyre2 models for the N-terminal DBDs (Figure 2—figure supplement 1) and the TnpAIS607 CTD. S denotes the predicted active site serine residue. (B and C) X-ray structures of the dimeric CTDs of TnpAIS1535 and TnpAISC1926, respectively. The helix E region folds into a 4-helix bundle that stacks on the catalytic core and occludes the catalytic serines. (D) Structure of the smSR γδ resolvase bound to DNA (PDB code: 1GDT). Unlike the TnpA proteins, the dimer interface is over the extended E-helices (salmon), and the DBD (dark green) is at the C-terminus. (E) Subunit structures of TnpA-CTDISC1926 and γδ resolvase highlighting the common folds of the catalytic cores but different helix E structures. (F) TnpAIS1535 (blue) and TnpAISC1926 (green) dimers are aligned over the catalytic domains of subunits A (rmsd = 1.1 Å). Helices B and D at the core dimer interface and the helix E bundles are highlighted to illustrate differences.
Figure 2—figure supplement 1
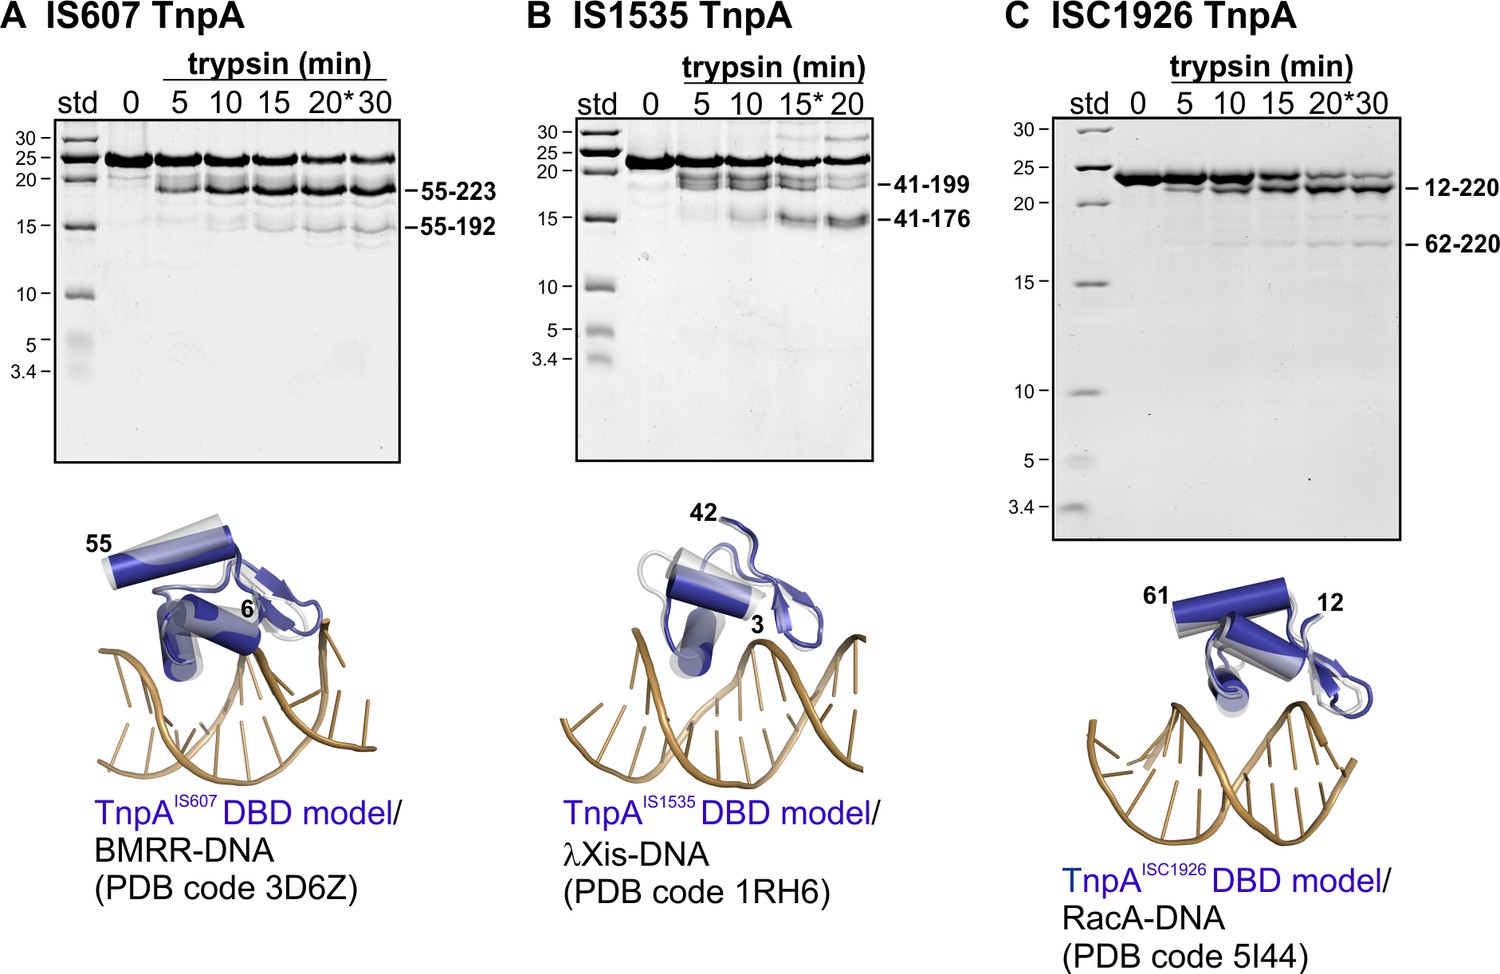
Limited proteolysis and structures of TnpA proteins.
(A) TnpAIS607(His6) digested with trypsin and subjected to 18% SDS-PAGE. MALDI-TOF analysis of an aliquot from the 20 min digestion (*) gave a major peak consistent with the mass of a peptide from residue 55 (cleavage at Arg54) to the C-terminus and a second peak consistent with a peptide from Ser55 – Arg192 (located within the predicted turn between the N- and C-terminal segments of helix E). Below the SDS gel is a Phyre2 model of the N-terminal winged-helix domain structure (residues 6 – 55, blue) superimposed over a BMRR-DNA X-ray structure (grey protein, brown DNA; rmsd = 1.44 Å over protein backbone atoms). (B) TnpAIS1535(His6) digested with trypsin. MALDI-TOF analysis of an aliquot from the 15 min digestion (*) gave a major peak consistent with a peptide from residue 41 (cleavage at Lys40) to the C-terminus and a second major peak consistent with a peptide from Thr41 to Arg176 (located close to the turn between the N- and C-terminal segments of helix E). The Phyre2 model of the N-terminal winged-helix domain structure (residues 3 – 42, blue) is superimposed over a phage λ Xis-DNA X-ray structure (grey protein, brown DNA; rmsd = 0.74 Å). (C) TnpAISC1926(His6) digested with 2x the amount of trypsin used above and Ca2+ in the buffer. MALDI-TOF analysis of an aliquot from the 20 min digestion gave a dominant peak consistent with a peptide from residue 12 (cleavage at Arg11) to Lys220 and a second peak consistent with peptides from residues 62/63 (cleavage at Lys61 and Arg62) to Lys220. Cleavage of the linker between the DBD and catalytic domains was much weaker for TnpAISC1926 as compared to TnpAIS607 and TnpAIS1535, which may reflect the short intervening peptide chain. MALDI-TOF/TOF analysis of a different preparation of TnpAISC1926 (purified from an N-terminal SUMO fusion) and different trypsin gave products corresponding to peptides from 1-Lys61 and 1-Arg62 (weak) and Arg62 to the C-terminus. The Phyre2 model of the N-terminal winged-helix domain structure (residues 12 – 61, blue) is superimposed over a RacA-DNA X-ray structure (grey protein, brown DNA; rmsd = 1.41 Å).
Figure 2—figure supplement 2
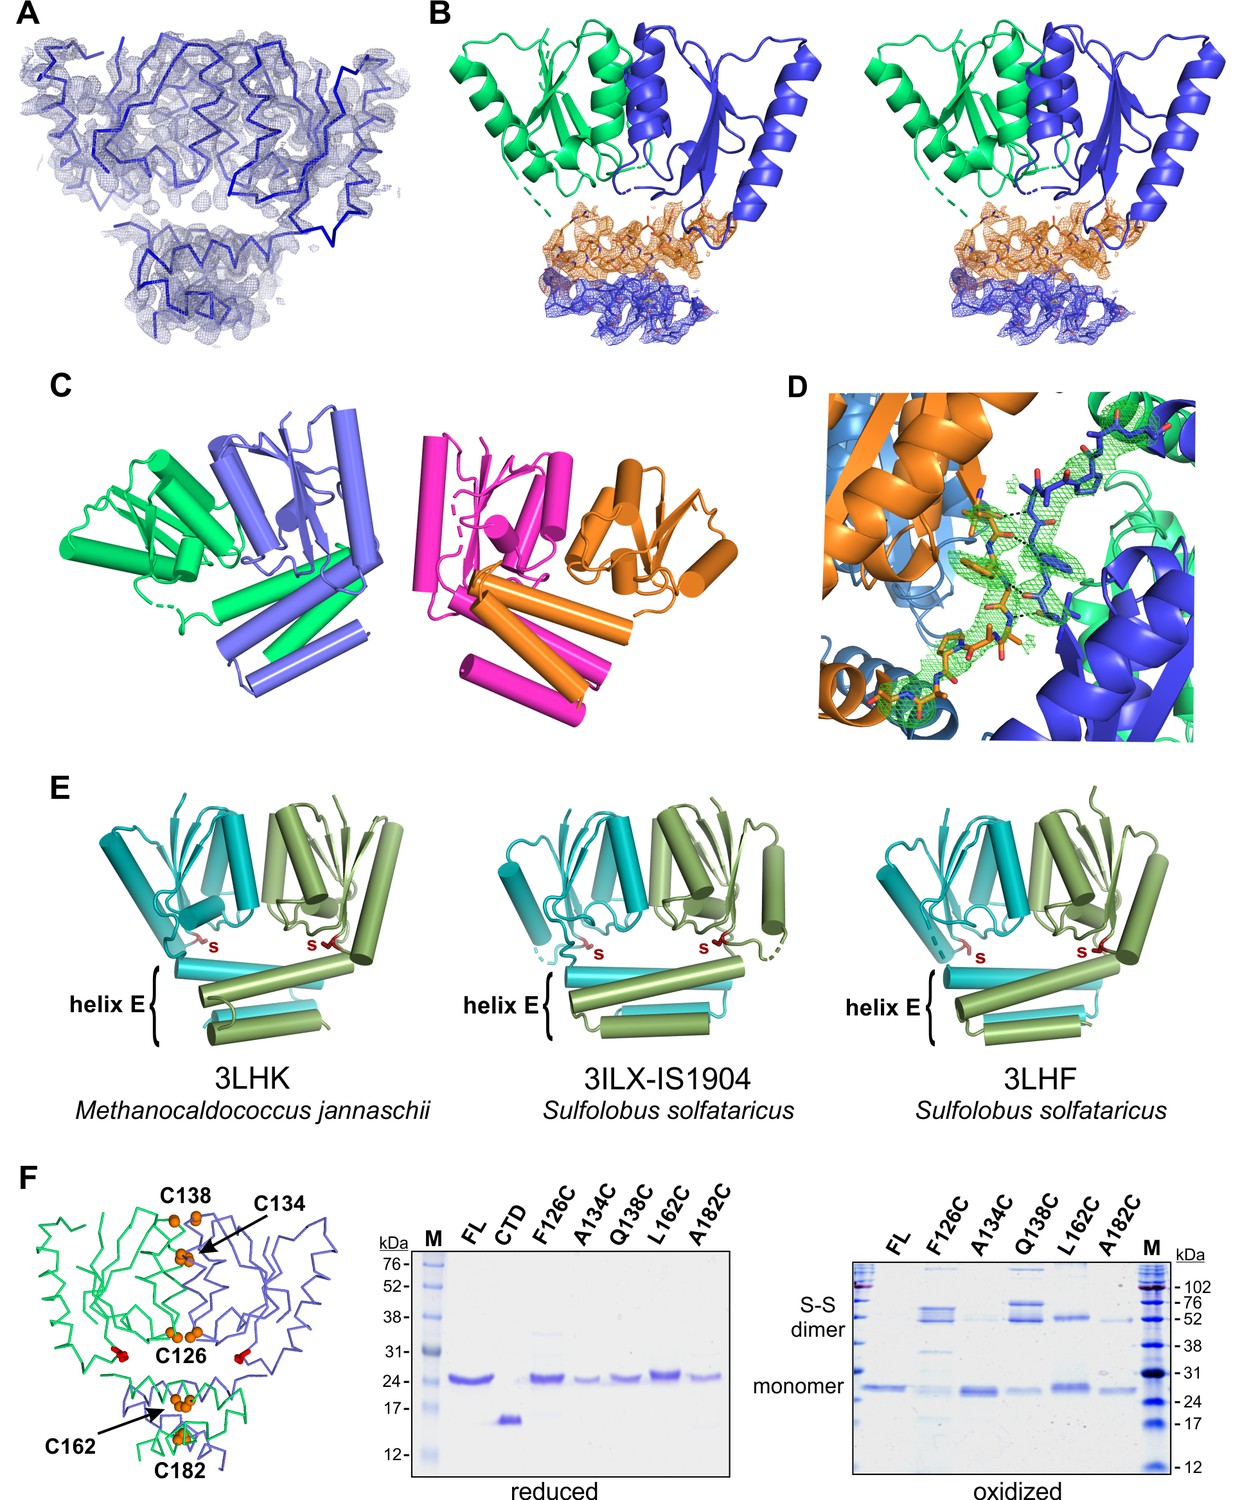
TnpA structures.
(A) The backbone of the TnpAIS1535 dimer structure is shown with its experimental electron density map contoured at 1.0 σ. The phases were determined by anomalous dispersion of six selenomethionine residues within the labeled dimer. (B) Stereo pair showing atomic details of helix E residues from TnpAIS1535. The 2Fo-Fc refined electron density map at 1.0 σ is shown for the N-terminal (orange) and C-terminal (blue) sections of helix E from subunit A. (C) TnpAISC1926 crystallized with two dimers in the asymmetric unit: chain A (blue), B (green), C (magenta), and D (orange). (D) Fo-Fc difference OMIT map (3.0 σ) describing the only well resolved core-helix E linker (TnpAISC1926 chain A; blue). The linker is stabilized by interactions (black dashes) with a symmetry-related dimer (orange). (E) Related X-ray structures from the PDB. IS1904 is an IS607-family transposon. The catalytic core dimer interfaces (helices B and D) and orientations of the helix E bundle relative to the catalytic domain of each of these proteins are more similar to TnpAISC1926 (rmsds 0.85 – 1.24 Å, peptide backbone atoms) than to TnpAIS1535 (rmsds 2.12 – 2.66). (F) Cysteine crosslinking of TnpAIS1535. On the left is a backbone trace of TnpAIS1535 with positions highlighted where cysteines were substituted. On the right are reducing and non-reducing SDS gels of the WT and mutant proteins before and after oxidation with diamide, respectively. The TnpAIS1535 CTD is also included in the reducing gel. A134C and A182C only weakly formed disulfide-linked dimers, presumably because the cysteines are well buried and therefore excluded from the oxidant and because of suboptimal geometry. Endogenous cysteines were not replaced in this experiment, which may account for some of the different higher MW species upon oxidation (compare with Figure 7B where oxidation products of single-cysteine mutants are shown).
Figure 3 with 1 supplement
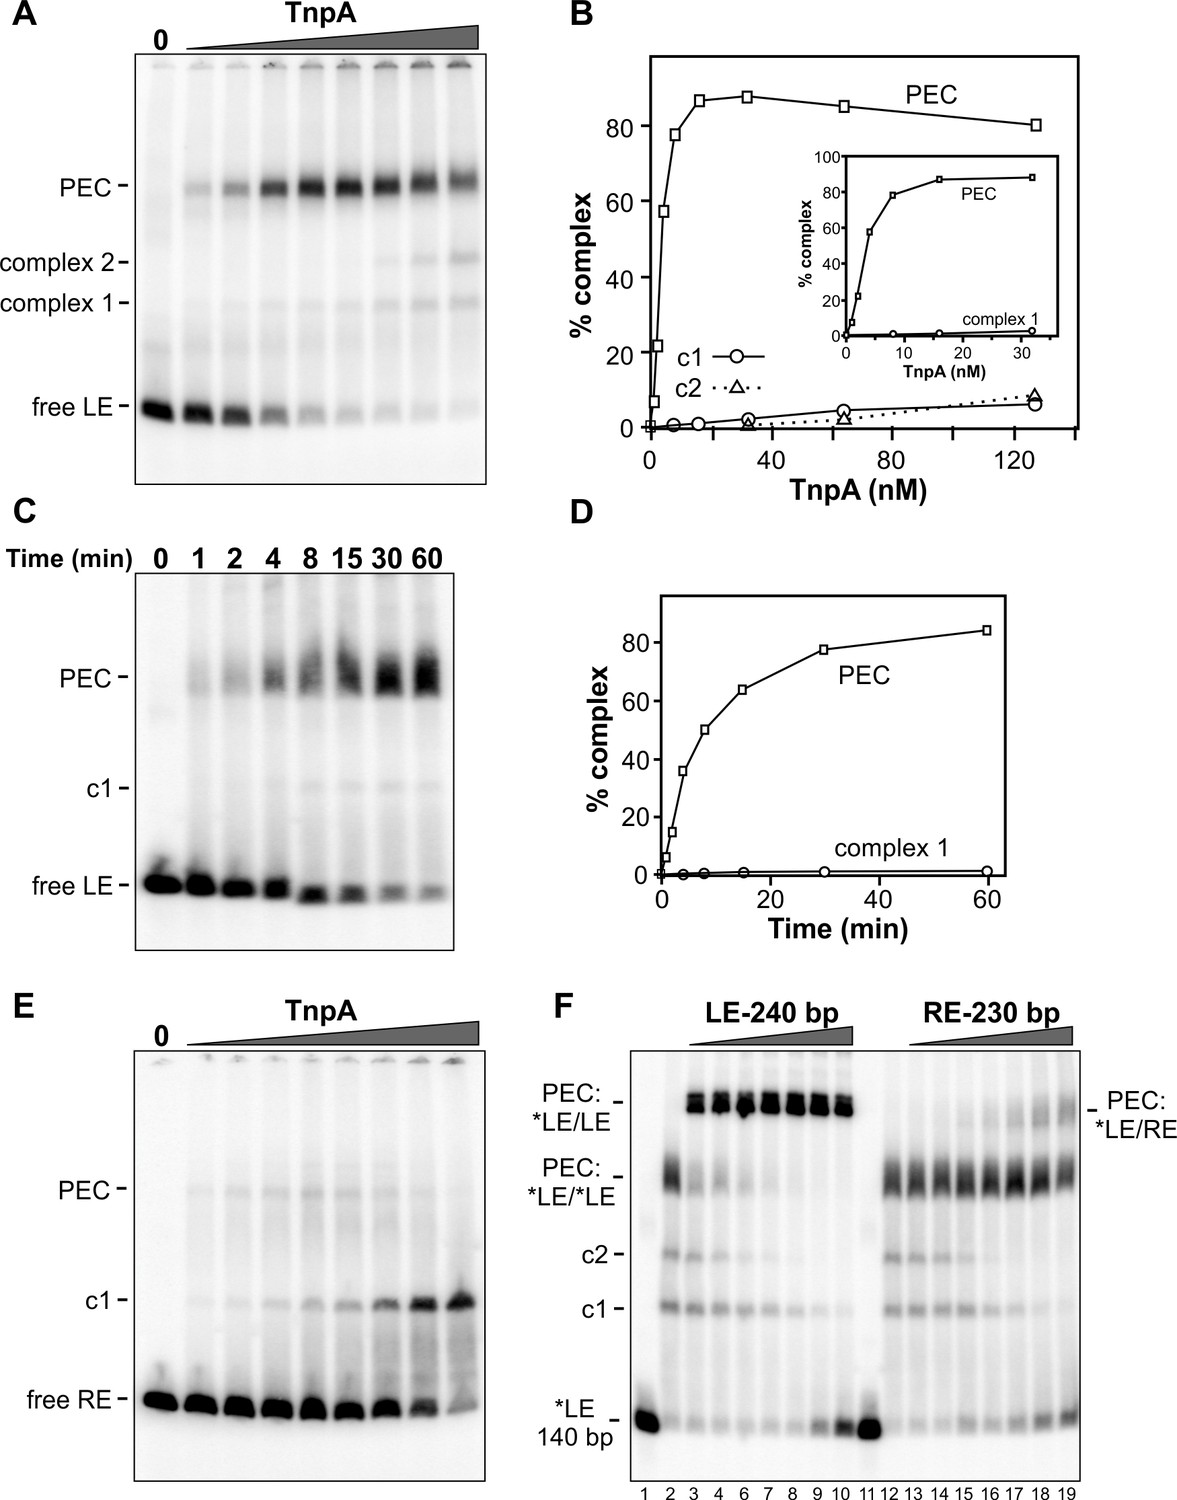
Binding of IS1535 TnpA to transposon ends.
(A) Increasing amounts of TnpA (1 to 128 nM in 2-fold increments) were incubated with a 149 bp 32P-labeled DNA fragment containing the left transposon end and adjacent host sequence. After 1 hr at 37°C, the samples were subjected to native PAGE. The locations of unbound probe (free LE), paired-end complex (PEC), complex 1 (c1) and complex 2 (c2) are denoted. (B) Plot showing relative amounts of the PEC, complex 1, and complex 2 as a function of TnpA concentration. The insert expands the lower TnpA concentration range leading to maximum levels of PECs. (C) Time course of LE-PEC formation. TnpA (8 nM) was incubated with the LE probe at 37°C for increasing times as denoted and applied to a native gel. (D) Plot of the accumulation of LE-PECs and complex 1 as a function of time. (E) TnpA complexes formed on the right end. Reactions were performed as in panel A except that a 139 bp RE DNA probe was used. (F) Formation of hetero-PECs with different lengths LE or RE DNA fragments. In lanes 2 and 12, 100 nM TnpA was incubated with 0.5 nM 149 bp radiolabeled LE probe (*LE). In lanes 3 – 10, increasing amounts of unlabeled 240 bp LE fragments (2 to 128 nM, in 2-fold increments) were included in the reaction. Radiolabeled PECs, but not complex 1 or 2, shift to a slower migrating species in the presence of excess 240 bp LE fragments indicating that these complexes contain both 149 and 240 bp LE DNA molecules. In lanes 13 – 19, increasing amounts of unlabeled 230 bp RE fragments (2 to 128 nM, in 2-fold increments) were included in the reaction with *LE. A small amount of LE + RE PECs form at high RE concentrations. Lanes 1 and 11 are *LE only.
Figure 3—figure supplement 1
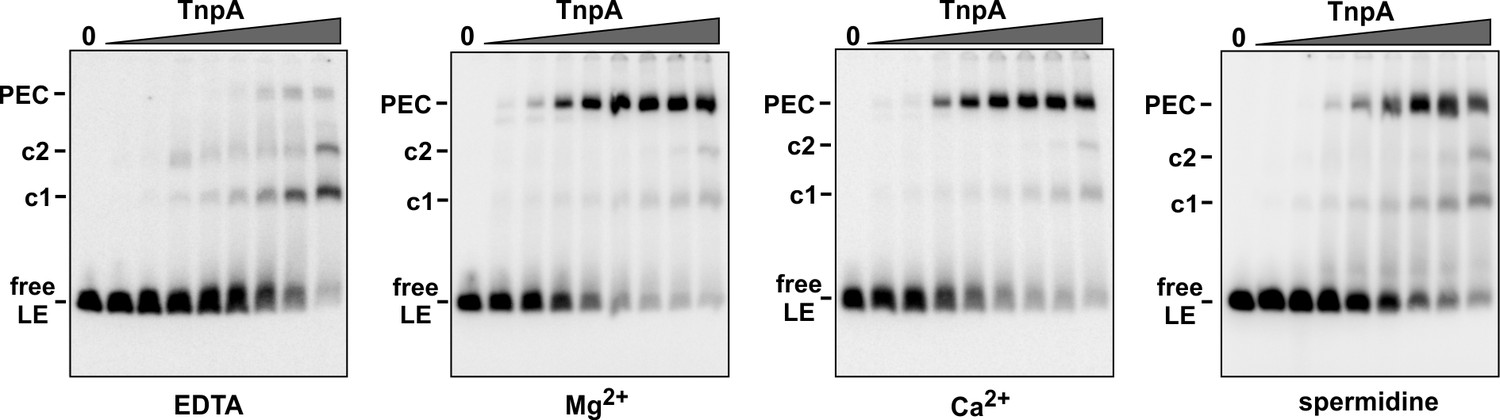
IS1535 PEC formation requires divalent metal ions or spermidine.
Gel mobility shift assays were performed as in Figure 3A except 5 mM EDTA, 5 mM Mg acetate (same as Figure 3A), 2.5 mM CaCl2, or 1 mM spermidine was present in the binding reaction, and the gel buffer was Tris-acetate plus 1 mM EDTA, Mg acetate, CaCl2, or Mg acetate, respectively. MnCl2 can also effectively support PEC formation (not shown).
Figure 4 with 1 supplement
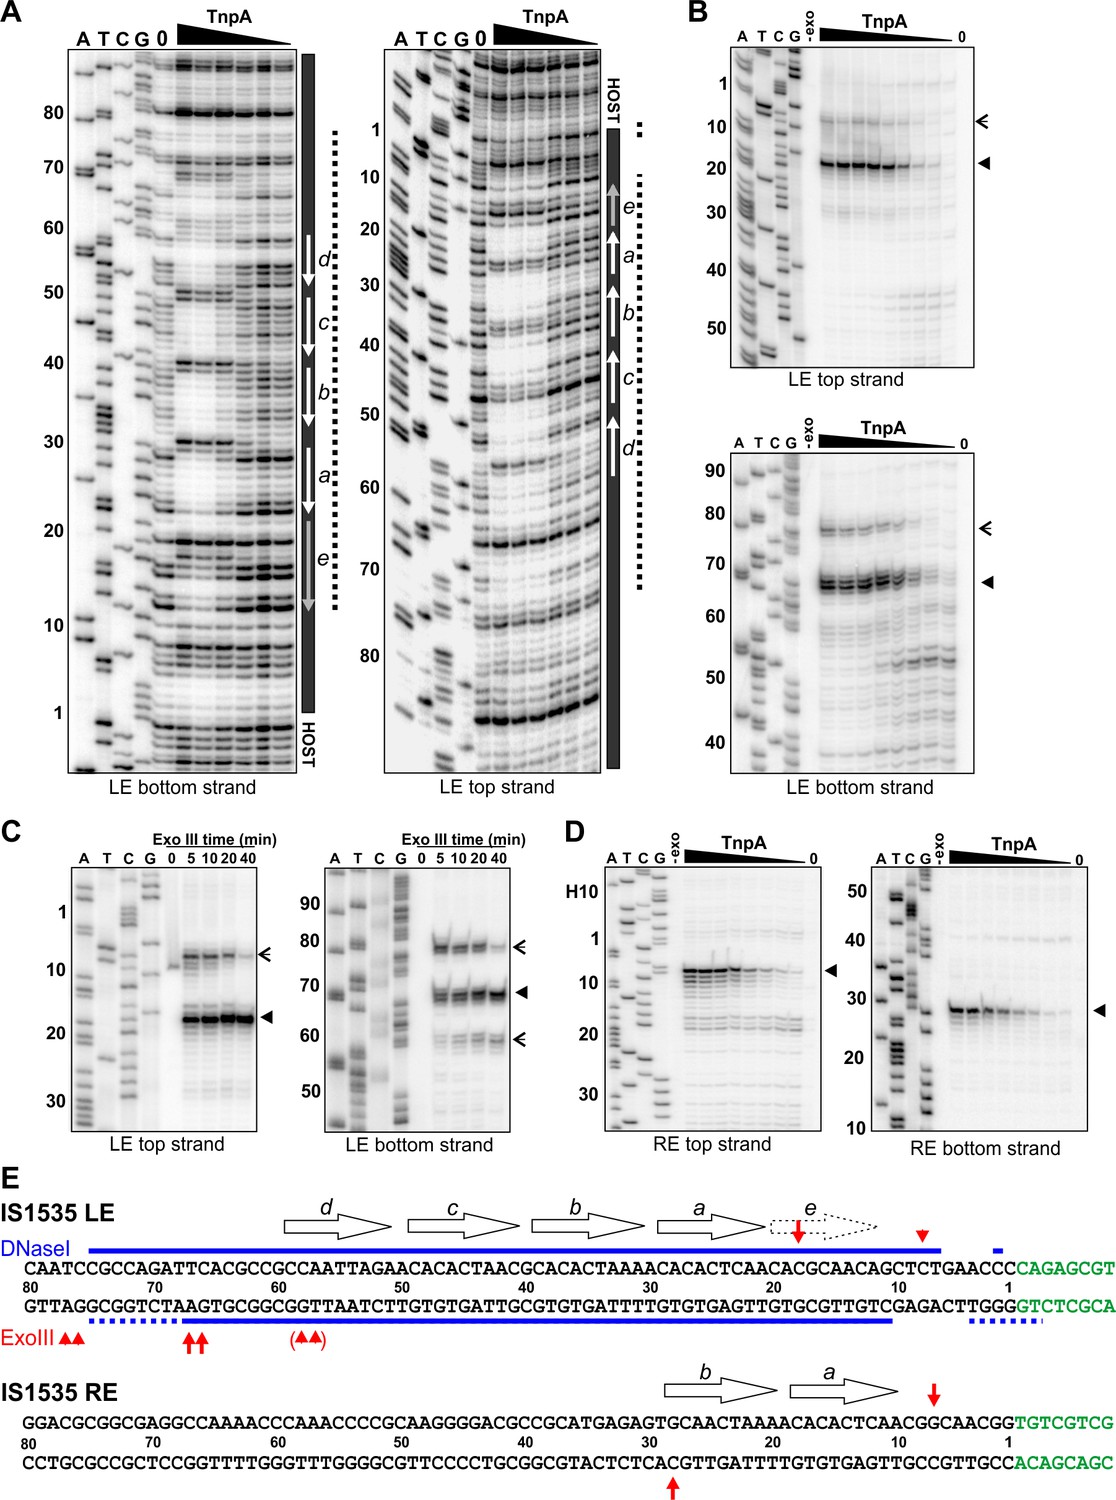
Footprint analysis of IS1535 TnpA binding to the transposon ends.
(A) DNase I footprints of TnpA to 5′ end-labeled bottom (left panel) and top (right panel) strands of the LE. TnpA concentrations were from 4 to 128 nM, in 2-fold increasing concentrations, 0 is no TnpA added, and ATCG are dideoxy sequencing lanes primed by the same oligonucleotide used to prepare the footprinting probe. Numbers on the left denote transposon sequence coordinates and are positioned relative to the 0 lane. The black bar on the right marks transposon sequences with arrows showing motif locations. The dashed line denotes regions of significant changes in DNase I cleavage by TnpA. See Figure 4—figure supplement 1 for EMSAs of binding reactions just prior to DNase I digestion showing relative amounts of PECs. (B) Boundaries of TnpA binding to the LE delineated by Exo III digestion. PEC-assembly reactions, containing from 1 to 128 nM TnpA in 2-fold increasing concentrations, were incubated with Exo III for 30 min. Lane 0 is no TnpA and -exo is no Exo III added. Solid arrowheads indicate major Exo III digestion stops, and open arrowheads denote minor Exo III stops that are TnpA dependent. (C) Time course of Exo III digestion on LE PECs. Preassembled PECs were subjected to Exo III digestion for 0 – 40 min as labeled. (D) Exo III digestion stops on the RE. Reactions were the same as in panel B except that 5′ end-labeled DNA probes representing the RE DNA strands were used. (E) Summary of DNase I and Exo III footprinting data on the LE and RE sequences. Changes in DNase I reactivity by TnpA are denoted with blue lines; dashed lines indicates weak protection. Red arrows denote Exo III digestion stops; shorter arrows signify minor stops and arrows in parentheses are stops appearing after long digestion times. IS1535 end sequence motifs (open arrows) are positioned above the sequence.
Figure 4—figure supplement 1

EMSA of TnpAIS1535 binding in DNase I footprint reactions.
1 µl aliquots of footprint binding reactions just prior to DNase I digestion were added to 20 µl EMSA buffer and applied to a native gel to assess the relative amounts of PECs in the footprint reactions. TnpAIS1535 concentrations were from 1 to 128 nM.
Figure 5 with 1 supplement
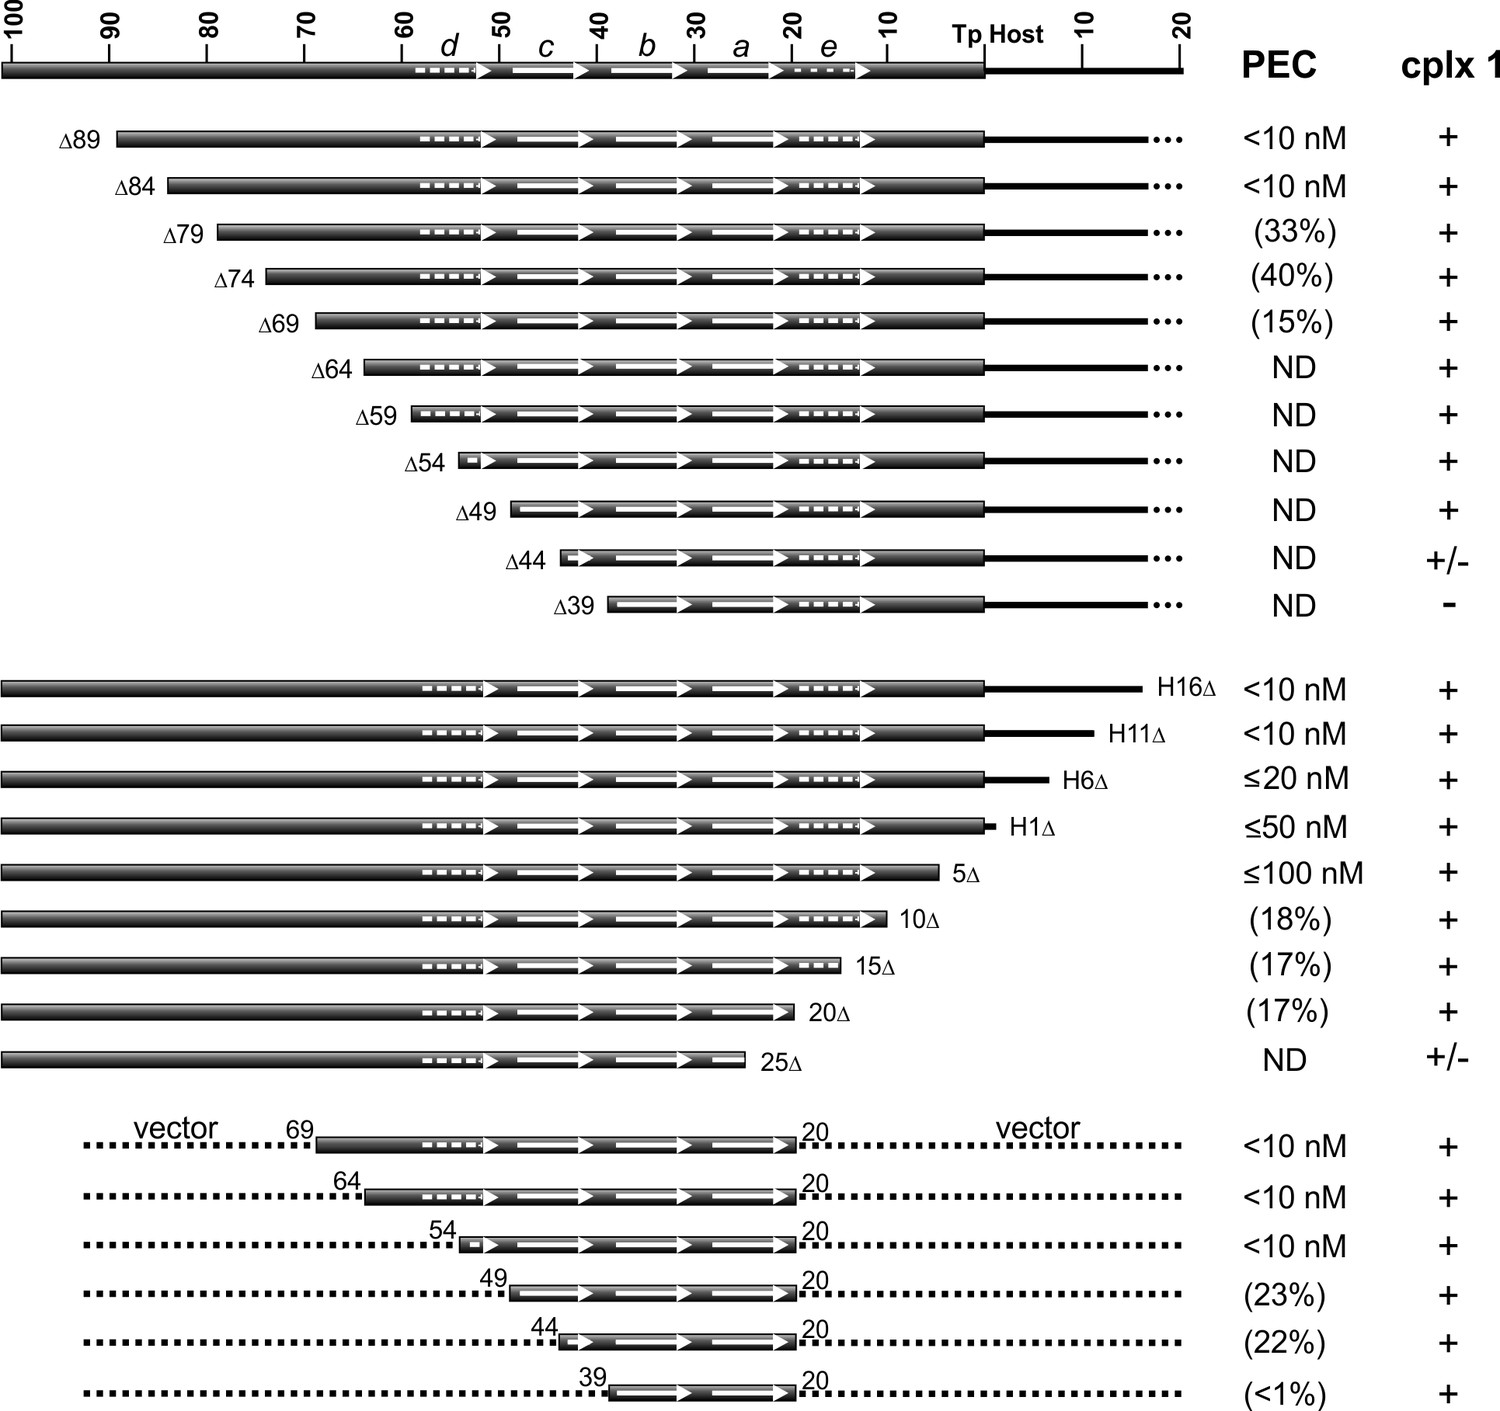
DNA sequence requirements for IS1535 LE-PEC assembly.
Top series are LE truncations beginning internal to the transposon. Middle series are truncations beginning within host DNA (H) flanking the transposon. Bottom series are LE sequences from transposon nt 20 to various internal endpoints embedded in vector DNA. PEC assembly was averaged from at least three different experiments for each probe. The concentrations of TnpAIS1535 required for 50% conversion of the probe to PECs are listed; if <50% of the probe was converted to PECs, the maximum yield of PECs obtained over the TnpA titration series (up to 128 nM TnpA) is given in parentheses. ND indicates PECs are not detected in the EMSAs. The presence of complex 1 is denoted by +, absence by -, and barely detectable levels by +/-. See Figure 5—figure supplement 1 for supporting data.
Figure 5—figure supplement 1
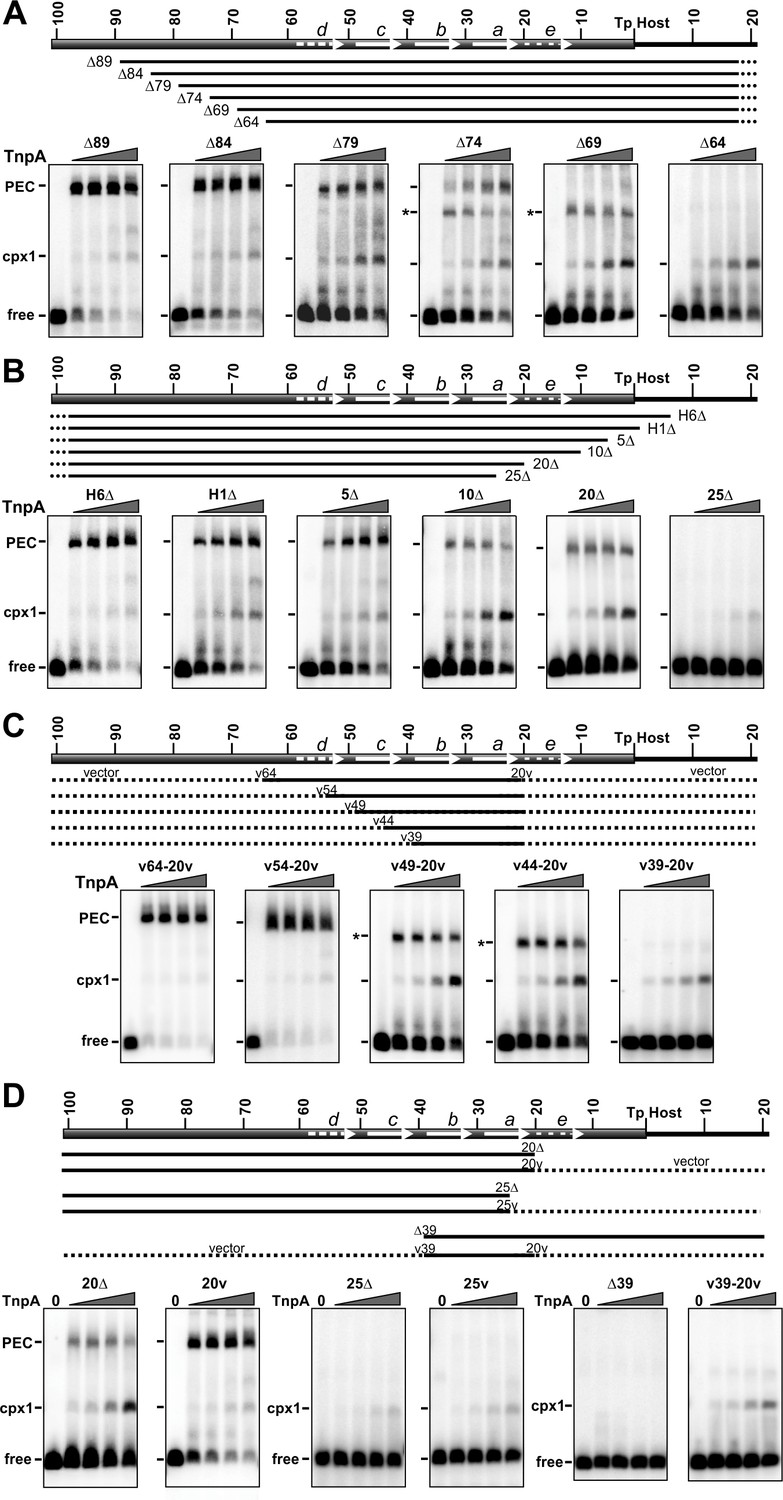
Gel mobility shift assays on IS1535 LE resections.
(A) Deletion series of LE sequences from the transposon side. All probes contain 102 bp of DNA on the host end. Representations of the truncated LE probes are given below the schematic of the LE. H indicates host sequence, and dashes indicate appended vector sequence. EMSAs were performed with 1 to 128 nM TnpAIS1535 in 2-fold increasing concentrations. The position of the free probe, complex 1, and PECs are marked; the asterisks denote faster migrating PECs, which were confirmed for LEΔ69 to contain two DNA duplexes by the method used in Figure 3F. (B) Deletion series from the host side. All probes contain 149 bp on the transposon side with DNA endpoints on the right side as labeled. (C) Truncated LE segments embedded in vector DNA. Each probe has LE sequences beginning at nt 20 and varying amounts of upstream transposon sequence, as designated, with vector sequence (dotted lines) appended to each end. LE(v44-20v) PECs were confirmed to contain two DNA duplexes. (D) PEC formation by deleted LE probes without or with appended non-specific (vector) DNA. Shown are deletions ending in LE-20 and LE-25 at the border of motif a, and LE-39 on the border of motif b, without and with vector DNA appended to the deletion end points.
Figure 6

Footprint analysis of IS1535 deletion substrate LE(v54-20v) containing the minimal transposon sequences required for efficient PEC assembly.
(A) DNase I footprints of PEC assembly reactions on 5′-32P-labeled bottom and top strands of LE(v54-20v). TnpA concentrations were from 4 to 128 nM in 2-fold increasing amounts. Shaded rectangles on the left of the gels denote the positions of transposon sequences; coordinates labeled with v are vector sequences with vH being the equivalent locations of host DNA. The bars on the right of the gels denote regions of significant changes in DNase I reactivity by TnpA with dashes indicating weakly protected regions. (B) Exonuclease III delineated boundaries of TnpA binding. TnpA concentrations are the same as in panel A. (C) Summary of DNase I (strongly protected regions, blue) and Exo III digestion boundaries on the LE(v54-20v) sequence. Small letters denote vector sequence.
Figure 7 with 1 supplement

Activities of crosslinked TnpAIS1535 dimers.
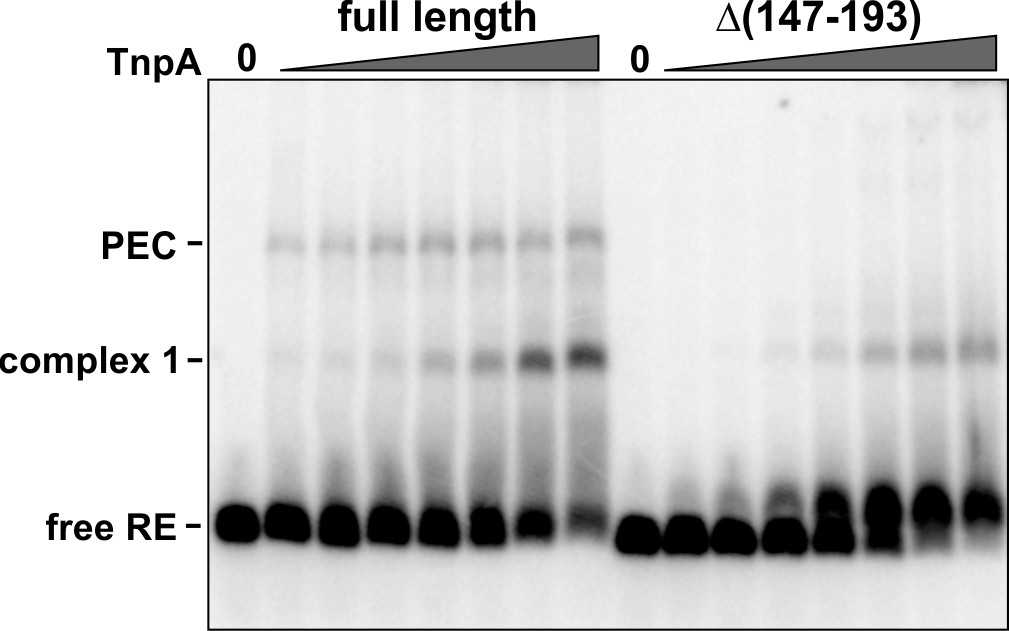
(A) TnpAIS1535 dimer structure highlighting residues 126, 138, and 162, which are modeled as cysteines in rotomers compatible for disulfide formation. The helix E region on the right is rotated clockwise in the Y plane about 90° to better visualize Cys162. (B) Non-reducing SDS-PAGE of reduced and oxidized preparations of TnpAIS1535 mutants containing single cysteine residues. The three native cysteines were replaced with serines in these mutants. (C–E) EMSAs of PEC assembly by reduced and oxidized preparations of Cys126, Cys138, and Cys162 mutants, respectively. The LE probe was incubated with 1 to 64 nM TnpA mutant in 2-fold increasing concentrations. (F) PEC assembly by wild-type TnpA and a deletion mutant missing the helix E region (residues 147 – 193). TnpA concentrations are the same as in panels C-E except that a reaction with 128 nM TnpAΔ(147-193) was included. The location of residue 146 at the C-terminus of this mutant is shown in panel A.
Figure 7—figure supplement 1
Formation of IS1535 RE complex 1 with TnpAΔ(helix E).
Binding of 1 to 64 nM full-length TnpA and Δ(147-193) to the IS1535 RE. TnpAΔ(147-193) forms complex 1, but not PECs, with the RE.
Figure 8 with 4 supplements
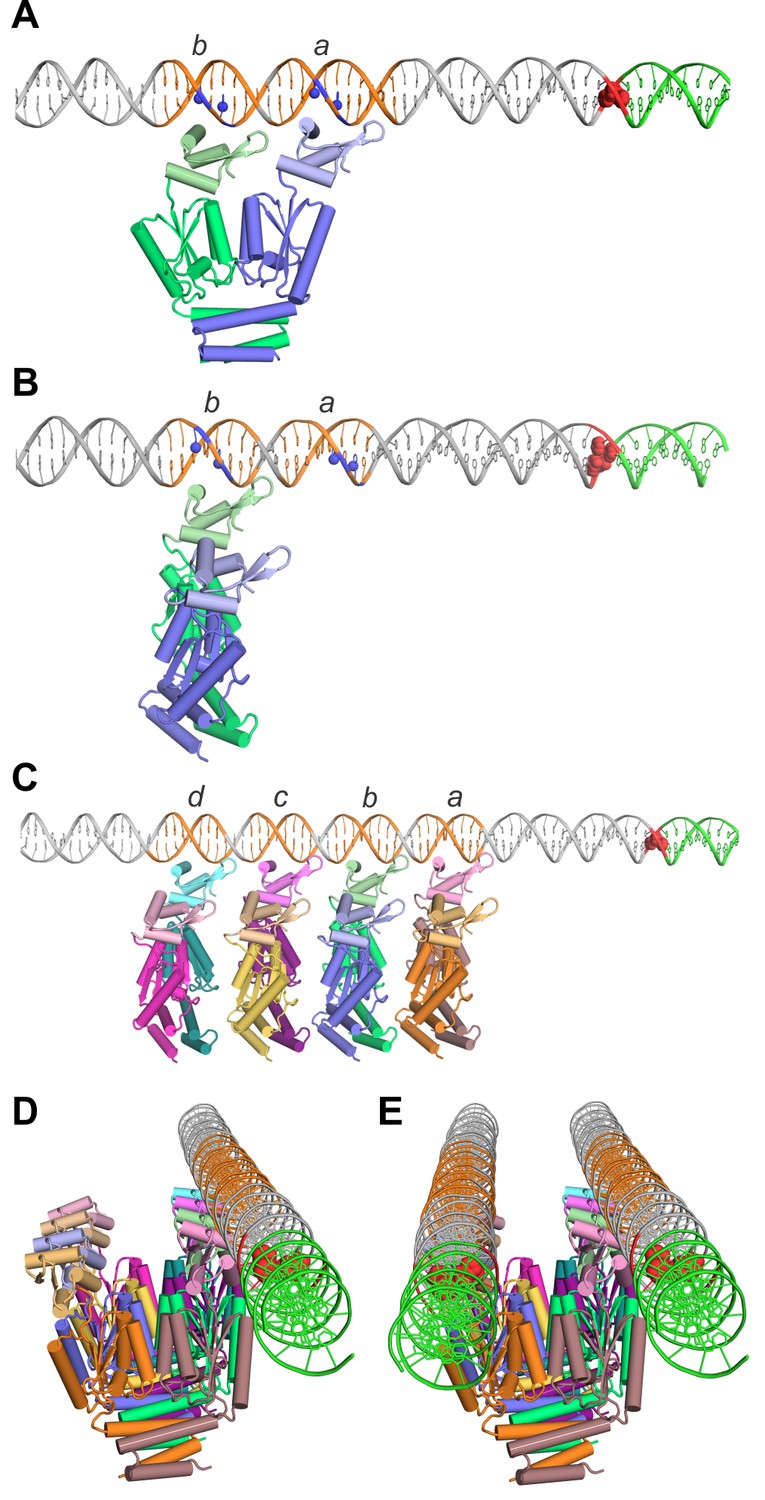
Models of TnpA binding to the IS1535 LE and the PEC.
(A) Model of a TnpA dimer in a configuration where the two DBDs are binding to LE motifs a and b (orange DNA) in a manner consistent with DMS protection data (Figure 8—figure supplement 1) and where the wing is over the A/T-rich minor groove. Guanine N7 atoms protected from DMS reactivity by bound TnpA are highlighted as blue spheres. The tandem G/C base pairs at the LE terminus are red and the host DNA is green. The TnpA dimer model is derived from the Phyre2 model of the TnpAISC1926 NTD (Figure 2—figure supplement 1C) linked by three residues to the TnpAISC1926 CTD X-ray structure. We posit this conformation on DNA represents complex 1 (see Figure 8—figure supplement 4). (B) TnpA dimer configuration where only one DBD is associated with a single end. The dimer is rotated orthogonally about the DBD-CTD linker in relation to the dimer in panel A. (C) Four TnpA dimers are bound as in panel B to motifs a-d on one LE. The helix E regions are proposed to engage in helix-swapped interactions between adjacent dimers (e.g., Figure 8—figure supplement 2) to promote cooperative binding. This structure, with additional dimers bound laterally along the LE, may reflect complex 2. (D) Model in panel (C) rotated to show the DNA in an end-on view, highlighting the set of unbound DBDs. (E) Model of the PEC with a second LE associated. Although represented as parallel straight DNAs, the two transposon ends may be in a more interwrapped structure. TnpA protomers in a different, chemically-active, conformation are proposed to be recruited to the end of the filament at the transposon-host junction.
Figure 8—figure supplement 1

Dimethyl sulfate (DMS) protection assay on the IS1535 LE to identify major groove (guanine N7) contacts.
An LE probe end labeled on the G-rich bottom strand was incubated with 0, 32, 64, and 128 nM TnpAIS1535 for 1 hr under PEC assembly conditions and then reacted with DMS. The first four lanes are dideoxy sequencing reactions and the next four lanes are DMS reactions without and with TnpA. Guanines within motifs a-c that are protected from DMS modification, and therefore cleavage by piperidine, are highlighted with asterisks and circled. Carets (^) indicate guanines exhibiting moderately increased reactivity with DMS. LE-1 is the first base of the left end. Dideoxy-terminated or piperidine-cleaved DNA fragments migrate slightly differently.
Figure 8—figure supplement 2

Illustration of a potential helix-swap mechanism by which the helix E region could remodel to promote cooperative binding onto the LE.
The C-terminal segments (arrows) of the E helices are swapped with neighboring dimers. The DNA in this model has an average helical twist of 34.2° corresponding to 10.52 bp/turn.
Figure 8—figure supplement 3
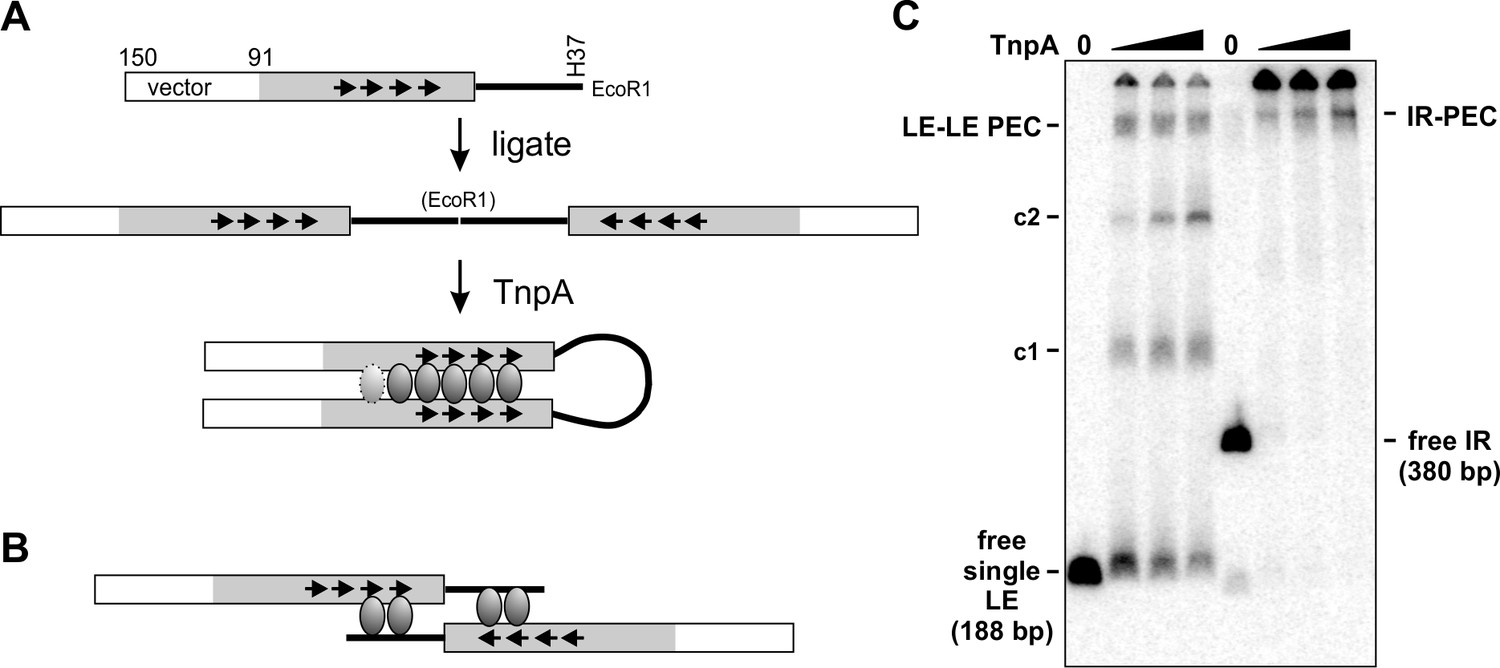
Parallel arrangement of DNA strands within the PEC.
(A) An IS1535 substrate was generated by PCR that contains 59 bp of pUC18 fused to 91 bp of LE DNA plus 37 bp of flanking host DNA that terminates at an EcoR1 site. Digestion with EcoR1 and ligation generates a 380 bp product (IR) containing two LEs in an inverted orientation, which was gel purified and then 5′ end-labeled with 32P using polynucleotide kinase and γ-32P-ATP. Incubation of the IR with TnpAIS1535 is predicted to generate a PEC if the LEs align in a parallel manner, as illustrated. An interwrapped parallel configuration of the LEs that allows for a similar looped extension of the intervening host DNA, rather than an elongated structure as schematically pictured, is also compatible with PEC formation. The length of the intervening loop used in the IR substrate in panel C is 80 bp from the LE termini or 116 bp from the primary Exo I digestion stop site next to motif a (Figure 4B E). (B) Schematic representation of a PEC formed on the starting DNA fragment in panel A with LEs synapsed in an antiparallel configuration. This configuration is incompatible with formation of a PEC with the ends of the host DNA covalently joined after ligation. Moreover, footprinting data provide no evidence for TnpA binding to the host DNA as drawn (note that motif d ends at bp 59, whereas only 37 bp of host DNA are present). (C) PEC formation on the IR substrate. The first four lanes were incubation of 0, 8, 16, and 32 nM TnpAIS1535 with the unligated substrate (panel A top) and next four lanes were with the IR substrate. The IR-PEC, which migrates similarly to the LE-LE PEC, provides evidence for a parallel configuration of the LEs (panel A). These reactions were performed with 2% of the standard amount of substrate DNA to favor intramolecular synapsis. Bimolecular products formed on the IR substrate may be present in the wells.
Figure 8—figure supplement 4

Complex I is a dimer bound to the IS1535 LE.
(A) If TnpA binds as a dimer to form complex I, then either TnpA (MW 21.9 kDa) or TnpA-MBP (MW 65.5 kDa) dimeric forms would bind to motifs a and b as represented in Figure 8A to generate complex one with different electrophoretic migrations. (B) If TnpA binds to motifs a and b as a tetramer (two dimers) to form complex I, then a band of intermediate mobility consisting of the two different dimers should form, which is not observed in panel C. (C) EMSA assay on LEΔ54, which only gives complex I. In lanes 2 – 5, LEΔ54 was incubated with 8, 16, 32, and 64 nM TnpA, respectively. In lanes 14 – 17, LEΔ54 was incubated with 16, 32, 64 and 128 nM TnpA-MBP, respectively. In lanes 6 – 13, LEΔ54 was incubated with 32 nM of TnpA. plus 8 to 256 nM TnpA-MBP in 2-fold increasing amounts. No subunit mixing between dimers is evident during the time frame of the experiment.
Tables
Table 1
X-ray diffraction data and refinement statistics.
https://doi.org/10.7554/eLife.39611.007| Structure PDB code | ISC1926-TnpA 6DGC | IS1535-TnpA – Native 6DGB | IS1535-TnpA – SeMet |
|---|---|---|---|
| Data collection | |||
| Beamline | APS 24 ID-C | APS 24 ID-C | APS 24 ID-C |
| Space group | C1 | P212121 | P212121 |
| Unit cell dimensions | |||
| a, b, c (Å) | 97.1, 212.3, 61.6 | 52.6, 54.2, 104.38 | 52.3, 54.1, 104.5 |
| α, β, γ (o) | 90.0, 126.7, 90.0 | 90.0, 90.0, 90.0 | 90.0, 90.0, 90.0 |
| Wavelength (Å) | 0.9793 | 0.9792 | 0.9792 |
| Resolution range (Å)* | 20 - 2.9 (3.0-2.9) | 48.1 - 2.5 (2.6-2.5) | 52.3 - 2.5 (2.6-2.5) |
| Measured reflections | 71134 | 44467 | 68063 |
| Unique reflections | 19649 | 10275 | 19606 |
| Rmerge† | 5.0 (51.1) | 9.9 (64.8) | 7.9 (75.9) |
| CC1/2 | 0.99 (0.76) | 0.99 (0.85) | 0.99 (0.82) |
| I/σ | 12.8 (1.3) | 6.5 (1.5) | 10.0 (1.3) |
| Completeness (%) | 88.6 (56.8) | 95.2 (91.4) | 98.8 (95.0) |
| Refinement | |||
| Resolution (Å) | 2.9 | 2.5 | |
| No. of reflections | 15775 | 7951 | |
| Rwork | 22.0 | 22.8 | |
| Rfree‡ | 24.6 | 26.1 | |
| RMSD bond length (Å) | 0.01 | 0.01 | |
| RMSD bond angle (o) | 1.15 | 1.17 | |
| No. of atoms | |||
| Protein | 3996 | 2002 | |
| Water | 0 | 24 | |
| Average B factors | |||
| Protein | 76.4 | 50.2 | |
| Solvent | 28.9 | ||
| Ramachandran statistics§ | |||
| Favored | 97.1 | 95.2 | |
| Allowed | 2.9 | 4.6 | |
| Outliers | 0 | 0.2 | |
-
*Values in parentheses refer to the highest resolution shell.
†Rmerge = Σ | I-<I> | / Σ I
-
‡Calculated using 5% (IS1535) and 10% (ISC1929) of the data.
§Percentage of residues in Ramachandran plot regions were determined using PROCHECK
Key resources table
| Reagent type (species) or resource | Designation | Source or reference | Identifiers | Additional information |
|---|---|---|---|---|
| Gene (Mycobacterium tuberculosis) | IS1535 orfA/tnpA | H37Rv genome DNA | Gene ID: RV0921 | |
| Gene (Helicobacter pylori) | IS607 orfA/tnpA | synthetic gene | NCBI protein ID: AAF05600.1 | |
| Gene (Helicobacter pylori) | IS607 orfB | synthetic gene | NCBI protein ID: WP_001274345.1 | |
| Gene (Sulfolobus islandicus) | ISC1926 orfA/tnpA | S. islandicus genome DNA, PMID: 15612937 | NCBI protein ID: AAV87873.1 | S. islandicus pyrE::ISC1926 Dennis Grogan, University of Cincinnati |
| Strain, strain background (E. coli) | RJ1224 | Laboratory collection | recA56, srl, Δ(pro-lac), ara, rpsL, λbbnin [λ cI857,b515, b519, nin5, Sam7] | |
| Strain, strain background (E. coli) | Hfl-1 | PMID: 4352176 | hfl-1, fhuA2::IS2, lacY1, tsx-1, glnX44, gal-6, xyl-7, mtlA2, mut-14 | |
| Strain, strain background (E. coli) | LE392 | PMID: 6291786 | hsdR514 (rk–, mk+), glnX (supE44), tyrT (supF58), Δ(codB-lacI)3, galK2, galT22, metB1, trpR55 | |
| Strain, strain background (E. coli) | BW14879 | PMID: 2160940 | pMW11 Muc62 Δ(lac)X74, Δ(phoA532 Pvull) phn(EcoB), arcA1655, fnr-1655 | B. Wanner, Purdue University |
| Strain, strain background (E. coli) | BW5104 | PMID: 2160940 | Mu-1 Δlac169, creB510, hsdR514 | B. Wanner, Purdue University |
| Strain, strain background (E. coli) | RJ3960 | This work | BW5104 λR mal | |
| Strain, strain background (E. coli) | RJ3388 | Laboratory collection | BL21 (DE3) endA::tet8, fis::str/spc-985 | |
| Strain, strain background (E. coli) | RJ3431 | Laboratory collection | BL21 (DE3) metC::Tn10 | |
| Recombinant DNA reagent | See supplementary file 2 | |||
| Sequence-based reagent | See supplementary file 3 | |||
| Peptide, recombinant protein | DNase I | Thermo Fisher, Waltham, MA | Catalog number: EN0521 | |
| Peptide, recombinant protein | Exonuclease III | NEB, Ipswich, MA | Catalog number: M0206L | |
| Peptide, recombinant protein | Proteinase K | Roche, Germany | Catalog number: 03115828001 | |
| Peptide, recombinant protein | Trypsin | Promega, Madison, WI | Catalog number: V511A | |
| Commercial assay or kit | Sequenase Quick-Denature Plasmid Sequencing Kit | Affymetrix, Santa Clara, CA | Catalog number: 70140 | |
| Commercial assay or kit | Coomassie ProteinAssay Reagent | Thermo Fisher, Waltham, MA | Catalog number: 1856209 | |
| Chemical compound, drug | Dimethyl sulfate | Thermo Fisher, Waltham, MA | Catalog number: AC430831000 | |
| Chemical compound, drug | Piperidine | Sigma-Aldrich | Catalog number: 10409–4 | |
| Chemical compound, drug | Diamide | Sigma-Aldrich | Catalog number: 87751 | |
| Chemical compound, drug | AEBSF | Gold Biotechnology | Catalog number: A-540–1 | |
| Software, algorithm | ImageQuant | GE Healthcare | RRID:SCR_014246 | |
| Software, algorithm | PyMOL Molecular Graphics System | Schrodinger, LLC | RRID:SCR_000305 | https://pymol.org/2/ |
| Software, algorithm | Protein Prospector/MS-Digest | http://prospector.ucsf.edu/prospector/cgi-bin/msform.cgi?form=msdigest | RRID:SCR_014558 | |
| Software, algorithm | Phyre2 | PMID: 25950237 | RRID:SCR_010270 | www.sbg.bio.ic.ac.uk/phyre2/ |
| Software, algorithm | XDS | PMID: 20124692 | RRID:SCR_015652 | http://xds.mpimf-heidelberg.mpg.de/ |
| Software, algorithm | PHASER | PMID: 19461840 | RRID:SCR_014219 | |
| Software, algorithm | SHELX | doi.org/10.1107/S0021889804018047 | RRID:SCR_014220 | |
| Software, algorithm | Coot | PMID: 15572765 | RRID:SCR_014222 | https://www2.mrc-lmb.cam.ac.uk/personal/pemsley/coot/ |
| Software, algorithm | Phenix | PMID: 20124702 | RRID:SCR_014224 | https://www.phenix-online.org/ |
| Software, algorithm | Buster | PMID: 22505257 | RRID:SCR_015653 | https://www.globalphasing.com/buster/ |
| Software, algorithm | CCP4 | PMID: 21460441 | RRID:SCR_007255 | http://www.ccp4.ac.uk/ |
| Software, algorithm | Procheck | doi.org/10.1107/S0021889892009944 | RRID:SCR_006511 | https://www.ebi.ac.uk/thornton-srv/software/PROCHECK/ |
| Software, algorithm | Clustal Omega | https://www.ebi.ac.uk/Tools/msa/clustalo/ | RRID:SCR_001591 |
Additional files
-
Supplementary file 1
E.coli strains used in this work.
- https://doi.org/10.7554/eLife.39611.022
-
Supplementary file 2
Plasmids used and constructed in this work.
- https://doi.org/10.7554/eLife.39611.023
-
Supplementary file 3
Oligonucleotides used in this work.
- https://doi.org/10.7554/eLife.39611.024
-
Transparent reporting form
- https://doi.org/10.7554/eLife.39611.025
Download links
A two-part list of links to download the article, or parts of the article, in various formats.
Downloads (link to download the article as PDF)
Open citations (links to open the citations from this article in various online reference manager services)
Cite this article (links to download the citations from this article in formats compatible with various reference manager tools)
Multiple serine transposase dimers assemble the transposon-end synaptic complex during IS607-family transposition
eLife 7:e39611.
https://doi.org/10.7554/eLife.39611


