Role of the pre-initiation complex in Mediator recruitment and dynamics
- University at Albany, United States
- National Center for Biotechnology Information, National Library of Medicine, United States
- New York State Department of Health, United States
Figures
Figure 1 with 1 supplement
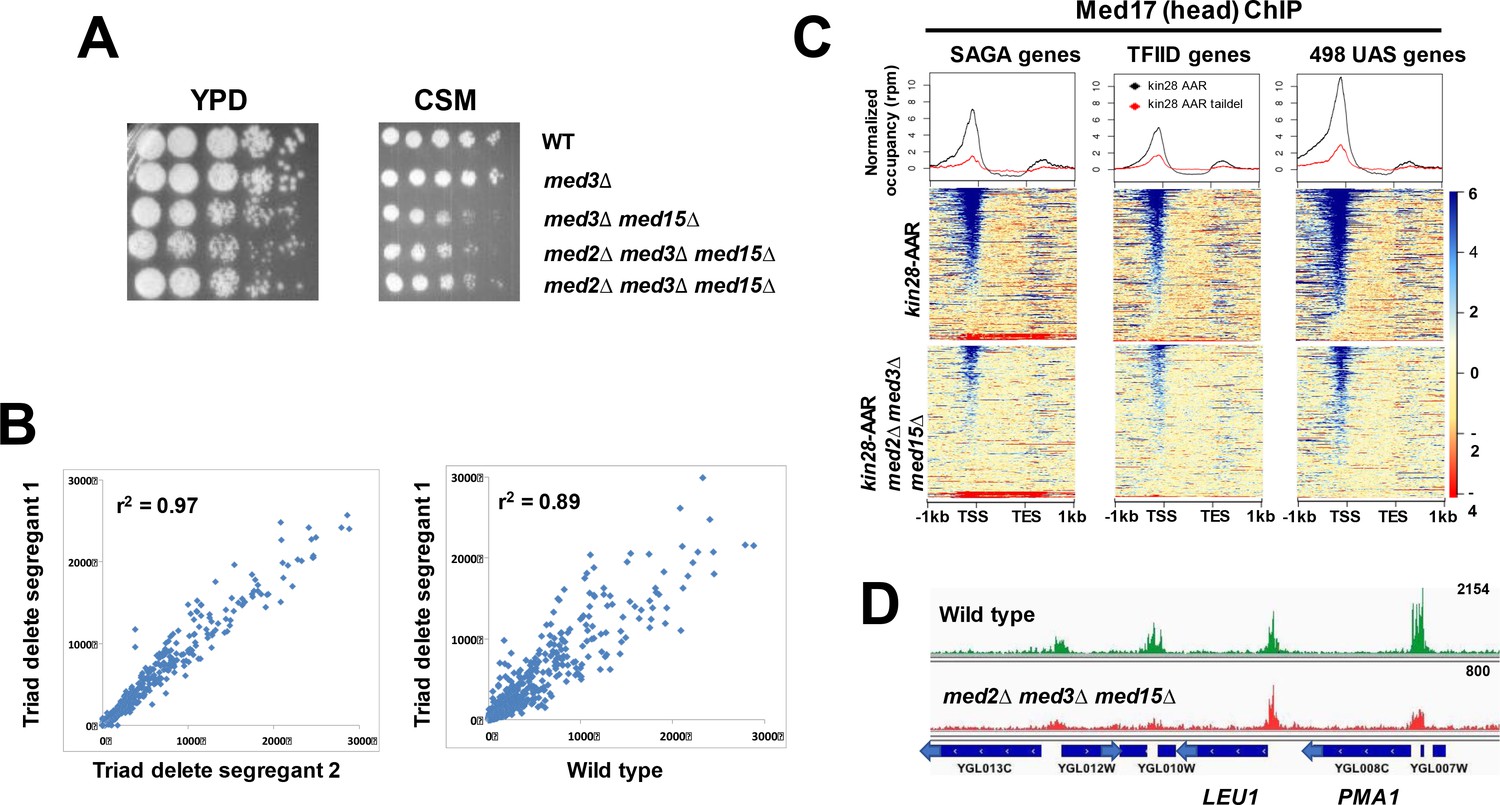
Mediator recruitment in med2∆ med3∆ med15∆ yeast.
(A) Spot dilutions (five-fold from left to right) of the indicated strains were made on YPD or CSM plates and allowed to grow at 30 ˚C for 3 days. The two med2∆ med3∆ med15∆ strains are independent segregants. (B) Comparison of transcript levels (reads per million) by RNA-seq for two independent med2∆ med3∆ med15∆ segregants (left panel), and between segregant one and the wild type parent strain (right panel). Only data for mRNA genes are plotted, after normalization to total mRNA. (C) Normalized Med17 occupancy in kin28-AA and med2∆ med3∆ med15∆ kin28-AA yeast after 1 hr treatment with rapamycin (designated ‘AAR’). Reads were mapped to all SAGA-dominated genes, all TFIID-dominated genes, and to the 498 genes exhibiting detectable Mediator ChIP signal at UAS regions in wild type yeast (Jeronimo et al., 2016). Genes were normalized for length and aligned by transcription start site (TSS) and transcription end site (TES), and are sorted according to average signal intensity. A compressed color scale was used for heat maps to better allow visualization of signal. (D) Browser scan showing normalized Med17 occupancy in wild type and med2∆ med3∆ med15∆ yeast over a short region of Chromosome VII; the upper end of the occupancy scale (reads) is indicated on the upper right for each graph. Note that the peak associated with LEU1 (TFIID-dominated) is essentially unchanged in med2∆ med3∆ med15∆ relative to wild type yeast, while the two peaks at the left (associated with TFIID-dominated transcripts) and that associated with PMA1 (SAGA-dominated) are all reduced in med2∆ med3∆ med15∆ yeast.
Figure 1—figure supplement 1
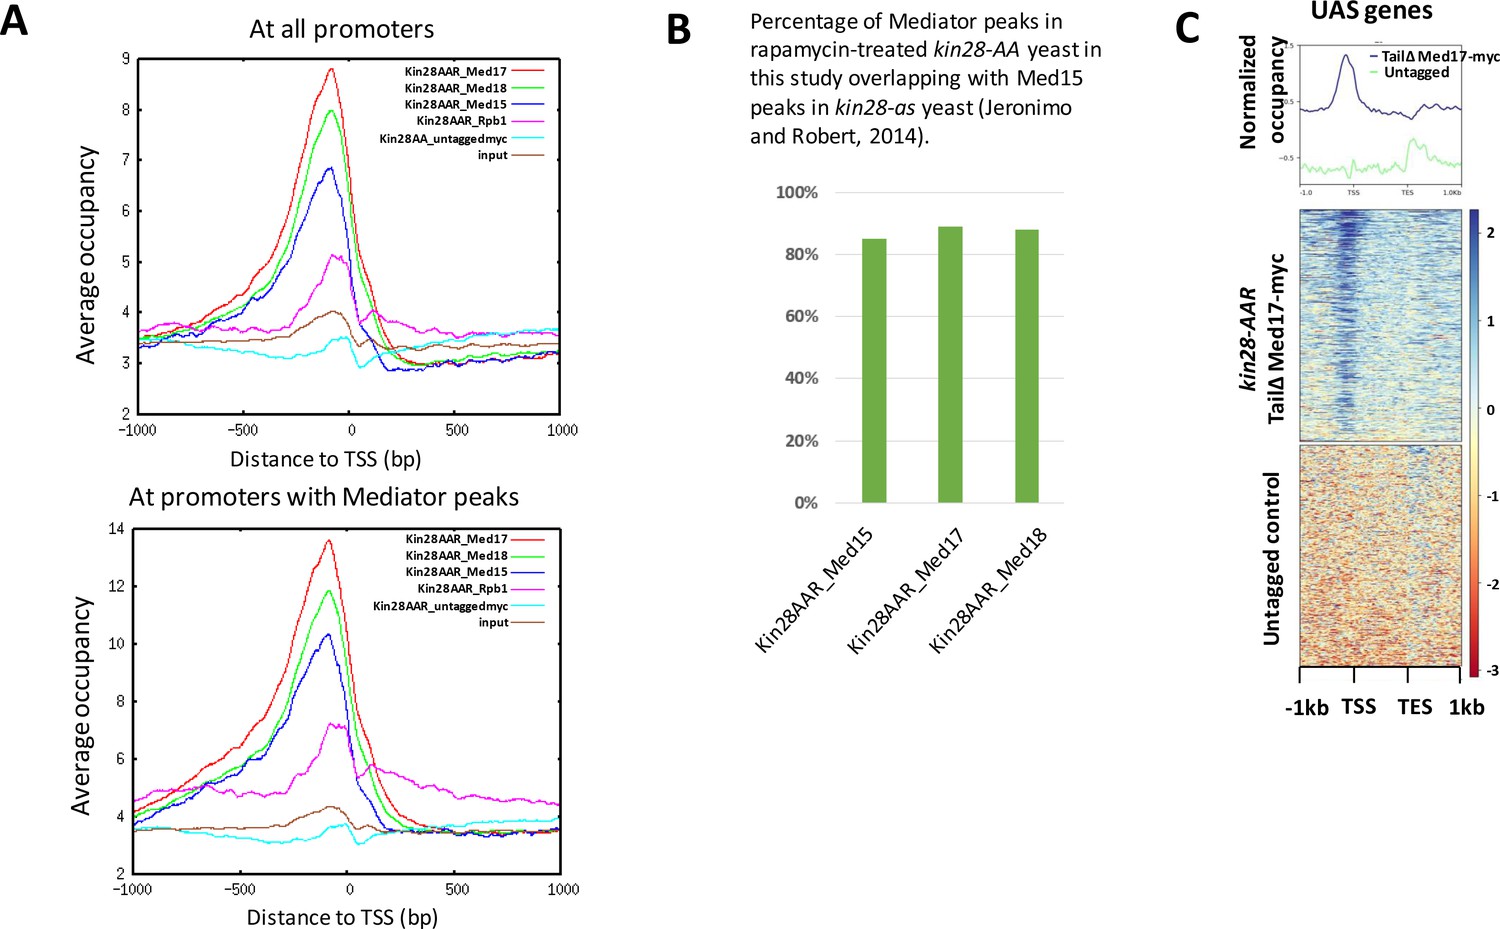
ChIP signal metagene and peak analysis in kin28-AA yeast after rapamycin treatment.
(A) Occupancy in kin28-AA yeast after rapamycin treatment for Med17 (Srb4; head), Med18 (Srb5; head), Med15 (Gal11; tail) and for Rpb1, and signal for an untagged control (KHW127, the kin28-AA strain) and input control, in reads per million (RPM) aligned at the TSS at all promoters (top) or promoters with Mediator peaks (bottom). (B) Overlap of Mediator peaks identified in this study after depletion of Kin28 using the anchor away technique with Med15 peaks identified by Jeronimo and Robert (Jeronimo and Robert, 2014) after inactivating Kin28 in kin28-as yeast. (C) ChIP-seq at UAS genes following IP against c-myc in kin28-AA med2∆ med3∆ med15∆ med17-myc yeast treated with rapamycin and an untagged control strain (KHW127).
Figure 2
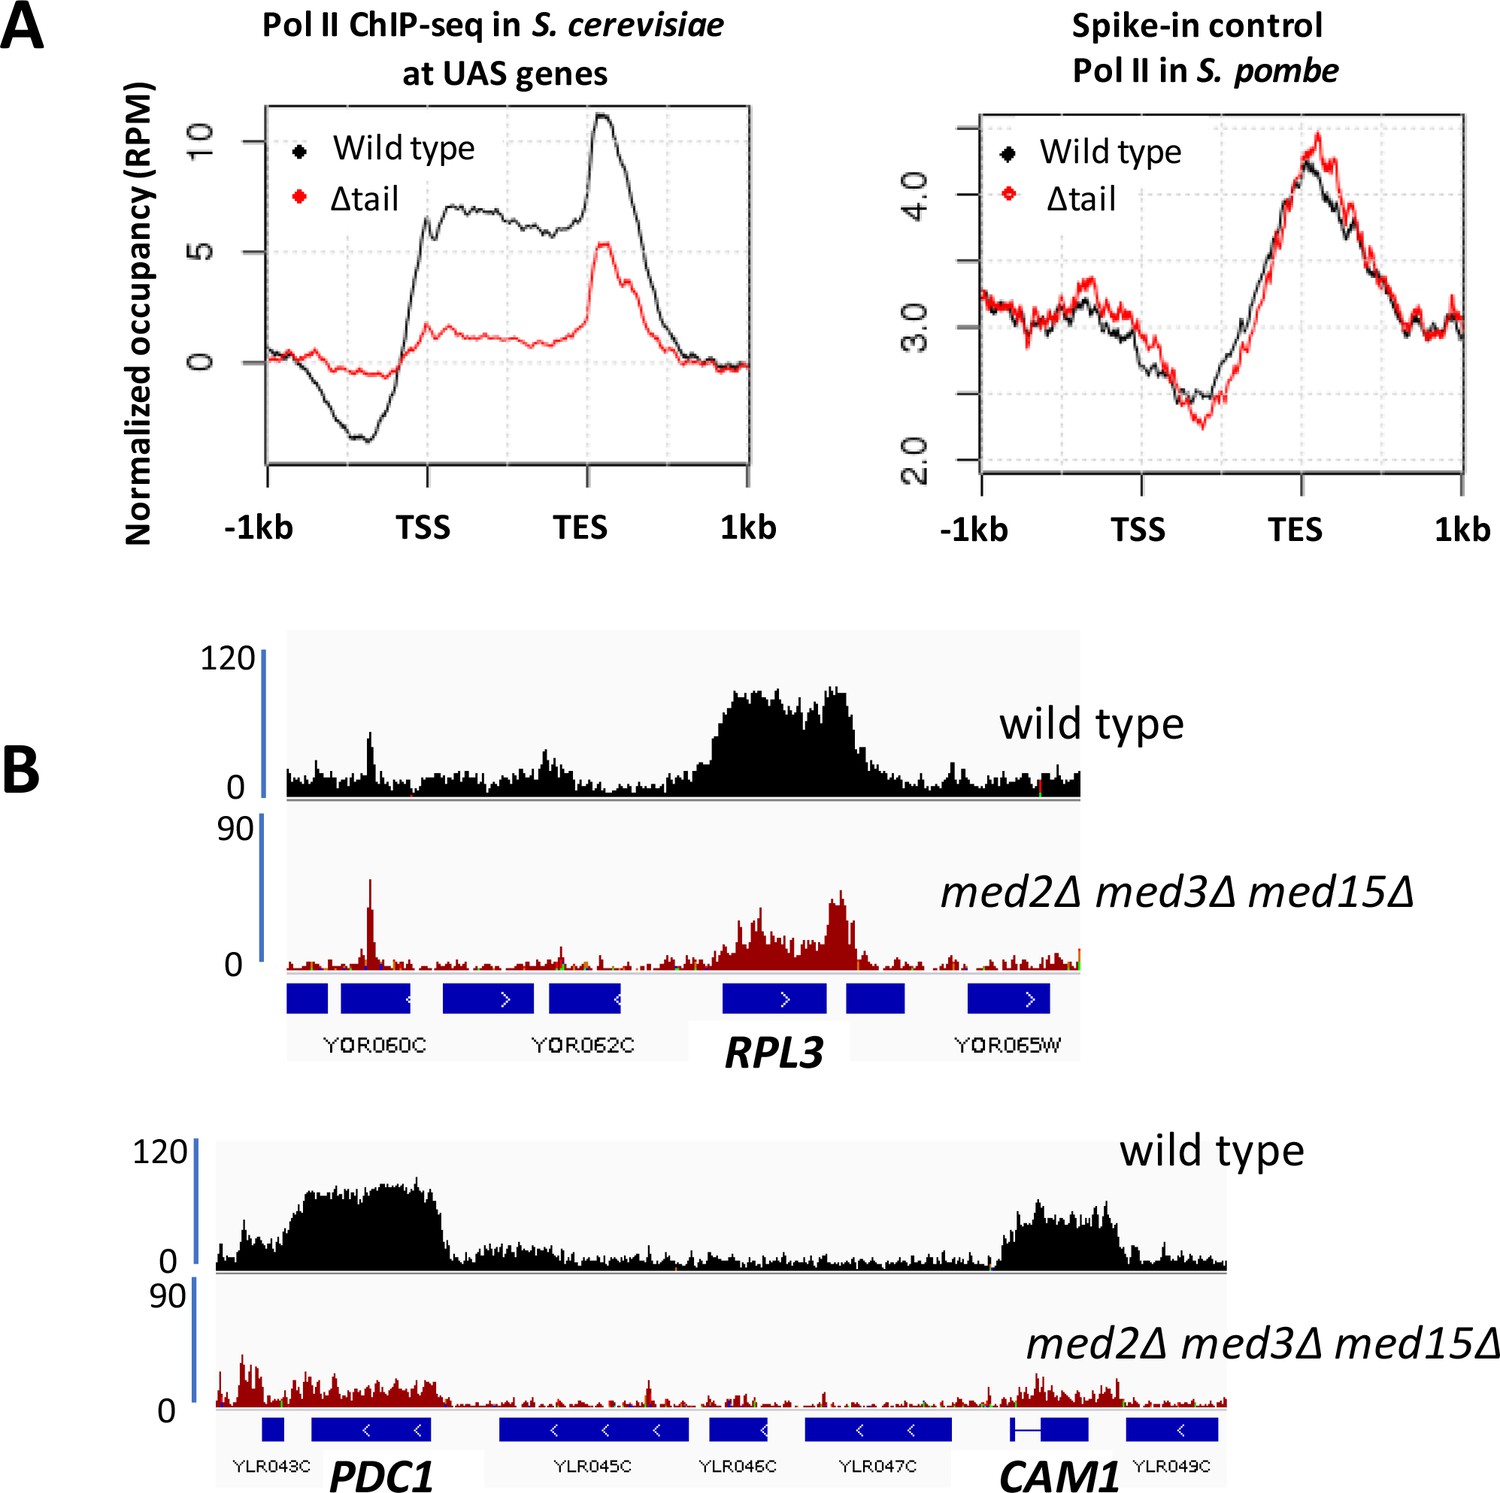
Decreased Pol II occupancy in med2∆ med3∆ med15∆ yeast.
(A) ChIP-seq of Rpb1 in wild type (BY4741) and med2∆ med3∆ med15∆ (∆tail) yeast. Left panel: normalized occupancy at S. cerevisiae UAS genes, defined as in Figure 1. Right panel: normalized occupancy over 1150 s. pombe genes having expression levels > 1 (Shetty et al., 2017). (For unknown reasons, ChIP-seq against Rpb1 in S. pombe exhibits low signal at 5’ regions and stronger signal at and beyond 3’ regions of transcribed genes; see for example (Shetty et al., 2017; Lee et al., 2017)). (B) Browser scans showing normalized Rpb1 occupancy in wild type (BY4741) and med2∆ med3∆ med15∆ yeast.
Figure 3 with 4 supplements
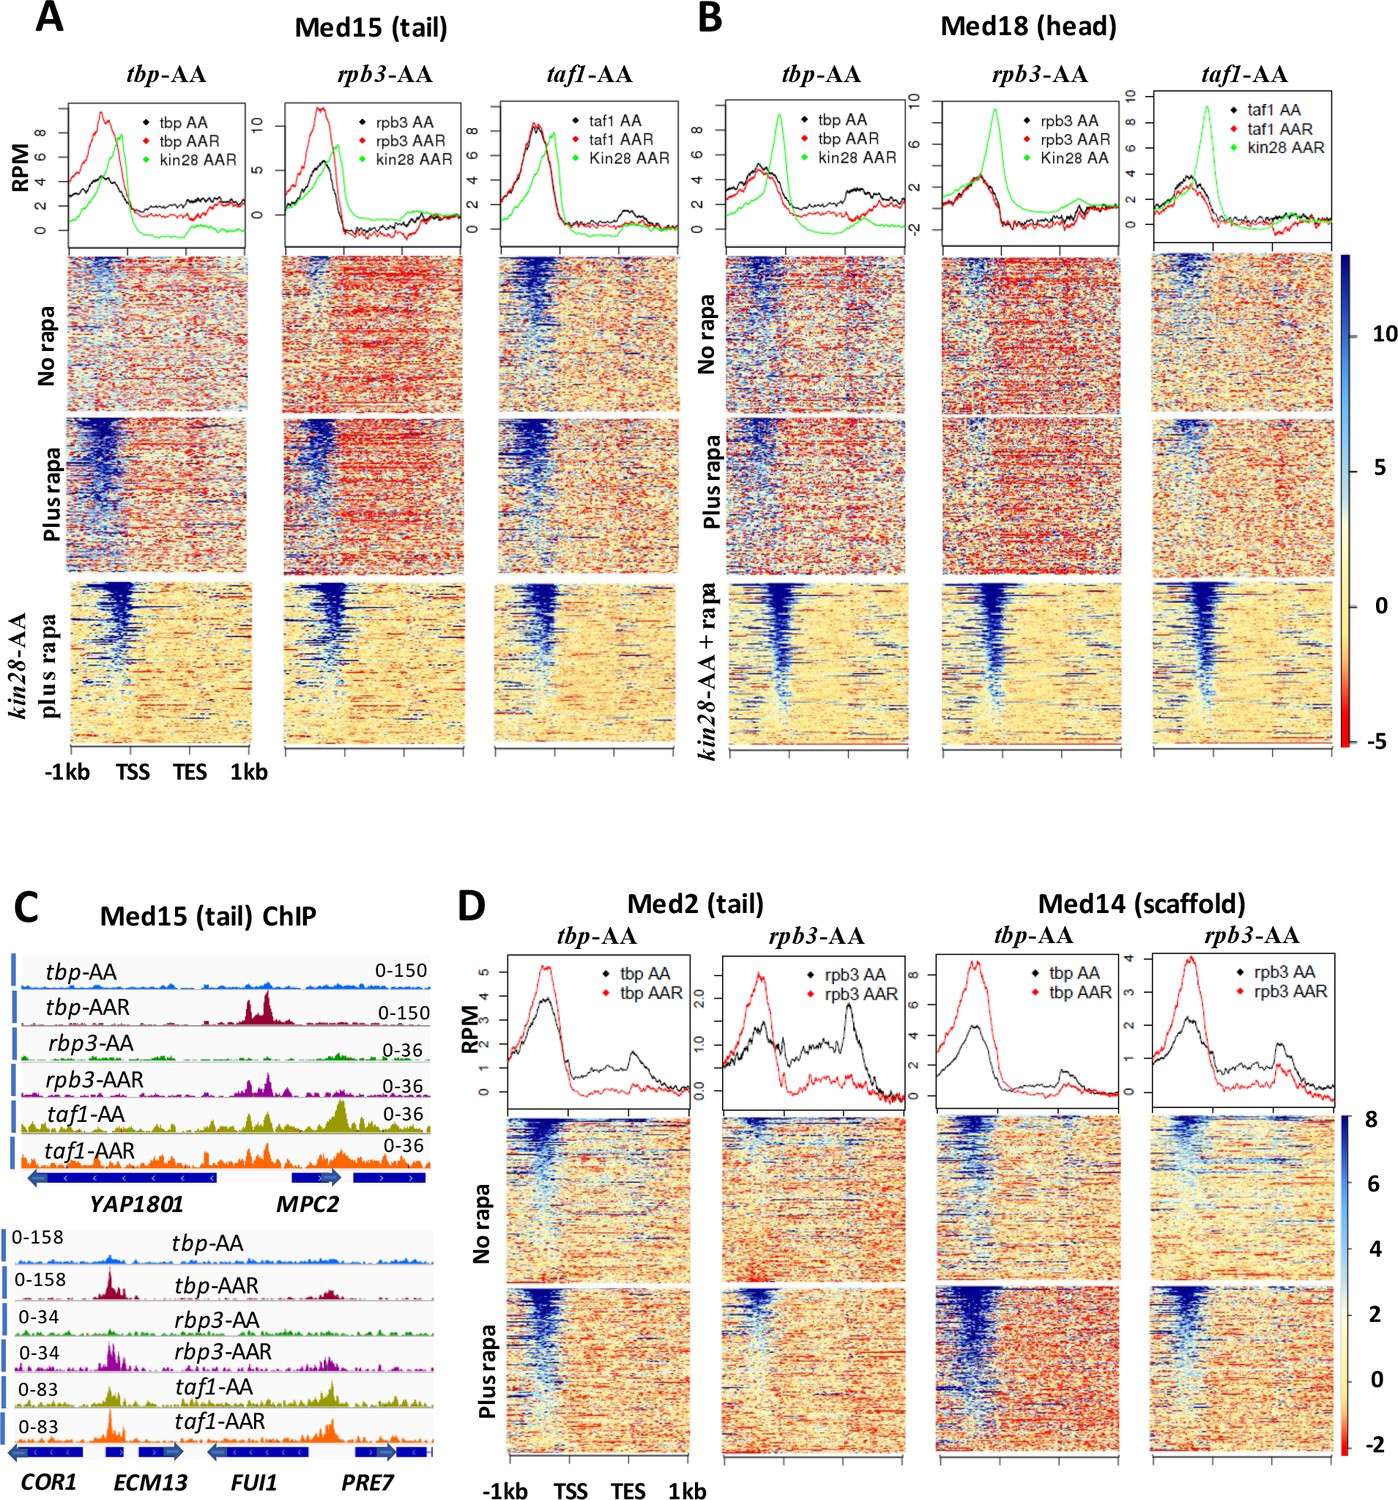
Effect of depletion of TBP and Rpb3 on Mediator occupancy.
ChIP-seq was performed against (A) Med15 and (B) Med18 in tbp-AA, rpb3-AA, and taf1-AA yeast with (‘AAR’) and without (‘AA’) rapamycin treatment, and in kin28-AA yeast after rapamycin treatment. Heat maps and line graphs (normalized reads per million, RPM) depict results combined from two independent experiments (except for Med18 in taf1-AA yeast) averaged over 498 genes exhibiting detectable Mediator ChIP signal at UAS regions in wild type yeast (Jeronimo et al., 2016). (C) Browser scans showing occupancy of Med15 at two chromosomal regions in tbp-AA, rpb3-AA, and taf1-AA yeast with and without rapamycin treatment. YBL044W, between COR7 and ECM13, is an uncharacterized ORF and likely contains a UAS, as has been observed at many other uncharacterized or dubious ORFs (Paul et al., 2015). (D) Med2 and Med14 occupancy measured by ChIP-seq with and without depletion of TBP or Rpb3, at UAS genes.
Figure 3—figure supplement 1
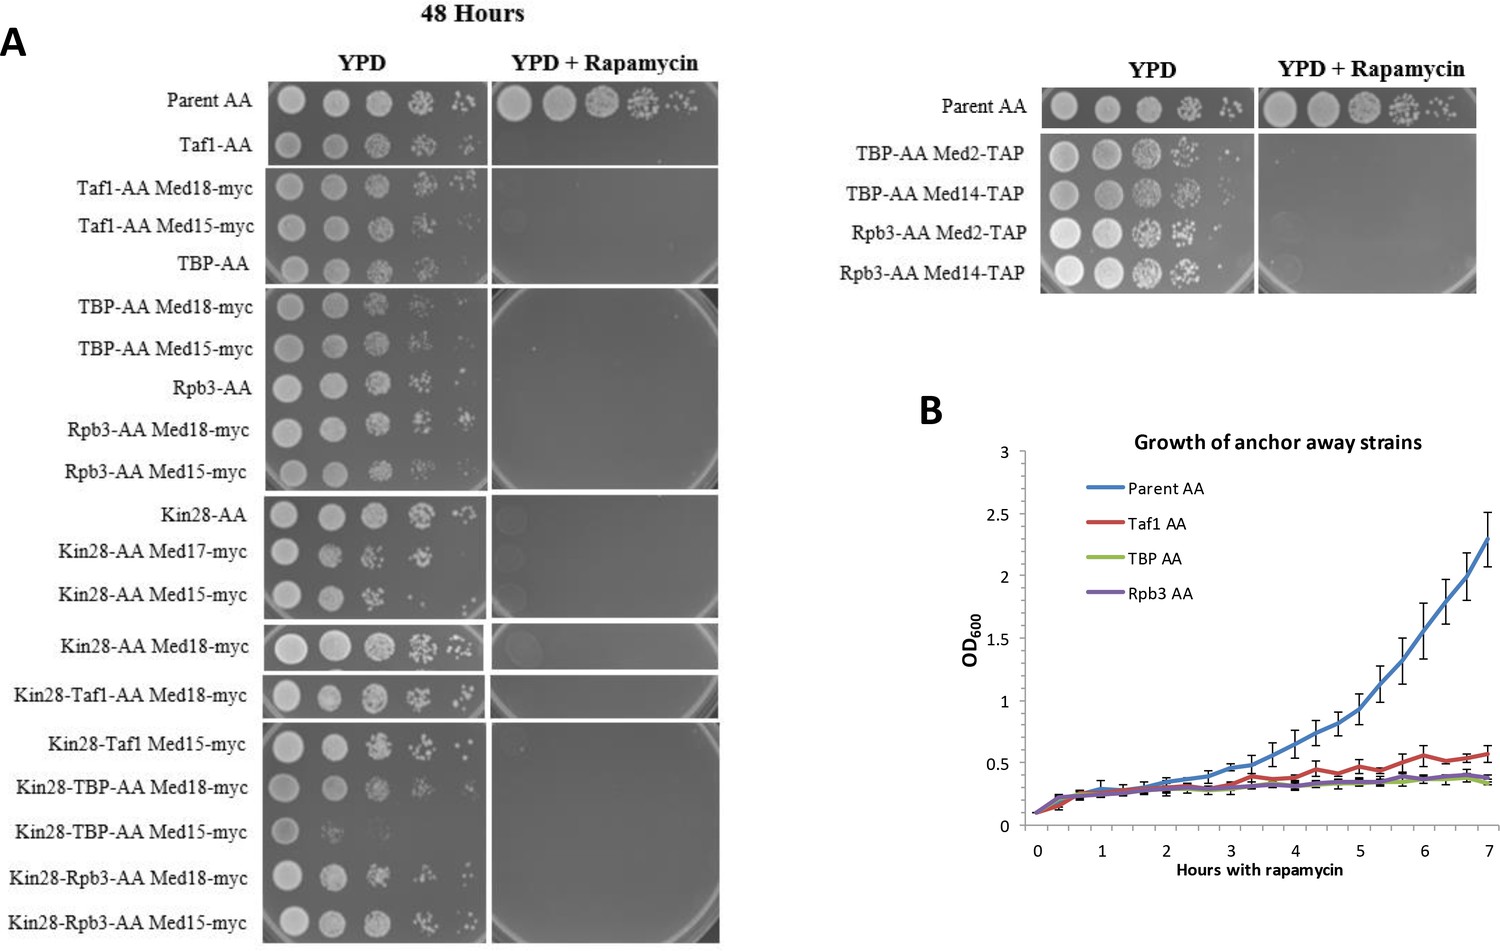
Loss of viability upon rapamycin treatment of anchor away strains used in this study.
(A) Ten-fold dilutions of indicated strains spotted onto YPD plates from left to right incubated 48 hr at 30 ˚C. (B) Growth in liquid YPD medium measured by OD600 at the indicated times after addition of 1 μg/ml of rapamycin. Error bars represent standard deviation for three biological replicates.
Figure 3—figure supplement 2
Control experiments for PIC component depletion.
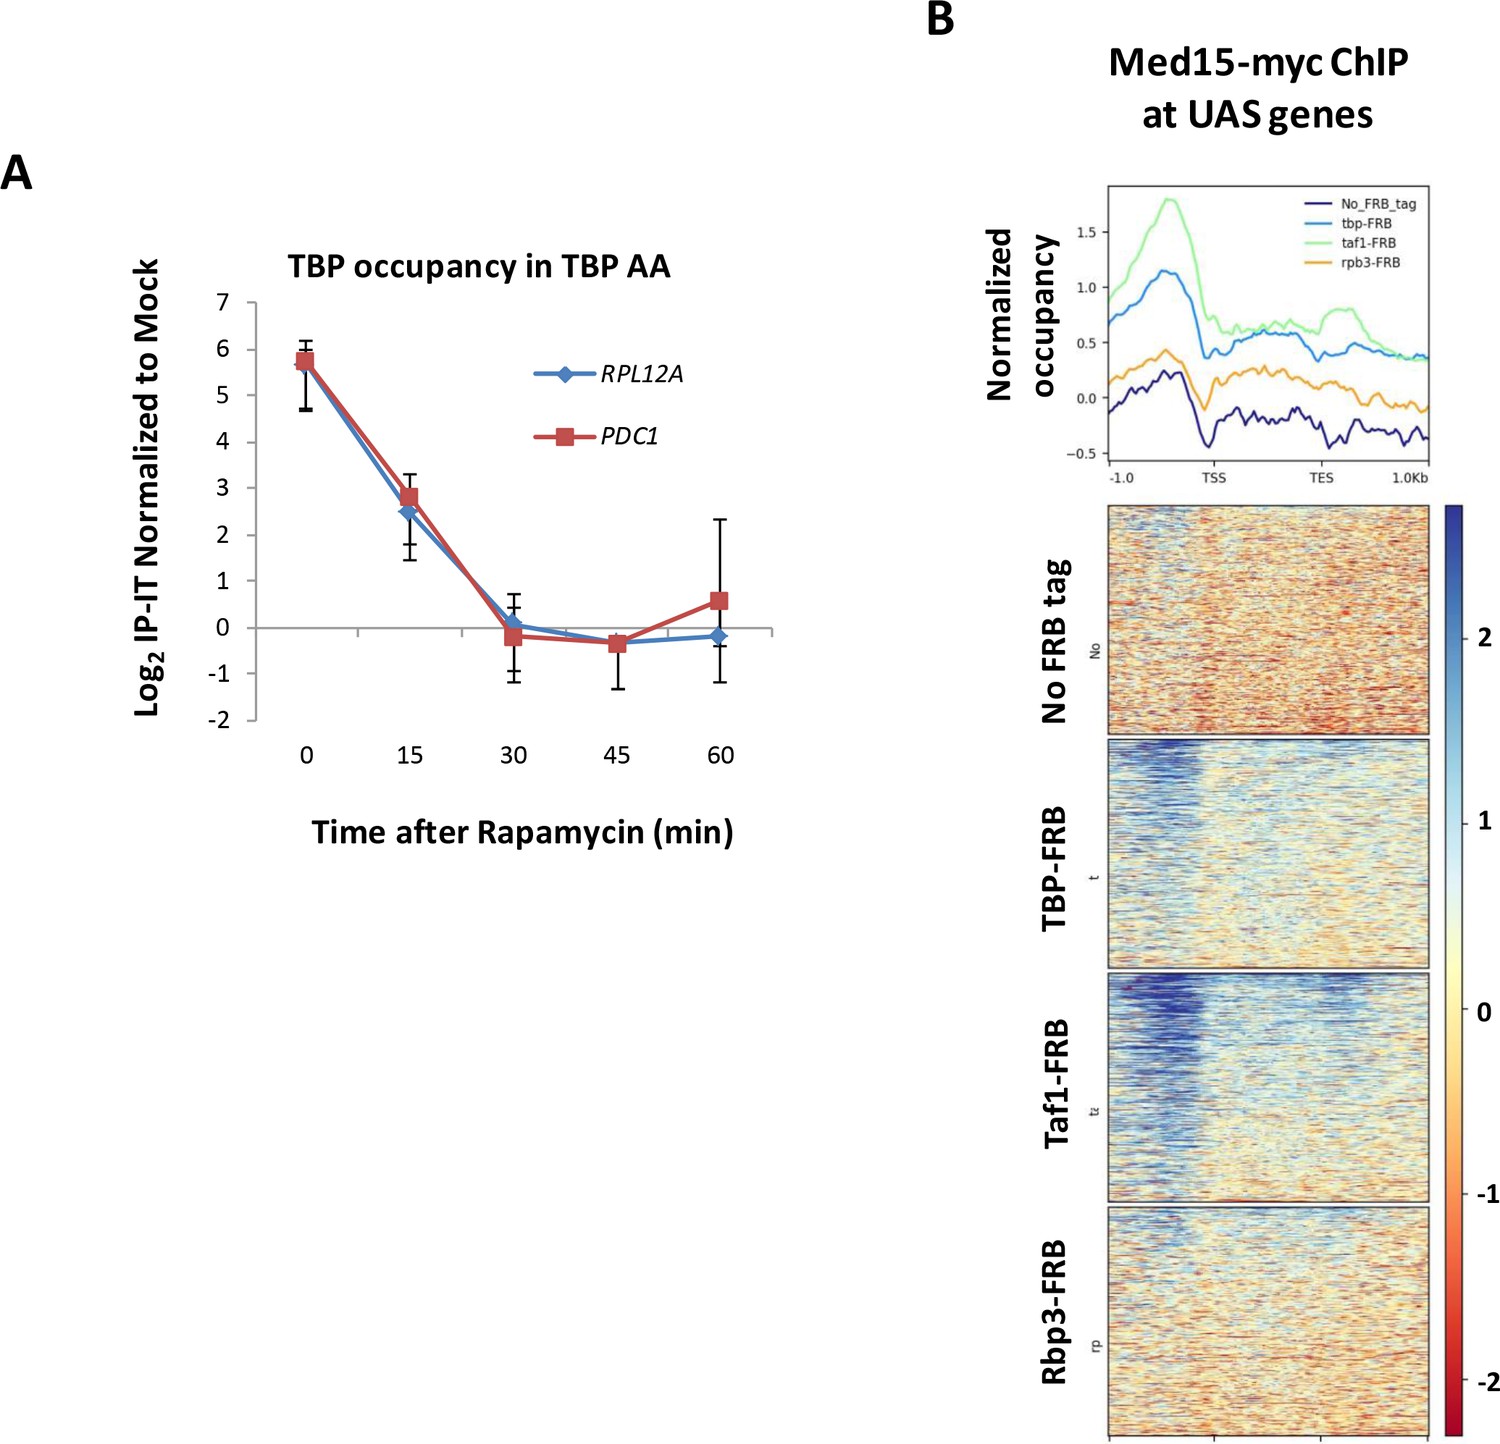
(A) Time course of TBP occupancy at RPL12A and PDC1 after rapamycin treatment measured by ChIP followed by qPCR. ChIP signals were normalized to a mock (no antibody) control after first subtracting input from IP values for both. Error bars represent standard deviation (n = 3). (B) Med15 occupancy determined by ChIP-seq is shown at UAS genes in strains YFR1321 (no FRB tag), EKY8 (tbp-AA), EKY13 (rpb3-AA), and EKY25 (taf1-AA). Line graphs depict average occupancy for taf1-AA yeast (green line), tbp-AA yeast (blue line), rpb3-AA yeast (brown line), and YFR1321 lacking an FRB tag (dark blue line).
Figure 3—figure supplement 3

Effect of PIC component depletion on normalized occupancy (reads per million) by other PIC components, shown at UAS genes.
(A) TBP occupancy in tbp-AA yeast with and without rapamycin addition. (B) Pol II occupancy in rpb3-AA yeast with and without rapamycin addition. ChIP was performed against Rpb3 in Replicate one and against Rpb1 in Replicate 2. (C) Taf1 occupancy in taf1-AA yeast with and without rapamycin addition. (D) Rpb1 occupancy in tbp-AA yeast with and without rapamycin addition (left), and TBP occupancy in rpb3-AA yeast with and without rapamycin addition.
Figure 3—figure supplement 4

Browser scans showing depletion of PIC components and differential ChIP signal for Mediator tail and head module subunits at proximal promoter and UAS regions.
(A) Browser scans showing depletion of PIC components by anchor away in replicate experiments. Scans are normalized for read number within each set of strains (e.g., all four tbp-AA TBP experiments are normalized together). Note that depletion of Taf1 results in a decrease in Taf1 signal at the SAGA-dominated gene SNQ2 but not at the TFIID-dominated RPL4 promoter. Pol II occupancy was measured by performing ChIP against Rpb3 in Replicate one using rpb3-AA yeast (Figure 3—figure supplement 3), but this experiment yielded signal too low for browser scans to be informative. (B) Normalized occupancy shown in browser scans for Mediator subunits at PGK1 and PMA1 in kin28-AA yeast treated with rapamycin. Note the upstream (UAS) peak seen for Med15 but absent for Med17 and Med18.
Figure 4
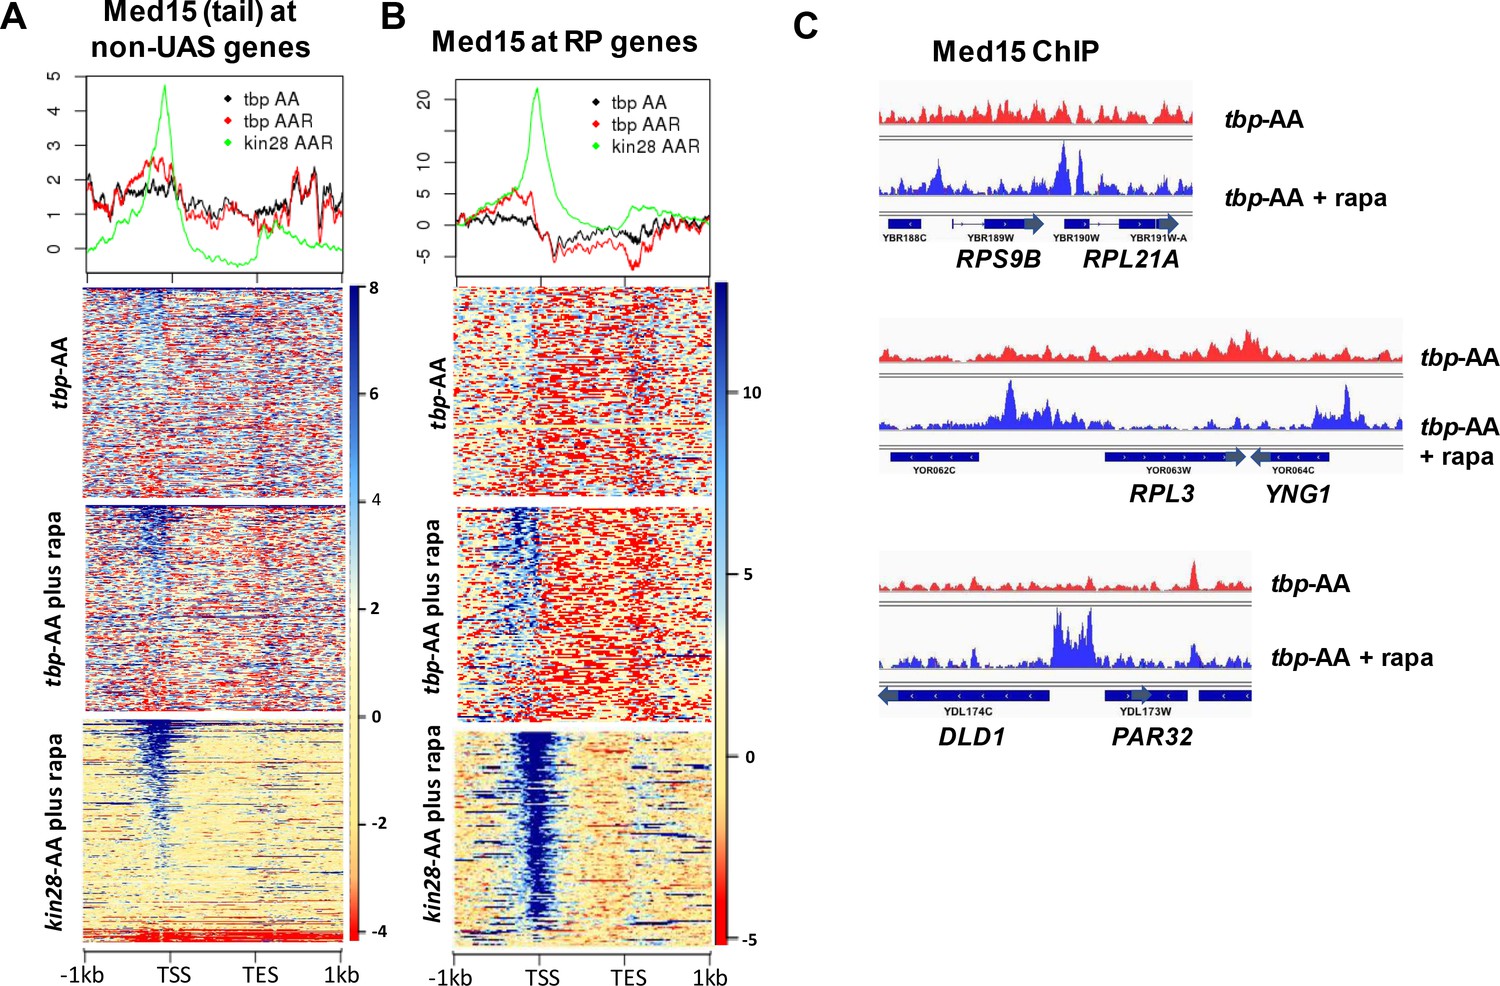
Effect of depletion of TBP on Mediator occupancy at ‘non-UAS’ genes.
(A) Med15 occupancy measured by ChIP-seq at the 2000 most highly transcribed genes, after removal of the 498 genes exhibiting detectable Mediator ChIP signal at UAS regions in wild type yeast (Jeronimo et al., 2016), in tbp-AA yeast with and without rapamycin treatment. Occupancy after depletion of Kin28 (bottom) is shown for reference. (B) Med15 occupancy measured by ChIP-seq at ribosomal protein (RP) genes and at the DLD1-PAR32 promoter in tbp-AA yeast with and without rapamycin treatment.
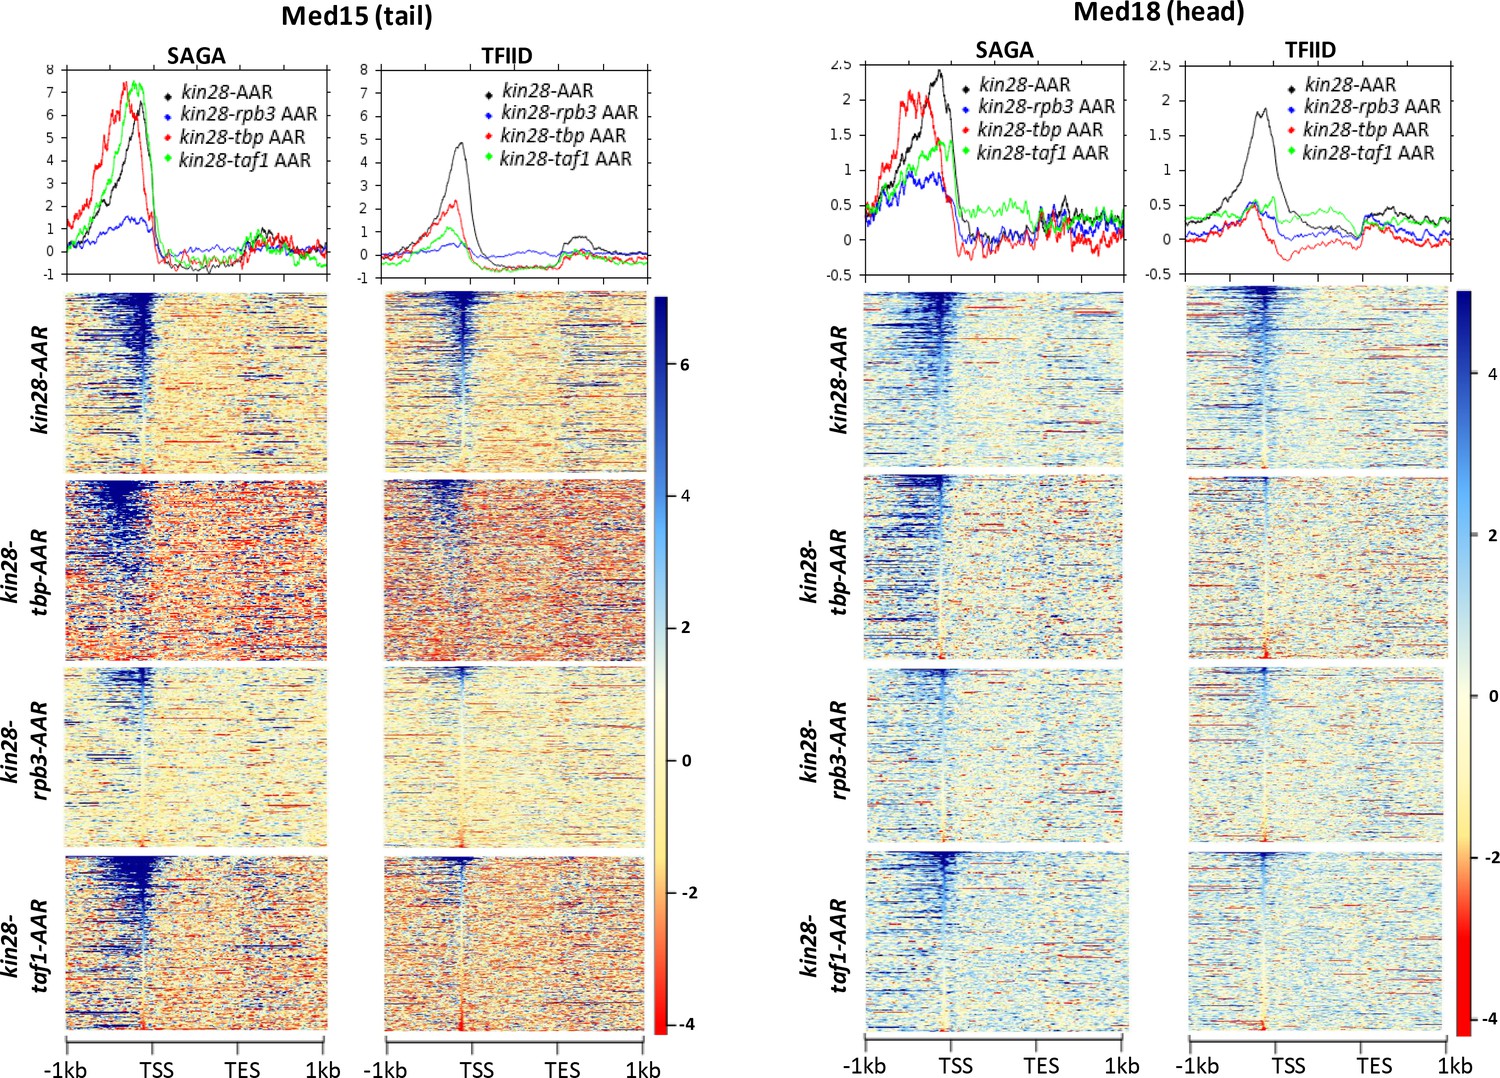
Figure 5 with 4 supplements
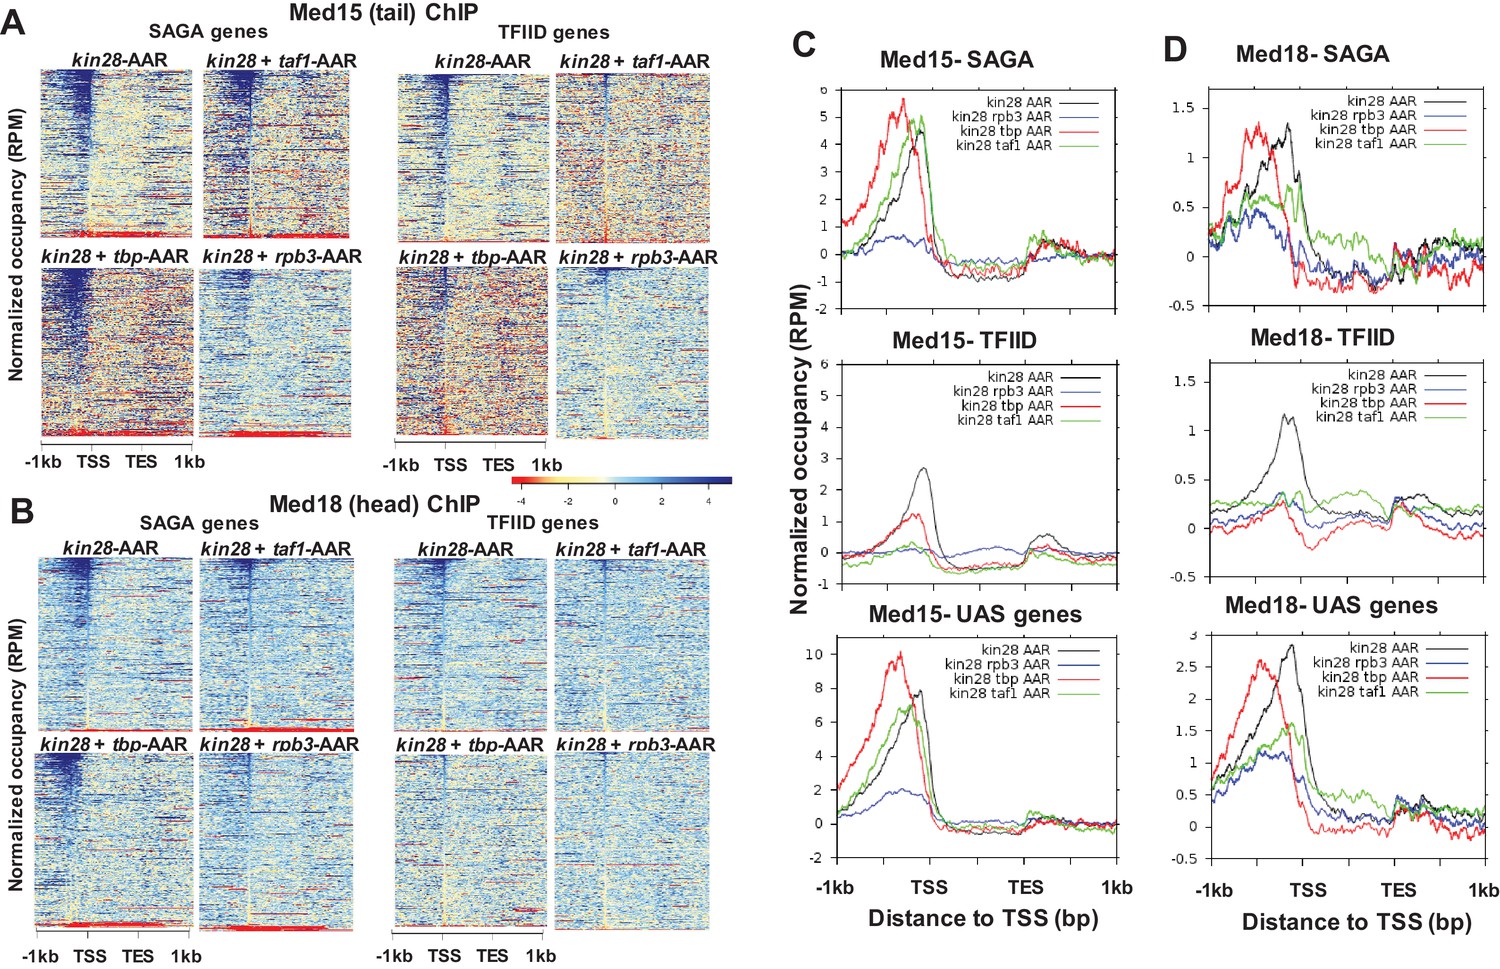
Effect of depletion of PIC components together with Kin28 on Mediator occupancy.
(A) Heat maps showing occupancy of Med15 after depletion of Kin28 alone, or in combination with Taf1, TBP, or Rpb3, at SAGA-dominated and TFIID-dominated genes. (B) Same as (A), for Med18 occupancy. (C) Line graphs (normalized reads per million) depicting Med15 occupancy after depletion as in (A) and (B), aligned at the TSS and shown for SAGA-dominated (top), TFIID-dominated (middle), and UAS (bottom) genes. (D) Same as (C), but for Med18. Combined data for two replicate experiments was used for kin28-tbp-AA yeast; all other plots derive from single experiments that were consistent with replicate experiments. We note that variable results were observed for the effect on Med15 occupancy in kin28-taf1-AA yeast at SAGA-dominated genes, with peak intensity being reduced in some experiments and nearly unchanged in others, while reduced occupancy was consistently observed at TFIID genes.
Figure 5—figure supplement 1
Effect of depletion of PIC components together with Kin28 on Mediator occupancy at similarly expressed SAGA-dominated and TFIID-dominated genes.
Normalized Med15 (left) and Med18 (right) occupancy at similarly expressed (transcript levels between 5 and 10 (Nagalakshmi et al., 2008) SAGA-dominated and TFIID-dominated genes after depletion of Kin28 alone or in combination with Taf1, TBP, or Rpb3.
Figure 5—figure supplement 2

Browser scans of normalized Mediator occupancy after simultaneous depletion of Kin28 and Rpb3 or Kin28 and Taf1.
Browser scans of two chromosomal regions showing greater reduction in normalized occupancy of Med15 (tail, red traces) and Med18 (head, green traces) at a TFIID-regulated gene (AFB1) and a SAGA/TFIID-regulated gene (CIS3) than at two SAGA-regulated genes (PDC1 and HSP150) in kin28-AA yeast after depletion of Rpb3 or Taf1.
Figure 5—figure supplement 3
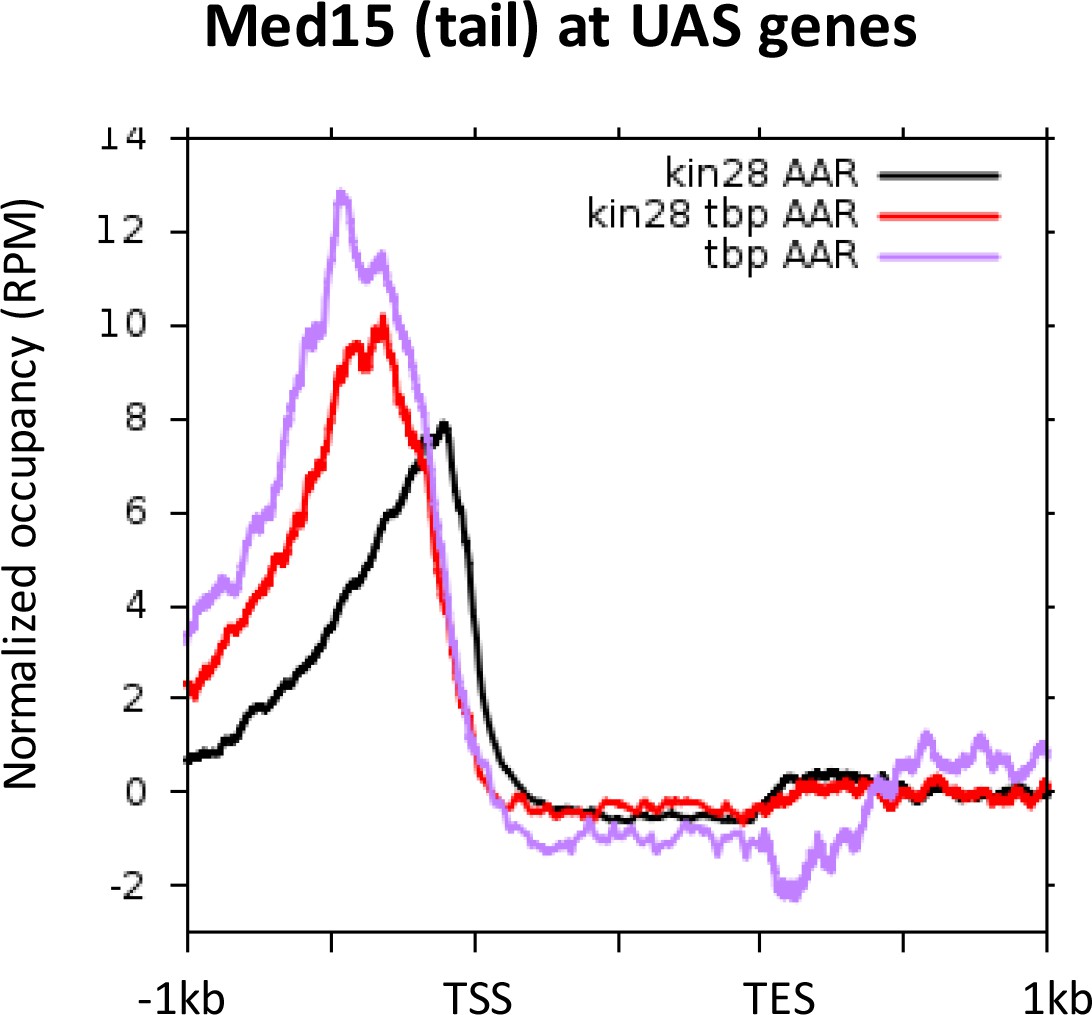
Med15 occupancy at UAS regions after depletion of TBP, Kin28, or Kin28 and TBP together.
https://doi.org/10.7554/eLife.39633.014
Figure 5—figure supplement 4
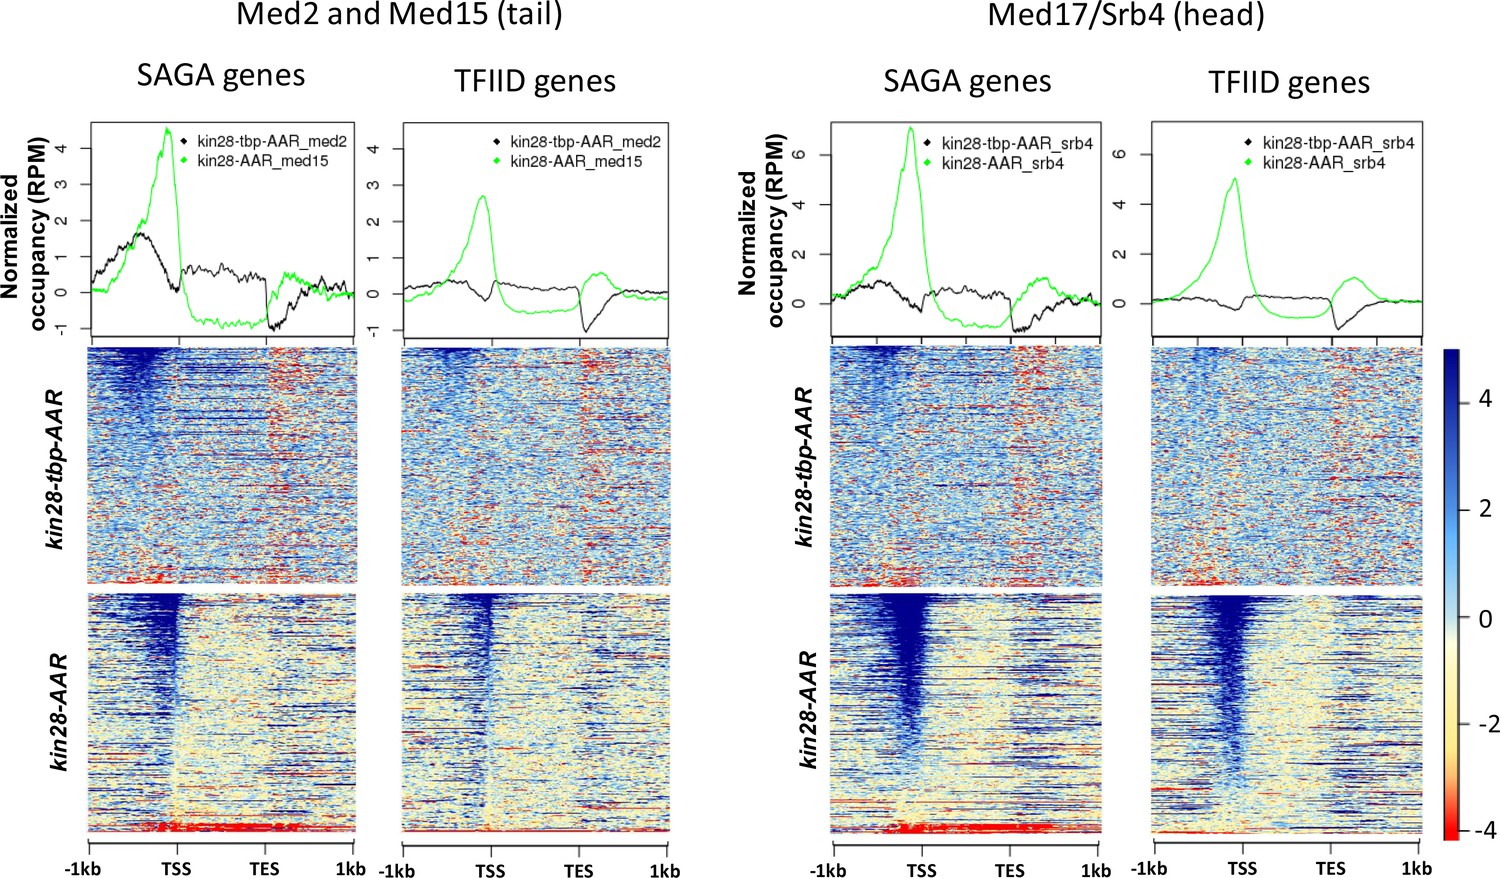
Normalized occupancy of Med2 and Med17 at SAGA and TFIID genes after depletion of Kin28 and TBP together compared to Kin28 alone
(Med15 was used as a proxy for Med2 in kin28-AA yeast).
Figure 6

TBP depletion shifts Mediator occupancy from promoter to UAS sites.
Browser scans showing normalized Med15 and Med18 occupancy in kin28-AA and kin28-tbp-AA yeast treated with rapamycin, as indicated. (A) Upstream shift of Mediator at a SAGA-dominated gene and loss of occupancy at a TFIID-dominated gene upon depletion of TBP. Arrows depict direction of transcription. (B) Loss of Mediator peaks at promoters and gain of Mediator peaks at upstream regions at both TFIID and SAGA-dominated genes. YBL044W is an uncharacterized ORF and likely contains a UAS, as has been observed at many other uncharacterized or dubious ORFs (Paul et al., 2015). (C) At some loci, new Mediator peaks are visible after dual depletion of Kin28 and TBP (boxed regions).
Figure 7
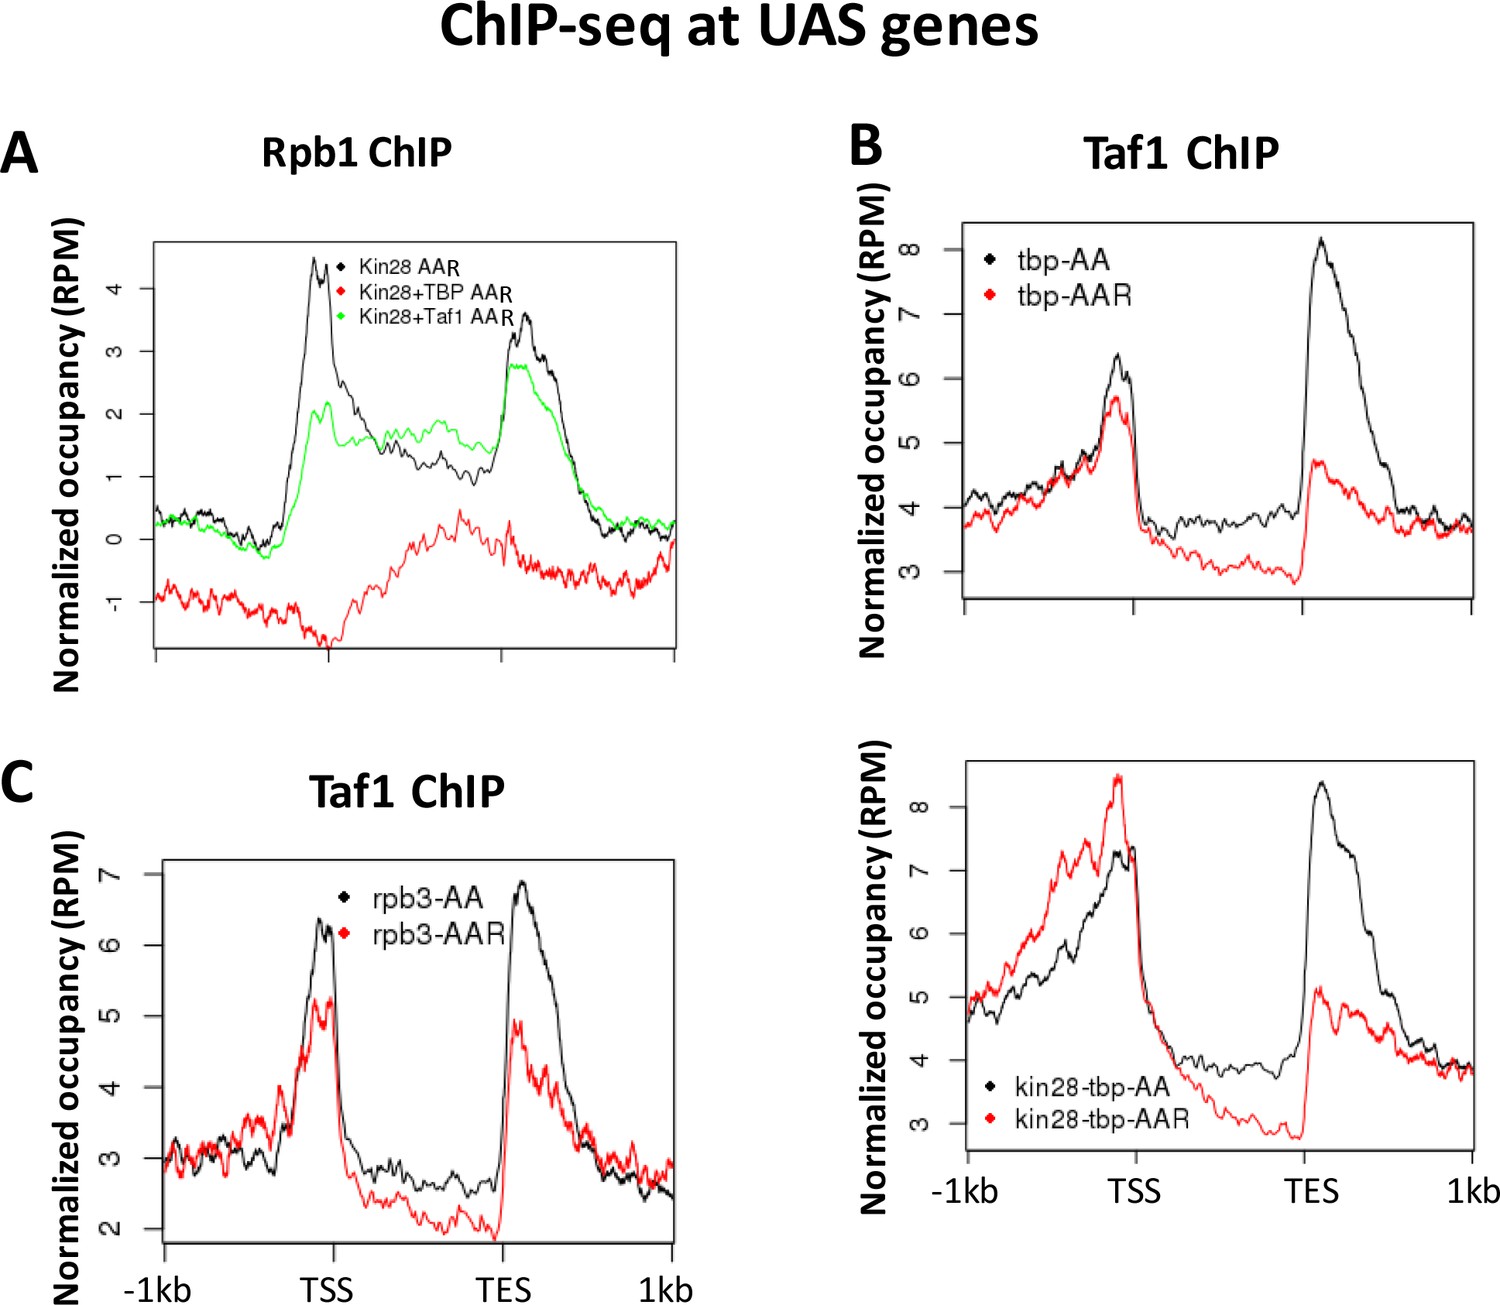
Normalized PIC occupancy at UAS genes after PIC component depletion.
(A) Rbp1 occupancy after depletion of Kin28 (black), Kin28 and TBP (red), and Kin28 and Taf1 (green). (B) Taf1 occupancy before (black) and after (red) depletion of TBP (top graph) or TBP and Kin28 (bottom graph). (C) Taf1 occupancy before (black) and after (red) depletion of Rpb3. The prominent peaks observed near the TES appear to represent artifactual ChIP signal sometimes seen at 3’ regions of highly transcribed genes; similar signals are observed in ChIP against GFP expressed in yeast (Paul et al., 2015).
Figure 8
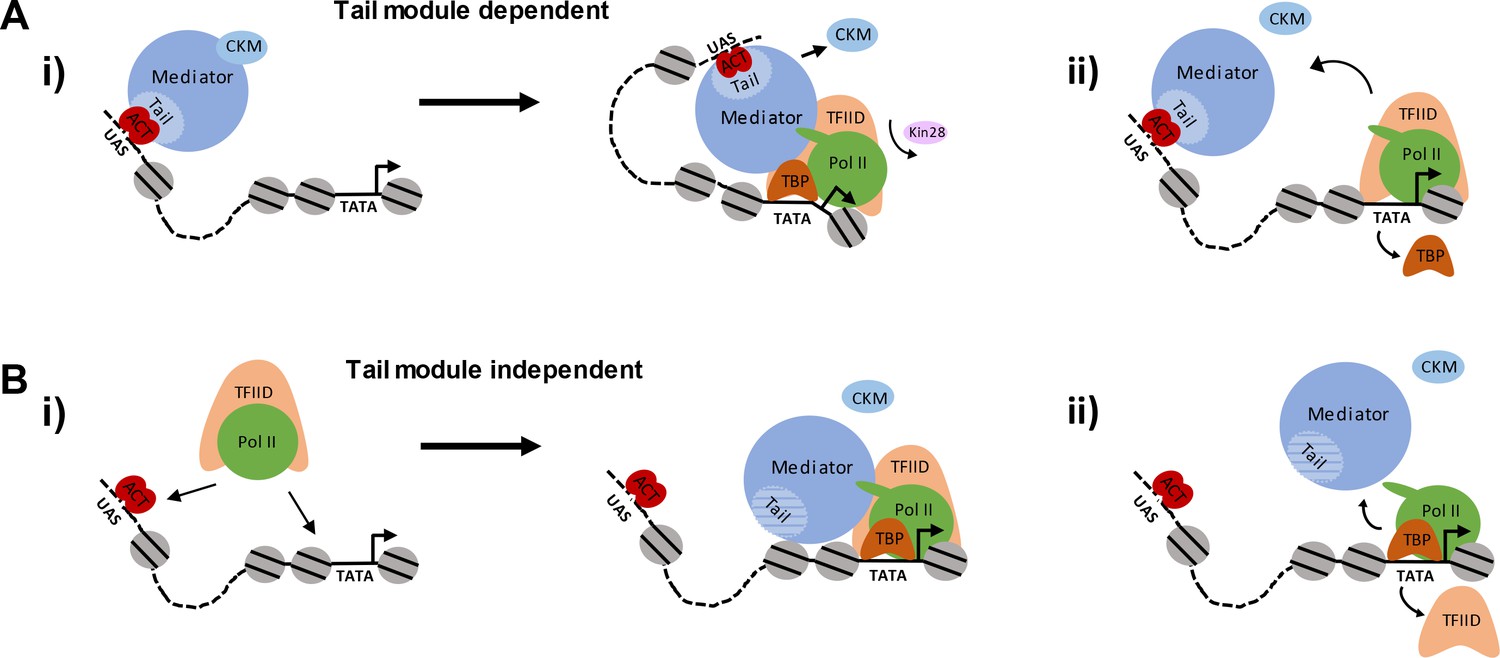
Pathways of Mediator recruitment.
(A) (i) Mediator recruitment via interactions between activator proteins bound to UASs and the Med2-Med3-Med15 triad. Contacts between Mediator and components of the general transcription machinery facilitate transit of Mediator to the proximal promoter region, and stabilize association of both Mediator and GTFs. (ii) TBP plays a critical role in this transition, and its depletion results in Mediator being stranded at the UAS. (B) (i) Mediator recruitment via interactions between the middle/head modules and components of the PIC. In this pathway, the PIC is first recruited via interactions between UAS-bound activators and PIC components, such as Tafs within TFIID. (ii) Depletion of PIC components destabilizes association of Mediator with the proximal promoter, particularly at TATA-less, TFIID-dominated promoters.
Author response image 1

Replicates used for graphs and heat maps of Figure 3.
Replicate data was combined except for taf1-AA and taf1-AAR for Med15, as the second ChIP experiment failed.
Author response image 2

Replicate data for Figure 5.
https://doi.org/10.7554/eLife.39633.025Tables
Key resources table
| Reagent type (species) or resource | Designation | Source or reference | Identifiers | Additional information |
|---|---|---|---|---|
| Strain, strain background (S. cerevisiae) | yFR1321 | PMID: 24704787 | Francois Robert (University of Montreal) | |
| Strain, strain background (S. cerevisiae) | KHW127 | PMID: 24746699 | Kevin Struhl (Harvard Medical School) | |
| Strain, strain background (S. cerevisiae) | LS01 | PMID: 15254252 | Alan Hinnebusch (National Institutes of Health) | |
| Strain, strain background (S. cerevisiae) | LS10 | PMID: 15254252 | Alan Hinnebusch (National Institutes of Health) | |
| Strain, strain background (S. pombe) | FWP510 | PMID: 24100010 | Fred Winston (Harvard Medical School) | |
| Antibody | 8WG16 (Pol II) (mouse monoclonal) | Covance | Cat# 664906 | ChIP, 2 μg (1:150) |
| Antibody | Rpb3 (mouse monoclonal) | Neoclone | Cat# W0012 | ChIP, 1 μg (1:300) |
| Antibody | 9E10 (Myc) (mouse monoclonal) | Roche | Cat# 11667141001 | ChIP, 2 μg (1:150) |
| Antibody | 9E10 (Myc) (mouse monoclonal) | Sigma | Cat# 11667149001 | ChIP, 5 μg (1:300) |
| Antibody | anti-protein A (rabbit polyclonal) | Sigma | Cat# P3775 | ChIP, 2.5 μg (1:250) |
| Antibody | TBP (affinity-purified rabbit polyclonal) | Tony Weil, Vanderbilt University | NA | ChIP, 2.5 μg (1:150) |
| Antibody | 58C9 (TBP) (mouse monoclonal) | Abcam | Cat# ab61411 | ChIP, 5 μg (1:300) |
| Antibody | Taf1 antisera (rabbit polyclonal) | Joseph Reese and Song Tan, Pennsylvania State University | NA | ChIP, 2 μL (1:250) |
| Recombinant DNA reagent | pFA6a-FRB-kanMX6 | Euroscarf | P30578 | |
| Recombinant DNA reagent | pFA6a-2-FKB12-His3MX6 | Euroscarf | P30583 | |
| Recombinant DNA reagent | pSC11 | Burke et al., 2000 | ||
| Commercial assay or kit | Magnetic Bead Isolation Kit | New EnglandBiolabs | Cat# S1550S | |
| Commercial assay or kit | NEB Next Ultra RNA Library Prep Kit | New England Biolabs | Cat# E7530S | |
| Commercial assay or kit | NEBNext Ultra II Library Prep Kit | New England Biolabs | Cat# E7645S | |
| Commercial assay or kit | NEBNext Multiplex Oligos for Illumina | New England Biolabs | Cat# E7710 | |
| Commercial assay or kit | NEXTflex barcodes | BIOO Scientific | Cat# 514122 | |
| Chemical compound, drug | Rapamycin | LC Laboratories | Cat# R-5000 | |
| Software, algorithm | bwa | PMID: 10571001 | RRID: SCR_010910 | |
| Software, algorithm | SICER | PMID: 19505939 | RRID: SCR_010843 | |
| Software, algorithm | BioConductor | PMID: 15461798 | RRID:SCR_006442 | |
| Software, algorithm | Integrative Genomics Viewer | PMID: 21221095 | RRID: SCR_011793 | |
| Software, algorithm | tophat2 | PMID: 23618408 | RRID: SCR_013035 (Tophat) |
Additional files
-
Supplementary file 1
Yeast strains used in this study.
- https://doi.org/10.7554/eLife.39633.019
-
Supplementary file 2
Primers used in this study.
- https://doi.org/10.7554/eLife.39633.020
-
Supplementary file 3
Summary of RNA-seq and ChIP-seq experiments.
- https://doi.org/10.7554/eLife.39633.021
-
Transparent reporting form
- https://doi.org/10.7554/eLife.39633.022
Download links
A two-part list of links to download the article, or parts of the article, in various formats.
Downloads (link to download the article as PDF)
Open citations (links to open the citations from this article in various online reference manager services)
Cite this article (links to download the citations from this article in formats compatible with various reference manager tools)
Role of the pre-initiation complex in Mediator recruitment and dynamics
eLife 7:e39633.
https://doi.org/10.7554/eLife.39633


