Fusion surface structure, function, and dynamics of gamete fusogen HAP2
- Harvard Medical School, United States
- Children's Hospital Boston, United States
- University of Maryland, United States
- Northeastern University, United States
Figures
Figure 1

Overall structure of HAP2.
(A, B) Ribbon diagrams of current (A) and previous (B) trimer structures. Apically exposed residues in the fusion loops, disulfide bonds, and Asn-linked glycans are shown in stick with orange sulfurs, red oxygens, blue nitrogens, and white carbons in glycans. Loops have been smoothed for simplicity. The trimer 3-fold axis is shown with a cyan arrow. Regions of missing electron density, except for the fusion loops in (B) are shown as dashed lines. Residues adjacent to gaps are numbered.
Figure 2 with 5 supplements

HDX.
(A,B) One monomer of the trimer is shown viewed from inside (A) and outside (B) the 3-fold axis (cyan arrow) with HDX at 1 min. color-coded on the ribbon diagram. Secondary structure elements within each domain are divided and labeled according to whether they are closer to the 3-fold trimer axis (A) or further from the axis (B). Transparent surfaces of other monomers within 4 Å appear white and grey on their exteriors and interiors, respectively. (C) Detail of the Arg185 carbonyl cage at 1 min of HDX. Hydrogen bonds are dashed. (D) Difference in trimer and monomer HDX for every shared peptide is shown in colored curves (Houde et al., 2011). Key structural positions are marked.
Figure 2—figure supplement 1

Purification and Trimerization of HAP2.
(A) Size exclusion chromatography of HAP2 preparations used in HDX. Monomer and trimer were prepared and subjected to Superdex 200 chromatography as described in Materials and methods. Fractions marked with brackets were used in HDX. (B–C) SEC-MALS (see Materials and methods). (B) UV A280 absorption peaks of trimer and monomer (right axis) are arrowed as are the masses of components from conjugate analysis (left axis). (C) Calculated protein, glycan, glycoprotein, and DDM micelle masses from the protein conjugate model (Materials and methods). Errors are fitting errors.
Figure 2—figure supplement 2
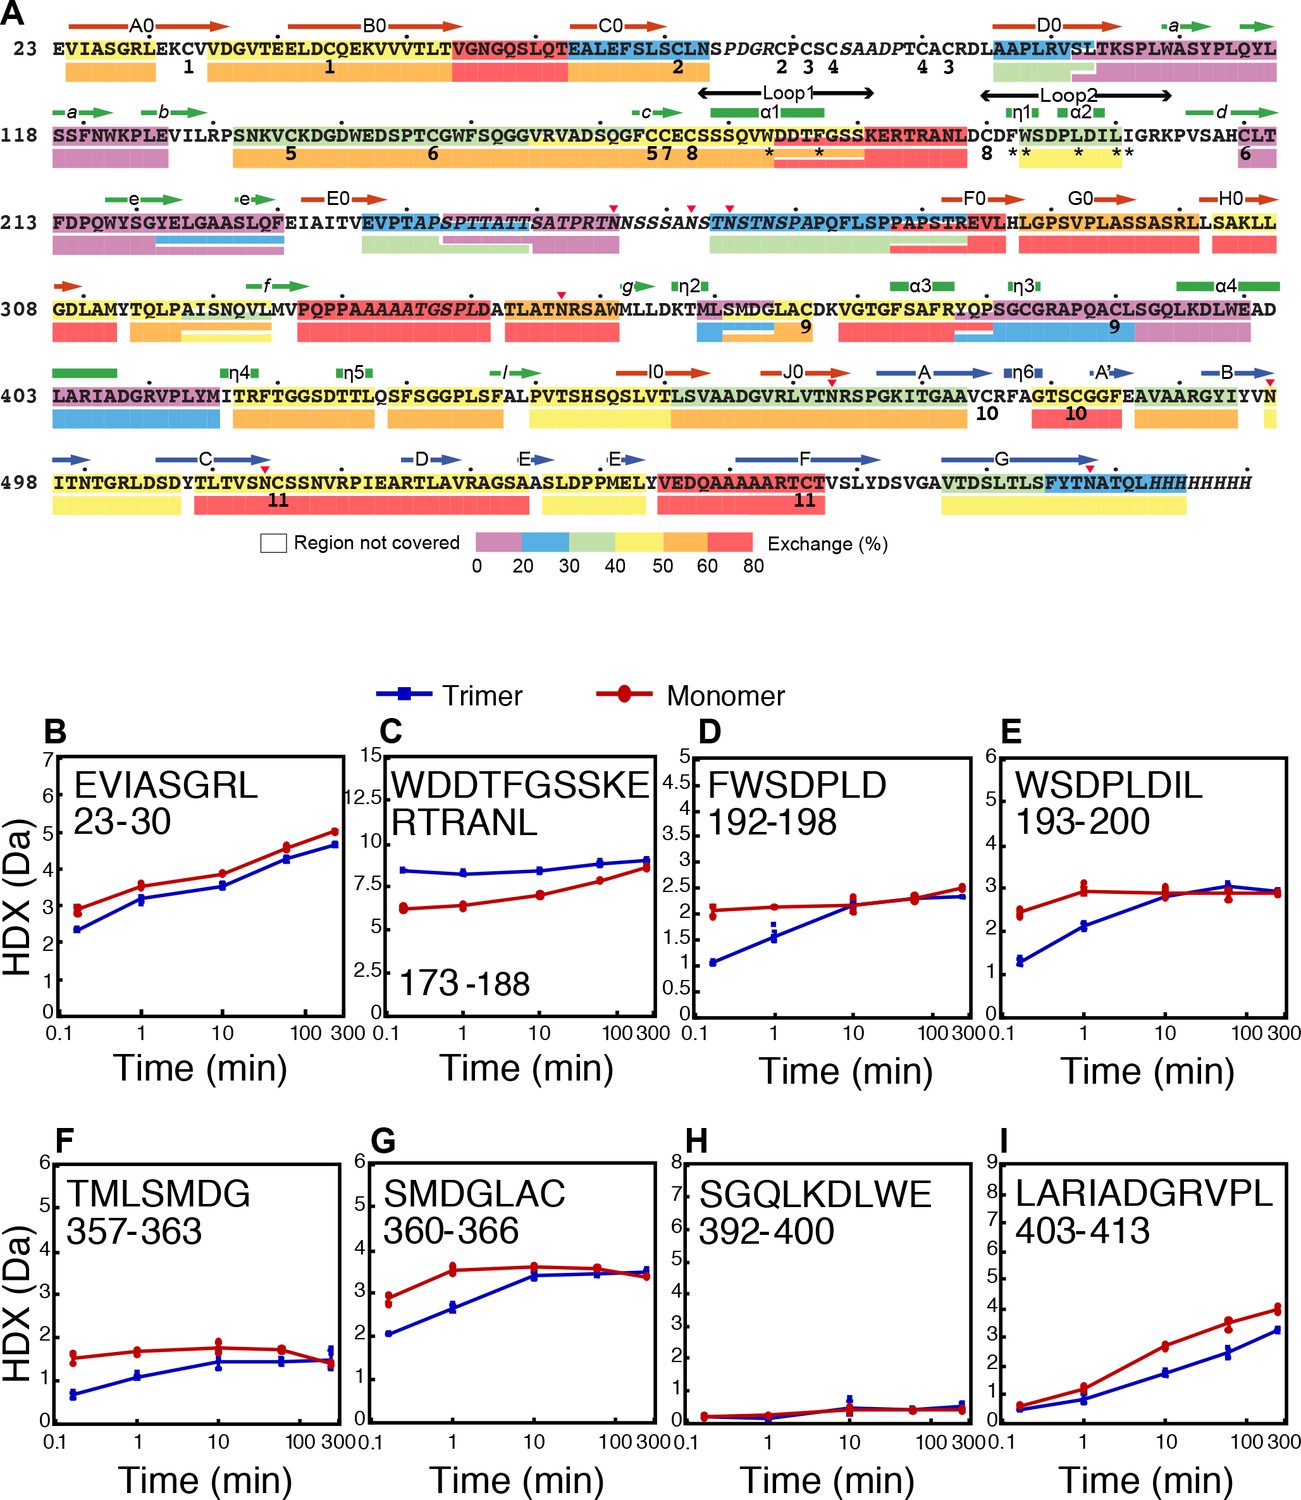
Trimer and monomer HDX and secondary structure of HAP2.
(A) Sequence of HAP2 with secondary structure elements in D1 (red), D2 (green), and D3 (blue). Decadal residues are dotted. Cysteines are numbered by disulfide bond. Fusion loop residues are asterisked. Disordered sequence is italicized. HDX of the trimer is color coded at 1 min (on sequence) and 60 min (below sequence). Up to two overlapping peptides are shown. The N-terminal residue of each peptide does not contribute to exchange and is omitted. B–I. HDX kinetics for individual peptides.
Figure 2—figure supplement 3
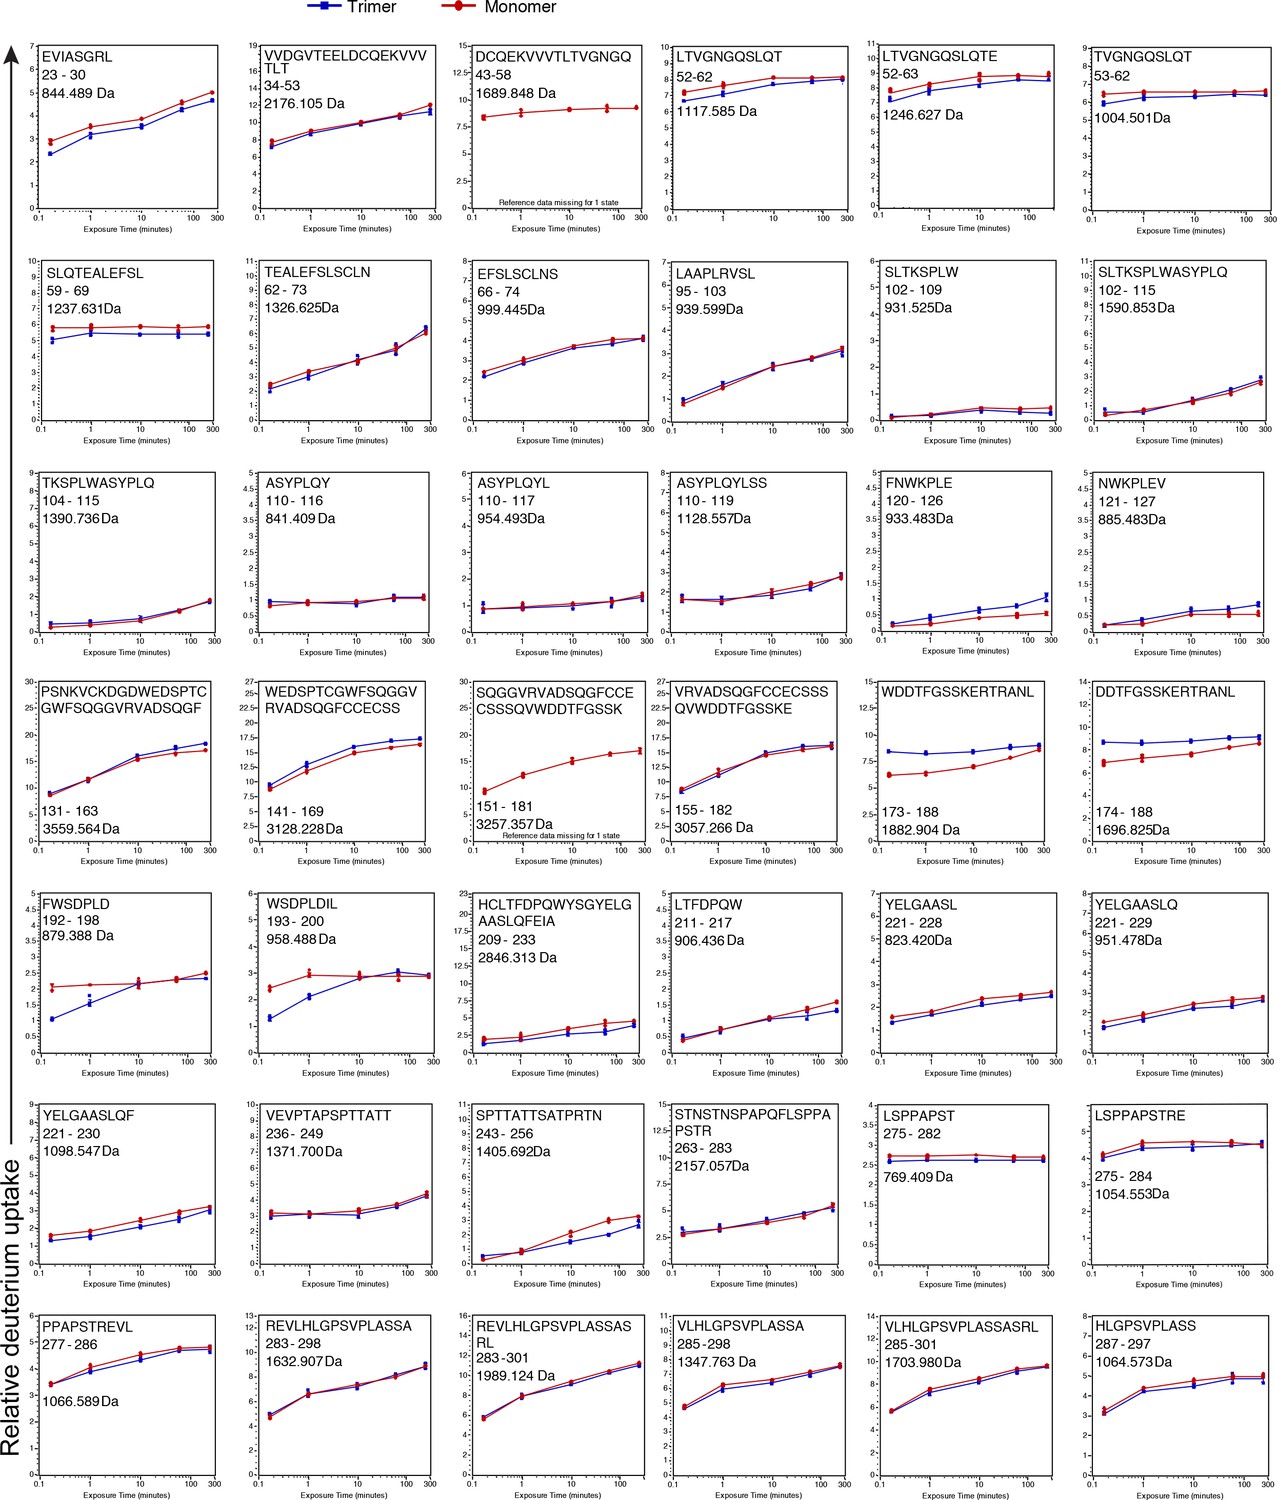
Deuterium incorporation plots for all 120 peptic peptides that were compared between the monomer (red) and trimer (blue).
On the x axis is the time in minutes and on the y-axis is the relative uptake (Da). The maximum y-axis value for each plot represents the theoretical maximum amount of D that can be incorporated into a peptide. Values represent the mean of three individual measurements; error bars, s.d.
Figure 2—figure supplement 4
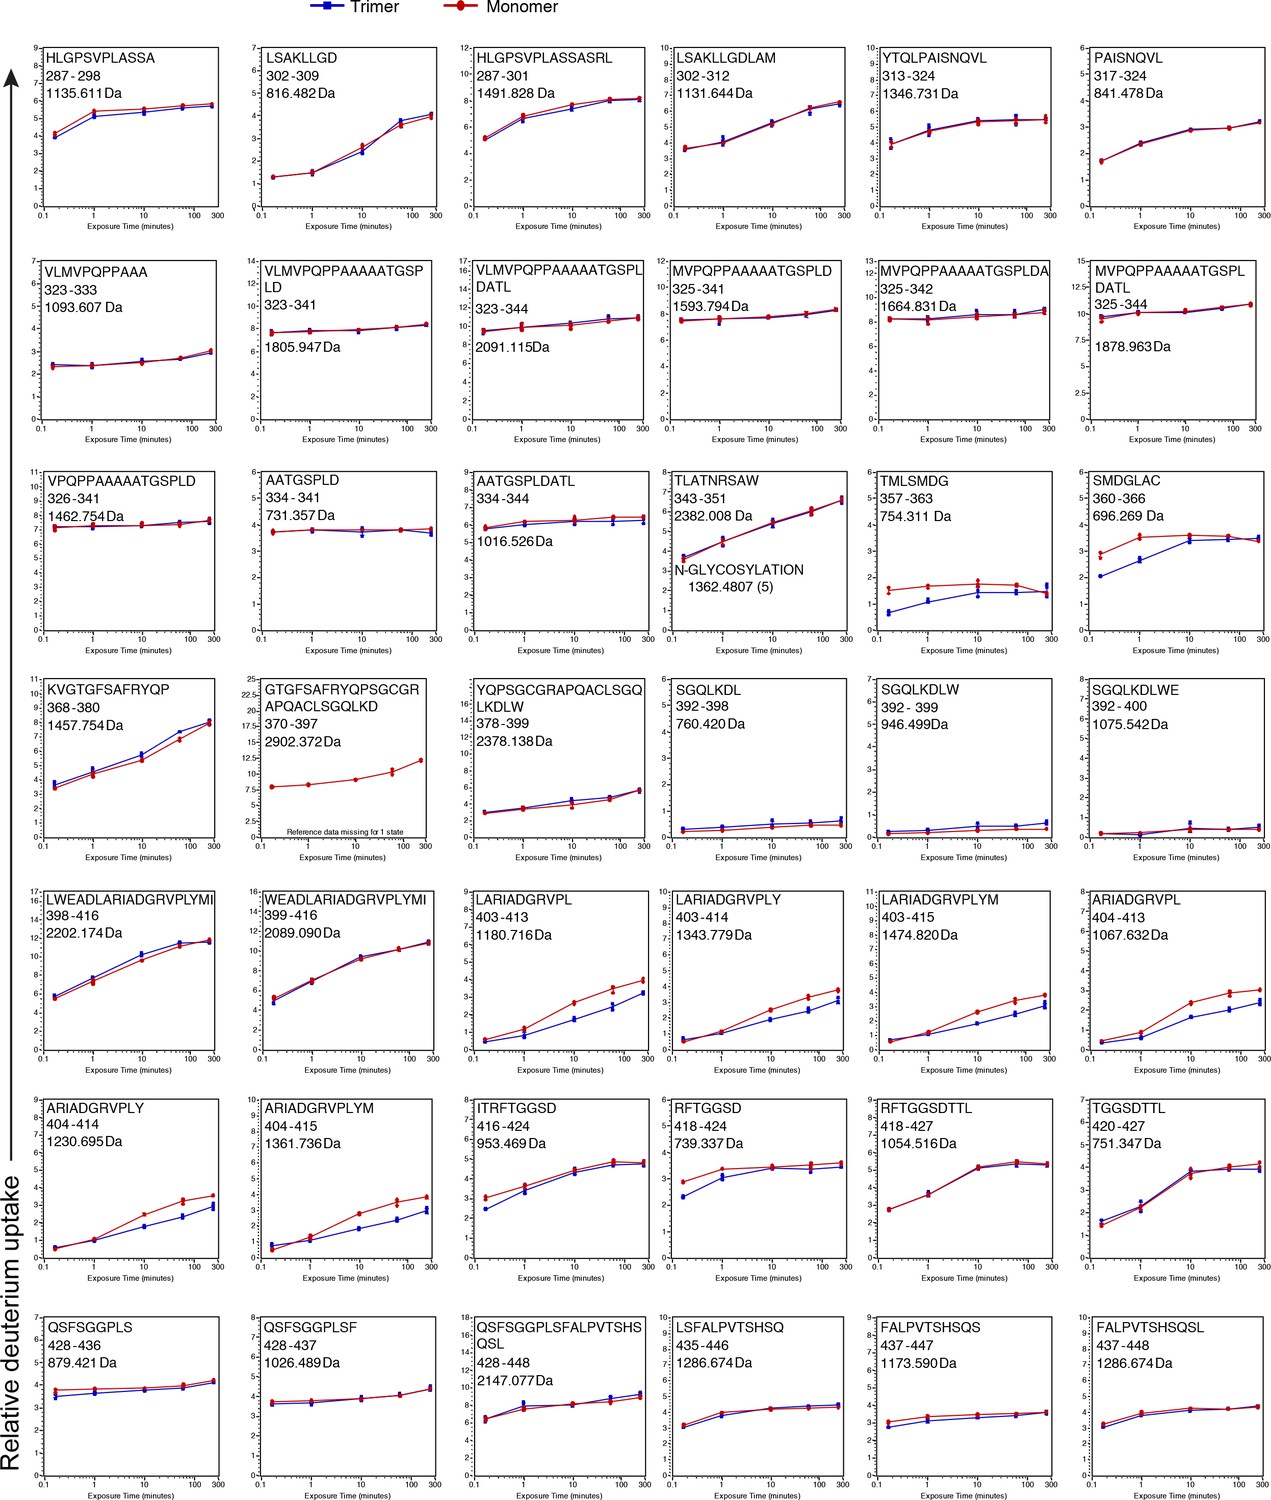
See legend for Figure 2—figure supplement 3 .
https://doi.org/10.7554/eLife.39772.007
Figure 2—figure supplement 5
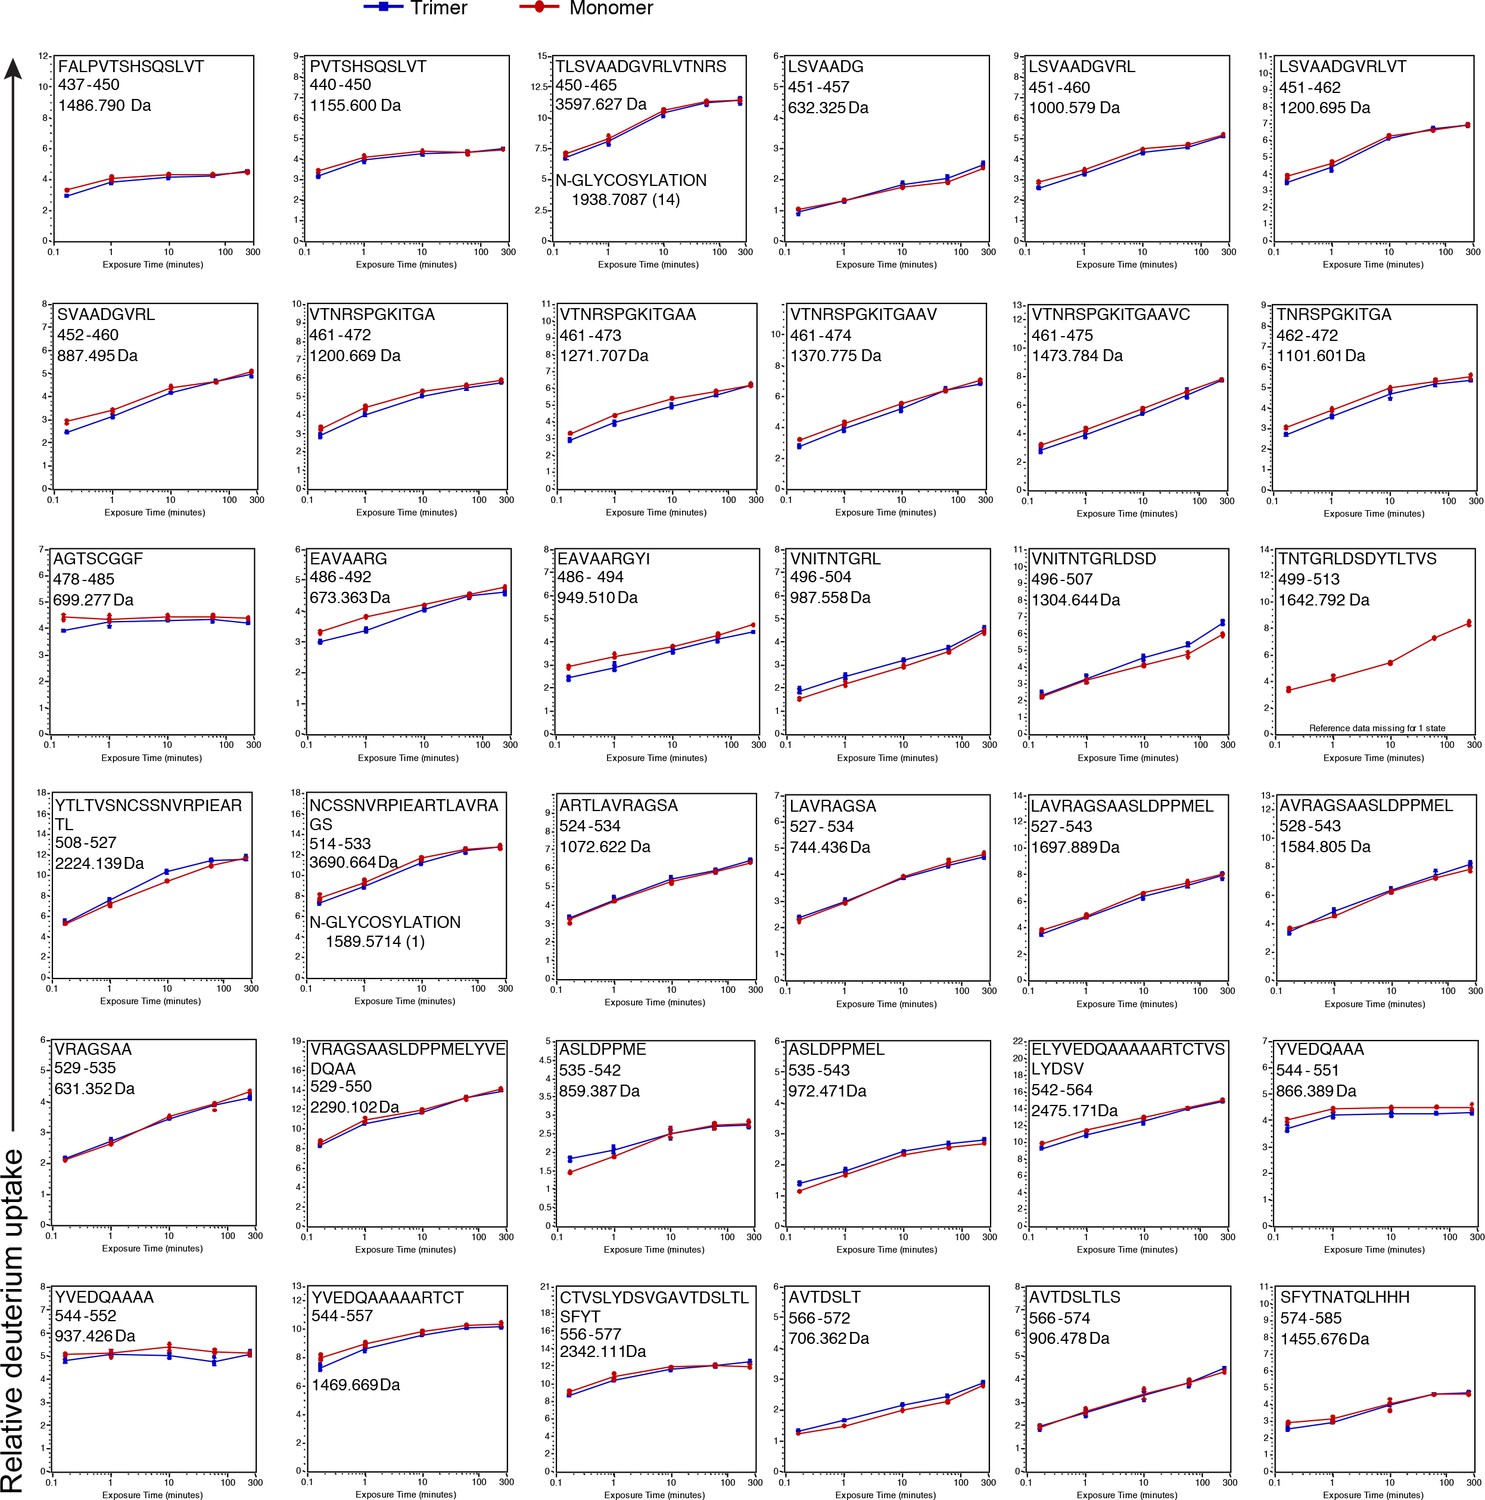
See legend for Figure 2—figure supplement 3 .
https://doi.org/10.7554/eLife.39772.008
Figure 3 with 2 supplements
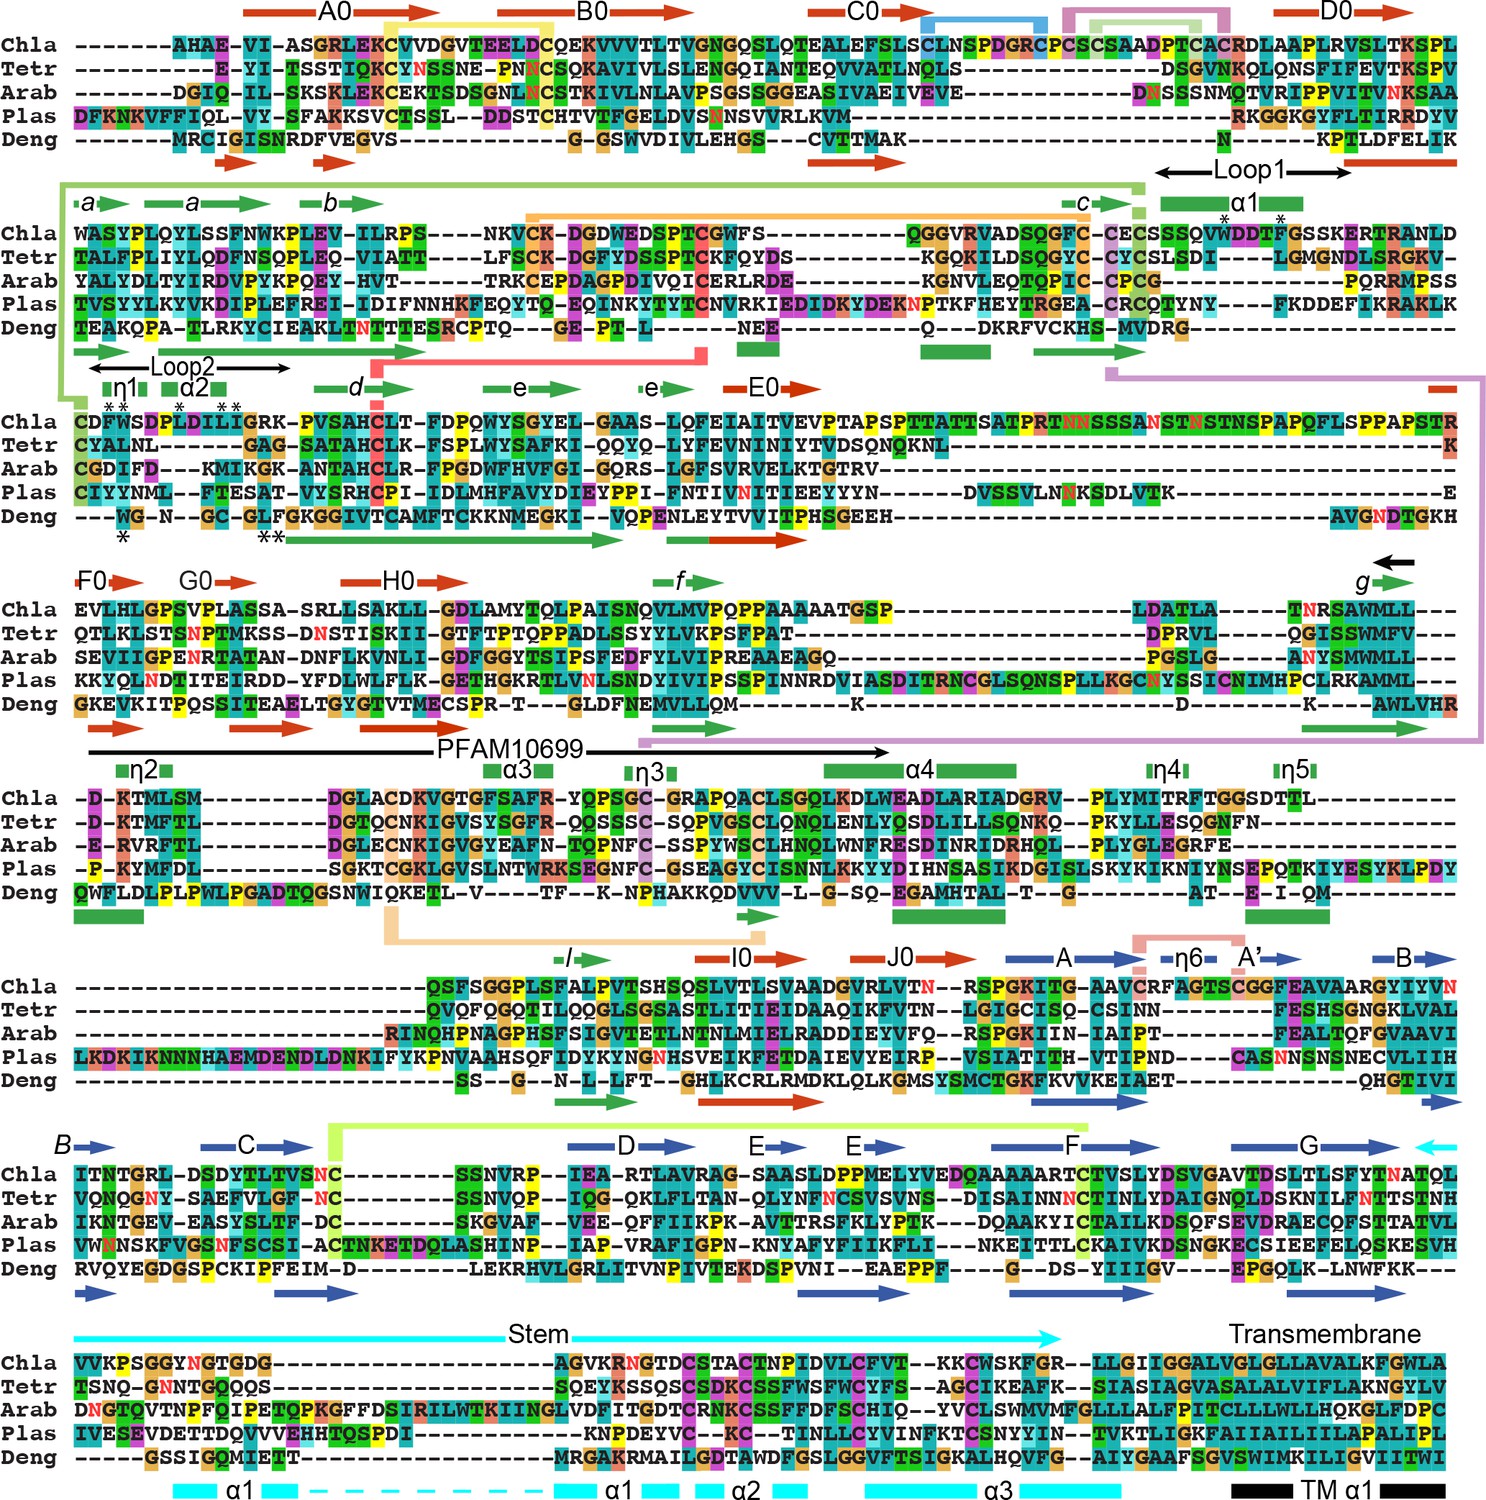
Sequence and structure-based alignments of HAP2 from diverse species and Dengue 2 class II viral fusogen.
HAP2 sequences were aligned with MAFFT (Katoh and Standley, 2013) with G-INS-I, BLOSUM30, 2.5 opening penalty, and 0.12 offset value. HAP2 and Dengue 2 fusion protein (PDB ID 1OK8) domains 1 + 2 and domain 3 were separately aligned structurally using RaptorX (Wang et al., 2013) to obtain structurally aligned sequences. The two alignments, each containing HAP2, were combined with MAFFT, and closed up manually in loop regions. Missing stem and transmembrane domains were aligned by sequence. Secondary structure elements of HAP2 and Dengue (Zhang et al., 2013; Modis et al., 2004) color coded by domain are shown above and below the alignment, respectively. Predicted glycosylated Asn residues are shown in red. Chla, Chlamydomas reinhardtii; Tetra, Tetrahymena thermophila; Arab, Arabidopsis thaliana; Plas, Plasmodium berghei; Deng, Dengue 2.
Figure 3—figure supplement 1
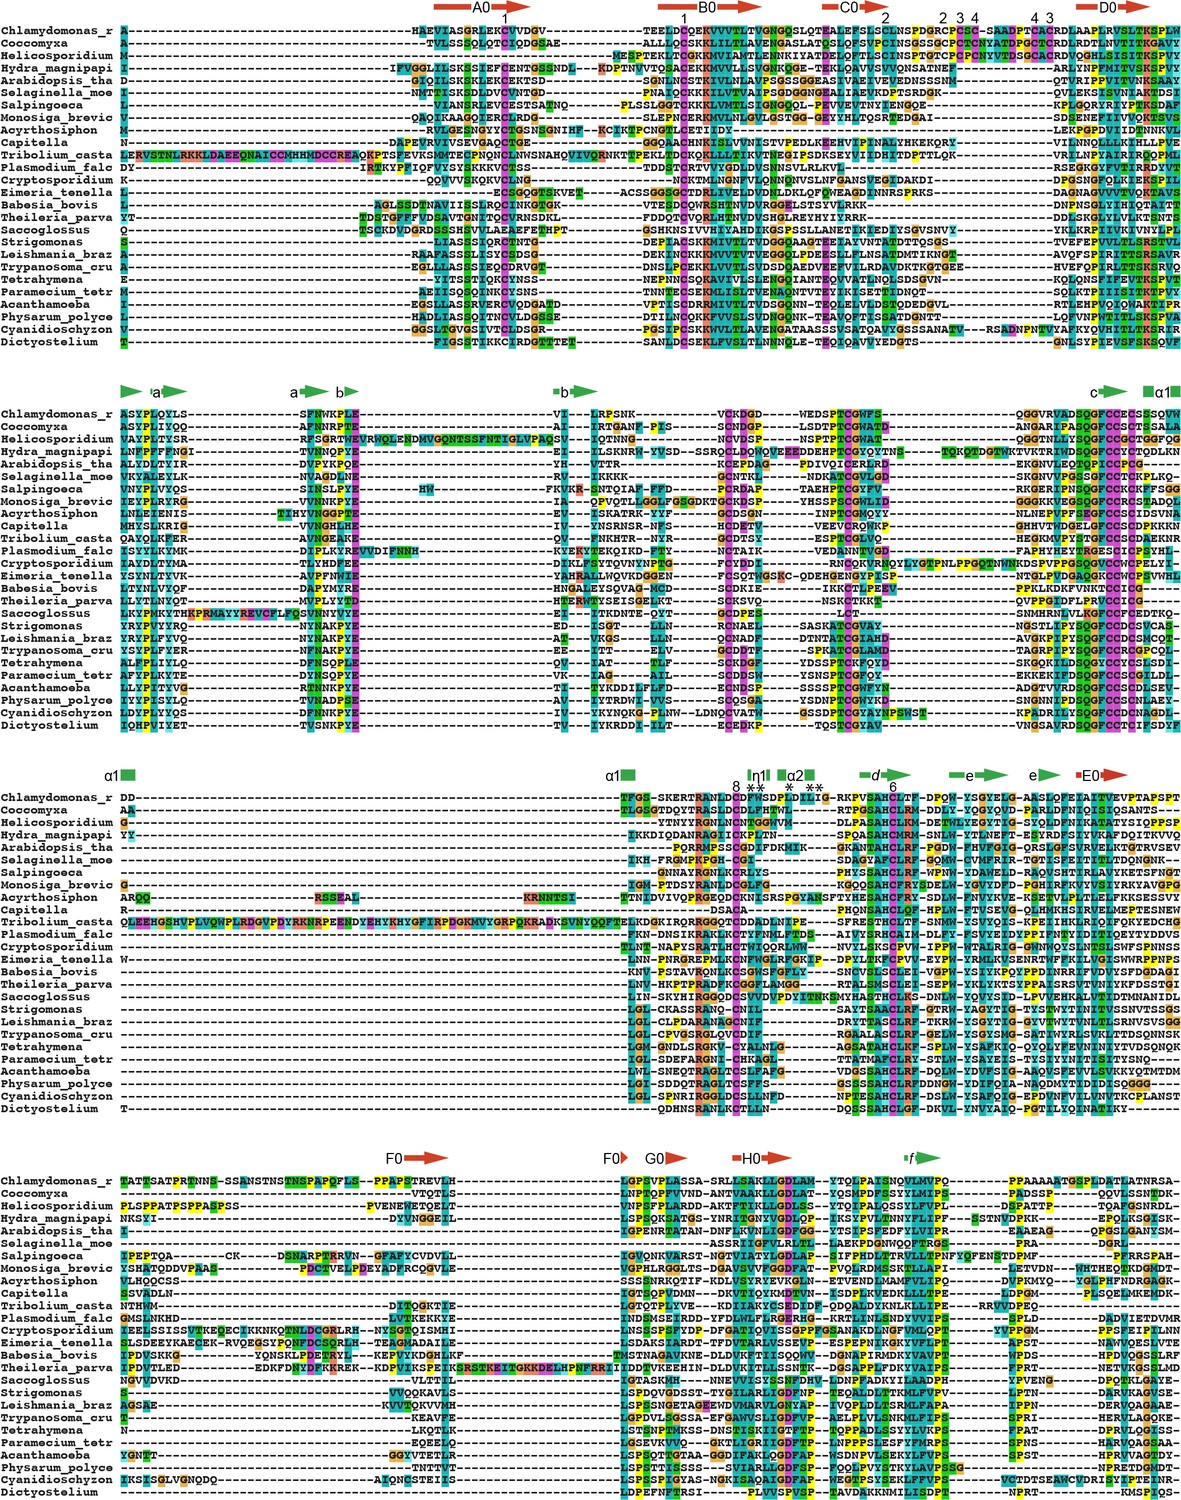
HAP2 sequences from representatives of different phylogenetic groups, selected for short length, and aligned with MAFFT as described in Main Text Fig. 3.
Figure 3 legend. Only the mature sequence omitting the cytoplasmic domain is shown.
Figure 3—figure supplement 2
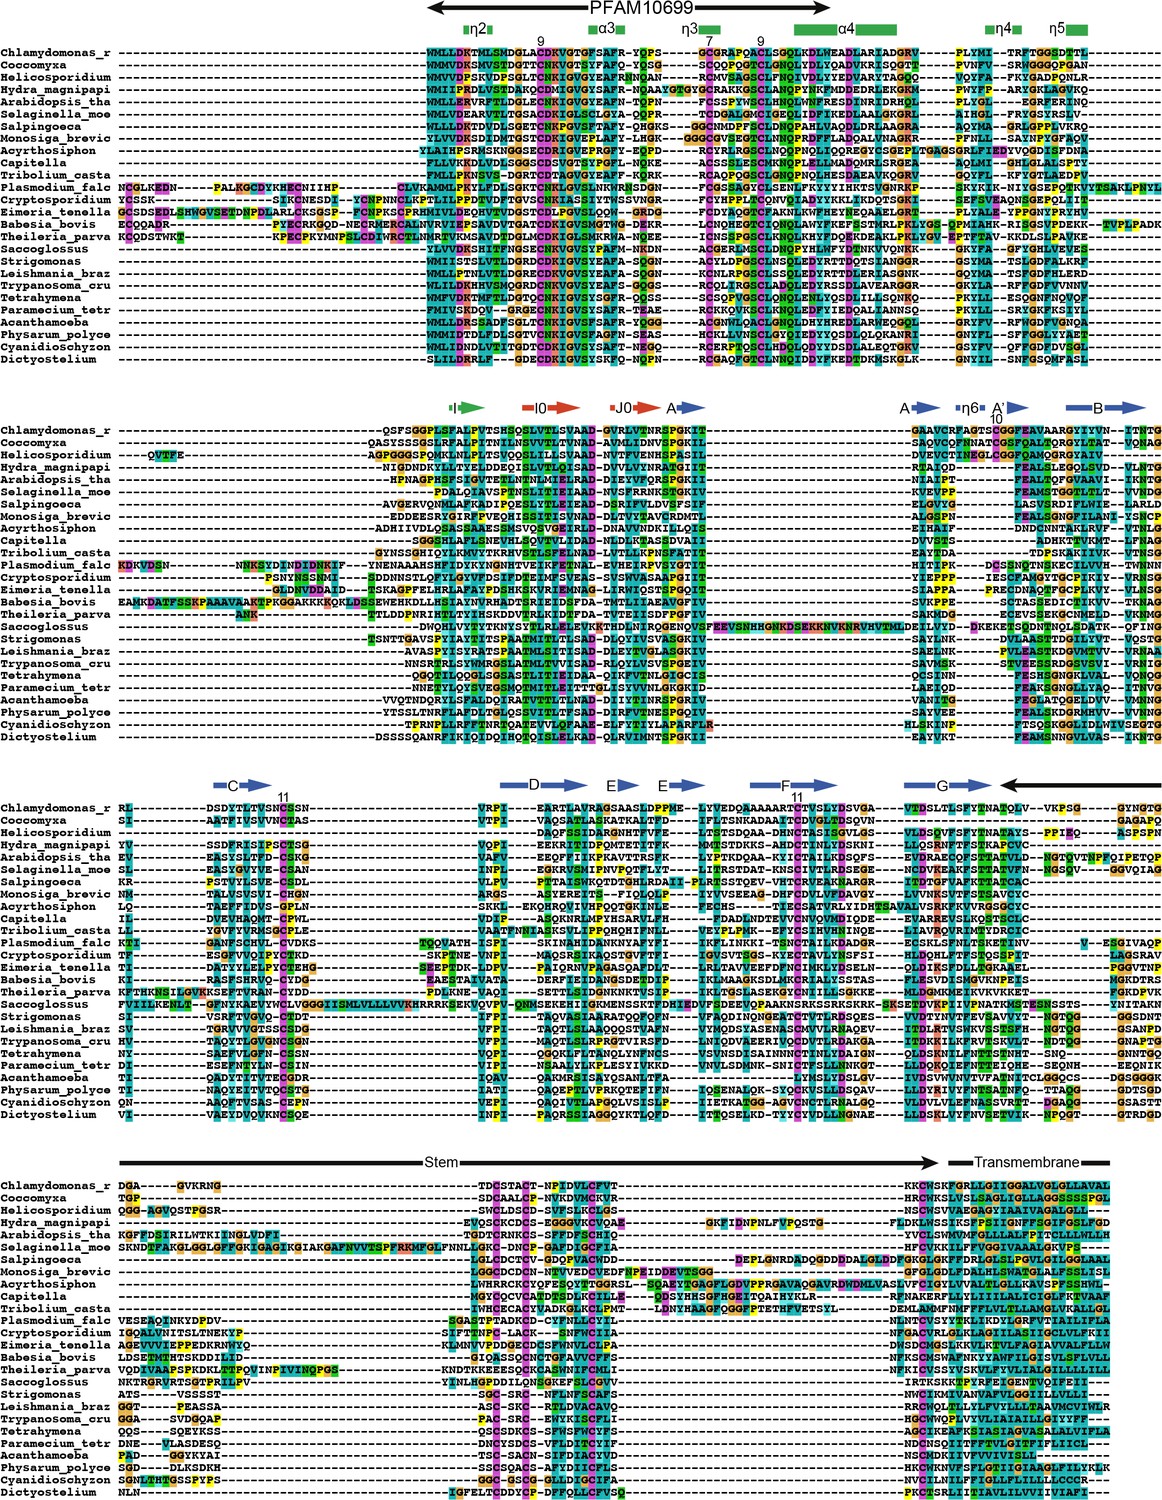
See legend for Figure 3—figure supplement 1.
https://doi.org/10.7554/eLife.39772.011
Figure 4
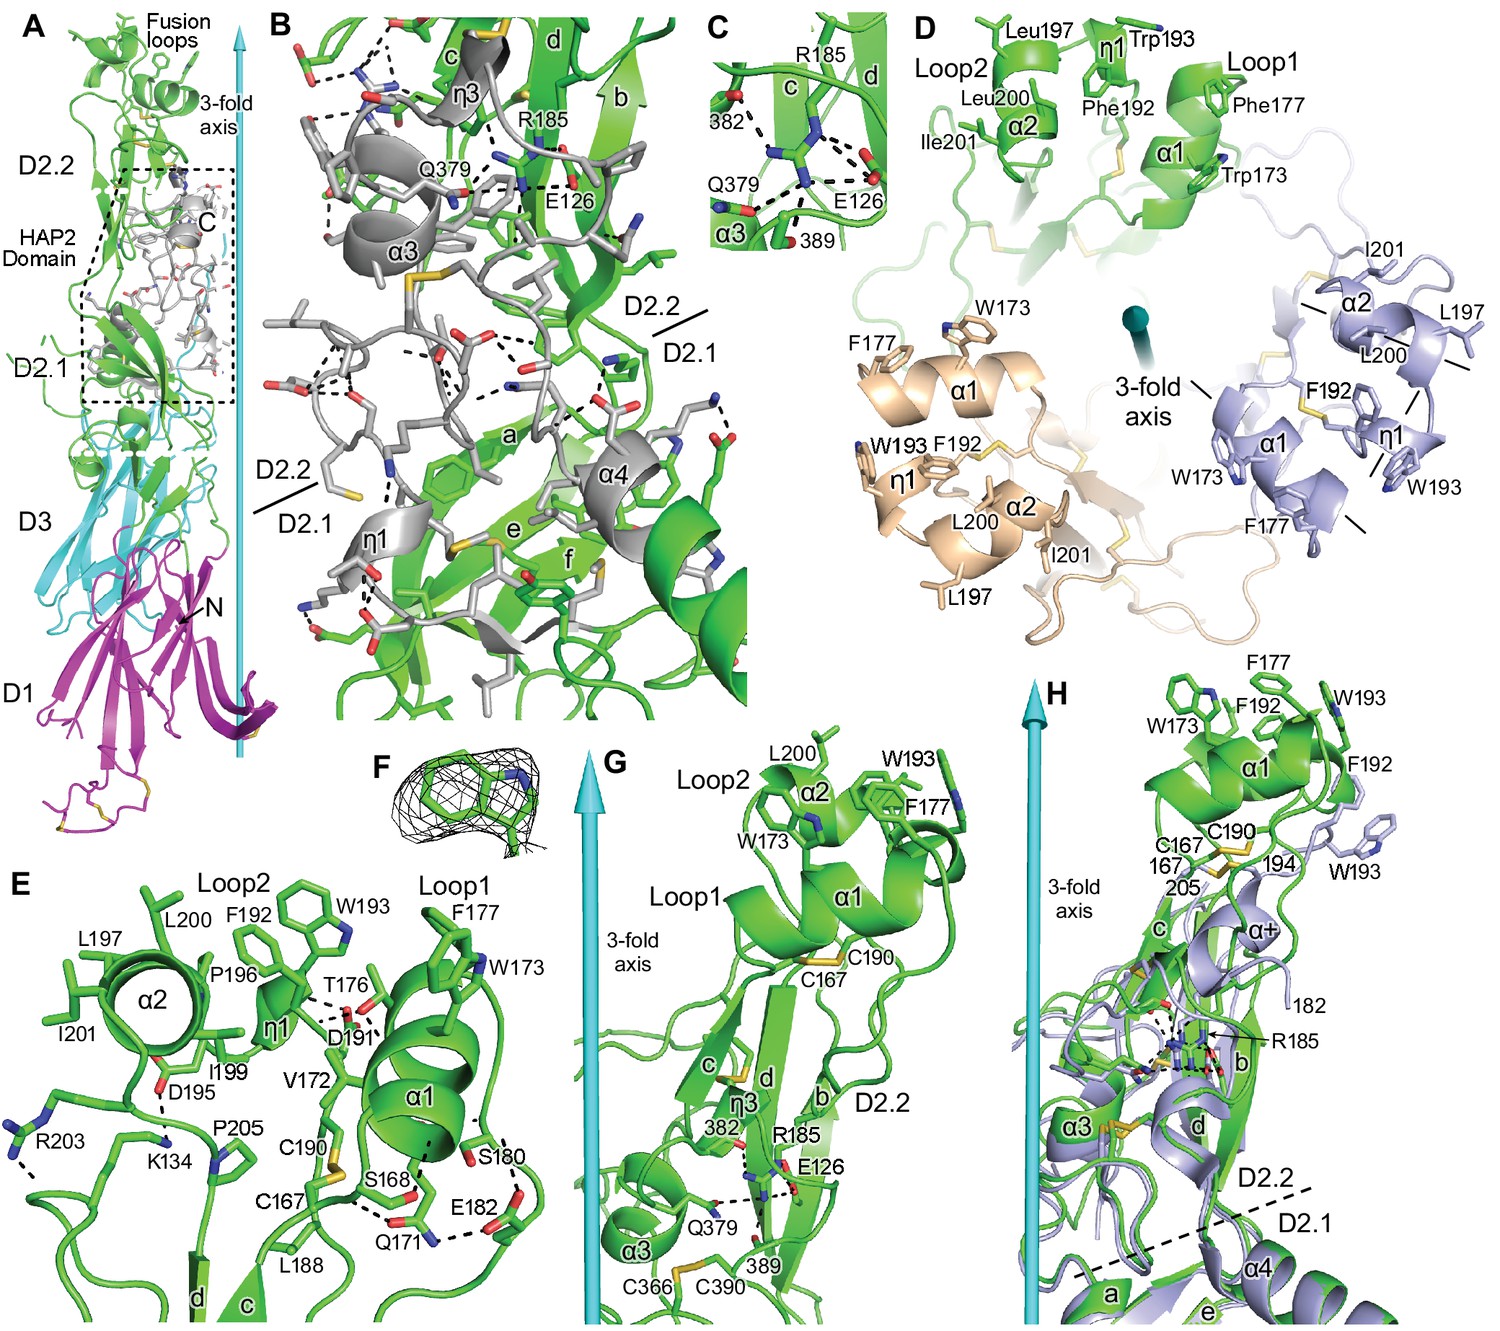
Domain D2.2.
HAP2 is in ribbon cartoon with selected sidechains and disulfides shown in stick, with nitrogens blue, oxygens red, and sulfurs gold. Cyan cones and cylinders show the trimer 3-fold axis. Hydrogen bonds are shown as dashed lines. (A) One monomer, with the HAP2 domain (PFAM 10699) shown in silver with dashed outline. (B) Detail of PFAM 10699 (silver) in an orientation rotated about 180° from that in (A) All sidechains in PFAM 10699 and their hydrogen bonds, including sidechain-backbone hydrogen bonds, are shown; however, backbone atoms participating in these hydrogen bonds are omitted. Only the most conserved residues in PFAM 10699, and selected interacting residues, are labeled. (C) Detail of Arg185 in its carbonyl cage. (D) Apical view of the fusion loops. Loops are labeled and 3-letter amino acid codes are used in the upper monomer and 1-letter codes are used in lower monomers. Helix axes in the right-most monomer are dashed. (E) Details of residues that support the structure of loops 1 and 2. (F) Simulated annealing composite omit density (mesh) contoured at 1σ around W193. (G) Detail of D2.2 showing Arg185 in its carbonyl cage, including the sidechains of E126 and Q379 and backbone carbonyl groups of residues 382 and 389. (H) Orientations of D2.2 of the 3.3 Å (light blue) and 2.6 Å (green) HAP2 structures after superposition on D1, D2.1, and D3 in the trimer.
Figure 5
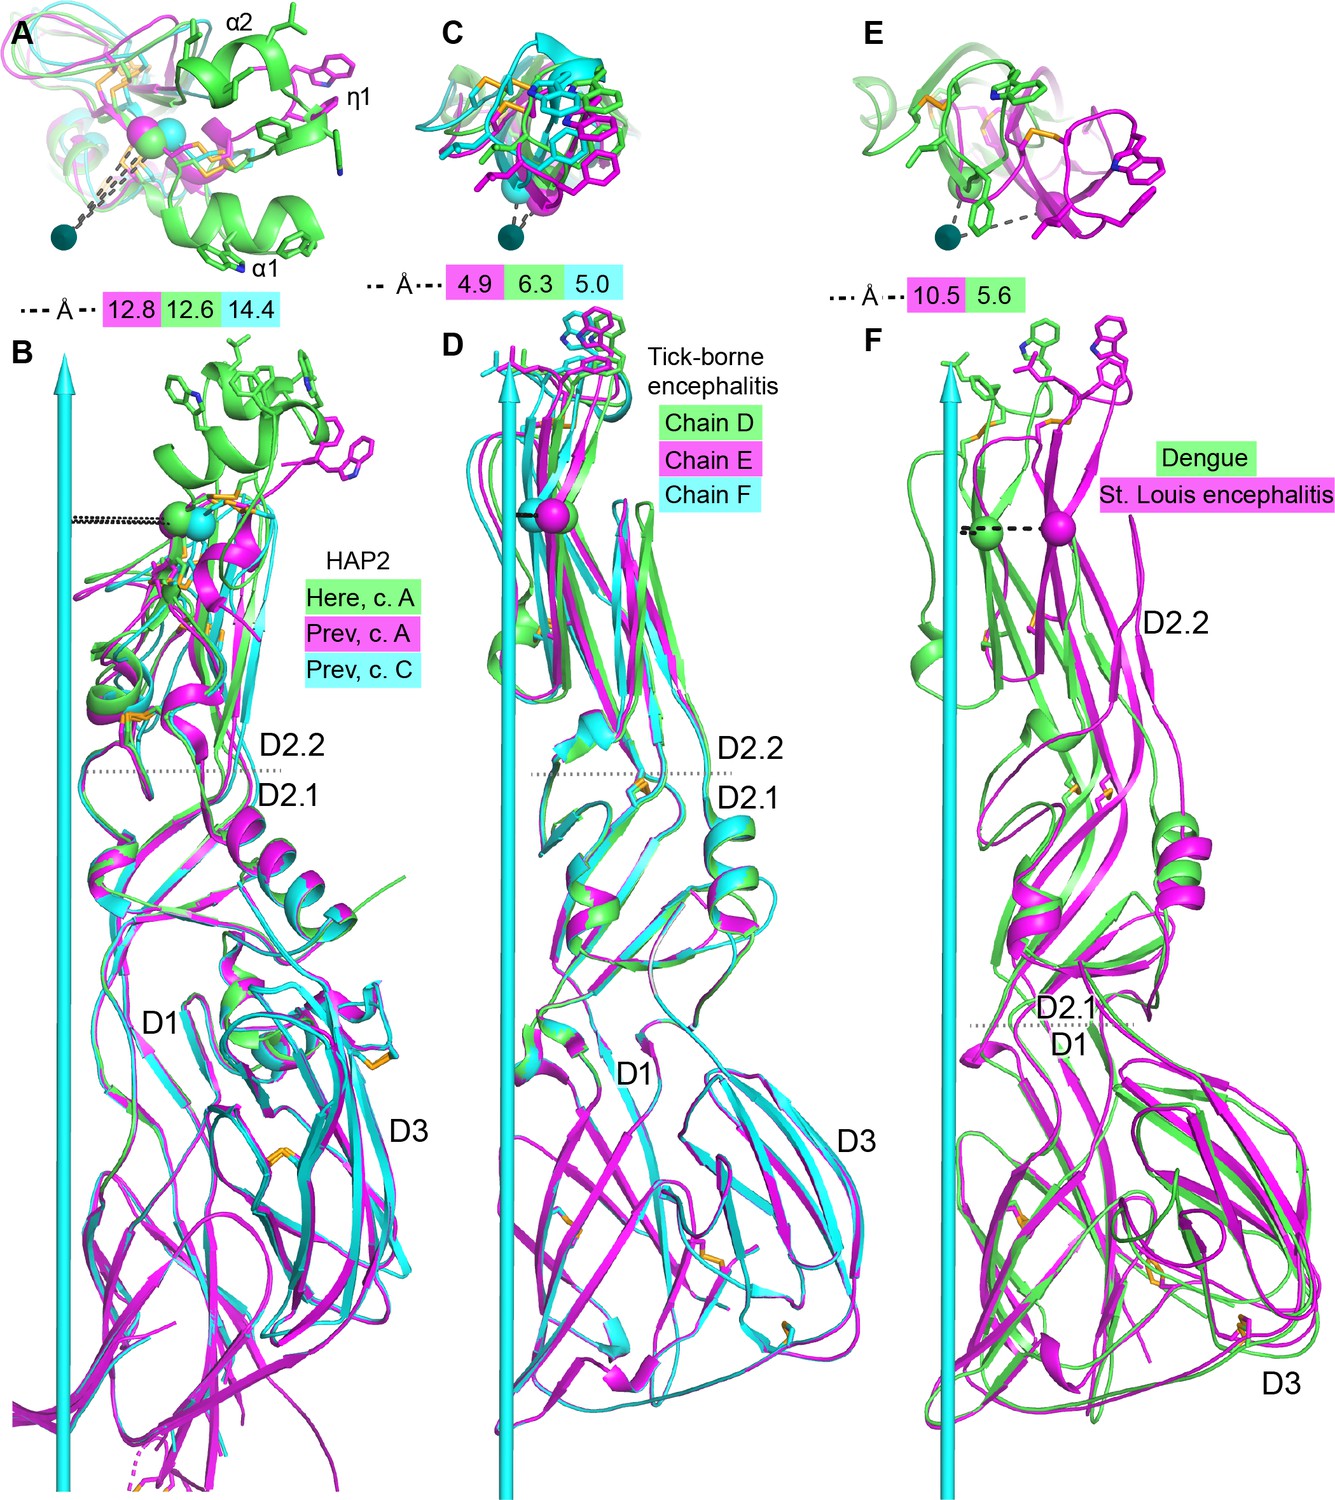
Comparisons of tilting.
(A, B) HAP2 from the current structure (green) and chains A (magenta) and C (cyan) from the previous structure (Fédry et al., 2017). (C, D) Tick-borne encephalitis fusogen chains D, E, and F. (Bressanelli et al., 2004). (E, F). Dengue 1 (Nayak et al., 2009) (green) and St. Louis encephalitis (Luca et al., 2013) (magenta) fusogens. Distances from a conserved D2.2 framework Cα atom (residue 166 in HAP2 and 96 in the flaviviruses) to the 3-fold axis are dashed and shown in the key. Dotted lines mark boundaries at which tilting occurs. Views are straight down the 3-fold axis shown as a cyan arrow (A, C, E) or normal to the axis (B, D, F). Structures are shown in ribbon cartoon with disulfide bonds and key fusion loop sidechains in stick. Monomers are superimposed on D1.
Figure 7
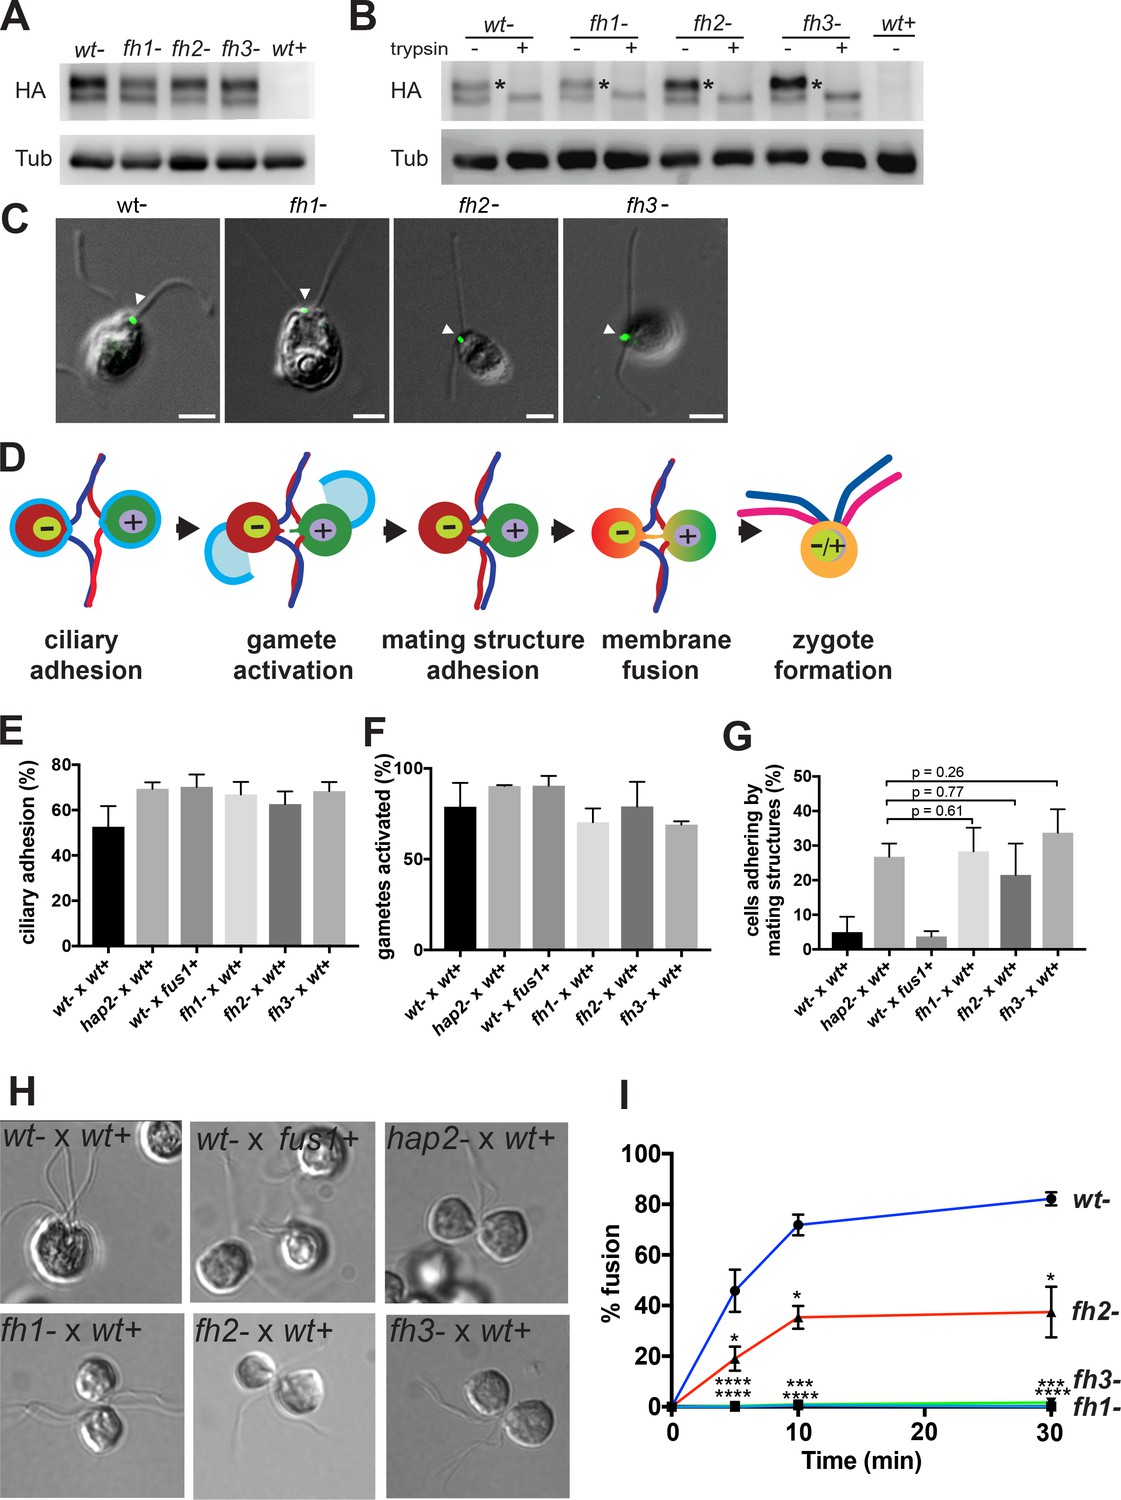
Mutations in three distinct HAP2 fusion loop helices specifically disrupt the membrane fusion step in Chlamydomonas fertilization.
(A). Protein expression and (B) trypsin-sensitivity of HA-tagged wild type HAP2 and fusion helix mutants in minus gametes detected by immunoblotting with anti-HA (upper). Plus gametes (wt+) are used as a negative control. Blotting with anti-tubulin (lower) controlled for loading. (C) Combined immunofluorescence staining with anti-HA and differential interference contrast (DIC) microscopy show the location of wild type and HAP2 fusion helix mutant proteins on the minus mating structure between the two cilia (arrow heads). (D) Schematic illustration of steps (left to right) in Chlamydomonas fertilization. (E-I) Assays with the indicated mixtures of minus and plus gametes. (E) Ciliary adhesion at 5 min after mixing as assessed by particle counting. Because over 40% of the cells in the wt- x wt+ sample fused by 5 min, and because ciliary adhesion is downregulated upon fusion, the wt- x wt+ sample exhibited slightly less ciliary adhesion than the mutants. Analysis by the Kruskal-Wallis and Dunn’s post tests showed no significant differences among the mutants. (F) Gamete activation as assessed by cell wall loss. A Kruskal-Wallis test showed no significant difference in gamete activation among samples. (G and H). Mating structure adhesion. (G) Quantification. Dunn’s post test showed no significant difference in mating structure adhesion between hap2 and fh1, fh2, and fh3 gametes mixed with wt+ samples. Negative controls were wt- x wt+ gametes, which fuse too quickly to detect mating structure adhesion; and fus1 mutants, which lack the plus gamete adhesion protein and so are incapable of mating structure adhesion. (H) Representative DIC images showing that wt- x wt+ gametes form zygotes; wt- x fus1+ fail to form pairs; and hap2-, fh1-, fh2, and fh3- all form pairs with wt+. (I). Effect of mutating the fusion helices’ hydrophobic residues on fusion as measured by the formation of quadri-ciliated zygotes. In (E–G) and (I), values shown are averages from at least two biological samples with three different replicates each; results are shown as mean ± SD of all replicates. In (I), levels of pairwise significance (Dunn’s post test) between the wt- control and fh1-, fh2-, and fh3- samples at 5, 10 and 30 min after mixing gametes are p<0.05, *; p<0.001,***; p<0.0001, ****.
Figure 6
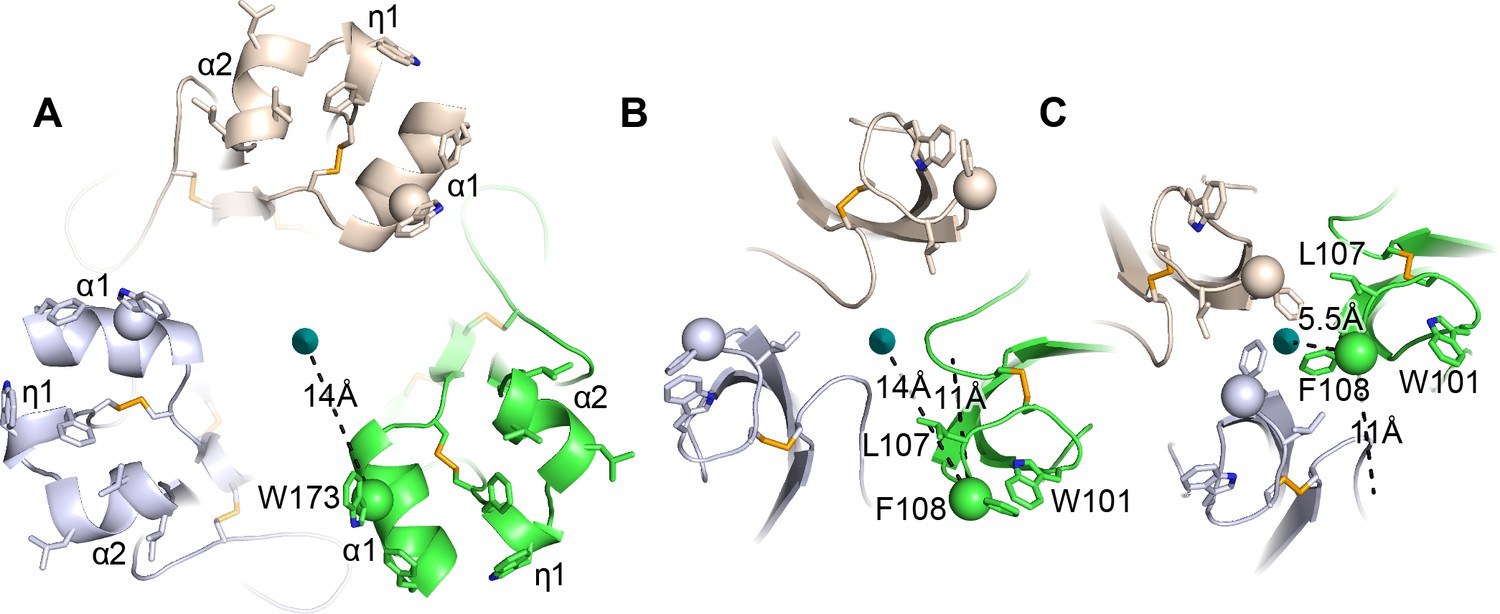
HAP2 fusion loops and comparison to iris-like movements of flavivirus fusion loops.
(A) Current HAP2 structure. B and C. Flavivirus fusogens from St. Louis encephalitis (B) and Dengue 1 (C) viruses. Trimers were superimposed on a common 3-fold axis using D1 and equivalent monomers are colored identically. Dashes show distances in one monomer from Cβ atoms of the indicated fusion loop residues to the 3-fold axis and also, in (B and C), distances between Cβ atoms in the two flaviviral fusogen structures. From (B to C), tilting at the D1—D2.1 junction shown in Figure 5 results in iris-like movement of the fusion loops in a counterclockwise and axis-proximal direction.
Tables
Key resources table
| Reagent type (species) or resource | Designation | Source or reference | Identifiers | Additional information |
|---|---|---|---|---|
| Gene (Chlamydomonas reinhardtii) | HAP2 | NA | JGI:Cre16. g674852.t1.1; NCBI:EF397563 ;Uniprot ID: A4GRC6 | |
| Gene (Chlamydomonas reinhardtii) | FUS1 | NA | JGI:Cre06. g252750.t1.1; NCBI:U49864 | |
| Genetic reagent (Chlamydomonas reinhardtii, mt+) | wt+ (also called 21gr) | Chlamydomonas Resource Center PMID: 17247567 | CRC:CC-1690 | Dr. Ruth Sager (The Sidney Farber Cancer Institute, Boston, MA, December 1983). |
| Genetic reagent (C. reinhardtii, mt+) | fus1+; (also called fus1-1) | Chlamydomonas Resource Center PMID: 8856667 | CRC:CC-2062 | Dr. Ursula Goodenough (Washington University, St. Louis, MO, December 1986). |
| Genetic reagent (C. reinhardtii, mt-) | hap2- (also called 40D4) | Chlamydomonas Resource Center PMID: 25655701 | CRC:CC-5281 | Dr. Yanjie Liu (UT Southwestern Medical Center, Dallas, TX, May 2016); Dr. William Snell; NIT plasmid (pMN56) transformed into progenitor strain B215 |
| Genetic reagent (C. reinhardtii, mt-) | wt- | this paper | The HAP2-HA plasmid (pYJ76) was modified by removal of two internal residues used for the plasmid's generation to form a new plasmid pyJJ1. This was transformed into hap2- | |
| Genetic reagent (C. reinhardtii, mt-) | fh1- | this paper | A W173A and F177A modified HAP2 plasmid (pYJJ2) was transformed into hap2- | |
| Genetic reagent (C. reinhardtii, mt-) | fh2- | this paper | F192A and W193A modified HAP2 plasmid (pYJJ3) was transformed into hap2- | |
| Genetic reagent (C. reinhardtii, mt-) | fh3- | this paper | L197A, L200A, and I201A modified HAP2-HA plasmid (pYJJ4) was transformed into hap2- | |
| Strain, strain background (Escherichia coli) | DH5α | thermo fisher scientific | Catalog NO: 18265017 | |
| Genetic reagent (Escherichia coli) | QIAquick Gel Extraction Kit | Qiagen | Catalog NO:28704 | https://www.qiagen.com/ |
| Genetic reagent (Escherichia coli) | QIAGEN Plasmid Mini Kit | Qiagen | Catalog NO:12123 | https://www.qiagen.com/ |
| Genetic reagent (Drosophila) | EXpreS2 transfection reagent | ExpreS2ion Biotechnologies | Catalog NO: 95-055-075 | https://expressionsystems.com/product/expres2-tr-transfection-reagent/ |
| Recombinant DNA reagent (plasmid) | pYJ76 | PMID: 25655701 | original HAP2-HA plasmid for transformation of Chlamydomonas | |
| Cell line (Drosophila) | Drosophila melanogaster Schneider S2 | ExpreS2 cells | ExpreS2ion Biotechnologies | |
| Transfected construct (Drosophila) | ET15S2 vector | This paper | ExpreS2ion Biotechnologies | Modified with the pExpreS2-2 vector;Includes N-terminal secretion signal from Hspa5 and C-terminal His8 tag |
| Biological sample () | N/A | |||
| Antibody | HA antibody (Rat monoclonal) | Sigma | clone 3F10 | WB(1/1000); IF(1/100) |
| Antibody | Alexa Fluor 488- goat anti-rat secondary | Invitrogen | (1/400) | |
| Antibody | Goat Anti-Rat IgG Peroxidase | Millipore | (1/5000) | |
| Commercial assay or kit | Poroszyme Immobilized Pepsin Cartridge,2.1 mm x 30 mm | Applied Biosystems | Catalog NO:2313100 | HAP2 digestion for HDX experiment |
| Chemical compound, drug | Polyethylene glycol 3350 | Hampton research | Catalog NO: HR2-527 | For HAP2 crystallization |
| Chemical compound, drug | n-Dodecyl-β-D-maltoside(DDM) | Sigma-Aldrich | Catalog NO: D4641-5G | For HAP2 trimerization |
| Chemical compound, drug | Ammonium acetate | Hampton research | Catalog NO: HR2-565 | For HAP2 crystallization |
| Software, algorithm | Prism 7 | https://www.graphpad.com/scientific-software/prism/ | GraphPad software used for statistical analyses | |
| Software, algorithm | XDS | https://strucbio.biologie.uni-konstanz.de/xdswiki/index.php/Xds | Diffraction data was processed with XDS | |
| Software, algorithm | Phenix | https://www.phenix-online.org/ | The structure was solved by molecular replacement with Phaser in the Phenix suite | |
| Software, algorithm | CCP4 | http://www.ccp4.ac.uk/ | Refinement | |
| Software, algorithm | ASTRA 6 | https://www.wyatt.com/products/software/astra.html | SEC-MALS data were processed in ASTRA six using the protein conjugate model | |
| Software, algorithm | DynamX 3.0 | Waters Corp. | http://www.waters.com/waters | HDX |
| Software, algorithm | PLGS 3.0 | Waters Corp. | http://www.waters.com/waters | HDX |
Additional files
-
Supplementary file 1
Crystal data collection and refinement statistics.
(a) The numbers in parentheses refer to the highest resolution shell. (b) Rmerge = Σh Σi |Ii(h) - < I(h)> | / ΣhΣi Ii(h), where Ii(h) and <I(h)>are the ith and mean measurement of the intensity of reflection h. (c) Pearson’s correlation coefficient between average intensities of random half-datasets for unique reflection (Karplus and Diederichs, 2012). (d) Rfactor = Σh||Fobs (h)|-|Fcalc (h)|| / Σh|Fobs (h)|, where Fobs (h) and F calc (h) are the observed and calculated structure factors, respectively. No I/σ(I) cutoff was applied. e Calculated with MolProbity (Davis et al., 2007).
- https://doi.org/10.7554/eLife.39772.016
-
Transparent reporting form
- https://doi.org/10.7554/eLife.39772.017
Download links
A two-part list of links to download the article, or parts of the article, in various formats.
Downloads (link to download the article as PDF)
Open citations (links to open the citations from this article in various online reference manager services)
Cite this article (links to download the citations from this article in formats compatible with various reference manager tools)
Fusion surface structure, function, and dynamics of gamete fusogen HAP2
eLife 7:e39772.
https://doi.org/10.7554/eLife.39772


