Single nucleus sequencing reveals evidence of inter-nucleus recombination in arbuscular mycorrhizal fungi
- Eric CH Chen

- Stephanie Mathieu
- Anne Hoffrichter
- Kinga Sedzielewska-Toro
- Max Peart
- Adrian Pelin
- Steve Ndikumana
- Jeanne Ropars
- Steven Dreissig
- Jorg Fuchs
- Andreas Brachmann
- Nicolas Corradi
- University of Ottawa, Canada
- Ludwig Maximilian University of Munich, Germany
- Leibniz Institute of Plant Genetics and Crop Plant Research, Germany
Figures
Figure 1
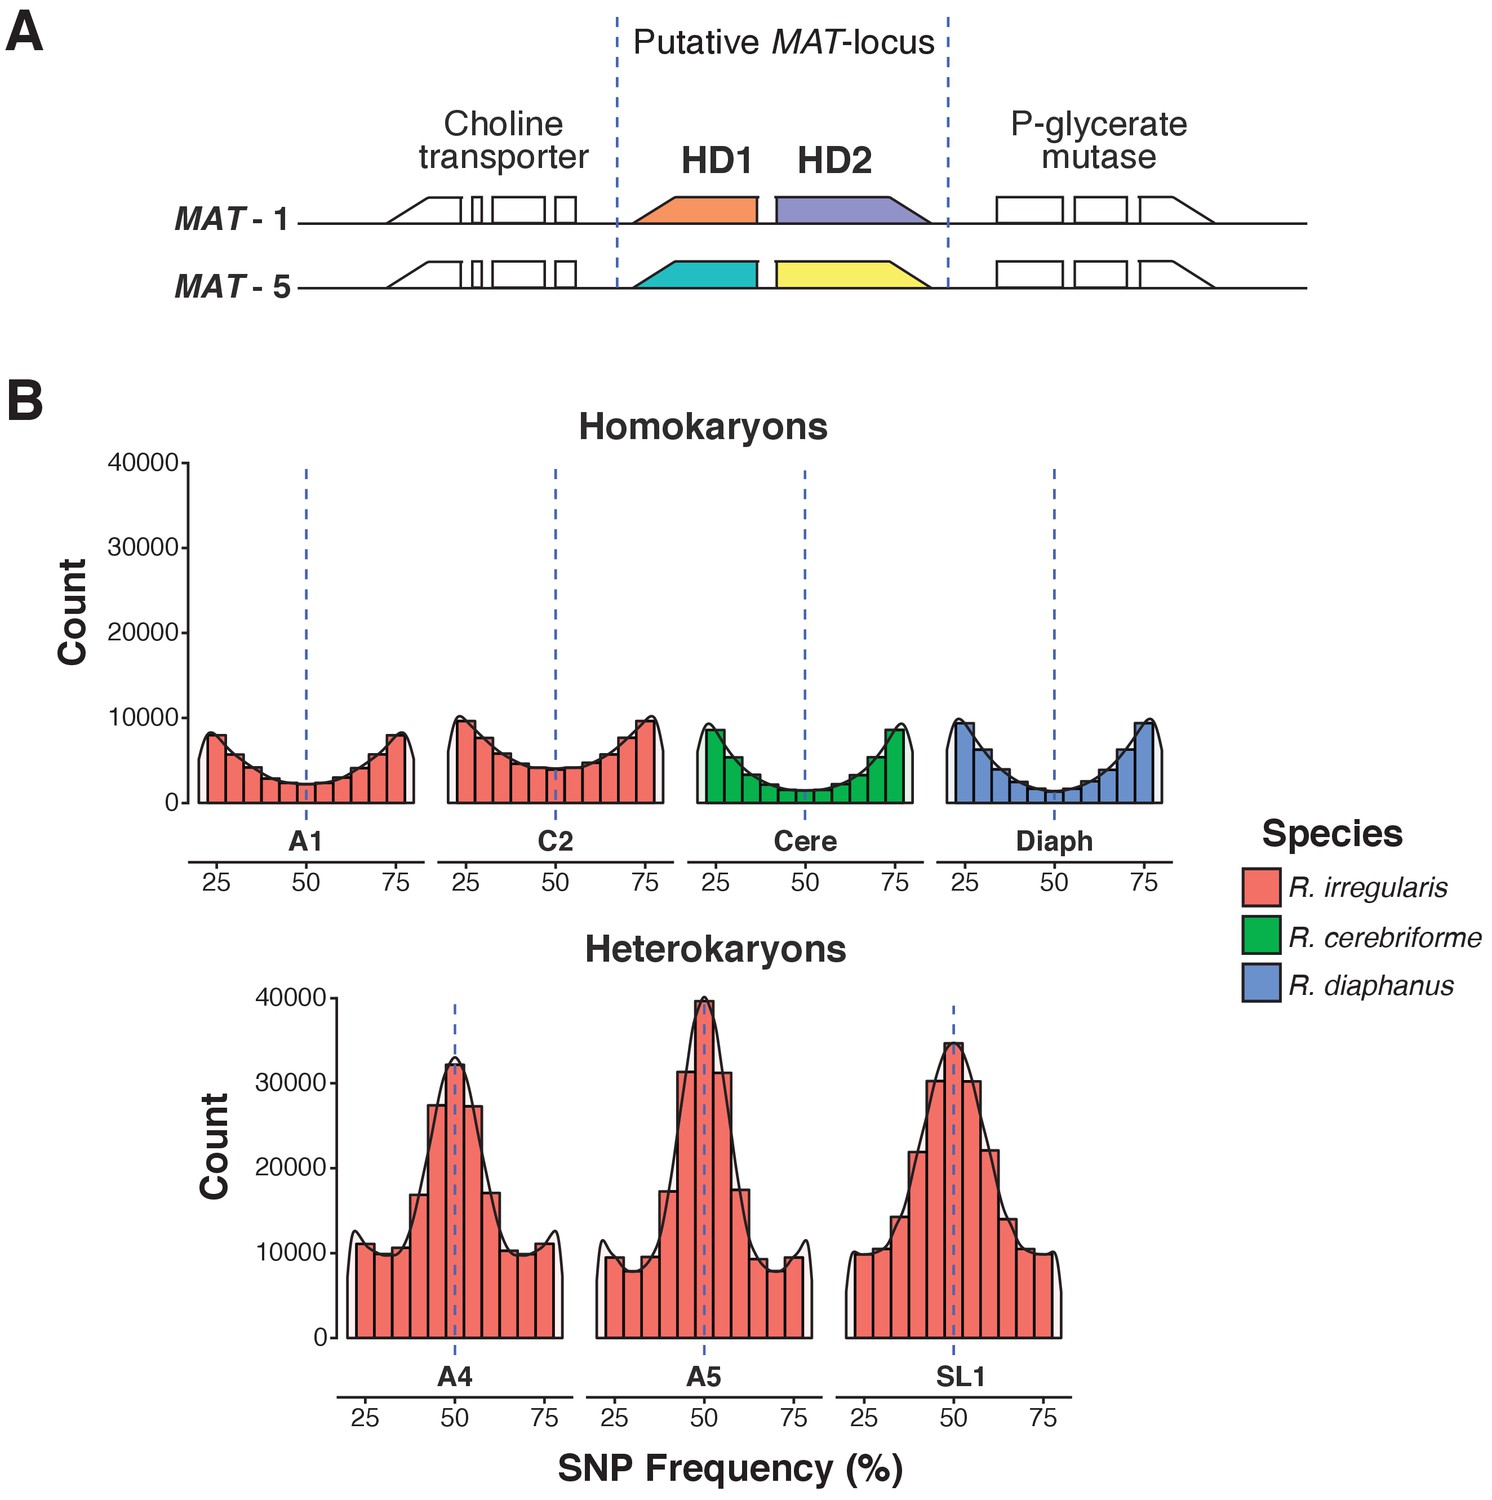
A.Predicted MAT-locus of R. irregularis dikaryon isolate SL1.
(B) Genome-wide allele frequency of homokaryons and dikaryons. R. irregularis SL1 shows the hallmark 50:50 ratio reference to alternate allele frequency of dikaryotic isolates. The R. irregularis plots for A1, A4, A5 and C2 represent new analyses of publicly available genome sequence data obtained by (Ropars et al., 2016). The homokaryotic isolates R. irregularis A1 and C2, and R. cerebriforme and R. diaphanus are also shown as comparison. Blue dashed line highlights the 0.5 allele frequency.
Figure 2
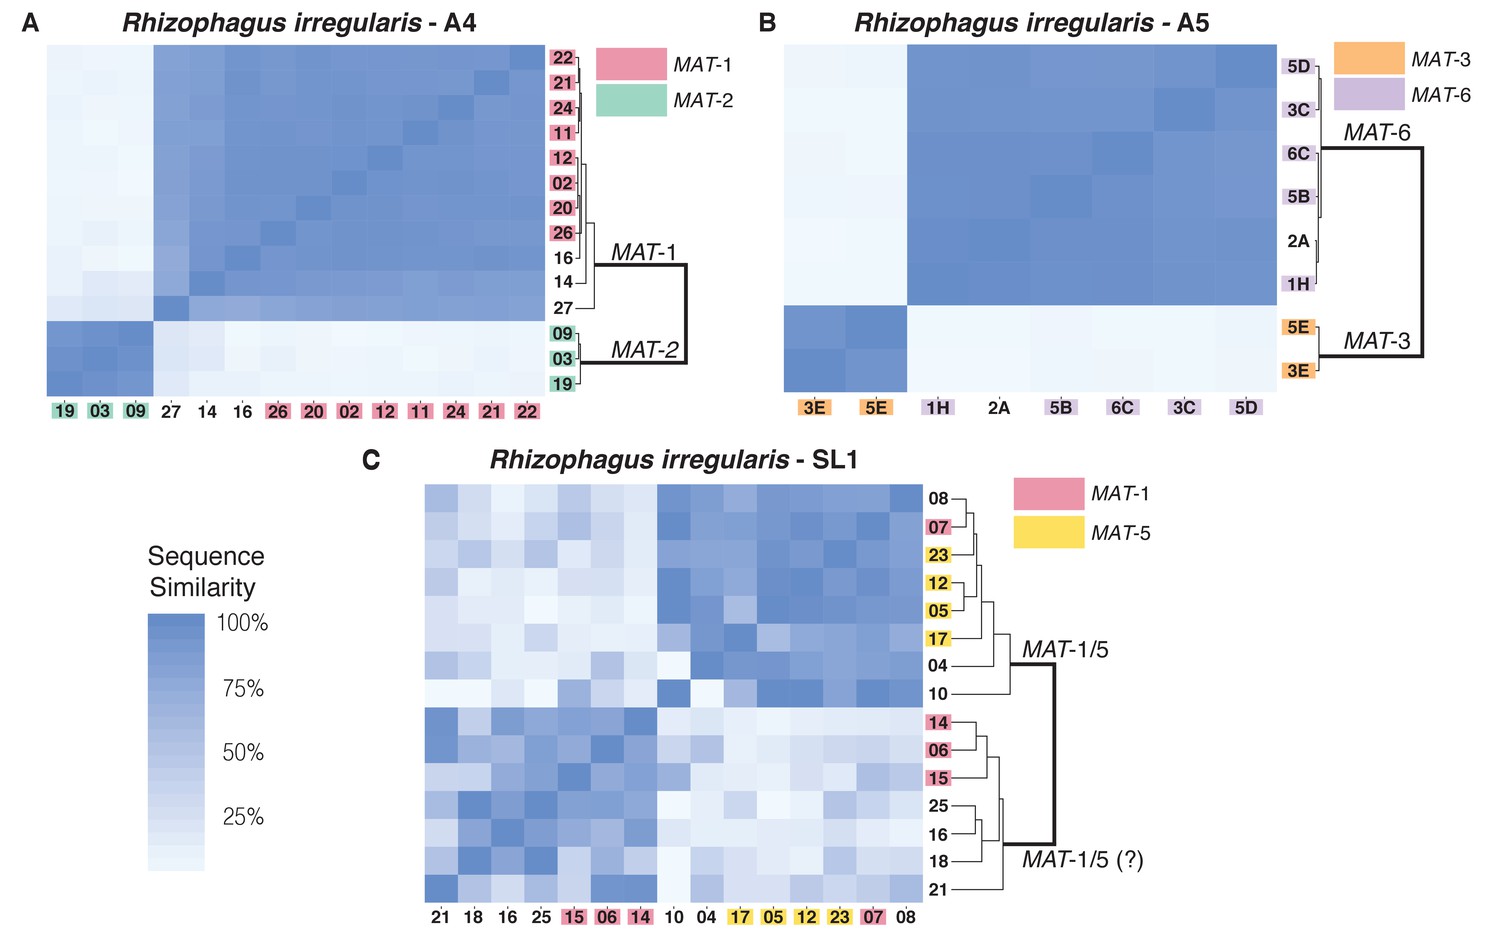
Similarity matrix of nuclei isolated from AMF dikaryons.
The heat map reflects the level of similarity sequence between nuclei based on the SNPs detected along single copy regions. The number ID of the nuclei with a MAT-locus and genotype verified using PCR and Sanger sequencing are shown in coloured boxes. In A4 and A5, clustering of single nuclei correlates well with the MAT-locus identity of each nucleus (A, B). In R. irregularis SL1, this correlation is not evident, as reflected by the mosaic genetic pattern of single nuclei (C). R. irregularis SL1 also shows evidence of inter-nucleus recombination, as evidenced by the high sequence similarity between nuclei with opposite mating-type, for example nucleus 7 (C). Variable regions that could not be assigned to either MAT-locus are left with white background.
Figure 3
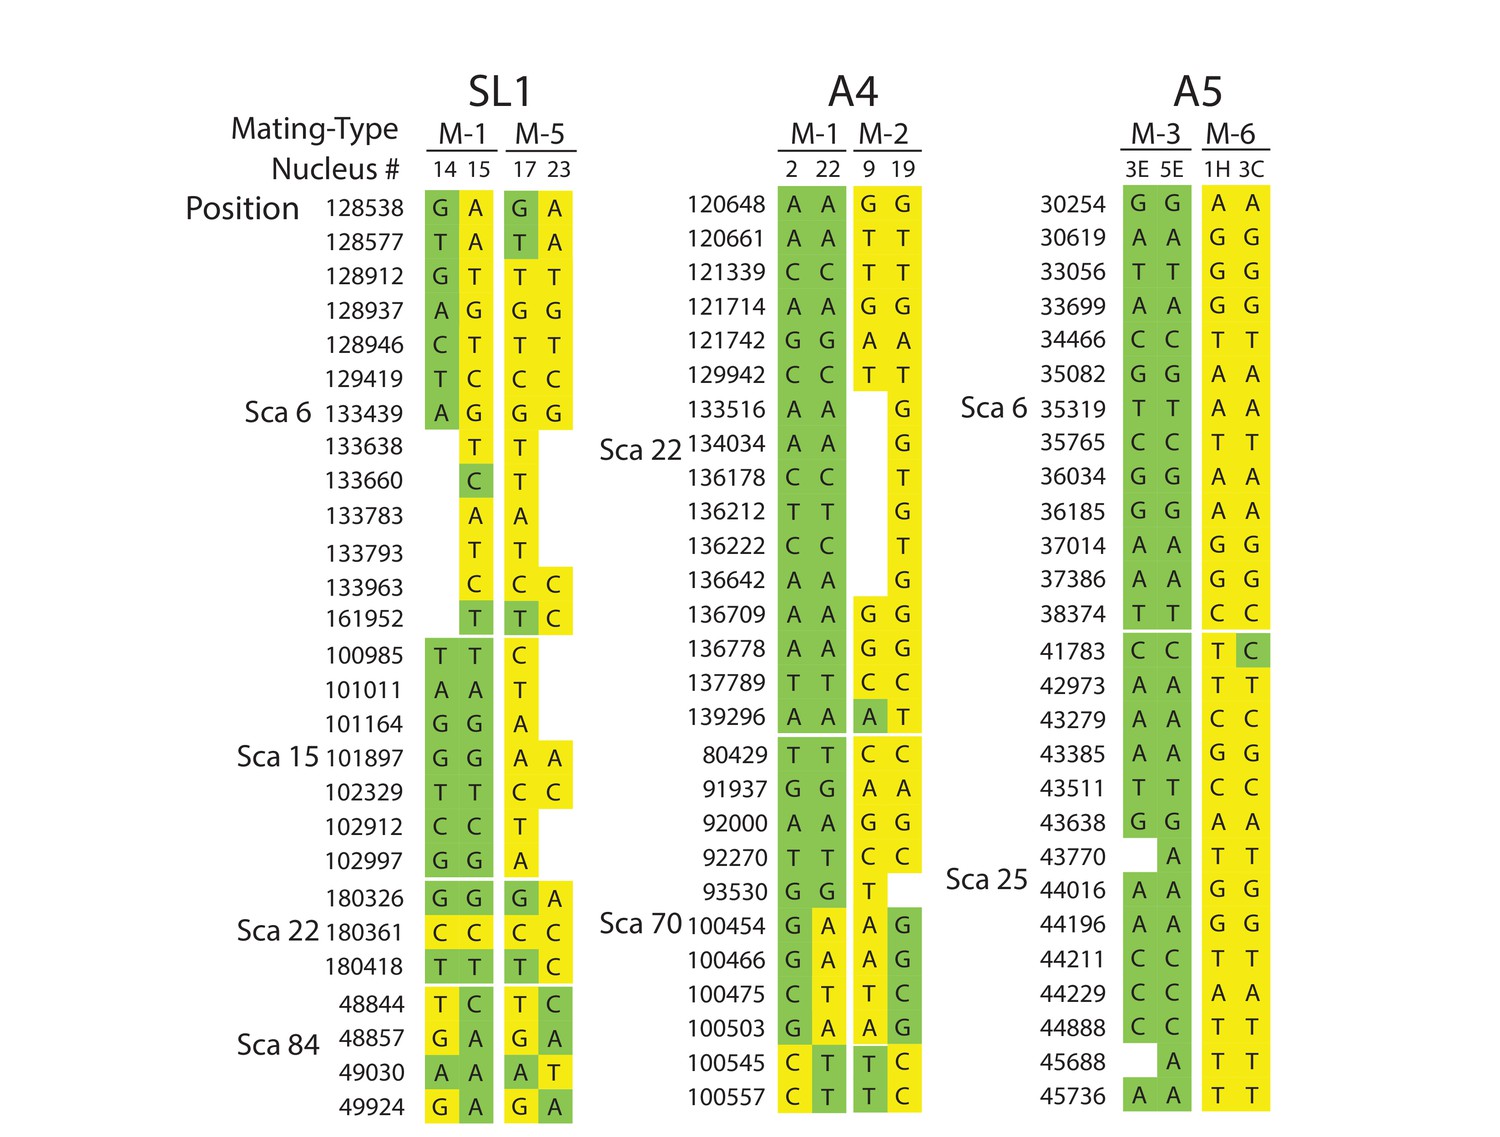
Selected examples of genotypes, recombination and inter-nuclear variability observed in the dikaryons SL1, A4 and A5.
In SL1, there is no obvious co-linearity between the MAT-locus of single nuclei and their genotype. White columns reflect the absence of Illumina sequencing along the nucleus at those homologous positions. The data shown are representative of the genotypes found along the first 100 scaffolds analysed in this study and are based on data available in Supplementary file 5. Variations along homologous nucleotide positions are highlighted in yellow or green, depending on the MAT-locus which the genotype is expected to associate with. The first and third columns represent, respectively the scaffold and position number where the SNP was scored using stringent filtering methodologies. The second column represents the genotype of the representative genome reference. M: Mating-type.
Figure 4
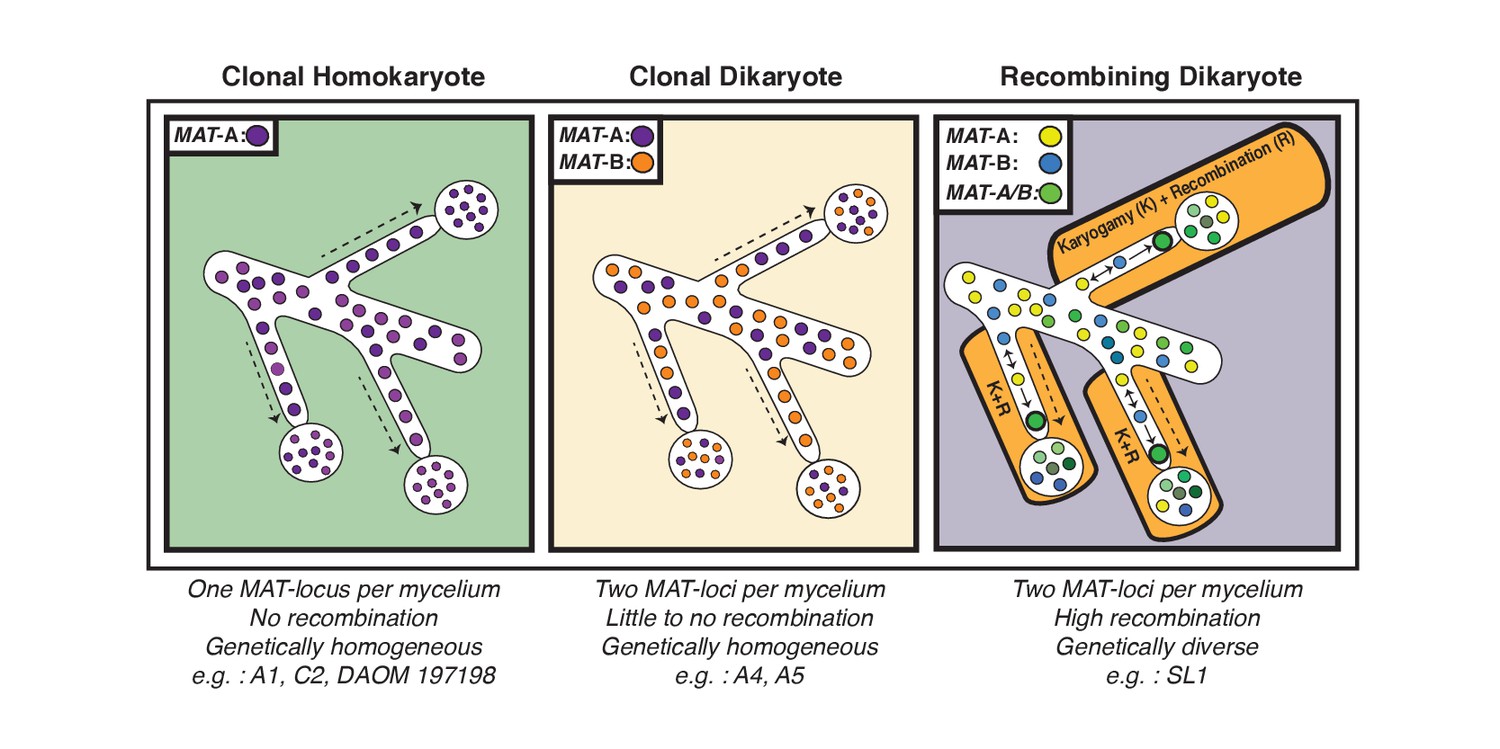
Schematic representation of the three genome organizations found to date in the model AMF Rhizophagus irregularis.
Left: Most AMF analyzed using genome analysis and PCR targeted to the MAT-locus have been found to carry nuclei with the same MAT-locus. In these isolates, genetic variability is lower than dikaryotic relatives, and recombination is undetectable. Middle: The R. irregularis isolates A4 and A5 carry nuclei with two distinct MAT-loci. Evidence of recombination is very rare, and two divergent genotypes appear to co-exist in the cytoplasm. Right: In some cases, strains can harbour nuclei with two distinct MAT-loci that undergo frequent karyogamy. The frequency of karyogamy increases nuclear diversity within the mycelium.
Tables
Table 1
Summary statistics of genomes and nuclei analyzed in this study. * Values from (Ropars et al., 2016).
https://doi.org/10.7554/eLife.39813.003| Rhizophagus irregularis | Rhizophagus cerebriforme | Rhizophagus diaphanus | |||||
|---|---|---|---|---|---|---|---|
| SL1 | A1 | A4 | A5 | C2 | |||
| A. Genome Assembly Statistics | |||||||
| Assembly Coverage | 136x | 68x | 95x | 76x | 96x | 150x | 120x |
| Number of Scaffolds | 29,279 | 11,301* | 11,380* | 14,626* | 10,857* | 15,087 | 15,496 |
| Assembly Size (Kb) | 211,501 | 125,869* | 138,327* | 131,461* | 122,873* | 171,896 | 170,781 |
| Assembly SNP/Kb | 0.50 | 0.25 | 0.74 | 0.79 | 0.35 | 0.41 | 0.23 |
| B. Single Nucleus Statistics | |||||||
| Number of Nuclei Analyzed | 16.0 | 12.0 | 14.0 | 8.0 | 9.0 | 15.0 | 12.0 |
| Average Assembly Coverage | 14.08% | 57.30% | 46.84% | 58.40% | 61.42% | 22.39% | 11.45% |
| Average Position Depth | 11.8 | 18.1 | 22.1 | 22.7 | 22.9 | 15.4 | 12.3 |
| Number of SNPs Against Reference | |||||||
| -- Total SNPs | 346,382 | 241,294 | 423,166 | 291,025 | 251,648 | 262,030 | 101,681 |
| -- Average SNPs Per Nuclei - basic filtering | 35,473 | 51,435 | 73,349 | 76,055 | 58,158 | 30,534 | 10,554 |
| -- Average Divergence with reference - basic filtering | 0.12% | 0.07% | 0.12% | 0.10% | 0.08% | 0.08% | 0.06% |
| Average - Inter-Nucleus Divergence - basic filtering | 0.38% | 0.13% | 0.24% | 0.16% | 0.14% | 0.24% | 0.21% |
Table 2
BUSCO and K-mer assembly size estimation
https://doi.org/10.7554/eLife.39813.004| BUSCO analysis | K-mer estimation | ||
|---|---|---|---|
| Genes found | Completeness | Predicted genome size | |
| A. R. irregularis | |||
| A1 | 268 | 92.41% | 131.7 Mb |
| C2 | 263 | 90.69% | 148.6 Mb |
| A4 | 262 | 90.34% | 143.5 Mb |
| A5 | 267 | 92.07% | 130.1 Mb |
| SL1 | 265 | 91.38% | 146.5 Mb |
| B. R. cerebriforme | 267 | 92.07% | 119.7 Mb |
| C. R. diaphanus | 267 | 92.07% | 121.1 Mb |
Additional files
-
Supplementary file 1
Number of predicted transposable elements among R. irregularis isolates and both versions of SL1 assembly
- https://doi.org/10.7554/eLife.39813.008
-
Supplementary file 2
Number of positions shared and total difference between nuclei.
Green and yellow are used to distinguish nuclei with a PCR proven MAT-locus. Heat map goes from 0% similarity with orange to 100% similarity with yellow. The pairwise differences between nuclei are small, as expected of nuclei from the same individual.
- https://doi.org/10.7554/eLife.39813.009
-
Supplementary file 3
Distribution of SNP (basic filter) along the first scaffold in isolates analyzed.
Nuclei that have poor coverage, such as nuclei 13 from A4, were removed. SNPs are distributed fairly evenly across the scaffold although there are apparent hotspots. This may be due to amplification biases.
- https://doi.org/10.7554/eLife.39813.010
-
Supplementary file 4
Number of SNP positions after basic and strict filtering.
Based on the first 100 scaffolds.
- https://doi.org/10.7554/eLife.39813.011
-
Supplementary file 5
Number of SNP positions after strict filtering without taking into account allele frequencies.
Based on the first 100 scaffolds.
- https://doi.org/10.7554/eLife.39813.012
-
Supplementary file 6
Genotype of variable regions in dikaryons in the first 100 scaffolds.
This is the complete list of SNPs used to compute the similarity matrix for Figure 3. Nuclei with a PCR proven MAT-locus are coloured. Green and yellow are used to highlight the two different genotypes present.
- https://doi.org/10.7554/eLife.39813.013
-
Supplementary file 7
Genotype of variable regions in SL1 assembled by ALLPATH-LG in the first 100 scaffolds.
This is the complete list of SNPs used to compute the SL1 similarity matrix for Supplementary file 10 Nuclei with a PCR proven MAT-locus are coloured. Green and yellow are used to highlight the two different genotypes present. (A) Variable regions called by freebayes. (B) Variable regions called by HaplotypeCaller. (C) Variable regions called by Mutect2.
- https://doi.org/10.7554/eLife.39813.014
-
Supplementary file 8
Genotype of variable regions called by GATK HaplotypeCaller in dikaryons in the first 100 scaffolds.
This is the complete list of SNPs used to compute the similarity matrix for Supplementary file 11. Nuclei with a PCR proven MAT-locus are coloured. Green and yellow are used to highlight the two different genotypes present. (A) R. irregularis A4. (B) R. irregularis A5. (C) R. irregularis SL1.
- https://doi.org/10.7554/eLife.39813.015
-
Supplementary file 9
Genotype of variable regions called by GATK Mutect2 in dikaryons in the first 100 scaffold.
This is the complete list of SNPs used to compute similarity matrix for Supplementary file 13. Nuclei with a PCR proven MAT-locus are coloured. Green and yellow are used to highlight the two different genotypes present. (A) R. irregularis A4. (B) R. irregularis A5. (C) R. irregularis SL1.
- https://doi.org/10.7554/eLife.39813.016
-
Supplementary file 10
Similarity matrix of nuclei isolated from AMF dikaryons.
Same as Figure 2 but instead of using SPAdes version of SL1 assembly, the ALLPATH-LG version of SL1 assembly is used. The number ID of the nuclei with a MAT-locus and genotype verified using PCR and Sanger sequencing are shown in coloured boxes. The patterns remain the same, with A4 and A5 having clear segregation of nuclei based on MAT-locus with SL1 showing a much more mosaic pattern.
- https://doi.org/10.7554/eLife.39813.017
-
Supplementary file 11
Similarity matrix of nuclei isolated from AMF dikaryons.
Same as Figure 2 but we used GATK’s HaplotypeCaller instead of freebayes for SNP calling. The number ID of the nuclei with a MAT-locus and genotype that were verified using PCR and Sanger sequencing are shown in coloured boxes. The patterns remain the same, with A4 and A5 having clear segregation of nuclei based on MAT-locus with SL1 showing a much more mosaic pattern.
- https://doi.org/10.7554/eLife.39813.018
-
Supplementary file 12
Similarity matrix of nuclei isolated from AMF dikaryons.
Same as Figure 2 but we used GATK’s Mutect2 instead of freebayes for SNP calling. The number ID of the nuclei with a MAT-locus and genotype that were verified using PCR and Sanger sequencing are shown in coloured boxes. The patterns remain the same, with A4 and A5 having clear segregation of nuclei based on MAT-locus with SL1 showing a much more mosaic pattern.
- https://doi.org/10.7554/eLife.39813.019
-
Supplementary file 13
Primer sequences and combinations for SNP validation of single nucleus DNA.
- https://doi.org/10.7554/eLife.39813.020
-
Transparent reporting form
- https://doi.org/10.7554/eLife.39813.021
Download links
A two-part list of links to download the article, or parts of the article, in various formats.
Downloads (link to download the article as PDF)
Open citations (links to open the citations from this article in various online reference manager services)
Cite this article (links to download the citations from this article in formats compatible with various reference manager tools)
Single nucleus sequencing reveals evidence of inter-nucleus recombination in arbuscular mycorrhizal fungi
eLife 7:e39813.
https://doi.org/10.7554/eLife.39813


