Impaired voice processing in reward and salience circuits predicts social communication in children with autism
- Stanford University School of Medicine, United States
Figures
Figure 1
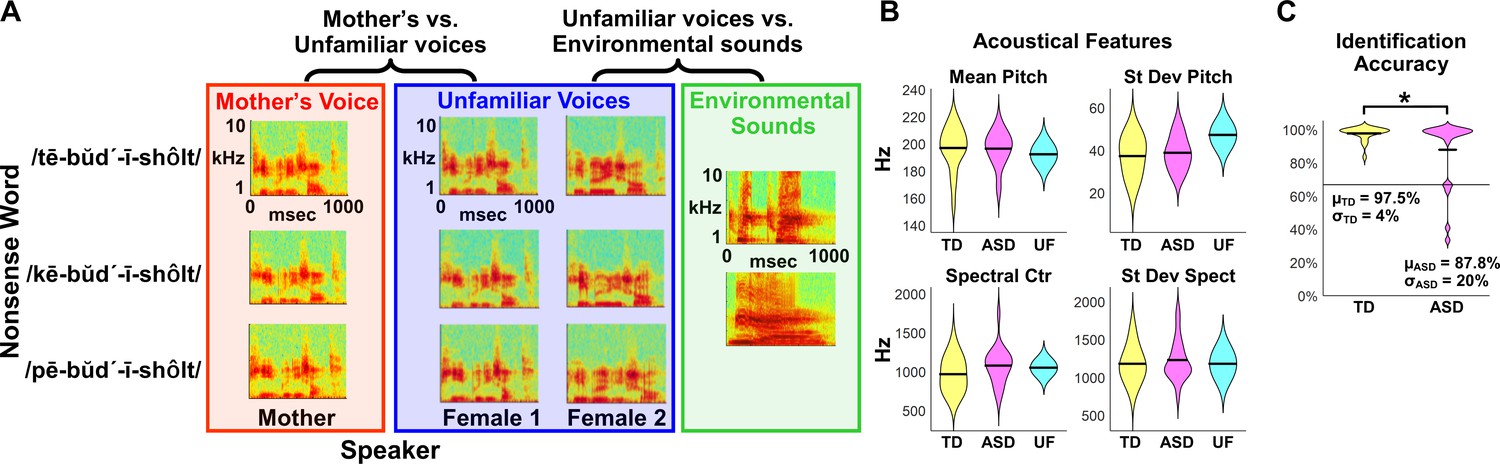
fMRI Experimental design, acoustical analysis, and behavioral results.
(A) Randomized, rapid event-related design: During fMRI data collection, three auditory nonsense words, produced by three different speakers, were presented to the child participants at a comfortable listening level. The three speakers consisted of each child’s mother and two control voices. Non-speech environmental sounds were also presented to enable baseline comparisons for the speech contrasts of interest. All auditory stimuli were 956 ms in duration and were equated for RMS amplitude. (B) Acoustical analyses show that vocal samples produced by the participants’ mothers were comparable between TD (yellow) and ASD groups (magenta) and were similar to the control samples (cyan) for individual acoustical measures (p>0.10 for all acoustical measures; see Appendix, Acoustical analysis of mother’s voice samples). (C) All TD children and the majority of children with ASD were able to identify their mother’s voice with high levels of accuracy, however five children with ASD performed below chance on this measure (see Appendix, Identification of Mother’s Voice). The horizontal line represents chance level for the mother’s voice identification task.
Figure 2
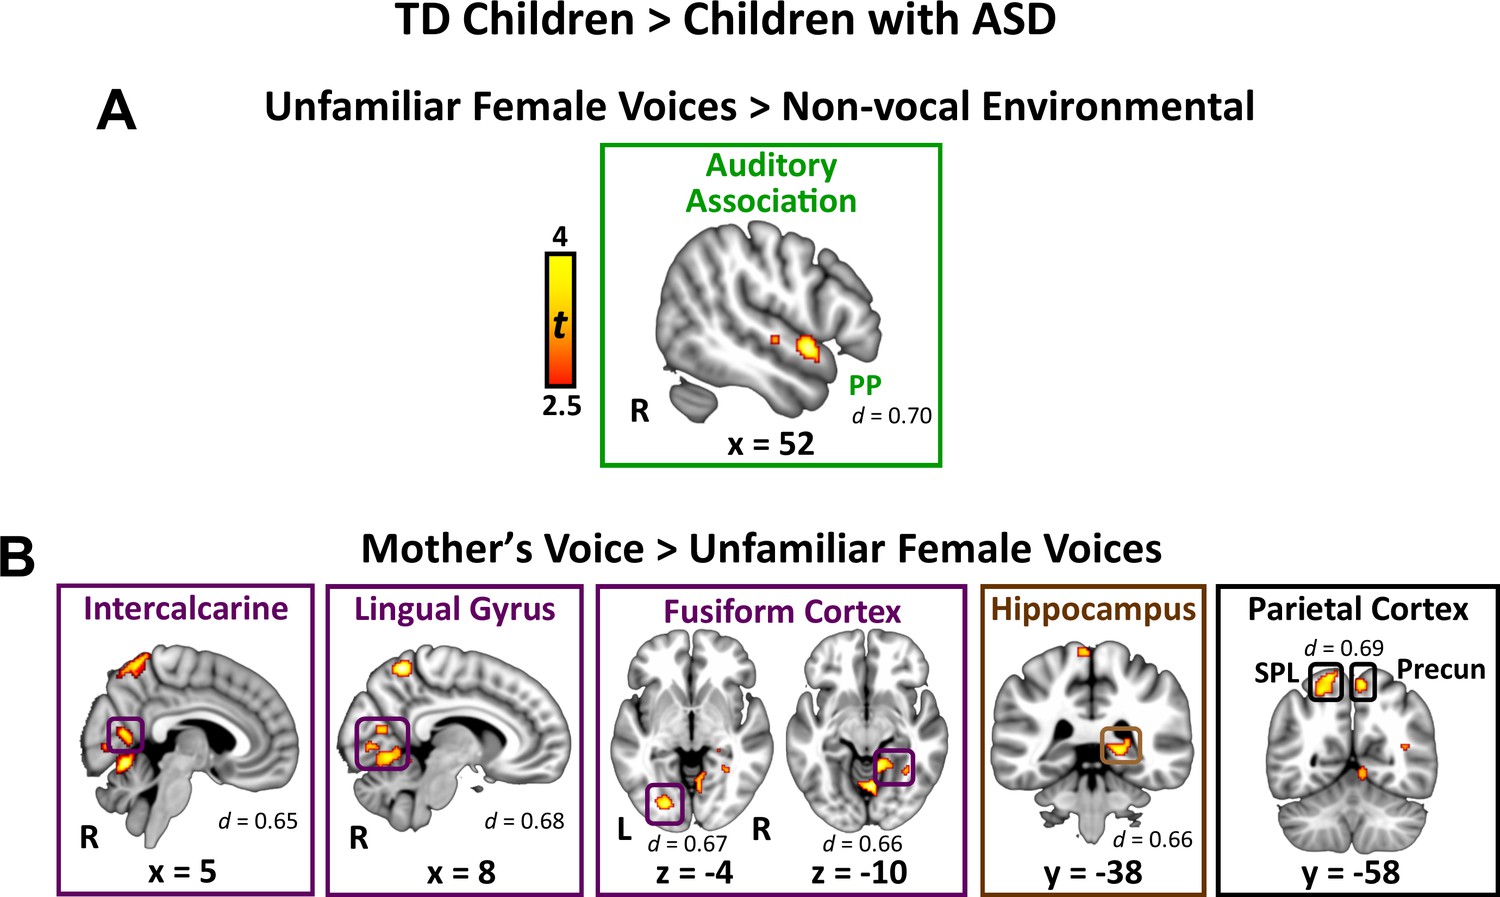
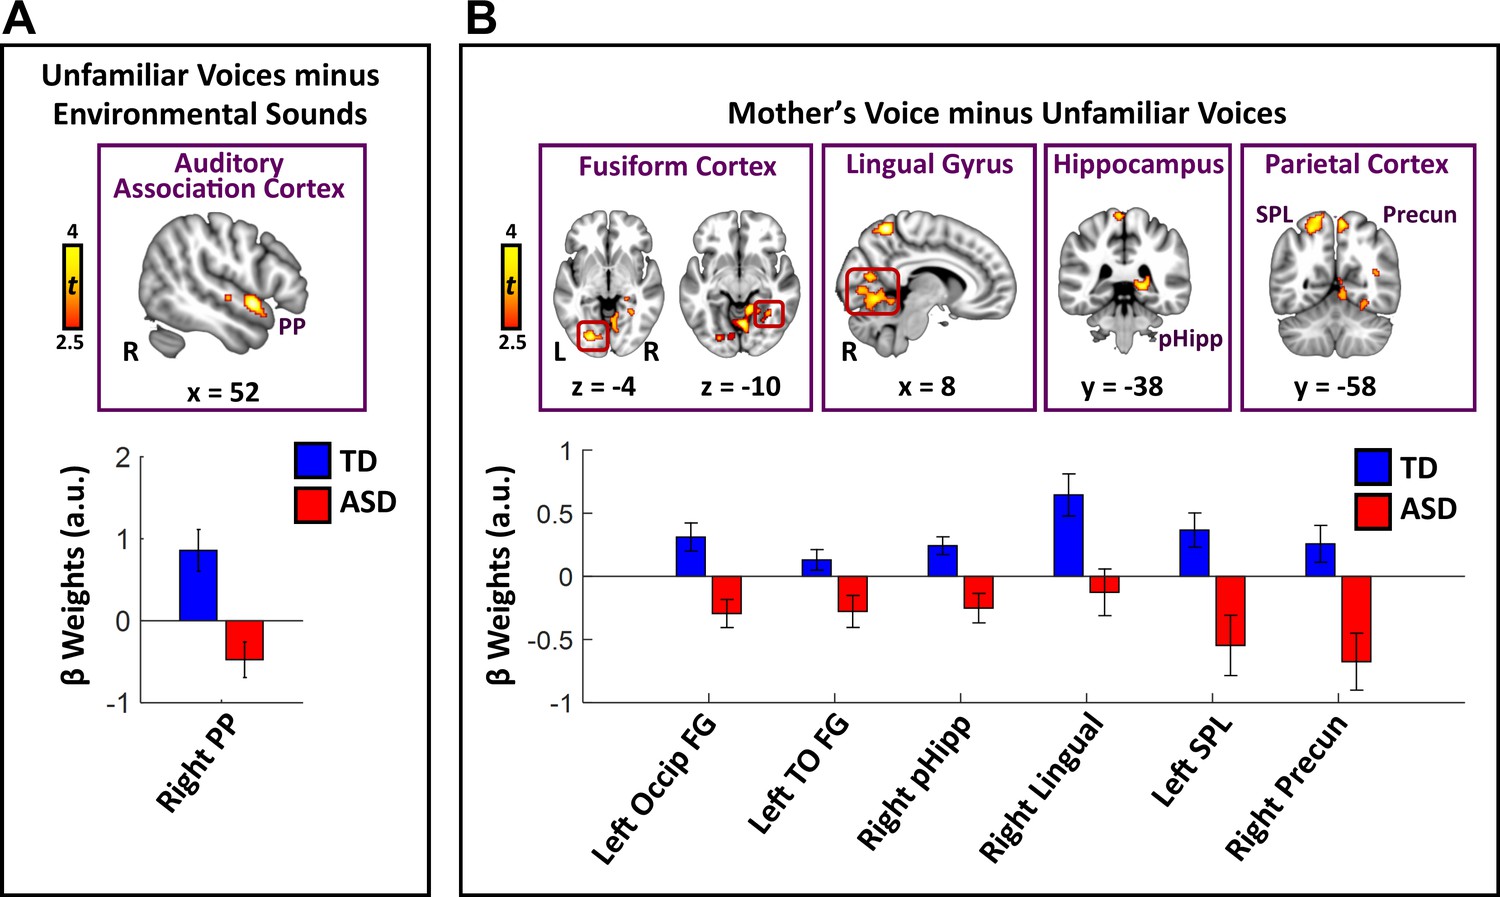
Brain activity difference in TD children compared to children with ASD in response to vocal stimuli.
(A) Group comparisons indicate that TD children show greater activity compared to children with ASD in right-hemisphere auditory association cortex (planum polare (PP)) in response to the unfamiliar female voices > non-vocal environmental sound contrast. No regions showed greater activity in children with ASD compared to TD children for the unfamiliar female voice contrast. (B) Group comparisons indicate that TD children show greater activity in several visual processing regions, including bilateral intercalcarine cortex, lingual gyrus, and fusiform cortex, as well as right-hemisphere posterior hippocampus and superior parietal regions, in response to the mother’s voice > unfamiliar female voices contrast. No regions showed greater activity in children with ASD compared to TD children for the mother’s voice contrast.
Figure 3
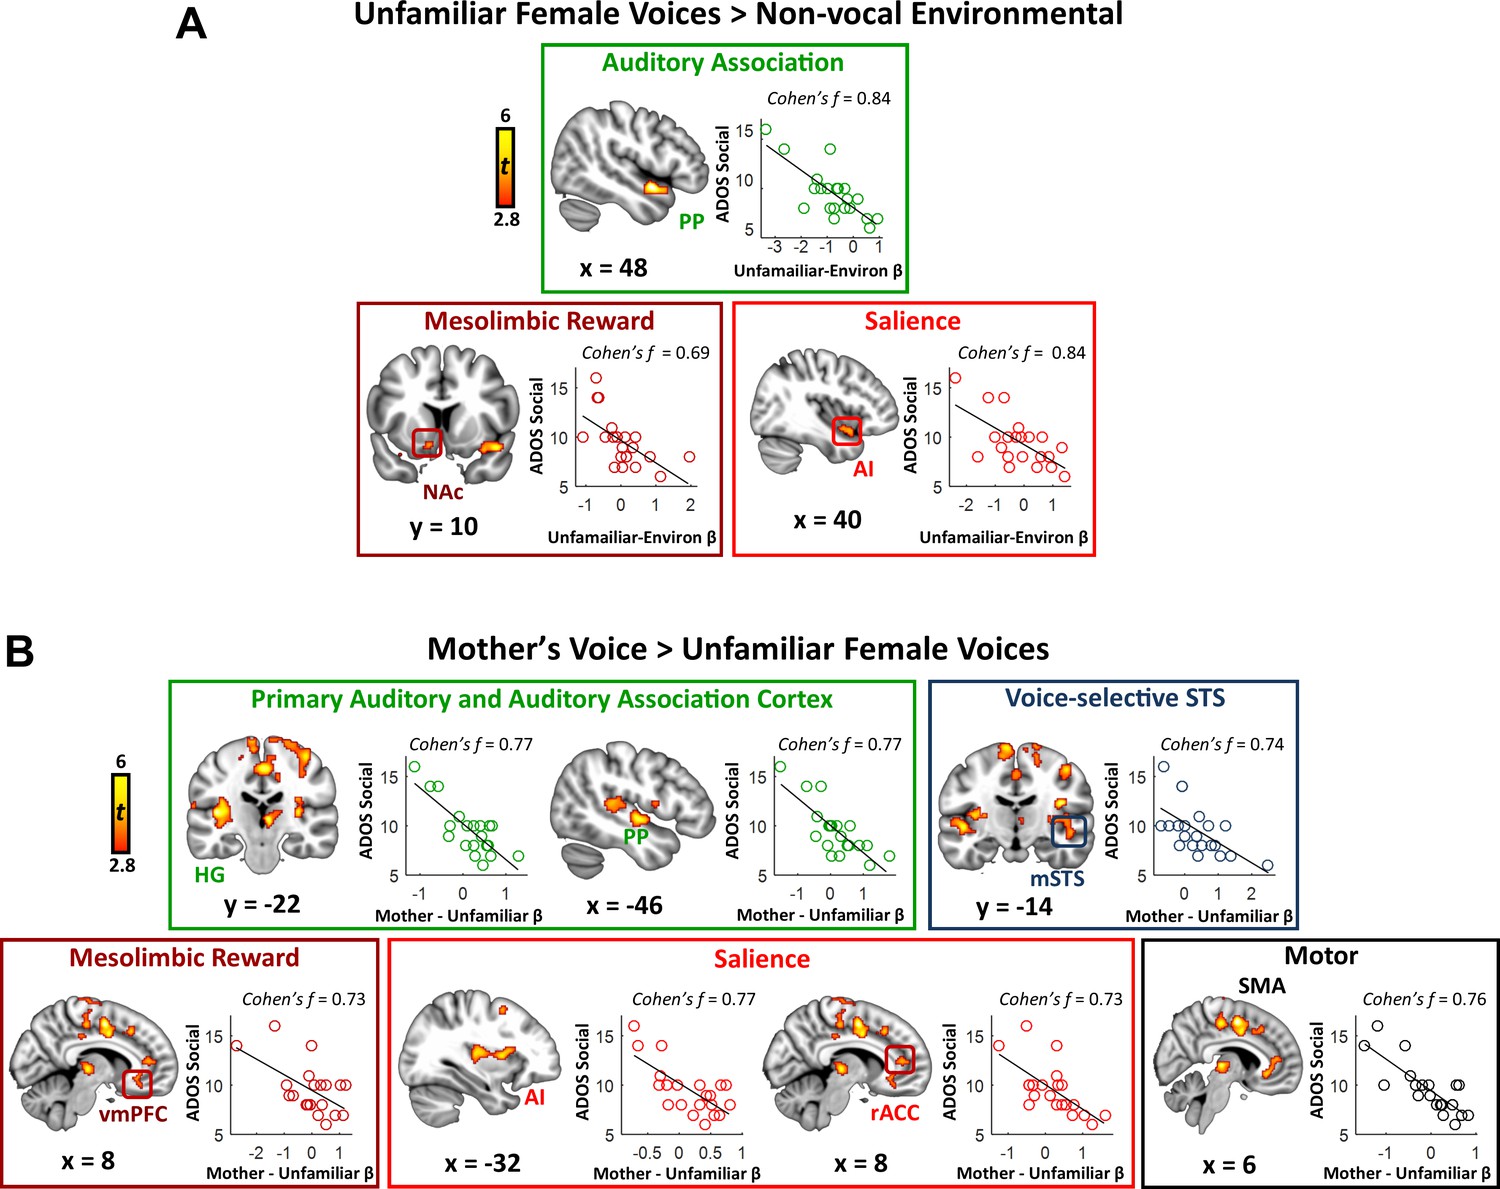
Activity in response to vocal stimuli and social communication abilities in children with ASD.
(A) In children with ASD, the whole-brain covariate map shows that social communication scores are correlated with activity strength during unfamiliar female voice processing in auditory association cortex, the NAc of the reward system, and AI of the salience network. Scatterplots show the distributions and covariation of activity strength in response to unfamiliar female voices and standardized scores of social communication abilities in these children. Greater social communication abilities, reflected by smaller social communication scores, are associated with greater brain activity in these regions. (B) The whole-brain covariate map shows that social communication scores are correlated with activity strength during mother’s voice processing in primary auditory and association cortex, voice-selective STS, vmPFC of the reward system, AI and rACC of the salience network, and SMA.
Figure 4
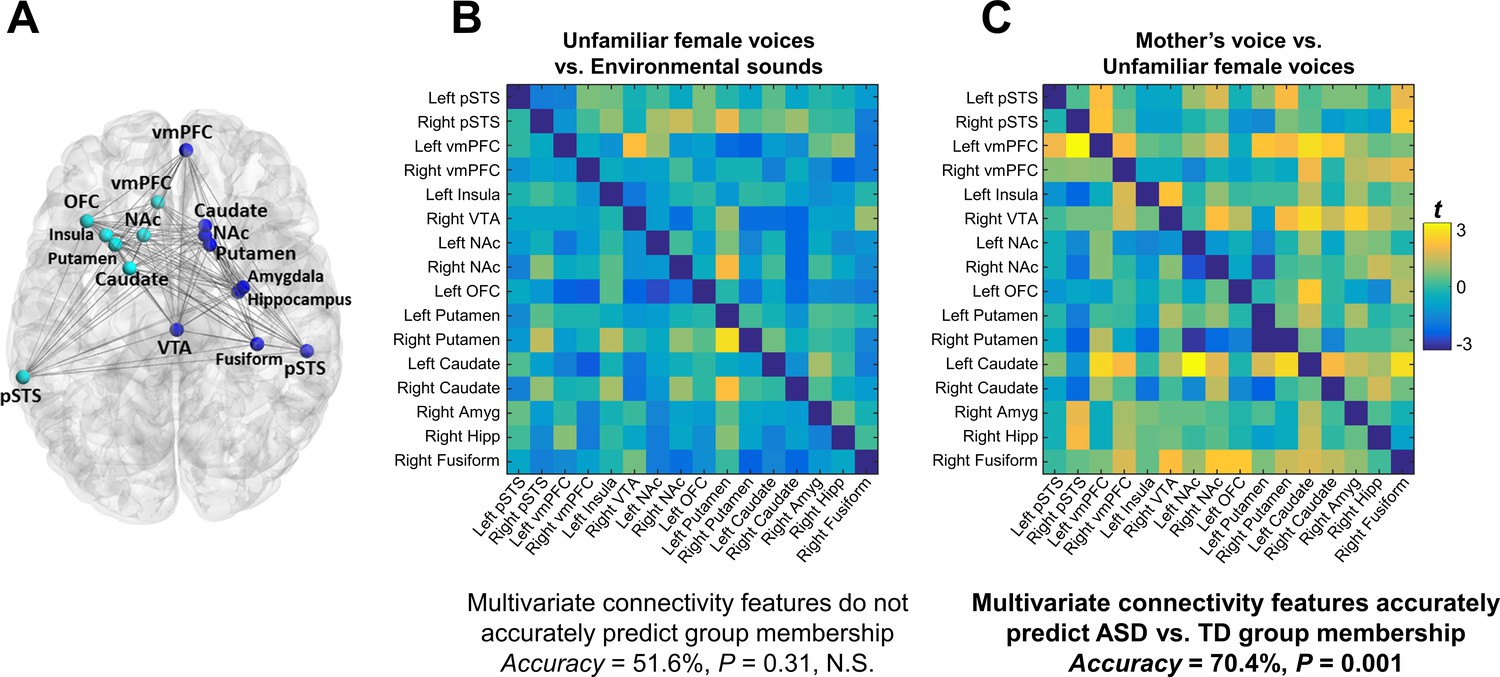
Functional connectivity in the extended voice-selective network and TD vs. ASD group membership.
(A) The brain network used in connectivity analyses, which includes voice-selective, reward, salience, affective, and face-processing regions, was defined a priori from intrinsic connectivity results described in a previous study of children with ASD (Abrams et al., 2013a). (B-C) Group difference connectivity matrices shows differences in connectivity between TD children and children with ASD for all node combinations during (B) unfamiliar female voice processing and (C) mother’s voice processing. Results from multivariate connectivity analysis show that connectivity patterns during mother’s voice processing can accurately predict TD vs. ASD group membership; however, connectivity patterns during unfamiliar female voice processing are unable to accurately predict group membership.
Figure 5
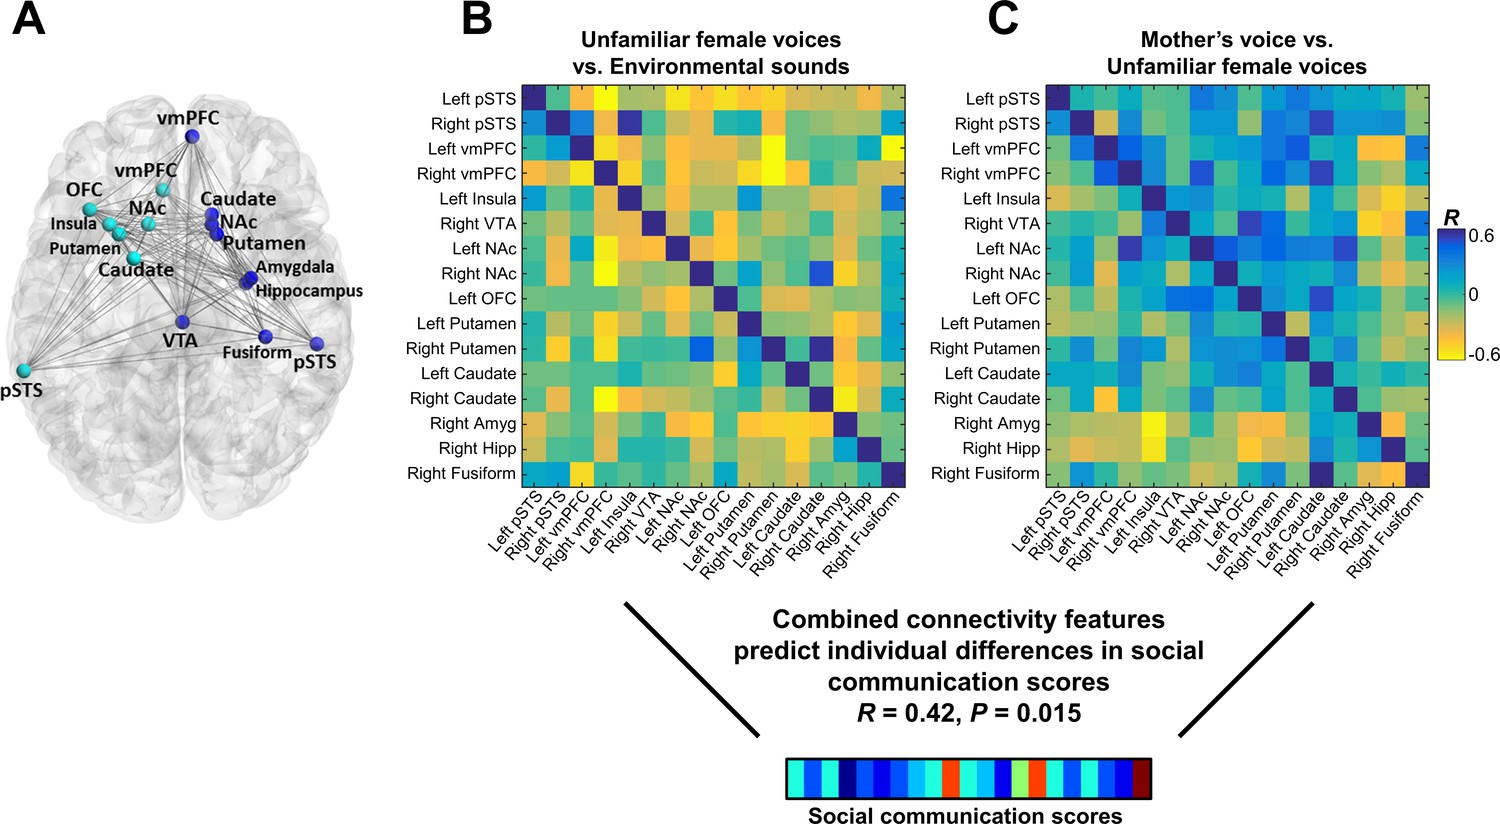
Functional connectivity in the extended voice-selective network and social communication abilities in children with ASD.
(A) The brain network used in connectivity analyses, which includes voice-selective, reward, salience, affective, and face-processing regions, was defined a priori from intrinsic connectivity results described in a previous study of children with ASD (Abrams et al., 2013a). (B-C) Correlation matrices show Pearson’s correlations between social communication scores and connectivity for each pairwise node combination in response to (B) unfamiliar female voice processing and (C) mother’s voice processing in children with ASD. Results from multivariate connectivity analysis show that using a combination of connectivity features from both unfamiliar female and mother’s voice processing can accurately predict social communication scores in children with ASD.
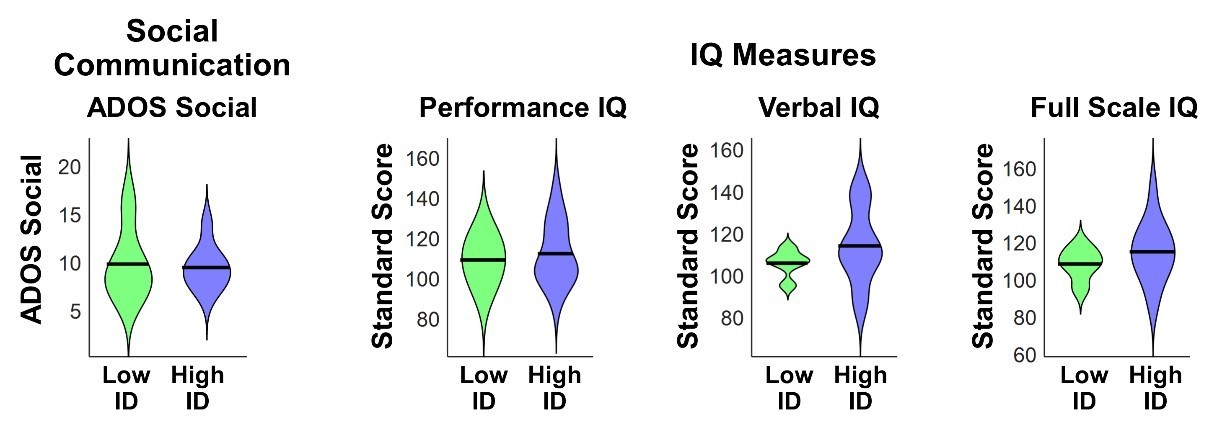
Appendix 1—figure 1
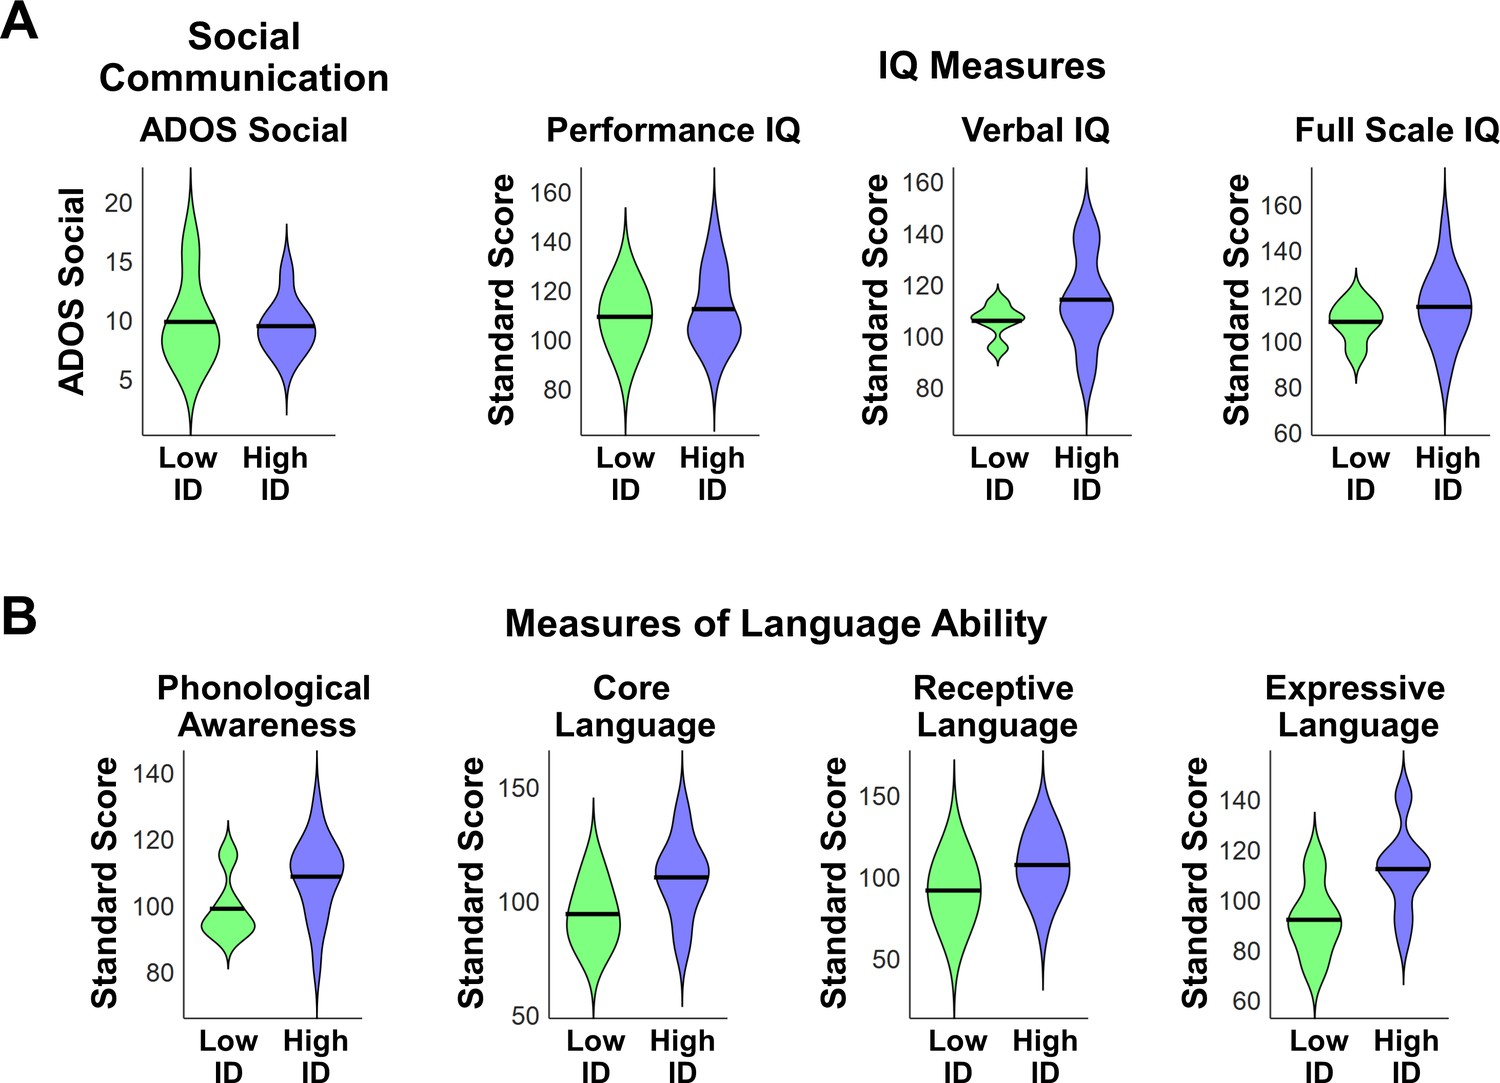
Social communication, cognitive, and language abilities in children with ASD with low vs. high mother’s voice identification accuracy.
(A) To examine whether children with ASD who were unable to identify their mother’s voice in the mother’s voice identification task (N = 5) showed a distinct behavioral profile relative to children with ASD who were able to perform this task (N = 16), we performed Wilcoxon rank sum tests using ADOS Social Affect scores (left-most violin plot) and standardized measures of IQ (Wechsler Abbreviated Scale of Intelligence (Wechsler, 1999)) between these groups. Group comparisons between low (green) and high (blue) mother’s voice identification groups using Wilcoxon rank sum tests were not significant for social communication (p = 0.83) or IQ measures (p > 0.25 for all three measures, uncorrected for multiple comparisons). (B) To examine group differences in language abilities for low vs. high mother’s voice identification groups, we performed Wilcoxon rank sum tests using CTOPP Phonological Awareness and CELF Language measures. Group comparison were not significant for any of the language measures (p > 0.05 for all four measures, not corrected for multiple comparisons), however there was a trend for reduced Core Language (p = 0.062) and Expressive Language abilities (p = 0.055) in the low (green) mother’s voice identification group.
Appendix 1—figure 2
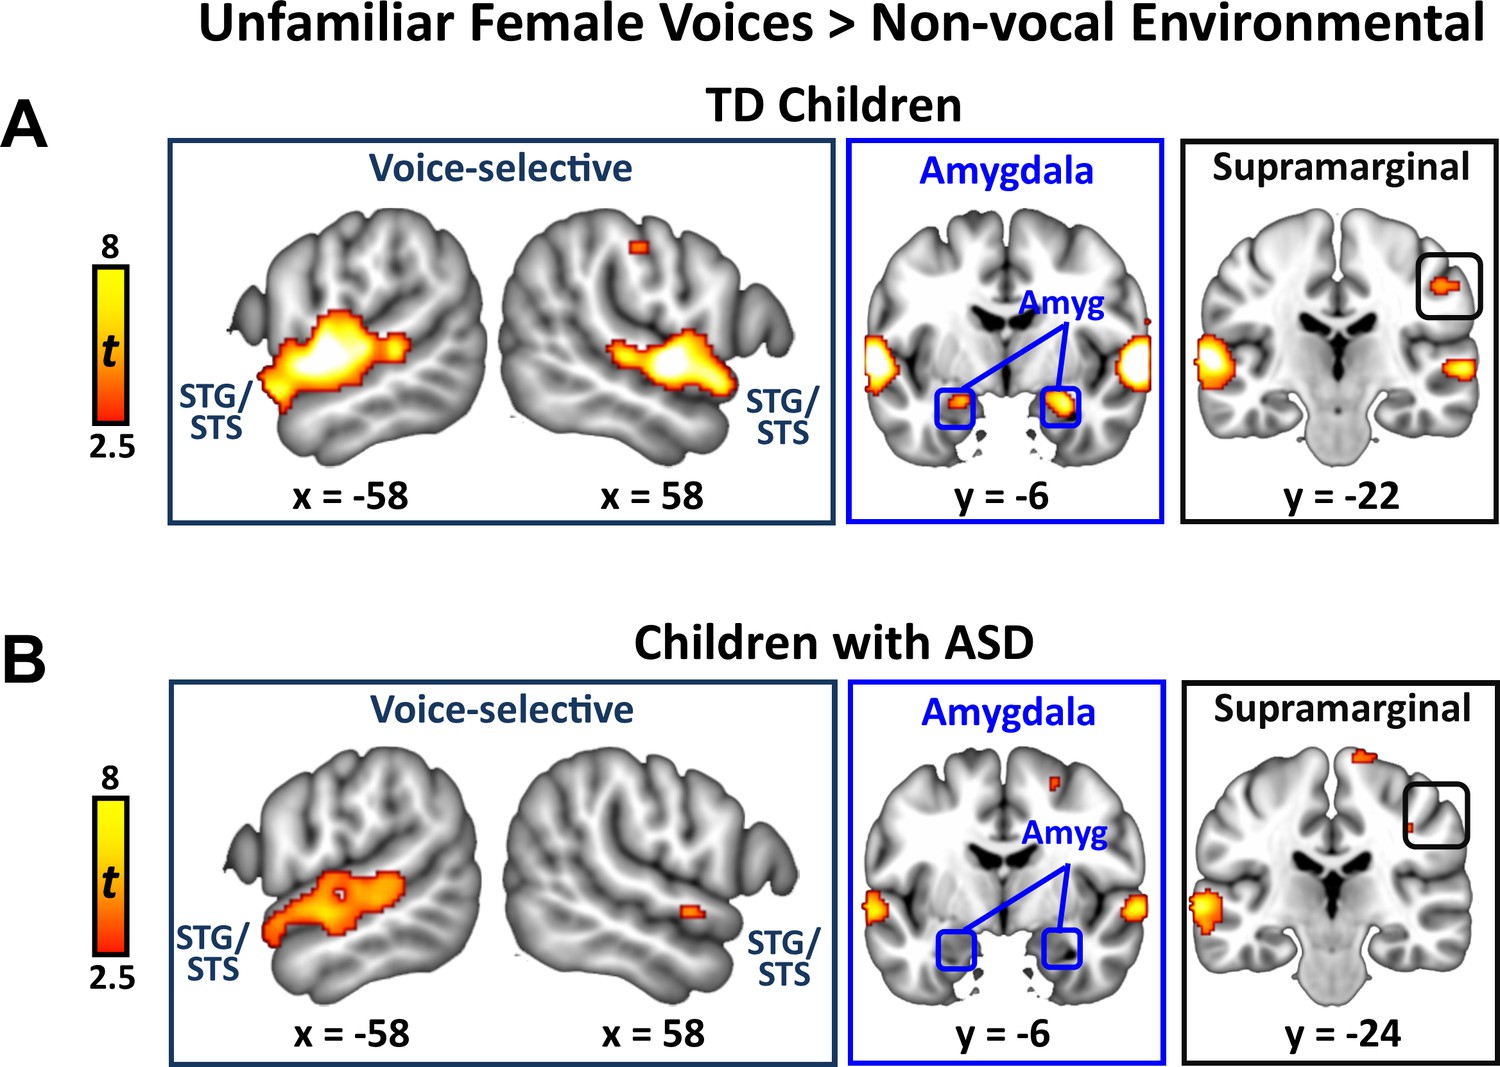
Brain activity in response to unfamiliar female voices compared to environmental sounds in TD children and children with ASD.
(A) In TD children, unfamiliar female voices elicit greater activity throughout a wide extent of voice-selective superior temporal gyrus (STG) and superior temporal sulcus (STS), bilateral amygdala, and right-hemisphere supramarginal gyrus. (B) Children with ASD show a reduced activity profile in STG/STS in response to unfamiliar female voices and do not show increased activity compared to environmental sounds in the amygdala.
Appendix 1—figure 3
Signal levels in response to unfamiliar female voices and mother’s voice in TD children and children with ASD.
The reason for the signal level analysis is that stimulus-based differences in fMRI activity can result from a number of different factors. Significant differences were inherent to this ROI analysis as they are based on results from the whole-brain GLM analysis (Vul et al., 2009); however, results provide important information regarding the magnitude and sign of fMRI activity. (a) Regions were selected for signal level analysis based on their identification in the TD > ASD group difference map for the [unfamiliar female voices vs. environmental sounds] contrast (Figure 2A). ROIs are 5 mm spheres centered at the peak for these regions in the TD > ASD group difference map for the [unfamiliar female voices vs. environmental sounds] contrast. (b) Regions were selected for signal level analysis based on their identification in the [mother’s voice vs. unfamiliar female voices] contrast (Figure 2B). The posterior hippocampus ROI is a 2 mm sphere centered at the peak for this regions in the [mother’s voice >unfamiliar female voices] contrast. All other ROIs are 5 mm spheres centered at the peak for these regions in the TD > ASD group difference map for the [mother’s voice vs. unfamiliar female voices] contrast.
Appendix 1—figure 4

Brain activity in response to mother’s voice compared to unfamiliar female voices in TD children and children with ASD.
(A) In TD children, mother’s voice elicited greater activity in auditory brain structures in the midbrain and superior temporal cortex (top row, left), including bilateral inferior colliculus (IC) and primary auditory cortex (medial Heschl’s gyrus; mHG) and a wide extent of voice-selective superior temporal gyrus (STG; top row, middle) and superior temporal sulcus (STS). Mother’s voice also showed greater activity in occipital cortex, including fusiform cortex (bottom row, left) as well as core structures of the mesolimbic reward system, including bilateral medial prefrontal cortex (mPFC) and nucleus accumbens (NAc), and the anterior insula (AI) of the salience network. (B) Greater activity for mother’s voice was evident in a smaller collection of brain regions in children with ASD compared to TD children. Mother’s voice did not elicit greater activity in auditory brain structures in the midbrain but extended slightly into primary auditory cortex (top row, left), and activated a more limited extent of voice-selective STG (top row, middle) and STS. Mother’s voice did not elicit greater activity compared to unfamiliar female voices in fusiform cortex, and mesolimbic reward system. Mother’s voice did elicit greater activity in AI of the salience network.
Appendix 1—figure 5
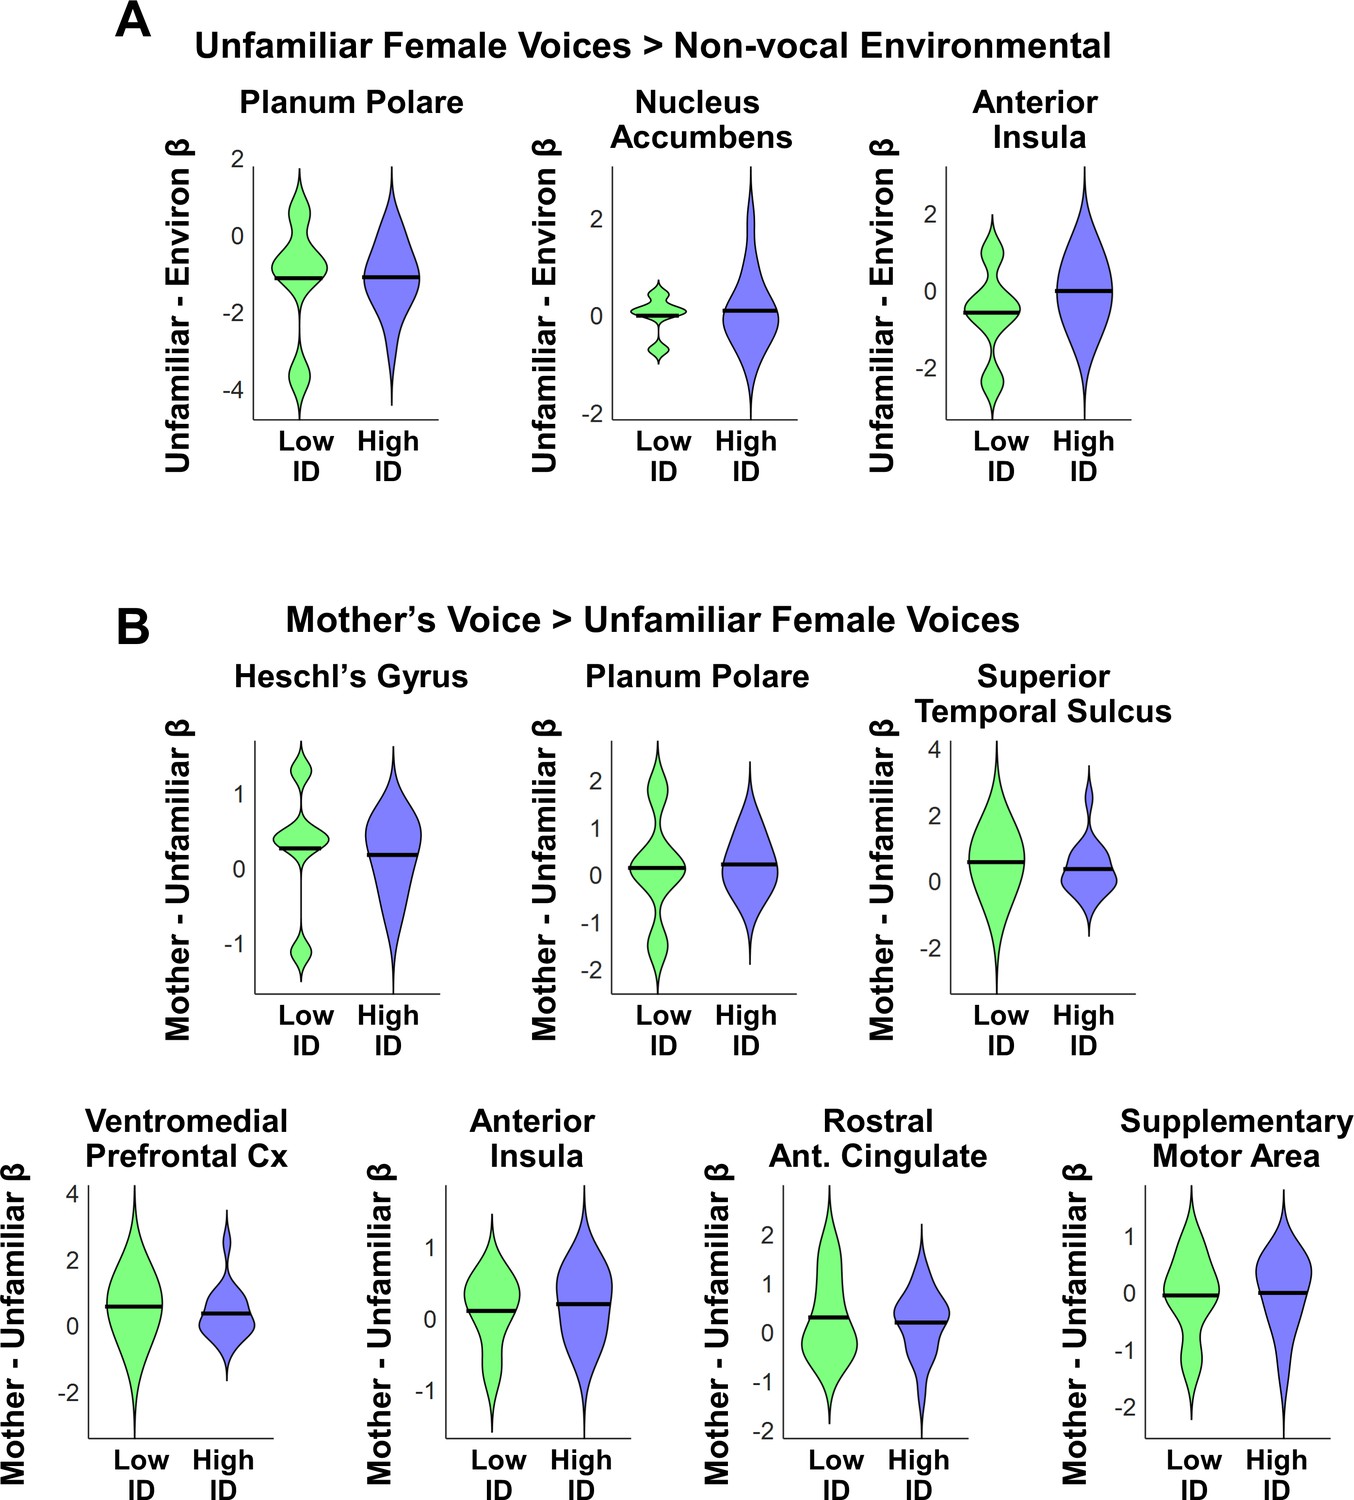
Brain activation in response to unfamiliar voices and mother’s voice in children with ASD with low vs. high mother’s voice identification accuracy.
(A) To examine whether children with ASD who were unable to identify their mother’s voice in the mother’s voice identification task (N = 5) showed a distinct neural response profile relative to children with ASD who were able to perform this task (N = 16), Wilcoxon rank sum tests were computed using ROI single levels (mean contrast betas) for the [unfamiliar voices minus non-social environmental sounds] in regions identified in Figure 3A. Results showed no group differences between children with low (green) vs. high (blue) identification accuracy for any of the brain regions associated with the [unfamiliar voices vs. non-social environmental sounds] contrast (p > 0.35 for all three regions, not corrected for multiple comparisons). (B) Group differences in neural response profiles for low vs. high mother’s voice identification groups using ROI single levels (mean contrast betas) for the [mother’s voice minus unfamiliar voices] contrast were computed within regions identified in Figure 3B. Results showed no group differences between children with low vs. high identification accuracy for any of the brain regions associated with the [mother’s voice minus unfamiliar voices] contrast (p > 0.45 for all seven regions, not corrected for multiple comparisons).
Author response image 1
Author response image 2

Tables
Table 1
Demographic and IQ measures
https://doi.org/10.7554/eLife.39906.007| ASD (n = 21) | TD (n = 21) | p-value | |
|---|---|---|---|
| Gender ratio | 18 M: 3 F | 17 M: 4 F | 0.69† |
| Age (years) | 10.75 ± 1.48 | 10.32 ± 1.42 | 0.34 |
| Full-scale IQ* | 113.75 ± 15.04 | 117.45 ± 10.83 | 0.38 |
| VIQ* | 112.25 ± 16.13 | 118.55 ± 12.13 | 0.17 |
| PIQ ADOS social ADI-A social ADI-B communication ADI- C repetitive behaviors Word reading Reading comprehension | 111.52 ± 14.30 9.52 ± 2.54 6.81 ± 4.52 7.43 ± 5.01 4.10 ± 2.66 112.24 ± 11.34 108.29 ± 11.81 | 113.14 ± 13.46 - - - - 114.38 ± 8.96 115.38 ± 9.09 | 0.71 - - - - 0.50 0.35 |
| Max. Motion (mm) | 1.99 ± 0.93 | 1.73 ± 0.93 | 0.36 |
| Mother's voice ID accuracy | 0.88 ± 0.21 | 0.98 ± 0.04 | 0.04 |
-
Demographic and mean IQ scores are shown for the sample.
M, Male; F, Female; WASI, Wechsler Abbreviated Scale of Intelligence.
-
†Chi-squared test.
*Score missing for one participant in TD and ASD groups.
Appendix 1—table 1
Effect sizes for GLM results: TD vs. ASD Group Analysis.
The overall effect size measured across all brain clusters identified in the TD vs. ASD Group Analyses is 0.68.
| Contrast | Brain region | Effect size |
|---|---|---|
| [Unfamiliar Voices minus Environmental Sounds] | Right-hemisphere Planum Polare (PP) | 0.70 |
| [Mother’s Voice minus Unfamiliar Voices] | Right-hemisphere Intercalcarine | 0.65 |
| Right-hemisphere Lingual | 0.68 | |
| Right-hemisphere Fusiform | 0.66 | |
| Left-hemisphere Fusiform | 0.67 | |
| Right-hemisphere Hippocampus | 0.66 | |
| Left-hemisphere Superior Parietal Lobule (SPL) | 0.69 | |
| Right -hemisphere Precuneus | 0.69 |
Appendix 1—table 2
Effect sizes for GLM results: Social Communication Covariate Analysis.
The overall effect size measured across all brain clusters identified in the Social Communication Covariate Analysis is 0.76.
| Contrast | Brain region | Effect size |
|---|---|---|
| [Unfamiliar Voices minus Environmental Sounds] | Right-hemisphere Planum Polare (PP) | 0.84 |
| Left-hemisphere Nucleus Accumbens (NAc) | 0.69 | |
| Right-hemisphere Anterior Insula (AI) | 0.84 | |
| [Mother’s Voice minus Unfamiliar Voices] | Left-hemisphere Heschl’s Gyrus (HG) | 0.77 |
| Left-hemisphere Planum Polare (PP) | 0.77 | |
| Right-hemisphere Superior Temporal Sulcus (mSTS) | 0.74 | |
| Right-hemisphere Ventromedial prefrontal cortex (vmPFC) | 0.73 | |
| Left-hemisphere Anterior Insula (AI) | 0.77 | |
| Right-hemisphere Rostral Antreior Cingulate Cortex (rACC) | 0.73 | |
| Right-hemisphere Supplementary Motor Area (SMA) | 0.76 |
Appendix 1—table 3
Brain regions used in functional connectivity analyses.
https://doi.org/10.7554/eLife.39906.018| Brain region | Coordinates |
|---|---|
| Left-hemisphere pSTS | [−63–42 9] |
| Right-hemisphere pSTS | [57 -31 5] |
| Left-hemisphere vmPFC | [−6 32–14] |
| Right-hemisphere vmPFC | [6 54 -4] |
| Left-hemisphere Anterior Insula | [−28 18–10] |
| Right-hemisphere VTA | [2 -22 -20] |
| Left-hemisphere NAc | [−12 18–8] |
| Right-hemisphere NAc | [14 18 -8] |
| Left-hemisphere OFC | [−36 24–14] |
| Left-hemisphere Putamen | [−24 14–8] |
| Right-hemisphere Putamen | [16 14 -10] |
| Left-hemisphere Caudate | [−18 4 20] |
| Right-hemisphere Caudate | [14 22 -6] |
| Right-hemisphere Amygdala | [30 -4 -24] |
| Right-hemisphere Hippocampus | [28 -6 -26] |
| Right-hemisphere Fusiform | [36 -28 -22] |
Appendix 1—table 4
GLM Threshold Analysis: TD vs. ASD Group Analysis [Unfamiliar Voices minus Environmental Sounds] fMRI Contrast.
https://doi.org/10.7554/eLife.39906.019| Brain Region Activation | Height: p<0.005 Extent: p<0.05 | Height: p<0.005 Extent: p<0.01 | Height: p<0.001 Extent: p<0.05 | Height: p<0.001 Extent: p<0.01 |
|---|---|---|---|---|
| 67 Voxels | 87 Voxels | 30 Voxels | 41 Voxels | |
| Auditory Assoc. Cx, PP | Yes | Yes | Yes | Yes |
Appendix 1—table 5
GLM Threshold Analysis: TD vs. ASD Group Analysis [Mother’s Voice minus Unfamiliar Voices] contrast.
https://doi.org/10.7554/eLife.39906.020| Brain Region Activation | Height: p<0.005 Extent: p<0.05 | Height: p<0.005 Extent: p<0.01 | Height: p<0.001 Extent: p<0.05 | Height: p<0.001 Extent: p<0.01 |
|---|---|---|---|---|
| 67 Voxels | 87 Voxels | 30 Voxels | 41 Voxels | |
| Occipital Fusiform Gyrus | Yes | Yes | Yes | No |
| Temporal Occipital Fusiform Gyrus | Yes | Yes | No | No |
| Post. Hippocampus | Yes | Yes | No | No |
| Lingual Gyrus | Yes | Yes | Yes | Yes |
| Superior Parietal | Yes | Yes | Yes | Yes |
| Precuneus | Yes | Yes | Yes | Yes |
Appendix 1—table 6
GLM Threshold Analysis: Social Communication Covariate Analysis, [Unfamiliar Voices minus Environmental Sounds] fMRI Contrast.
https://doi.org/10.7554/eLife.39906.021| Brain Region Activation | Height: p<0.005 Extent: p<0.05 | Height: p<0.005 Extent: p<0.01 | Height: p<0.001 Extent: p<0.05 | Height: p<0.001 Extent: p<0.01 |
|---|---|---|---|---|
| 67 Voxels | 87 Voxels | 30 Voxels | 41 Voxels | |
| Auditory Assoc., PP | Yes | Yes | Yes | Yes |
| Voice Selective, STG | Yes | Yes | Yes | Yes |
| Mesolimbic Reward, NAc | Yes (SVC) | No | No | No |
| Salience, AI | Yes | Yes | Yes | Yes |
Appendix 1—table 7
GLM Threshold Analysis: Social Communication Covariate Analysis, [Mother’s Voice minus Unfamiliar Voices] fMRI Contrast.
https://doi.org/10.7554/eLife.39906.022| Brain Region Activation | Height: p<0.005 Extent: p<0.05 | Height: p<0.005 Extent: p<0.01 | Height: p<0.001 Extent: p<0.05 | Height: p<0.001 Extent: p<0.01 |
|---|---|---|---|---|
| 67 Voxels | 87 Voxels | 30 Voxels | 41 Voxels | |
| Primary Auditory, HG | Yes | Yes | Yes | Yes |
| Voice-selective, STG/STS | Yes | Yes | No | No |
| Mesolimbic Reward, vmPFC | Yes | Yes | Yes | Yes |
| Salience, AI | Yes | Yes | Yes | Yes |
| Salience, rACC | Yes | Yes | No | No |
| Motor, SMA | Yes | Yes | Yes | Yes |
Additional files
-
Source code 1
Spatial Extent with Monte Carlo Simulations.
- https://doi.org/10.7554/eLife.39906.008
-
Transparent reporting form
- https://doi.org/10.7554/eLife.39906.009
Download links
A two-part list of links to download the article, or parts of the article, in various formats.
Downloads (link to download the article as PDF)
Open citations (links to open the citations from this article in various online reference manager services)
Cite this article (links to download the citations from this article in formats compatible with various reference manager tools)
Impaired voice processing in reward and salience circuits predicts social communication in children with autism
eLife 8:e39906.
https://doi.org/10.7554/eLife.39906


