The Crohn’s disease polymorphism, ATG16L1 T300A, alters the gut microbiota and enhances the local Th1/Th17 response
- Harvard T. H. Chan School of Public Health, United States
- Massachusetts General Hospital, United States
- Broad Institute of Harvard and MIT, United States
- Joslin Diabetes Center, United States
- Harvard Medical School, United States
- Beth Israel Deaconess Medical Center, United States
- Dana-Farber Cancer Institute and Harvard Medical School, United States
Figures
Figure 1
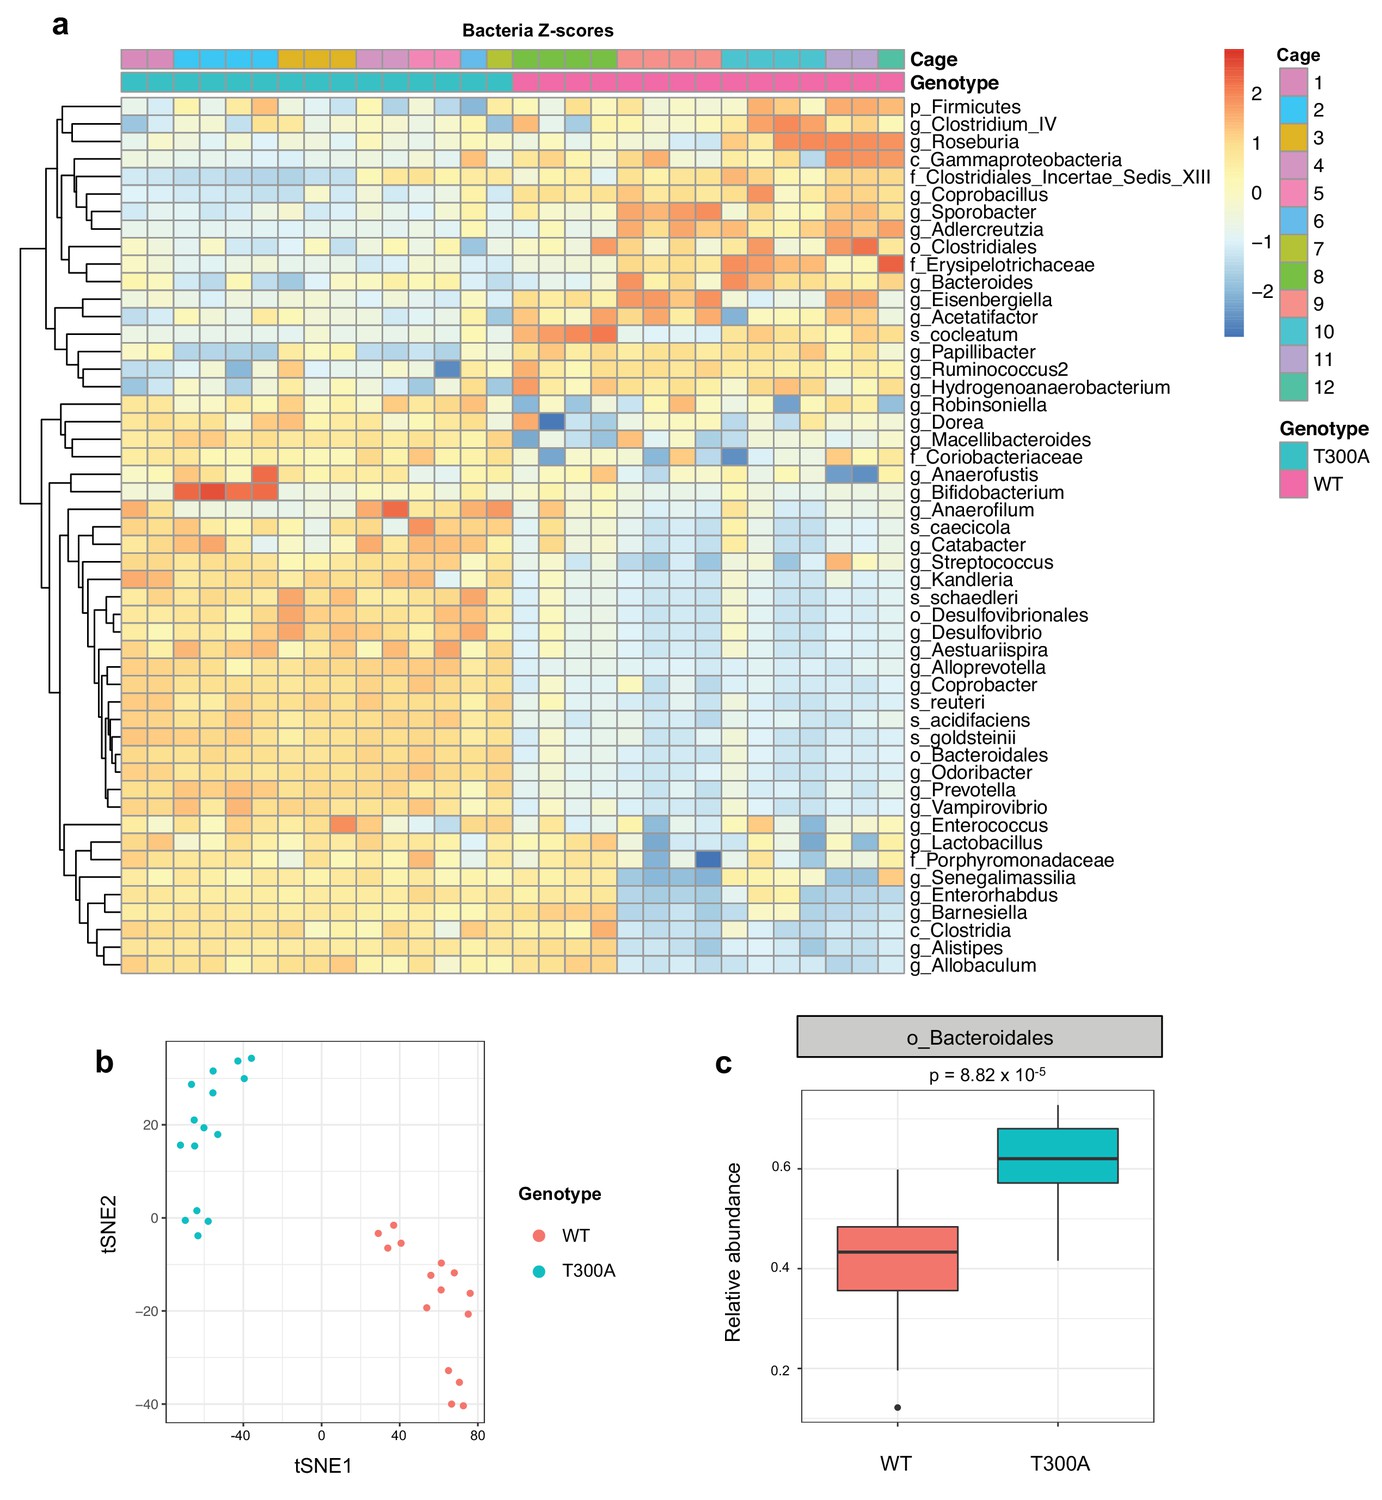
Altered microbiota in conventionally-housed WT vs T300A mice.
12 week old WT and T300A mice were conventionally-housed in a specific pathogen free (SPF) facility. Stool samples were collected and analyzed by 16S rRNA gene amplicon sequencing. (a) Population analysis of 16S rRNA gene amplicon sequencing from stool samples from SPF WT vs. T300A mice. (p = phylum, c = class, o = order, f = family, g = genus, s = species) Bacteria Z-scores generated by limma. (b) t-Distributed Stochastic Neighbor Embedding (tSNE) plot analysis of WT vs. T300A SPF mouse stool samples. (c) Box plot analysis of the order Bacteroidales in WT vs. T300A SPF mouse stool samples.
Figure 2 with 1 supplement
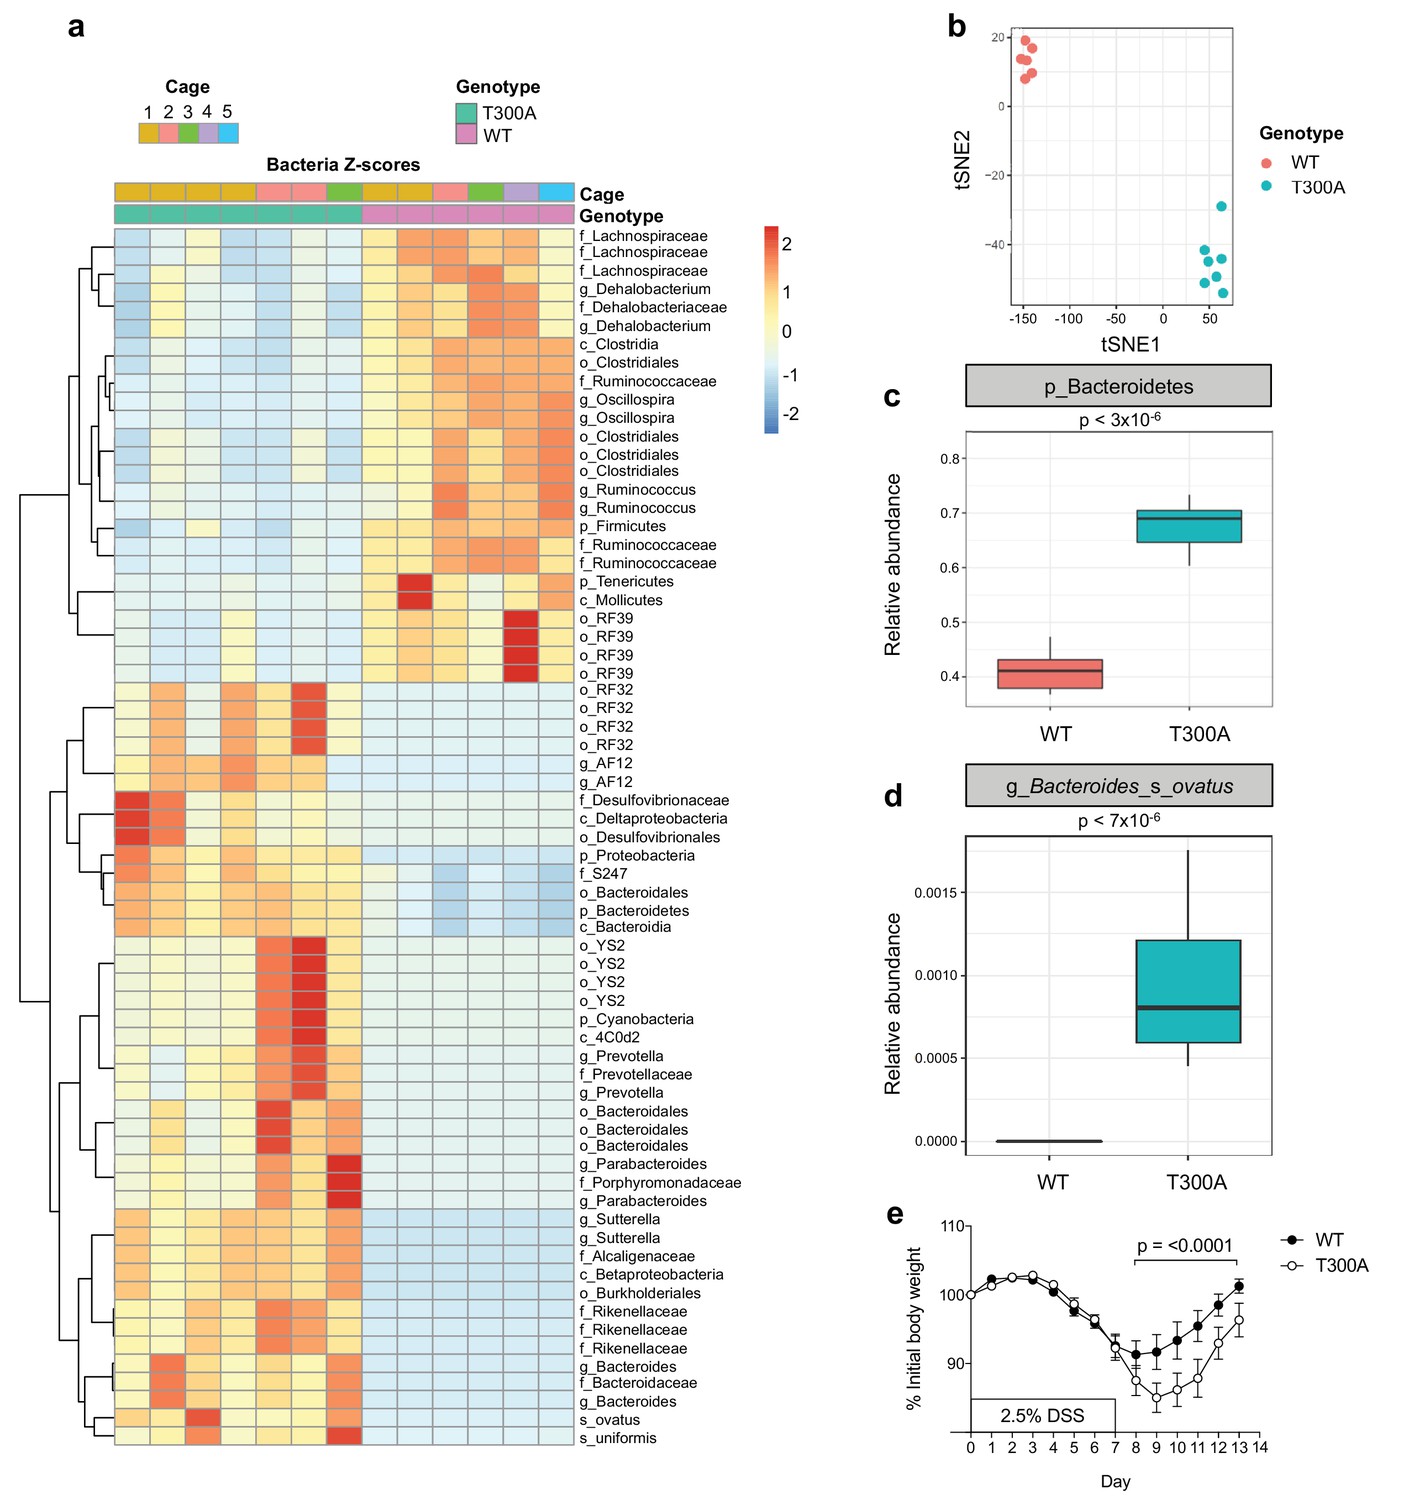
Altered microbiota in conventionally-housed WT vs T300A mice with gut inflammation.
12 week old WT and T300A conventionally-housed SPF mice were treated with 2.5% DSS for 7d followed by 7d of regular drinking water. (a) Population analysis of 16S rRNA gene amplicon sequencing from stool samples from WT vs. T300A mice. (p = phylum, c = class, o = order, f = family, g = genus, s = species) Bacteria Z-scores generated by limma. (b) t-Distributed Stochastic Neighbor Embedding (tSNE) plot analysis of WT vs. T300A stool samples post DSS treatment. (c) Box plot analysis of the phylum Bacteroidetes in WT vs. T300A mice post DSS treatment. (d) Box plot analysis of B. ovatus in WT vs. T300A mice post DSS treatment. (e) Percent initial body weight of WT (n = 12) and T300A (n = 15) mice treated with 2.5% DSS for 7d followed by 7d of regular drinking water. Day 8–13 time points, p = < 0.0001. Two-way ANOVA with Tukey‘s post-hoc test.
-
Figure 2—source data 1
Source data for Figure 2.
- https://doi.org/10.7554/eLife.39982.006
Figure 2—figure supplement 1

T300A affects the microbiome gene function profile.
Significant alterations in gene function inferred from 16S rRNA gene amplicon sequencing data using PICRUSt from stool samples obtained from 12 wk old WT versus T300A conventionally-housed SPF mice treated with 2.5% DSS followed by 7d regular drinking water.
Figure 3
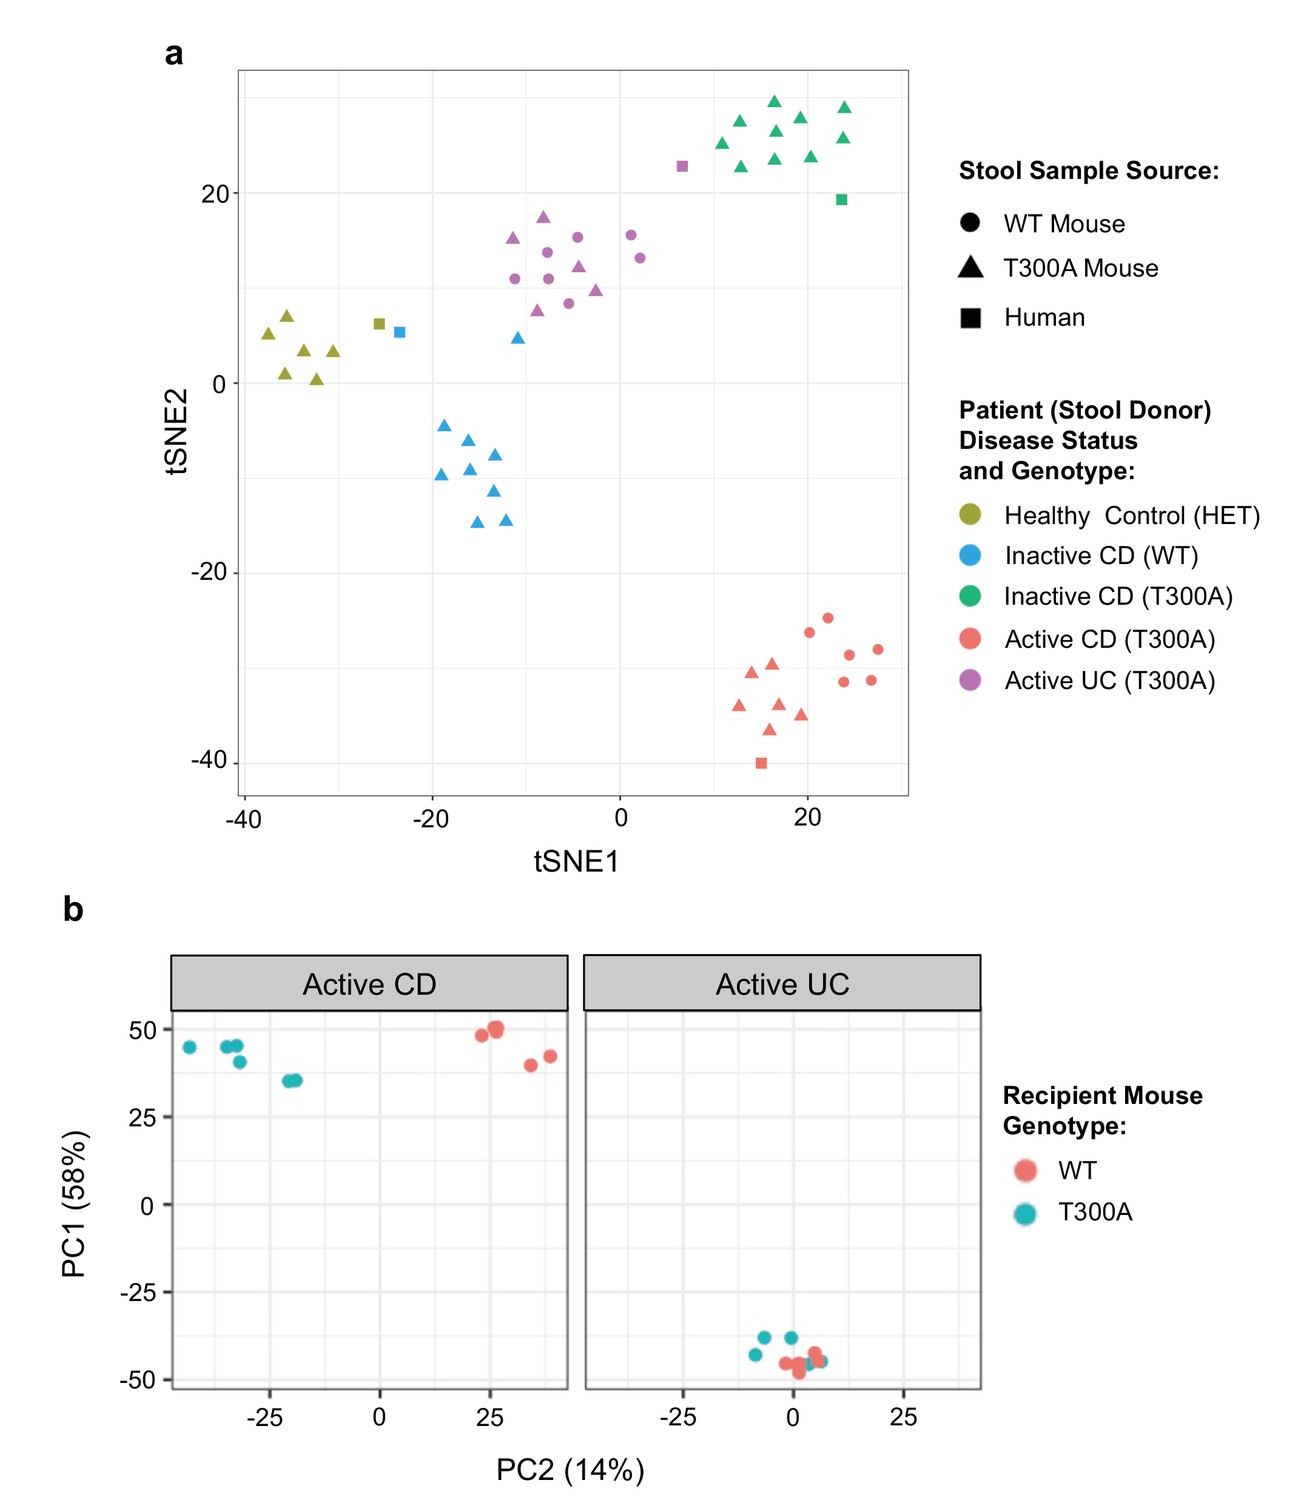
Distinct gut microbiota composition in mice associated with human stool.
GF mice were associated with human stool samples and analyzed after four wks. (a) tSNE dimensionality reduction analysis based on genus-level abundances of stool samples from human patient stool donor (square) or GF WT (circles) and T300A (triangles) mice four wks post association with 50 mg human stool from patients: healthy control, genotype Het (yellow), inactive CD, genotype WT (blue), inactive CD, genotype T300A (green), active CD, genotype T300A (red), or active UC, genotype T300A (purple). Each symbol represents data from an individual mouse. (b) PCA plot of stool samples from WT vs. T300A mice four wks post association with either active CD (left) or active UC (right) human stool. Each symbol represents data from an individual mouse.
Figure 4
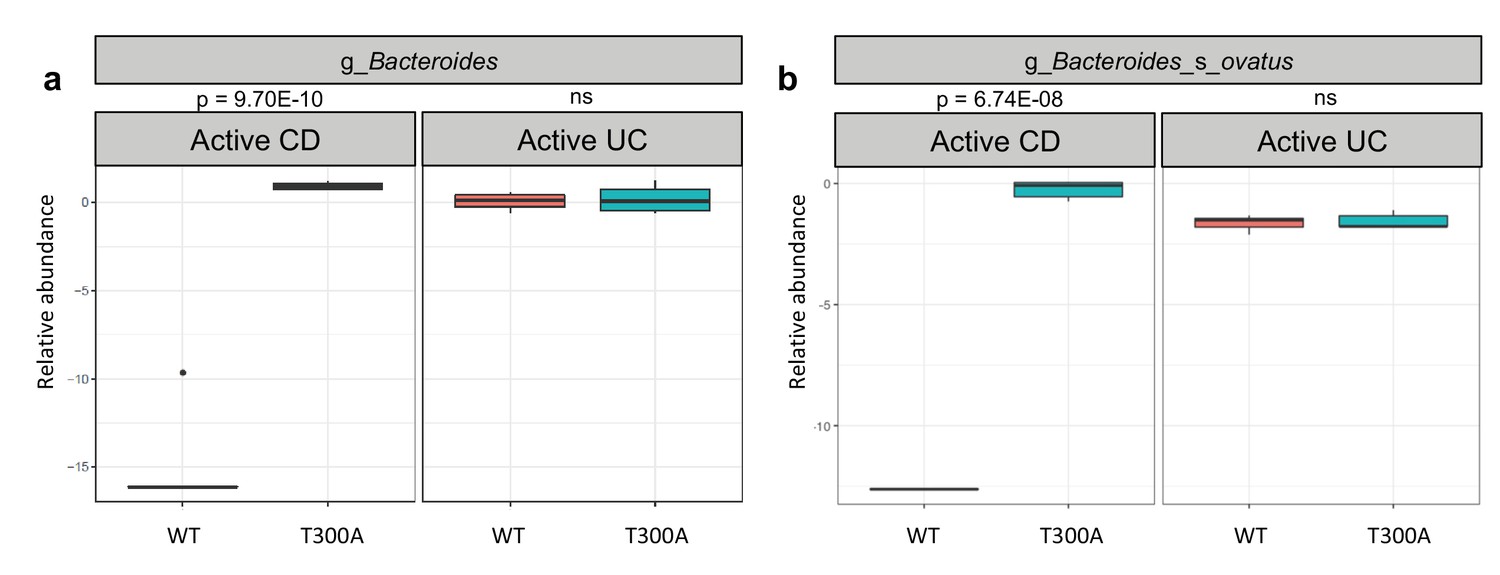
T300A alters gut microbiota composition in GF mice associated with human stool.
Metagenomic population analysis (MetaPhlAn) on stool samples (four wk time point) from WT vs. T300A GF mice associated with human IBD stool samples (a) Box plot of the genus Bacteroides from stool samples from mice associated with active CD or active UC stool samples. (b) Box plot of B. ovatus from stool samples from mice associated with active CD or active UC stool samples. P-values were generated using Benjamini-Hochberg false discovery rate. (a, b) Y-axis is log10 relative abundance.
Figure 5 with 1 supplement
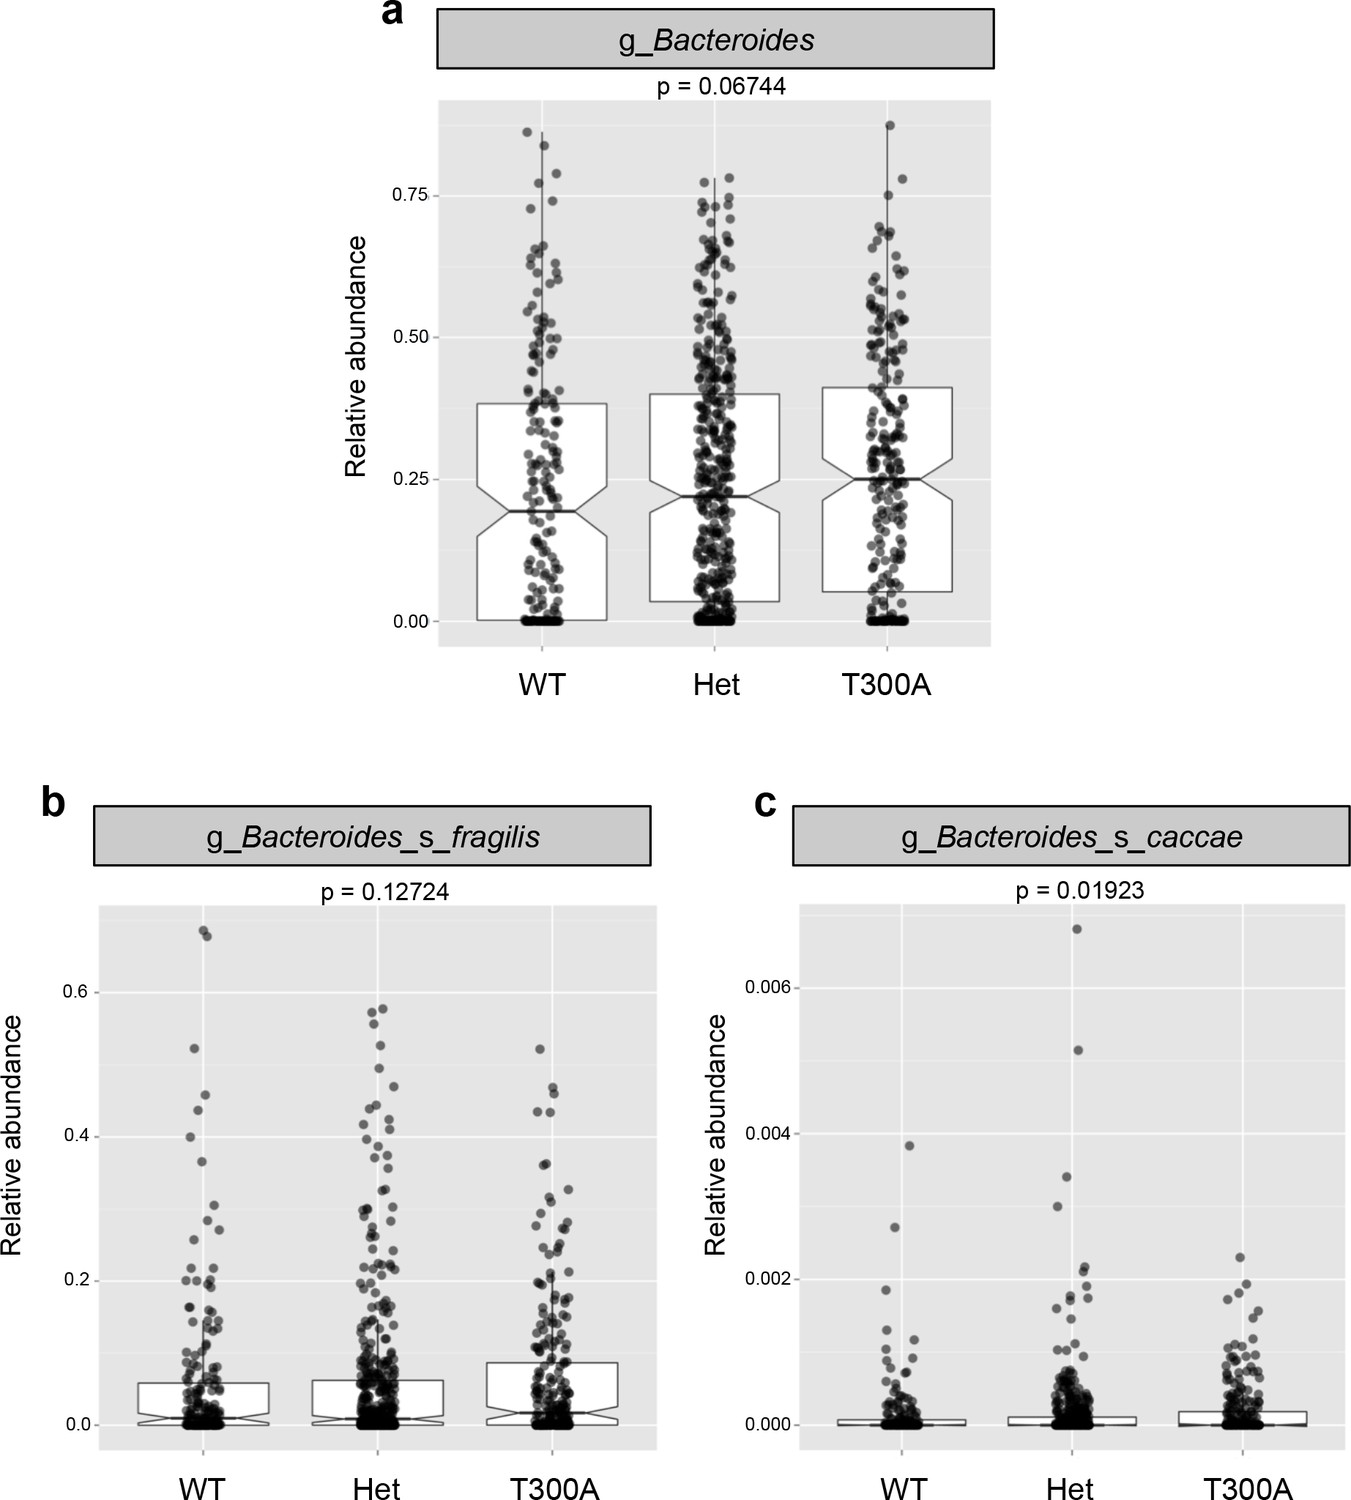
The presence of T300A in humans increases Bacteroides.
16S rRNA gene amplicon data from human stool samples from Jostins et al. 2012 (Jostins et al., 2012) cohort were analyzed for differences in the microbiota associated with the presence (T300A – GG), absence (WT – AA) or heterozygous (Het – AG) genotype. (g = genus, s = species). (a) Relative abundance of Bacteroides. (b) Relative abundance of B. fragilis. (c) Relative abundance of B. caccae.
Figure 5—figure supplement 1
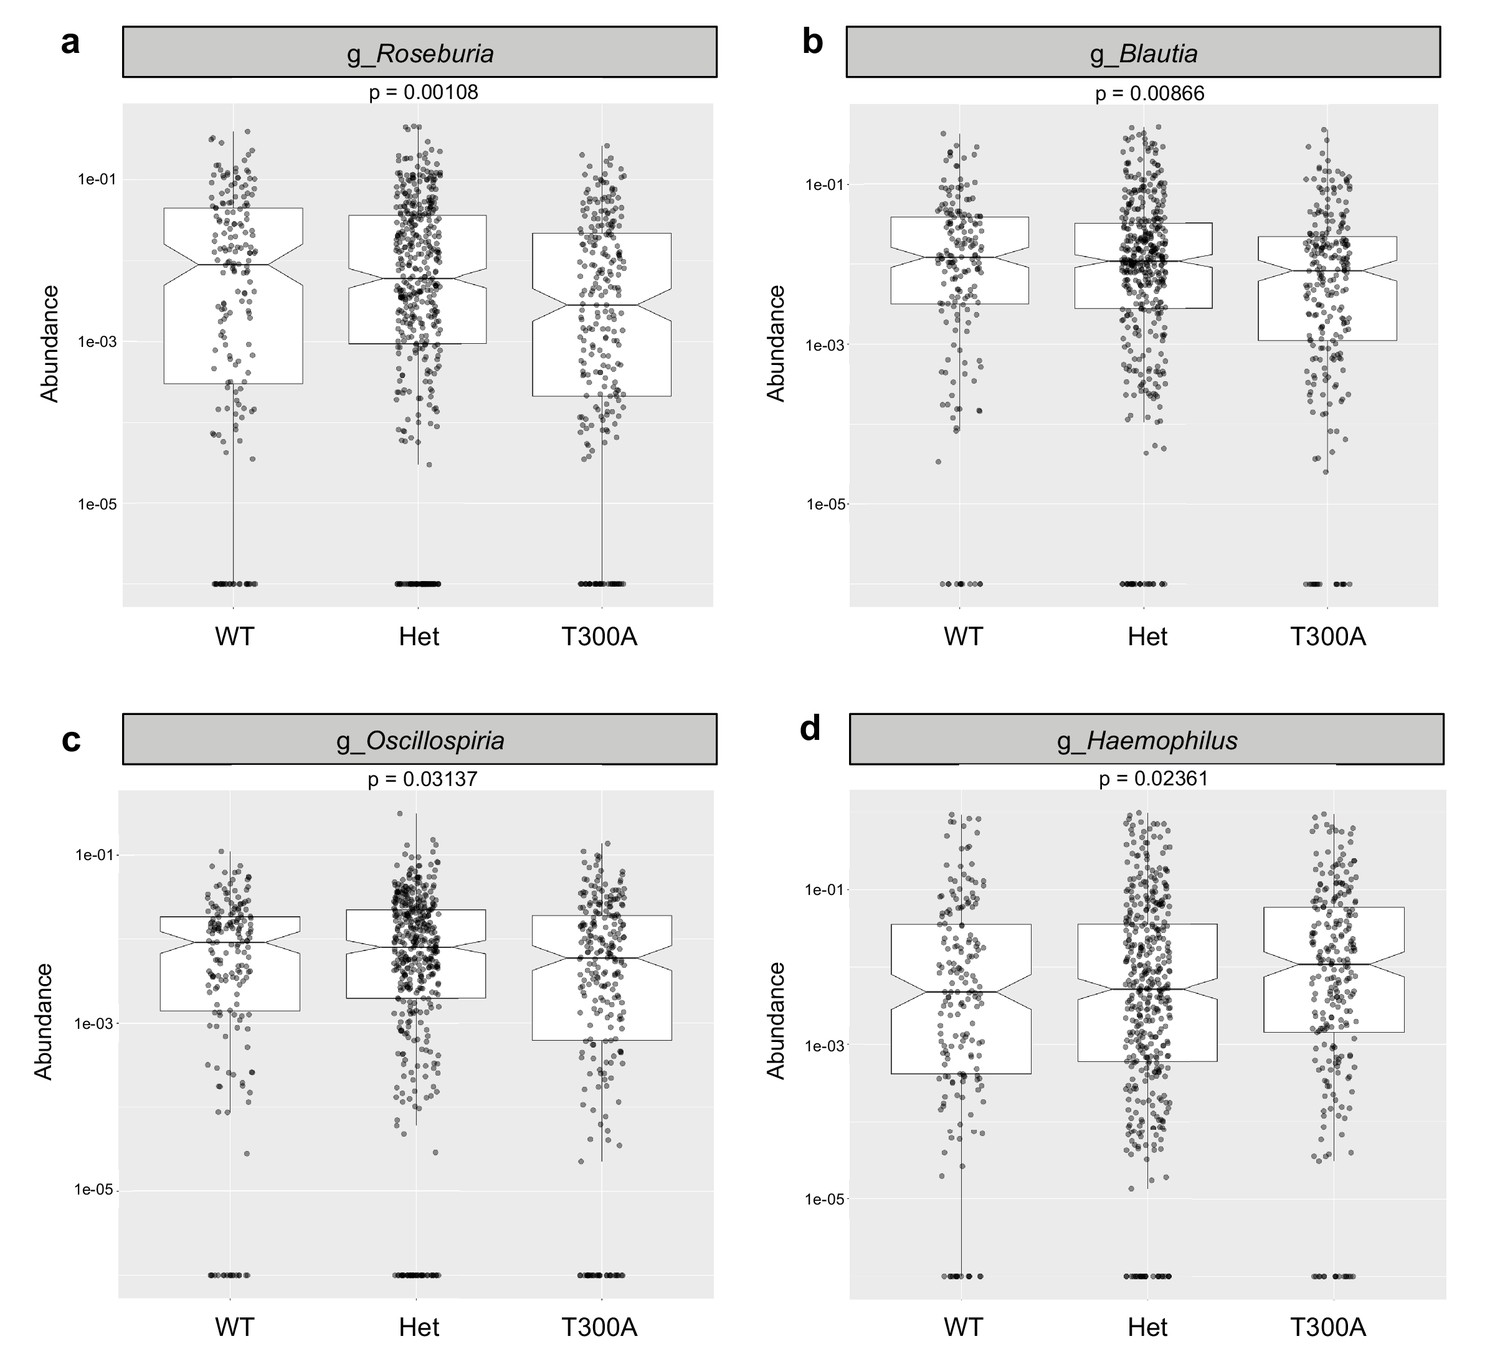
The presence of T300A in humans reduces Clostrida spp. and increases Gammaproteobacteria.
16S rRNA gene amplicon data from human stool samples from Jostins et al. 2012 (Xavier and Podolsky, 2007) cohort were analyzed for differences in the microbiota associated with the presence (T300A – GG), absence (WT – AA) or heterozygous (Het – AG) genotype. (g = genus). (a) Relative abundance of Roseburia. (b) Relative abundance of Blautia. (c) Relative abundance of Oscillospira. (d) Relative abundance of Haemophilus.
Figure 6 with 3 supplements

Alterations in T cell and myeloid cell populations in the gut of T300A mice associated with stool from patients with active Crohn’s disease.
LP flow cytometry of T and myeloid cell populations from GF mice associated with 50 mg of frozen stool from a patient with Crohn’s disease (CD, WT n = 6 and T300A n = 6) or ulcerative colitis (UC, WT n = 7 and T300A n = 5) for four wks. T cells gated as the frequency of RORγt+ (Th17), T-bet+ (Th1), Foxp3+ (Treg) or GATA-3+ (Th2) cells out of CD3+CD4+ cells and myeloid cells gated as the frequency of CD11c+MHCII+ cells out of CD45+ cells (conventional DCs), CD11b-CD103+ cells out of CD11c+MHCII+ cells (tolerogenic DCs), CD11b+GR-1int cells out of CD45+ cells (neutrophils), and CD11b+GR-1hi cells out of CD45+ cells (inflammatory monocytes). CD3+CD4+ and myeloid cell populations were gated on single, live, CD45+ lymphocytes. (a) GF +CD stool colonic LP T cells (top) and myeloid cells (bottom) (b) GF +UC stool colonic LP T cells (top) and myeloid cells (bottom). (c) GF +CD stool ileal LP T cells (top) and myeloid cells (bottom) (d) GF +UC stool ileal LP T cells (top) and myeloid cells (bottom). Data are plotted as the mean ± SEM. ns = not significant. Mann-Whitney U test.
-
Figure 6—source data 1
Source data for Figure 6.
- https://doi.org/10.7554/eLife.39982.015
Figure 6—figure supplement 1
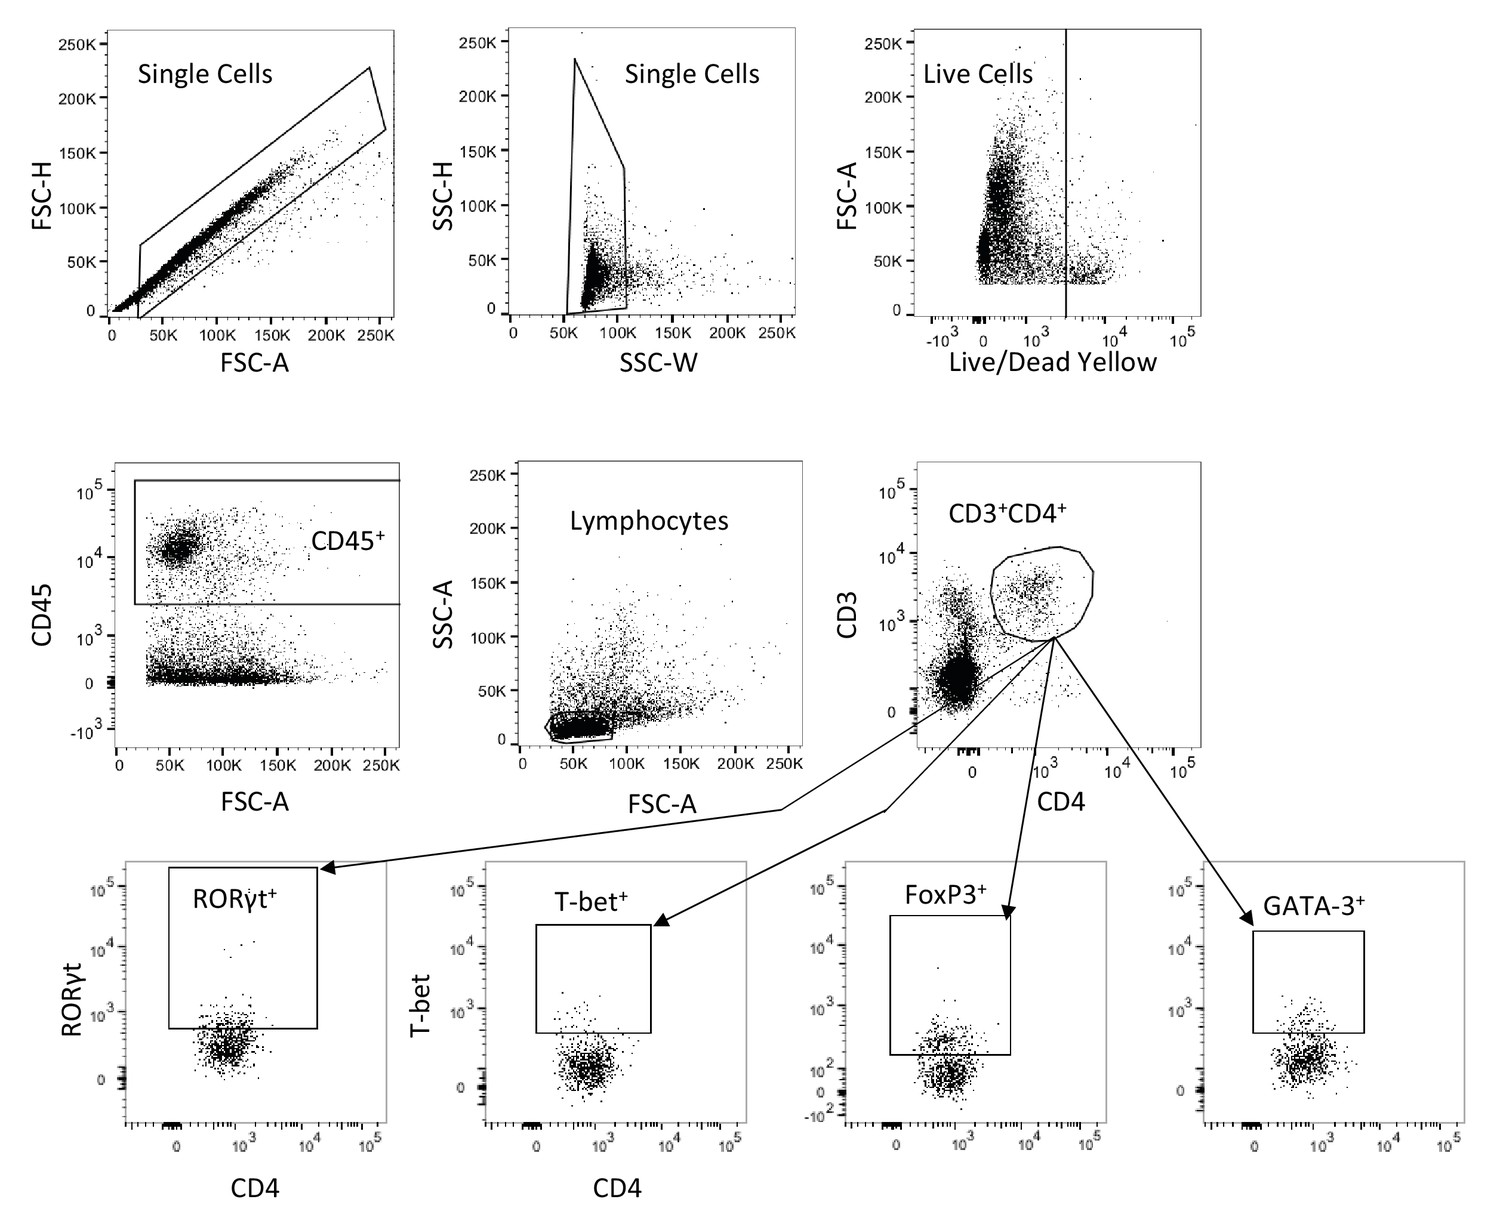
Representative T cell flow cytometry gating strategy.
LP cells from either the colon or ileum (distal 10 cm of the small intestine) were gated on single cells, live cells, CD45+, lymphocytes, CD3+CD4+ and finally T-bet+ out of CD3+CD4+ and RORγt+ out of CD3+CD4+.
Figure 6—figure supplement 2
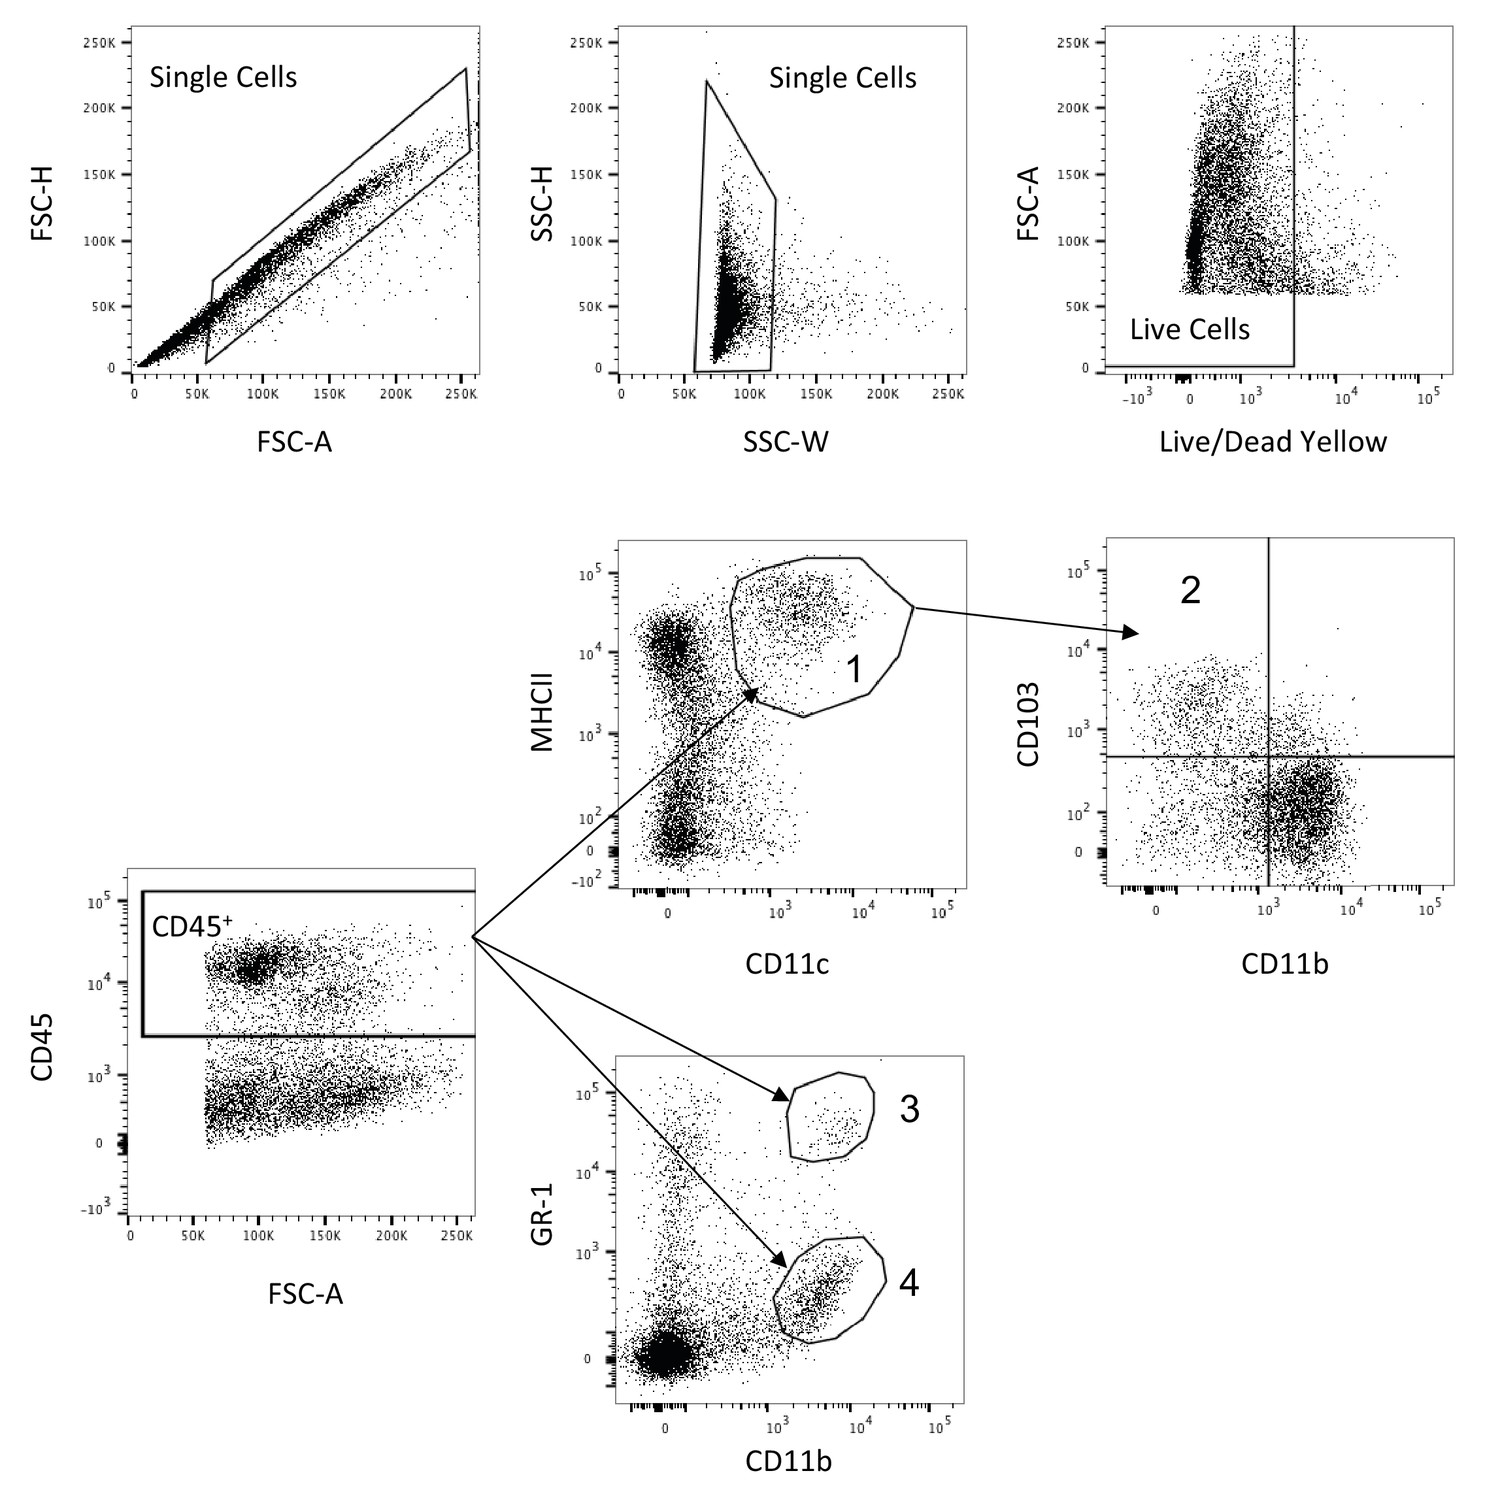
Representative myeloid cell flow cytometry gating strategy.
LP cells from either the colon or ileum (distal 10 cm of the small intestine) were gated on single cells, live cells and CD45+. CD11c+MHCII+ (1 - conventional DCs) were gated out of CD45+ cells and CD11b-CD103+ cells (2 - tolerogenic DCs) were gated out of CD11c+MHCII+ cells. CD11b+GR-1hi (3 - inflammatory monocytes) and CD11b+GF-1int (4 - neutrophils) were gated out of CD45+.
Figure 6—figure supplement 3
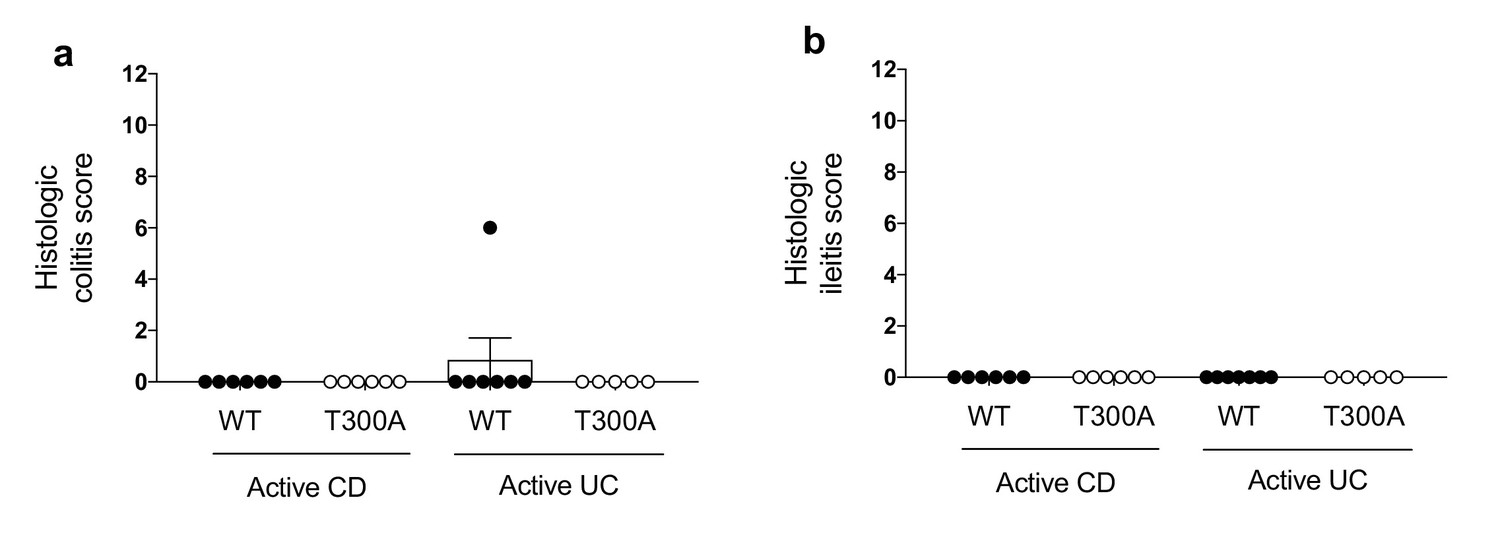
Microbiota changes and immune infiltration occur in the absence of disease.
WT and T300A gnotobiotically housed mice were associated with human stool samples from patients with either active CD (WT n = 6, T300A n = 6) or active UC (WT n = 7, T300A n = 5). Histologic colitis/ileitis scores were calculated by grading monocyte infiltration, epithelial hyperplasia, epithelial injury and polymorphonuclear (PMN) cell infiltration, all from 0 to 3 for a maximum total score of 12. Histologic colitis scores from (a) the colon and (b) the ileum from mice associated with stool from patients with active CD or active UC. Data are plotted as mean ± SEM.
Figure 7
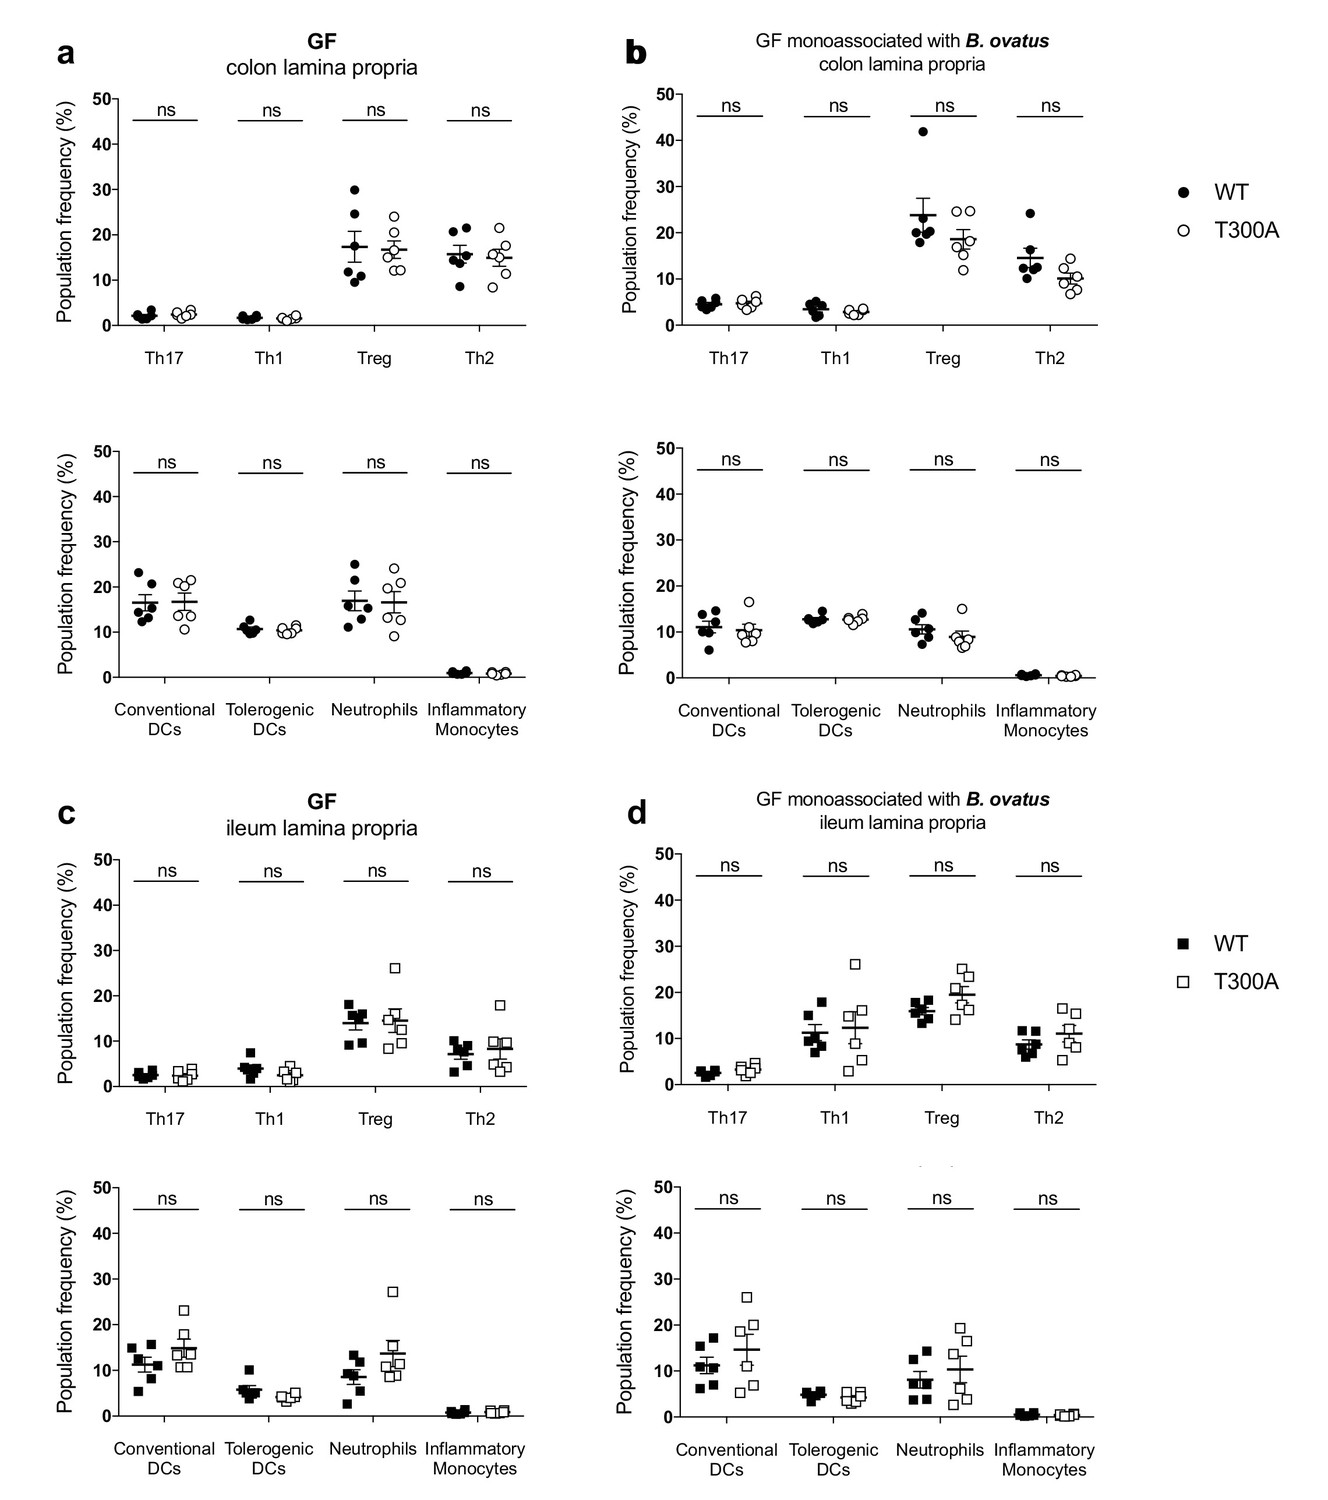
No change in immune cell population frequency in the gut of GF or GF mice monoassociated with B. ovatus 8483.
LP flow cytometry of T and myeloid cell populations from GF mice (WT n = 6, T300A n = 6) or GF mice associated with ~109 CFU of B. ovatus 8483 for three wks (WT n = 6, T300A n = 6). T cell populations are gated as the frequency of RORγt+ (Th17), T-bet+ (Th1), Foxp3+ (Treg) or GATA-3+ (Th2) cells out of CD3+CD4+ cells and myeloid cell populations are gated as the frequency of CD11c+MHCII+ cells out of CD45+ cells (conventional DCs), CD11b-CD103+ cells out of CD11c+MHCII+ cells (tolerogentic DCs), CD11b+GR-1int cells out of CD45+ cells (neutrophils), and CD11b+GR-1hi cells out of CD45+ cells (inflammatory monocytes). CD3+CD4+ and myeloid cell populations were gated on single, live, CD45+ lymphocytes. (a) GF colonic LP T cells (top) and myeloid cells (bottom) (b) GF +B. ovatus 8483 colonic LP T cells (top) and myeloid cells (bottom). (c) GF ileal LP T cells (top) and myeloid cells (bottom) (d) GF +B. ovatus 8483 ileal LP T cells (top) and myeloid cells (bottom). Data are plotted as the mean ± SEM. ns = not significant. Mann-Whitney U test.
-
Figure 7—source data 1
Source data for Figure 7.
- https://doi.org/10.7554/eLife.39982.017
Figure 8 with 2 supplements
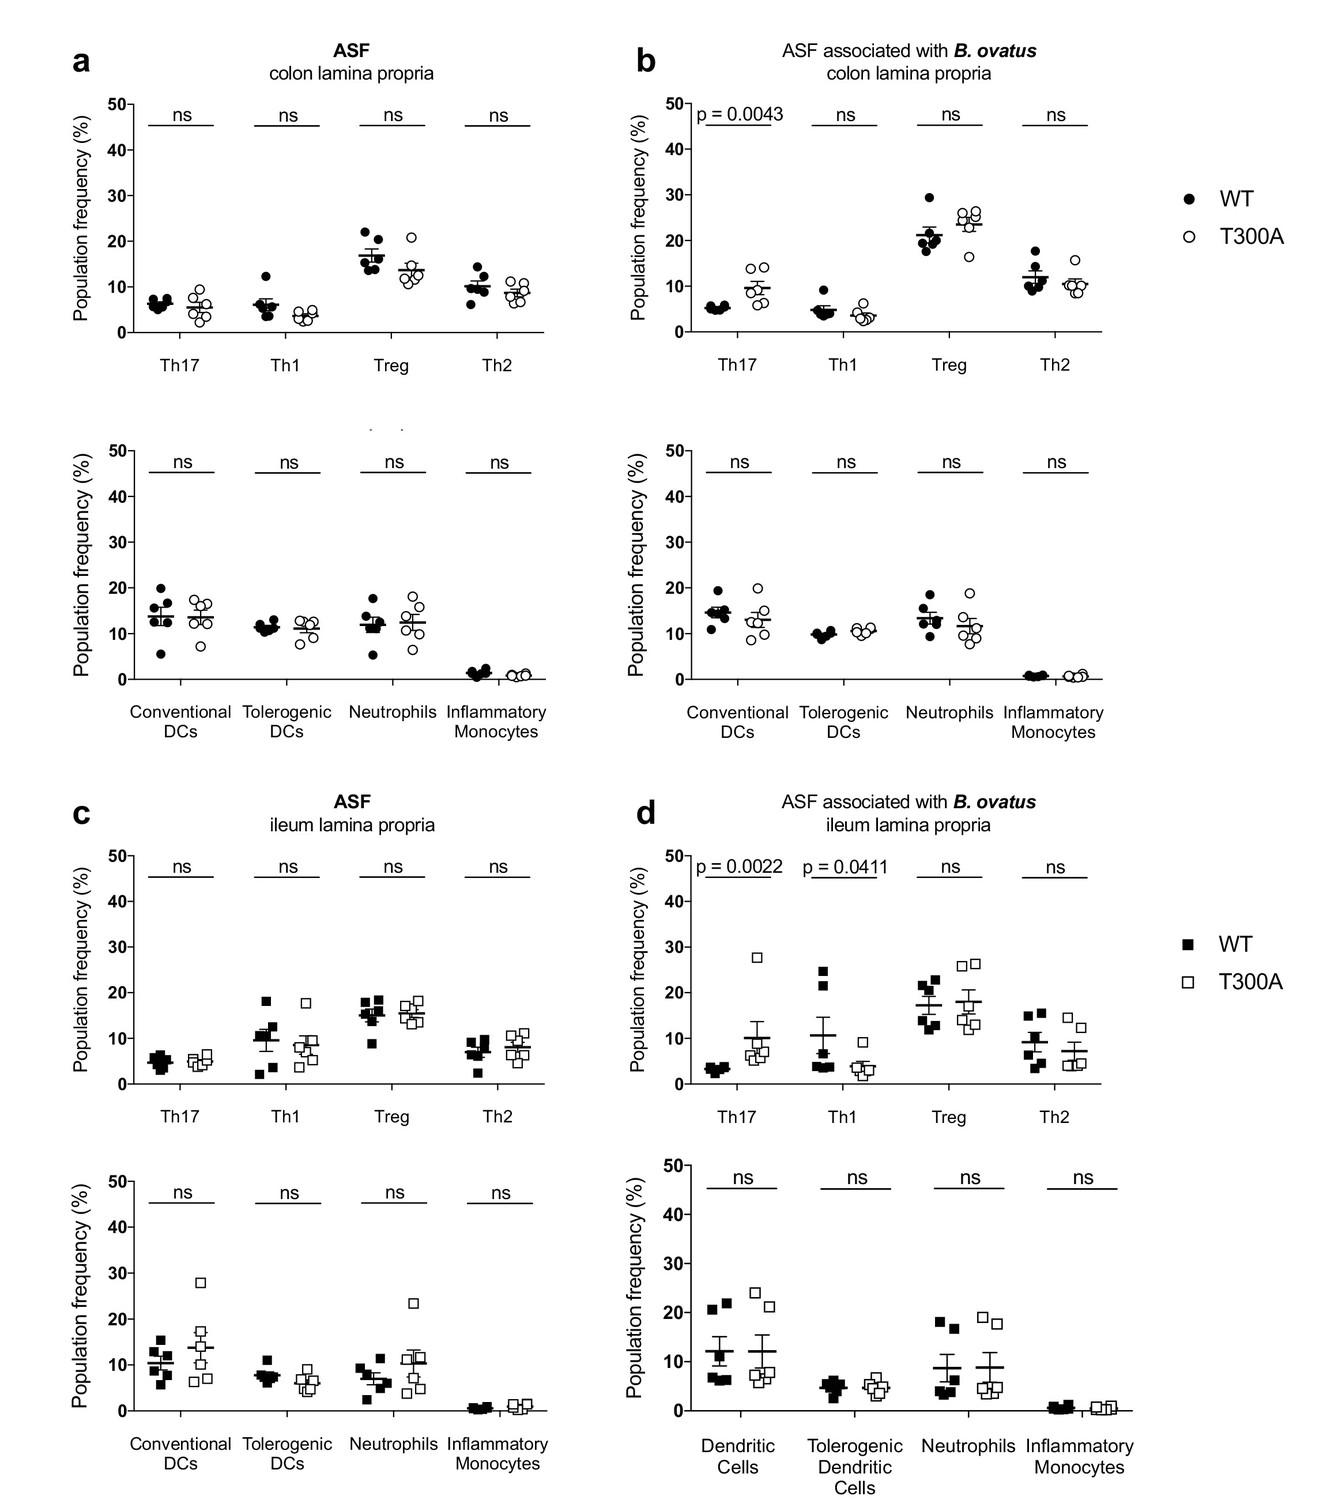
Increased frequency of Th17 cells in the gut of T300A ASF mice associated with B. ovatus 8483.
LP flow cytometry of T cell and myeloid cell populations from ASF mice (WT n = 6 and T300A n = 6) or ASF mice associated with ~109 CFU of B. ovatus 8483 for 3 weeks (WT n = 6 and T300A n = 6). T cells gated as the frequency of RORγt+ (Th17), T-bet+ (Th1), Foxp3+ (Treg) or GATA-3+ (Th2) cells out of CD3+CD4+ cells and myeloid cell gated as the frequency of CD11c+MHCII+ cells out of CD45+ cells (conventional DCs), CD11b-CD103+ cells out of CD11c+MHCII+ cells (tolerogentic DCs), CD11b+GR-1int cells out of CD45+ cells (neutrophils), and CD11b+GR-1hi cells out of CD45+ cells (inflammatory monocytes). CD3+CD4+ cell and myeloid cell populations were gated on single, live, CD45+ lymphocytes. (a) ASF colonic LP T cells (top) and myeloid cells (bottom) (b) ASF +B. ovatus 8483 colonic LP T cells (top) and myeloid cells (bottom). (c) ASF ileal LP T cells (top) and myeloid cells (bottom) (d) ASF +B. ovatus 8483 ileal LP T cells (top) and myeloid cells (bottom). Data are plotted as the mean ± SEM. ns = not significant. Mann-Whitney U test.
-
Figure 8—source data 1
Source data for Figure 8.
- https://doi.org/10.7554/eLife.39982.021
Figure 8—figure supplement 1
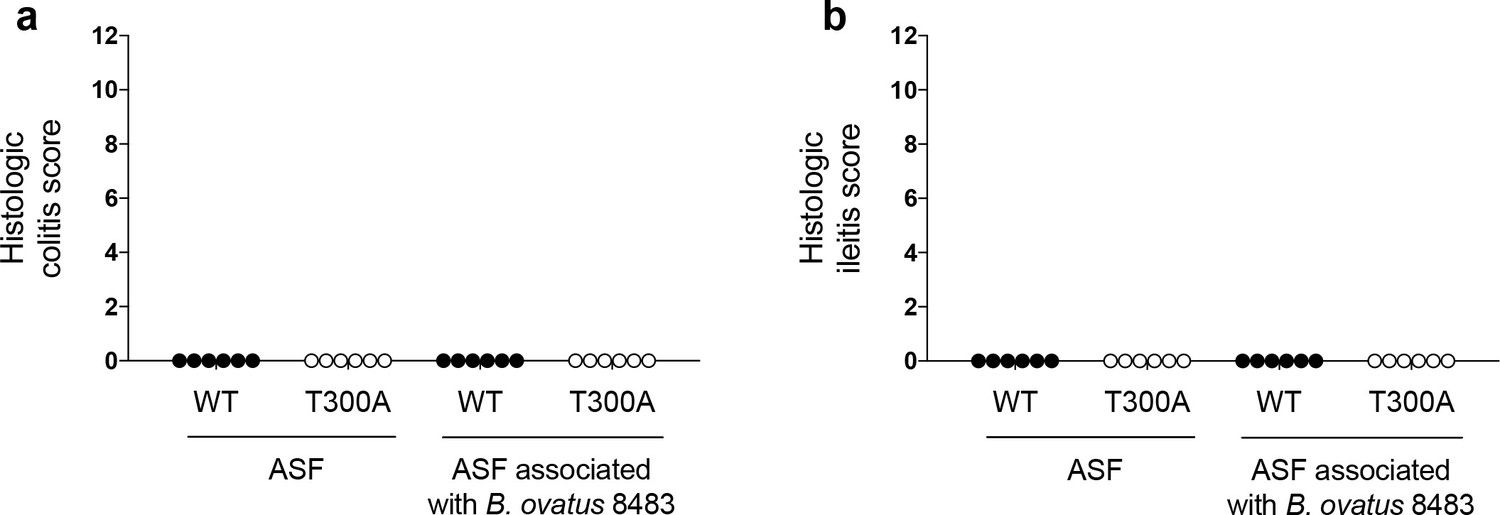
Immune infiltration in ASF mice associated with B. ovatus occurs in the absence of disease.
WT and T300A ASF mice were associated ~109 CFU of B. ovatus 8483 for 3 weeks (WT n = 6, T300A n = 6). Histologic colitis/ileitis scores were calculated by grading monocyte infiltration, epithelial hyperplasia, epithelial injury and polymorphonuclear (PMN) cell infiltration, all from 0 to 3 for a maximum total score of 12. Histologic colitis/ileitis scores from (a) the colon and (b) the ileum of ASF mice or ASF mice associated with B. ovatus 8483. Data are plotted as mean ± SEM.
Figure 8—figure supplement 2
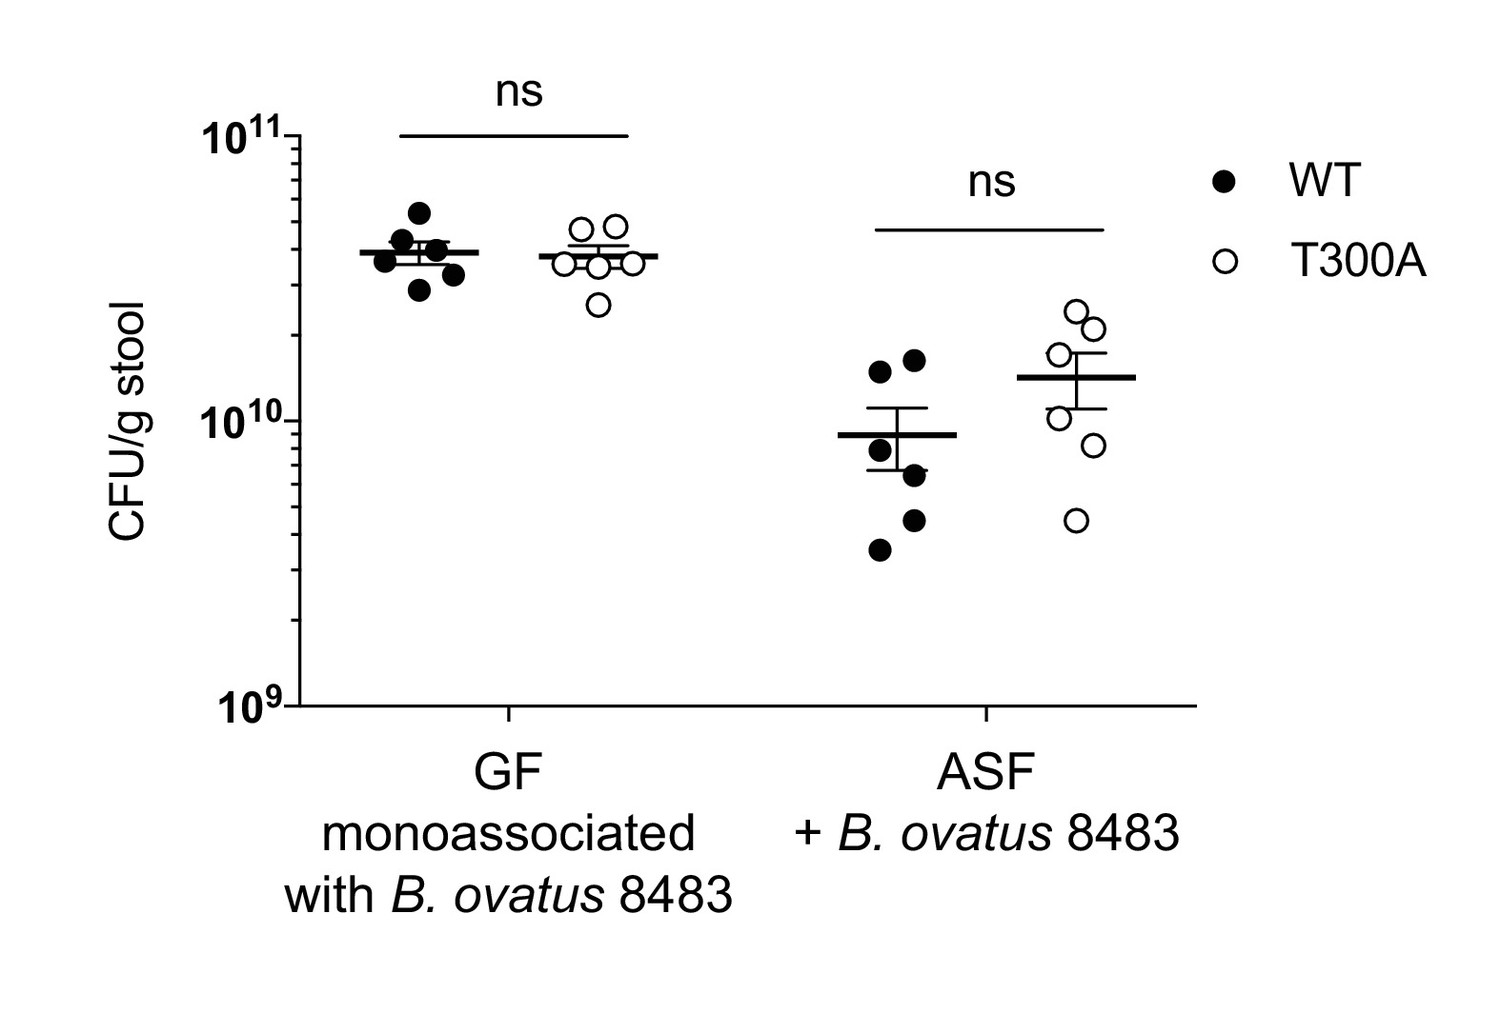
No differences in colonization levels of B. ovatus 8483 in GF or ASF mice.
GF mice (WT n = 6, T300A n = 6) or ASF mice (n = 6, T300A n = 6) were associated with ~109 CFU of B. ovatus 8483 for three wks. Fecal samples were taken at the three wk timepoint and CFU/g stool was calculated. ns = not significant. Two-way ANOVA with Tukey’s post-hoc test.
Figure 9
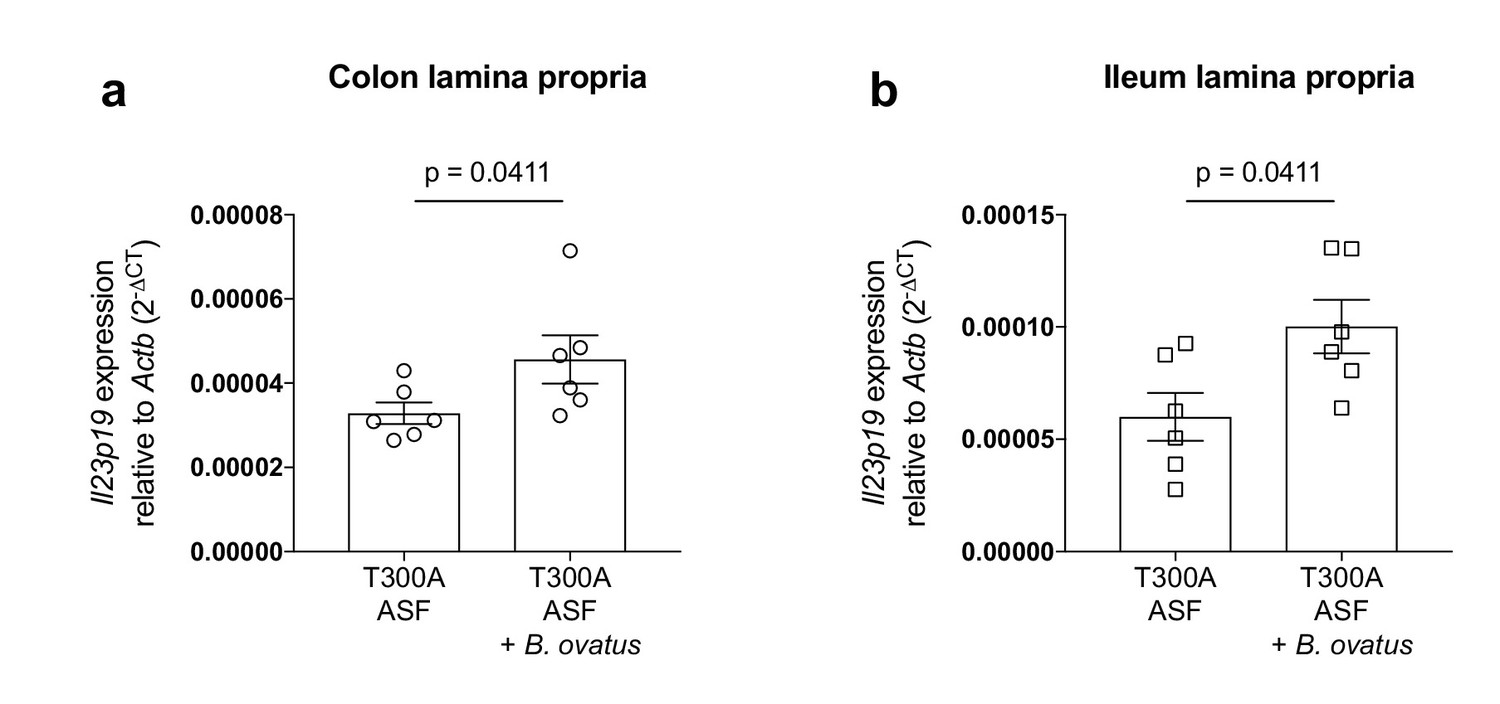
Increased expression of Il23p19 in the lamina propria from the colon and ileum of T300A ASF mice associated with B. ovatus 8483.
Expression of Il23p19 by qPCR from colon (a) and ileum (b) LP cells isolated from ASF T300A mice or ASF T300A mice associated with B. ovatus 8483.
-
Figure 9—source data 1
Source data for Figure 9.
- https://doi.org/10.7554/eLife.39982.023
Tables
Key resources table
| Reagent type (species) or resource | Designation | Source or reference | Identifiers | Additional information |
|---|---|---|---|---|
| Genetic reagent (M. musculus) | T300A | PMID: 24821797 | Dr. Ramnik Xavier (Broad/MIT/Harvard) | |
| Chemical compound, drug | Dextran Sulfate Sodium | MP Biomedicals | 0216011050–50 g | |
| , strain back ground | Bacteroides ovatus | ATCC | 8483 | |
| Software, algorithm | Picard suite | https://broadinstitute.github.io/picard/command-line-overview.html | RRID:SCR_006525 | |
| Software, algorithm | MetaPhlAn | PMID 26418763 | RRID:SCR_004915 | |
| Software, algorithm | HUMAnN2 | http://huttenhower.sph. harvard.edu/humann2 | RRID:SCR_016280 | |
| Software, algorithm | Rtsne | https://cran.r-project.org/web/packages/Rtsne/index.html | RRID:SCR_016342 | |
| Software, algorithm | PICRUSt | PMID 23975157 | RRID: SCR_016856 | |
| Software, algorithm | HUMAnN | PMID 22719234 | RRID:SCR_014620 | |
| Software, algorithm | Prism 7.0b | https://www.graphpad.com/scientific-software/prism/ | RRID:SCR_002798 | |
| Software, algorithm | limma | PMID 25605792 | RRID:SCR_010943 | |
| Software, algorithm | QIIME | PMID: 20383131 | RRID:SCR_008249 | |
| Antibody | Rat anti mouse CD16/32 (clone 93) | Biolegend | Cat. #: 101310, RRID:AB_2103871 | Flow cytometry (FC), FC receptor block 1:100 |
| Antibody | Rat anti mouse CD45 (clone 30-F11) | Biolegend | Cat. #: 103114, RRID:AB_312979 | FC, PE/Cy7 1:100 |
| Antibody | Armenian hamster anti mouse CD3e (clone 145–2 C11) | Biolegend | Cat. #: 100334, RRID:AB_2028475 | FC, Pacific Blue 1:100 |
| Antibody | Rat anti mouse CD4 (clone GK1.5) | Biolegend | Cat. #: 100414, RRID:AB_312981 | FC, APC/Cy7 1:100 |
| Antibody | Mouse anti mouse GATA-3 (clone L50-823) | BD Biosciences | Cat. #: 560077, RRID:AB_1645303 | FC, Alexa Fluor 488 1:33 |
| Antibody | Mouse anti mouse Foxp3 (clone 150D) | Biolegend | Cat. #: 320007, RRID:AB_492981 | FC, PE 1:40 |
| Antibody | Rat anti mouse RORgt (clone B2D) | Invitrogen | Cat. #: 17-6981-82, RRID:AB_2573254 | FC, APC 1:40 |
| Antibody | Mouse anti mouse T-bet (clone 4B10) | Biolegend | Cat. #: 644806, RRID:AB_1595488 | FC, PerCP/Cy5 1:33 |
| Antibody | Rat anti mouse CD45 (clone 30-F11) | Biolegend | Cat. #: 103126, RRID:AB_493535 | FC, Pacific Blue 1:100 |
| Antibody | Armenian hamster anti mouse CD11c (clone N418) | Biolegend | Cat. #: 117306, RRID:AB_313775 | FC, FITC 1:200 |
| Antibody | Rat anti mouse CD11b (clone M1/70) | Biolegend | Cat. #: 101228, RRID:AB_893232 | FC, PerCP/Cy5 1:200 |
| Antibody | Rat anti mouse I-A/I-E (MHCII) (clone M5/114.15.2) | Biolegend | Cat. #: 107630, RRID:AB_2069376 | FC, PE/Cy7 1:200 |
| Antibody | Rat anti mouse Ly-6G/Ly-6C (GR-1) (clone RB6-8C5) | Biolegend | Cat. #: 108412, RRID:AB_313377 | FC, APC 1:200 |
| Antibody | Armenian hamster anti mouse CD103 (clone 2E7) | Invitrogen | Cat. #: 12-1031-82, RRID:AB_465799 | FC, PE 1:100 |
| CommercialAssay or Kit | Live/Dead Fixable Yellow Dead Cell Stain | Thermo Fisher Scientific | Cat. #: L34959 | FC |
| Commercial Assay or Kit | Quant-iT PicoGreen dsDNA Assay Kit | Thermo Fisher Scientific | Cat. #: P11496 | DNA quantification |
| Commercial Assay or Kit | Nextera XT DNA Library Preparation Kit | Illumina | Cat. #: FC-131–1096 | Sequencing libraries |
| Commercial Assay or Kit | Agilent DNA 1000 Kit | Agilent Technologies | Cat. #: 5067–1504 | Insert sizes |
| Other | RNAlater | Sigma | Cat. #: R0901-500ML | Solution for stool sample collection |
| Commercial Assay or Kit | QIAamp 96 PowerFecal QIAcube HT Kit (5) | QIAGEN | Cat. #: 51531 | Stool DNA extraction |
| Commercial Assay or Kit | Allprep DNA/RNA 96 Kit | QIAGEN | Cat. #: 80311 | Stool DNA extraction |
| Other | IRS solution | QIAGEN | Cat. #: 26000-50-2 | Solution for stool DNA extraction |
| Commercial Assay or Kit | PowerBead Plates, Glass | QIAGEN | Cat. #:27500–4-EP-BP | Stool DNA extraction |
| Other | Brucella agar sheeps blood/hemin/vitamin K plates | Hardy Diagnostics | Cat. #: A30 | Bacterial culture plates |
| Commercial Assay or Kit | Rneasy Mini Kit | QIAGEN | Cat. #: 74106 | RNA isolation |
| Commercial Assay or Kit | iScript cDNA synthesis kit | Bio-Rad | Cat. #:1708891 | cDNA synthesis |
Additional files
-
Supplementary file 1
Mouse caging and metadata for Figures 1–8.
Mouse genotype, age (wks), sex, cage, experiment description and figure are listed above. Mice housed together have the same cage number.
- https://doi.org/10.7554/eLife.39982.024
-
Transparent reporting form
- https://doi.org/10.7554/eLife.39982.025
Download links
A two-part list of links to download the article, or parts of the article, in various formats.
Downloads (link to download the article as PDF)
Open citations (links to open the citations from this article in various online reference manager services)
Cite this article (links to download the citations from this article in formats compatible with various reference manager tools)
The Crohn’s disease polymorphism, ATG16L1 T300A, alters the gut microbiota and enhances the local Th1/Th17 response
eLife 8:e39982.
https://doi.org/10.7554/eLife.39982


