Listeria monocytogenes cell-to-cell spread in epithelia is heterogeneous and dominated by rare pioneer bacteria
- Howard Hughes Medical Institute, Stanford University, United States
- University of California San Diego, United States
- Stanford University, United States
Figures
Figure 1 with 1 supplement
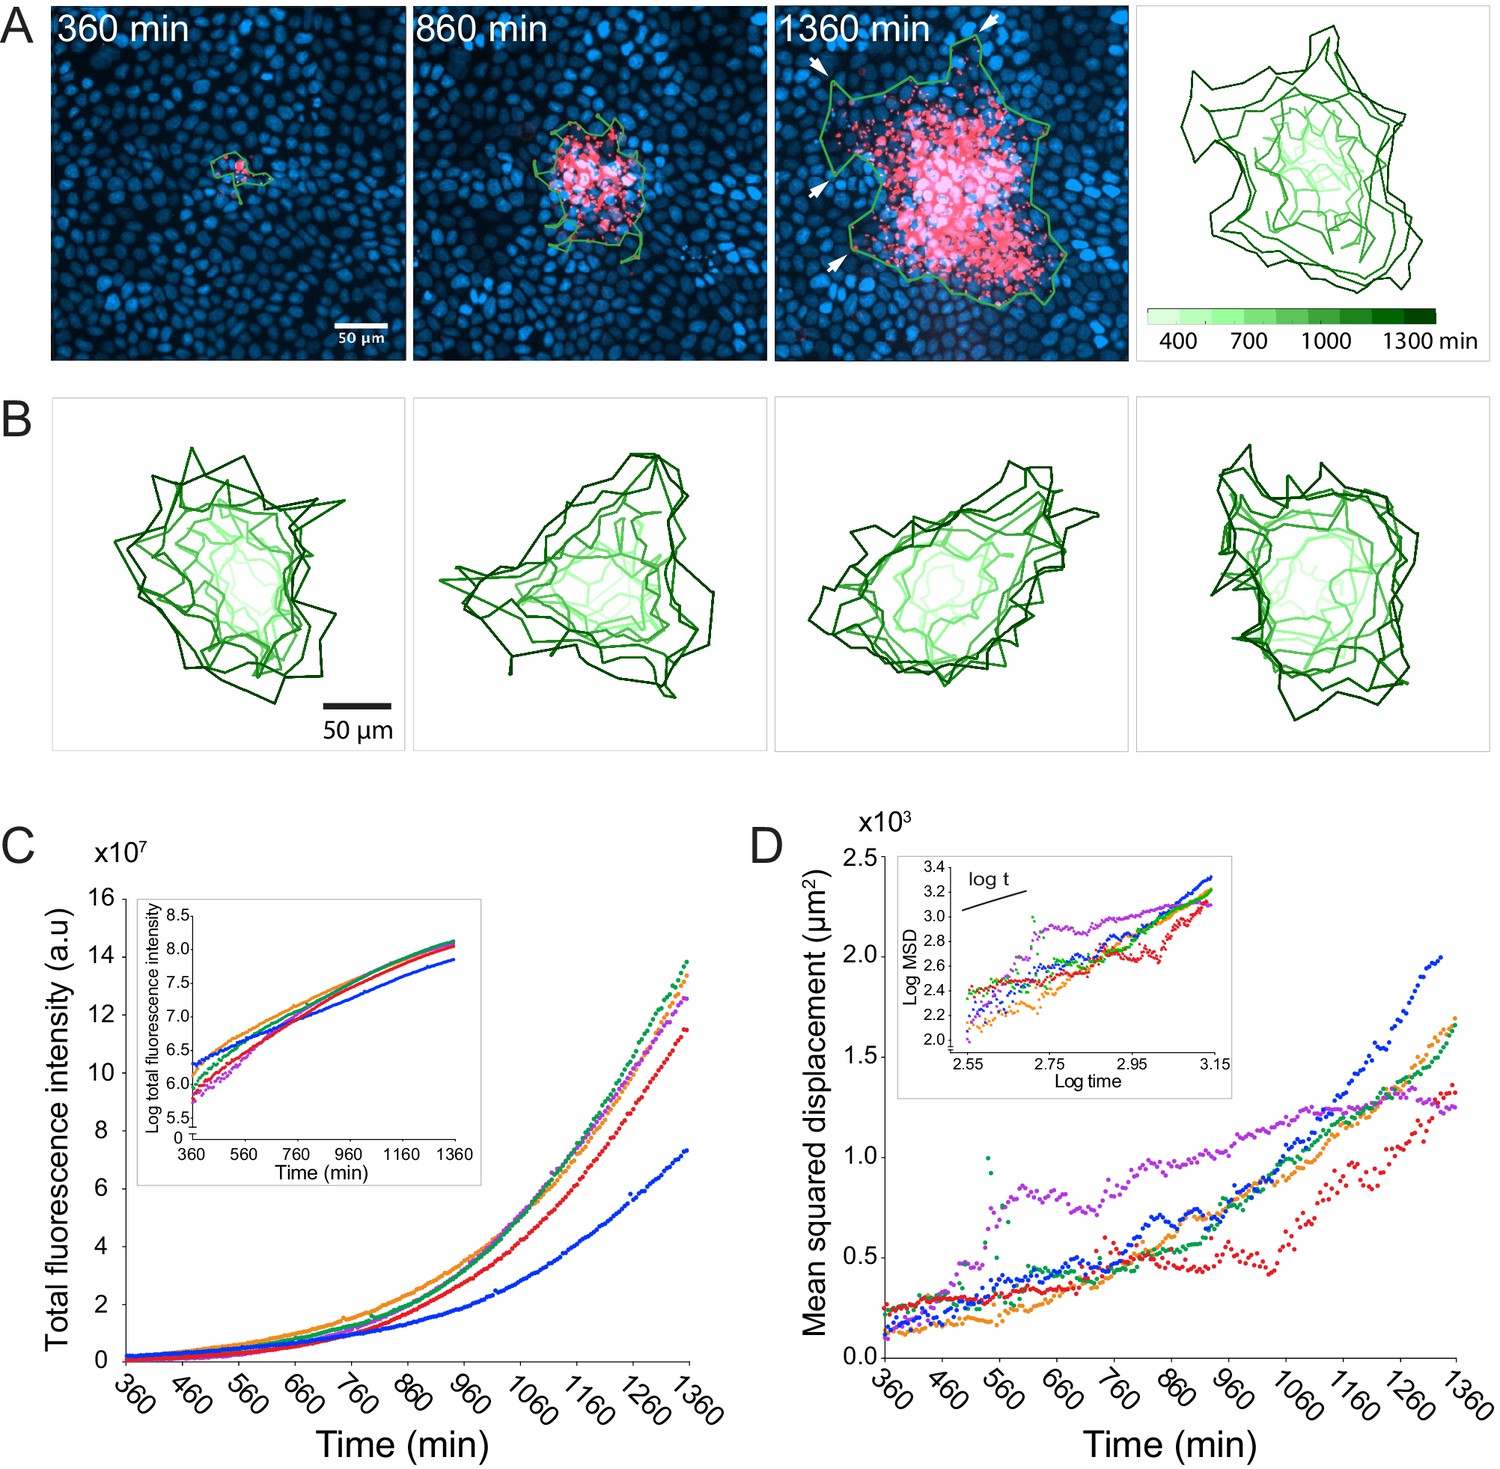
L. monocytogenes spreads anisotropically through a polarized, confluent MDCK cell monolayer.
(A) On the left three panels, micrographs show nuclei (Hoechst, blue) and intracellular bacteria (mTagRFP, red) at three different time points post-infection. Green boundaries fully enclose all bacteria. On the fourth panel, boundaries (shades of green) depict the progression of the infection focus boundaries at nine evenly-spaced time points (see colorbar). (B) Examples of four different foci boundaries through time. (C) Quantification of total bacterial fluorescence intensity as a function of time for five different foci. Semi-log plot in inset. (D) Quantification of mean squared displacement (MSD) as a function of time for five different foci. Log-log plot in inset where short solid line indicates linear scaling. For C and D, each focus is represented by a different color.
-
Figure 1—source data 1
This spreadsheet contains the total fluorescence intensity (a.u.), mean squared displacement (µm2), doubling time (min), and diffusion coefficient (µm2/min) data used to generate the graphs in Figure 1C and D, and in Figure 1—figure supplement 1A, B and C.
- https://doi.org/10.7554/eLife.40032.005
Figure 1—figure supplement 1

Doubling times (min) and effective diffusion coefficients (µm2/min) for live microscopy data are uncorrelated.
(A) Data quantifying the total bacterial fluorescence intensity as a function of time. Data points were fit to an exponential function (solid black line). Growth rate was estimated from the exponential fit. Semi-log plot in inset: log-transformed data in red and linear fit in black. (B) Data quantifying the log of MSD as a function of the log of time. Log-transformed data points, from start to ~2.95 log time, were fit to a linear function (solid black line). Effective diffusion coefficient was calculated by dividing the slope of the linear fit by 4. Short solid line indicates linear scaling. (C) Data plotting effective diffusion coefficients versus doubling times, which were calculated by dividing the natural log of 2 by the growth rate. Each data point represents an independent time-lapse movie. Each shape represents an independent experiment. Red data point corresponds to the data shown in panels A and B.
Figure 2 with 4 supplements
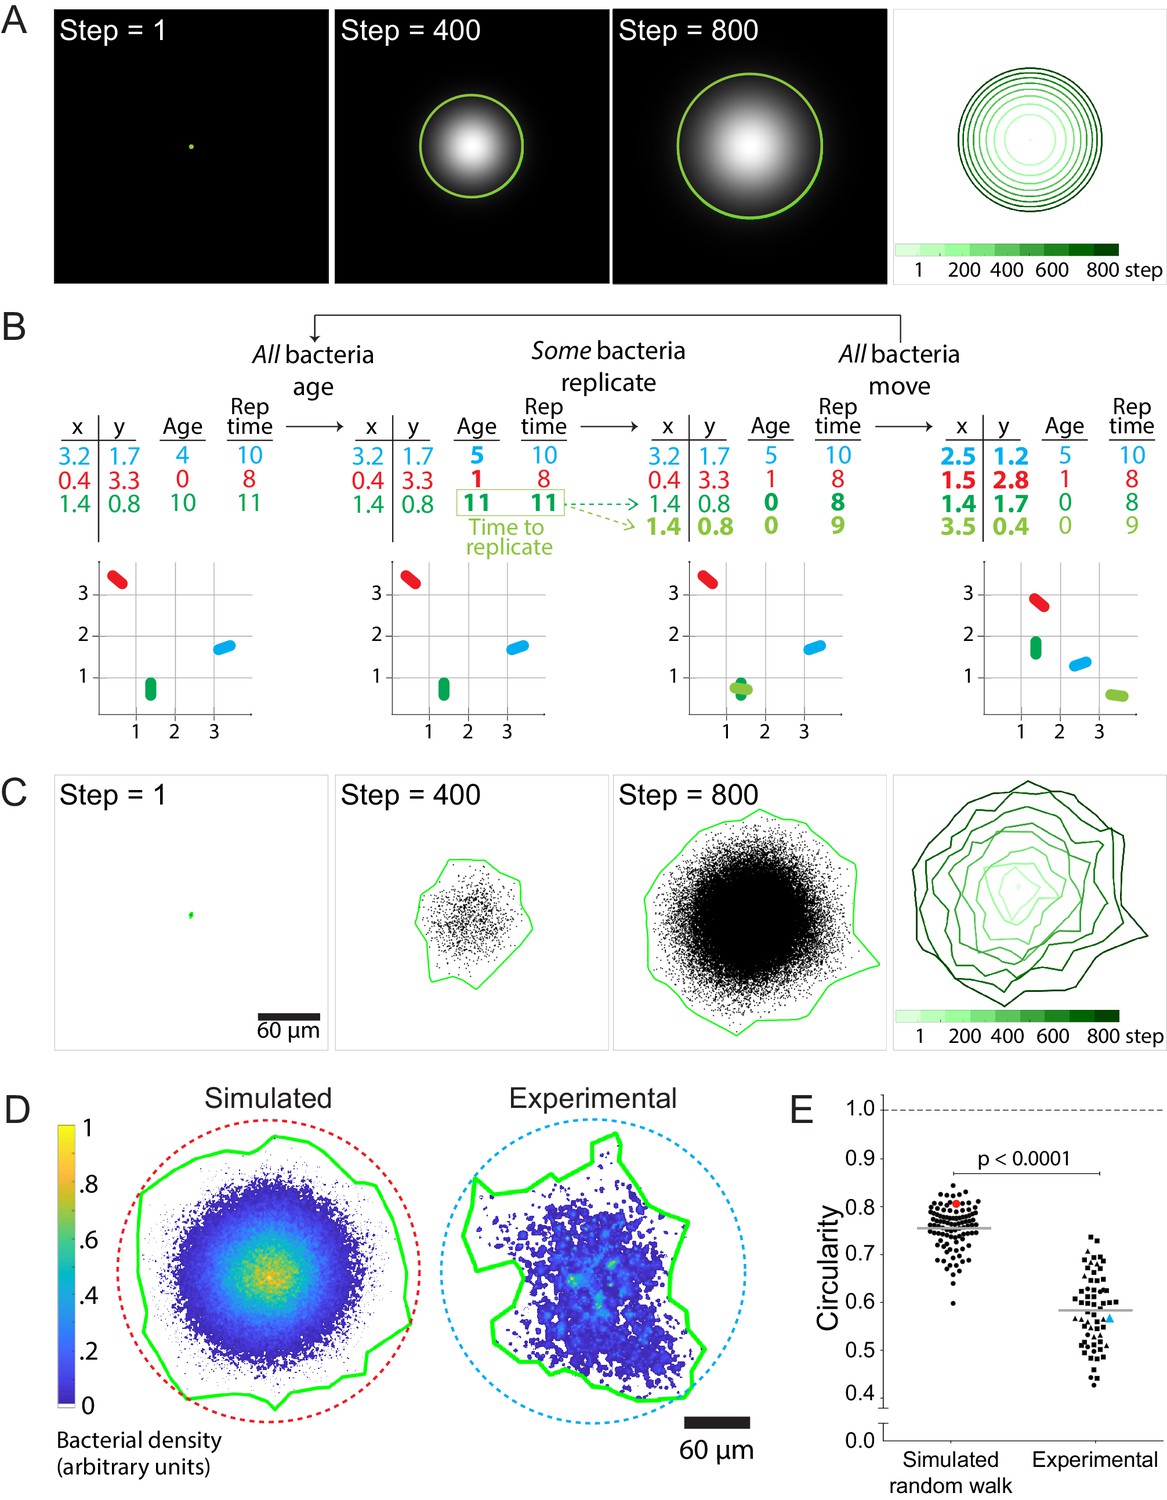
Stochastic simulations of cell-to-cell spread via random walks are inconsistent with observed shape of infection foci.
(A) On the left three panels, images depict the solution of the reaction-diffusion equation at three different time steps. Green boundaries enclose the brightest 90% of pixels. On the fourth panel, boundaries (shades of green) depict the progression of the shape of the differential equation solution at nine evenly-spaced time steps (see colorbar). (B) Schematic of stochastic simulation. Each bacterium, depicted by a different color, is represented by a location in Cartesian coordinates, age, and replication time. A bacterium replicates when its age catches up with its replication time. Bacteria take steps that are normally distributed and scaled by an effective diffusion coefficient D, and they replicate according to a replication rate k. (C) The left three panels depict three time steps of a random walk stochastic simulation where D = 1 and k = 1. Each simulated bacterium is depicted by a data point. Green boundaries fully enclose all data points. On the fourth panel, boundaries (shades of green) depict the progression of a simulated focus boundaries at nine evenly-spaced time steps. (D) Representative simulated focus convolved with the L. monocytogenes point spread function (left). Representative experimental focus (right). Green boundaries fully enclose all bacteria. Circular dashed lines represent the smallest circles that fully enclose green boundaries. Colorbar indicates bacterial density. (E) Data quantifying infection foci circularity of simulated data versus experimental data. For experimental data, each shape depicts an independent experiment. Horizontal bars indicate the mean. p-Value was calculated with the non-parametric Wilcoxon rank sum test. The red and cyan data points correspond to the simulated and experimental foci, respectively, from panel D.
-
Figure 2—source data 1
This spreadsheet contains circularity data used to generate graphs in Figure E, in Figure 2—figure supplement 2, in Figure 2—figure supplement 3B, and in Figure 2—figure supplement 4A and B.
The spreadsheet also contains simulated data on the number of bacteria, mean squared and estimates of growth rate (k) and effective diffusion coefficient (D) used to generate graphs in Figure 2—figure supplement 1A-D
- https://doi.org/10.7554/eLife.40032.012
Figure 2—figure supplement 1
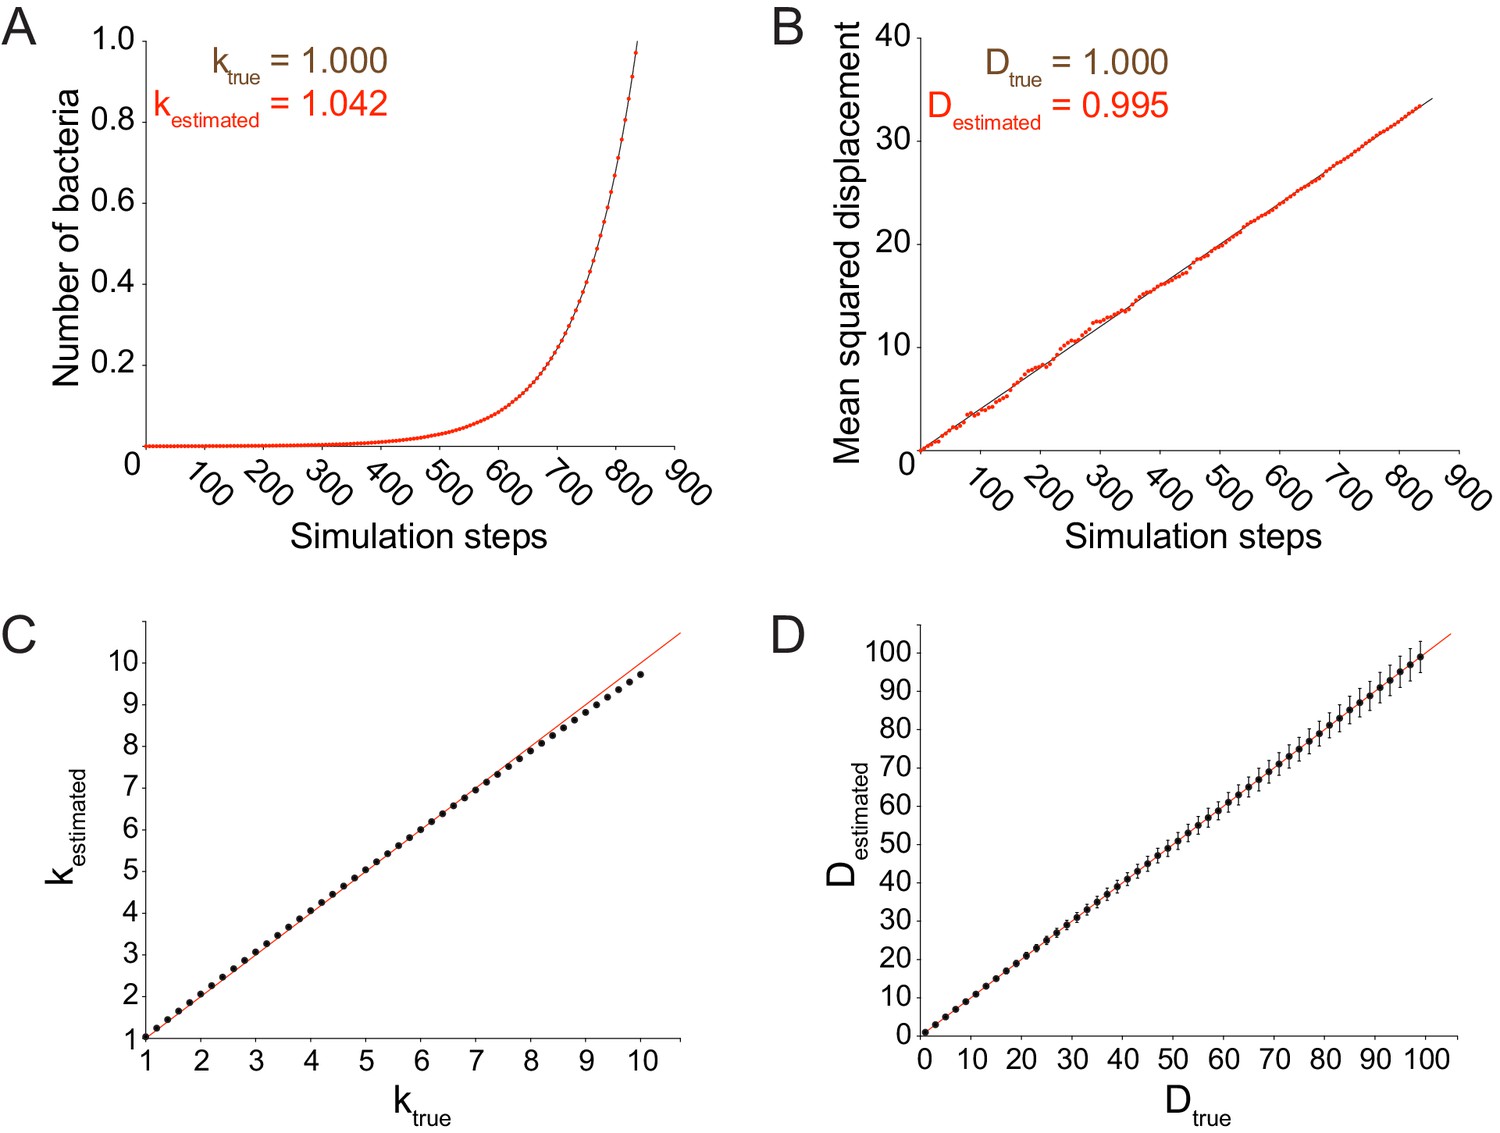
Stochastic model accurately simulates a random walk.
(A) Data quantifying the number of bacteria as a function of simulation steps. Data points were fit to an exponential function plotted as a solid black line. The value of ktrue refers to the exponential growth rate used as an input for the simulation. The value of kestimated was calculated from the exponential fit. (B) Data quantifying the mean squared displacement as a function of simulation steps. Data points were fit to a linear function plotted as a solid black line. The value of Dtrue refers to the value of the effective diffusion coefficient used as an input for the simulation. The value of Destimated was calculated by dividing the slope of the mean squared displacement by 4. (C) Data plotting kestimated versus ktrue. (D) Data plotting Destimated versus Dtrue. For C and D, each data point represents the average estimated value for 1000 independent simulations. Vertical error bars represent the standard deviation. Horizontal axes show the true diffusion coefficient or growth rate value used as an input for the simulations. All simulations from panels A-D were run until 105 bacteria had been accumulated.
Figure 2—figure supplement 2
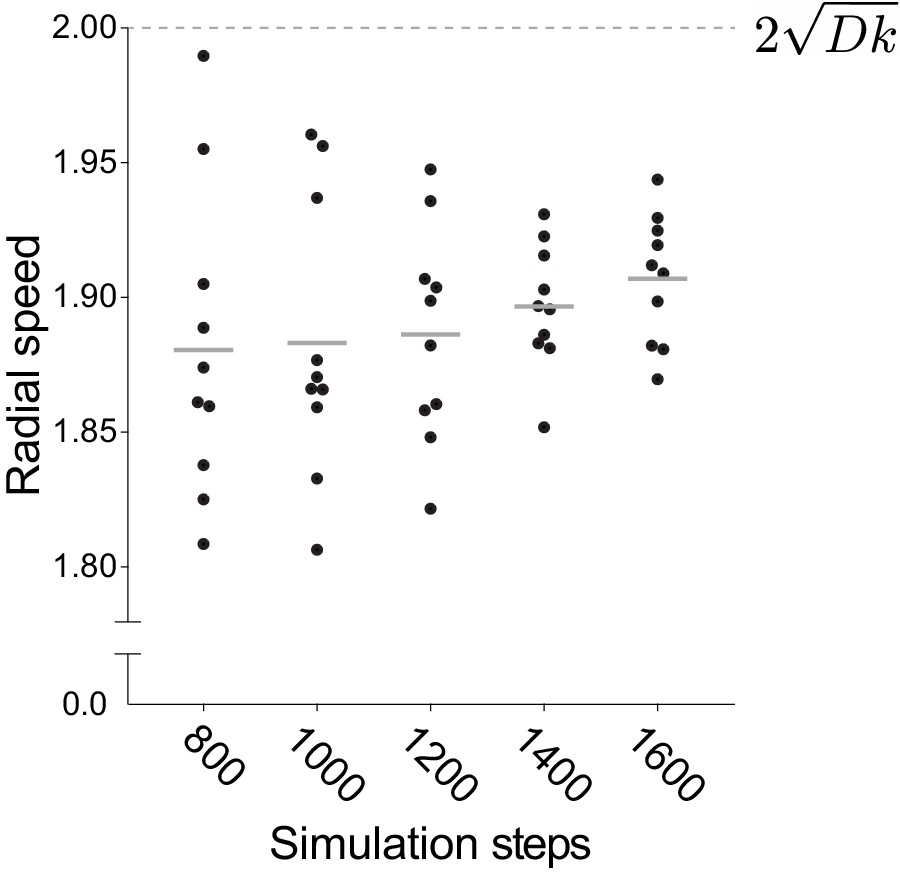
Radial speed of the frontier of infection foci approaches the square root of 2Dk as time increases.
Quantification of the radial speed of the leading edge of simulated infection foci. Speed was calculated from the slope of the square root of the focus area as a function of time. Each data point represents an independent simulation. For these simulations, D = 1 and k = 1. Simulations were run for an indicated number of steps. Horizontal bars indicate the mean. Dashed line shows the speed expected from analytical calculations, that is 2 times the square root of Dk.
Figure 2—figure supplement 3
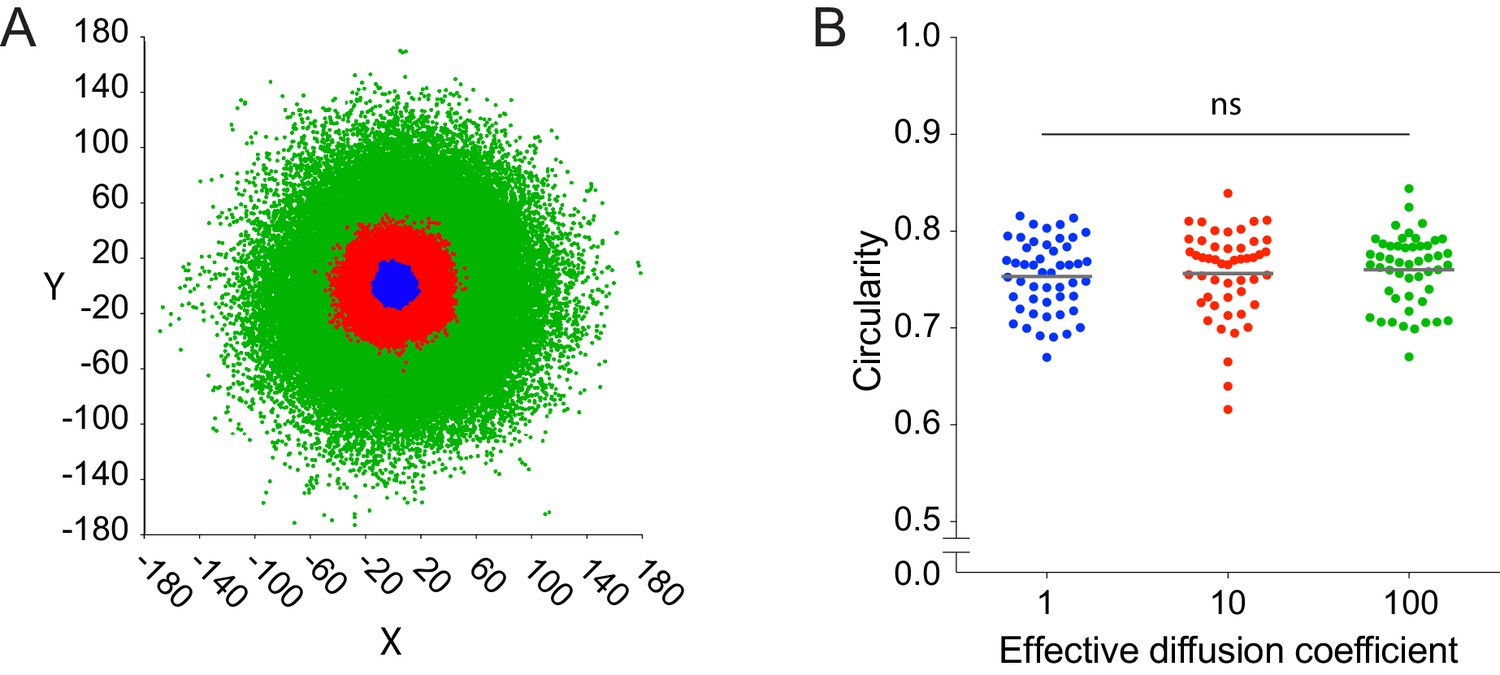
Circularity does not depend on the size of the simulated infection focus.
(A) Schematic of three simulated foci. Each color represents a different infection focus simulated with an effective diffusion coefficient set to 1 (blue), 10 (red), and 100 (green). (B) Quantification of the circularity of simulated infection foci with three diffusion coefficients used in panel A. Fifty independent simulations were run for each effective diffusion coefficient, and each data point represents an independent simulation. For these simulations, k = 1. Horizontal bars indicate the mean. p-value comparing all three groups was calculated with the non-parametric Kruskal-Wallis test.
Figure 2—figure supplement 4
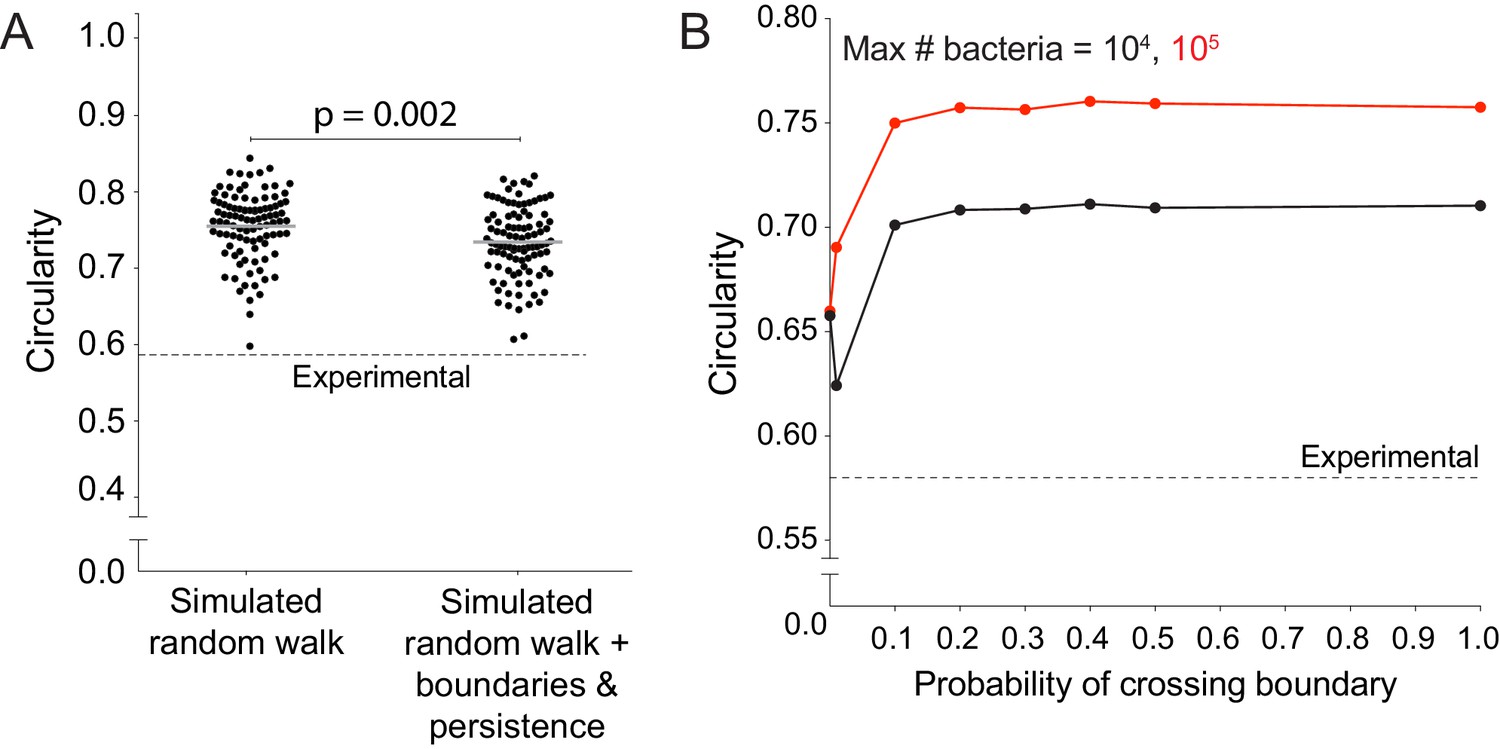
Host cell boundaries and motility persistence do not affect simulated infection focus circularity.
(A) Data quantifying the circularity of simulated infection foci generated by a random walk and a random walk including host cell boundaries and motility persistence. Each data point refers to an independent simulation where D equals 1, k equals 1, the side length of the square host cells equals 1. A total of 100 simulations were run per condition. Each simulation was run until 105 bacteria had been accumulated. Dashed line around 0.58 refers to the mean of the experimental circularity. Solid horizontal bars refer to the mean. p-value was calculated with the non-parametric Wilcoxon rank sum test. (B) Data quantifying circularity of infection foci as a function of probability of crossing host boundaries. Each data point represents the average of 1000 independent simulations each of which was run as described for panel A. Vertical bars, too short to be seen, indicate the standard deviation. Each simulation was run until 104 (black) or 105 (red) bacteria had been accumulated. Dashed line represents the mean circularity of experimental foci.
Figure 3 with 2 supplements

Allowing simulated bacteria to interconvert between pioneer and non-pioneer behavior recapitulates the non-circular phenotype of experimental foci.
(A) On the left nine panels, micrographs show nuclei (Hoechst, blue) and intracellular bacteria (mTagRFP, red). Green lines, which serve as an approximation of host cell boundaries, depict the Voronoi tessellation of the centroids of the host nuclei. White arrows track a single pioneer and its two daughters through time. Start time (leftmost panel) refers to 1255 min post-infection. The right panel shows nuclei (Hoechst, blue) and the pioneer path throughout 180 min. Dots indicate the position of the pioneer at a given time point. Shades of red depict progression of time. Black arrow indicates start position. Orange arrows indicate the location and time of two bacterial replication events. (B) The left three panels depict three time steps of a stochastic simulation where Dslow = 1, Dfast = 100, P = 0.10, and k = 1. Each simulated bacterium is depicted by a data point. Green boundaries fully enclose all data points. On the fourth panel, boundaries (shades of green) depict the progression of a simulated focus boundaries at nine evenly-spaced time steps. (C) Images depicting 105 simulated bacteria at step 800 of stochastic simulations where Dslow = 1, Dfast = 100, k = 1, and probability of becoming a pioneer is depicted in cyan. Green boundaries fully enclose all data points. Circular dashed lines represent the smallest circles that fully enclose the green boundaries. (D) Data quantifying the circularity of experimental (red) and simulated (black) foci at step 800, which, normalized by the replication rate (0.006 min−1), is equivalent to approximately 1360 min of experimental time. For experimental data, each shape depicts an independent experiment. Dashed line at circularity of 0.58 refers to the mean of the experimental circularity. Horizontal bars indicate the mean for each condition. (E) Data quantifying circularity of simulated infection foci as a function of probability of becoming a pioneer. Each data point represents the average of 100 independent simulations. Vertical bars represent the standard deviation. Each color represents a different value of Dfast/Dslow ratio. Dashed line around 0.58 refers to the mean of the experimental circularity. For all simulations, replication rate k equals 1.
-
Figure 3—source data 1
This spreadsheet contains circularity data used to generate graphs in Figure 3D and E, in Figure 3—figure supplement 1B and C, and in Figure 2—figure supplement 2A and B.
This spreadsheet also contains meansquared displacement data used to generate the graph in Figure 3—figure supplement 1A.
- https://doi.org/10.7554/eLife.40032.020
Figure 3—figure supplement 1
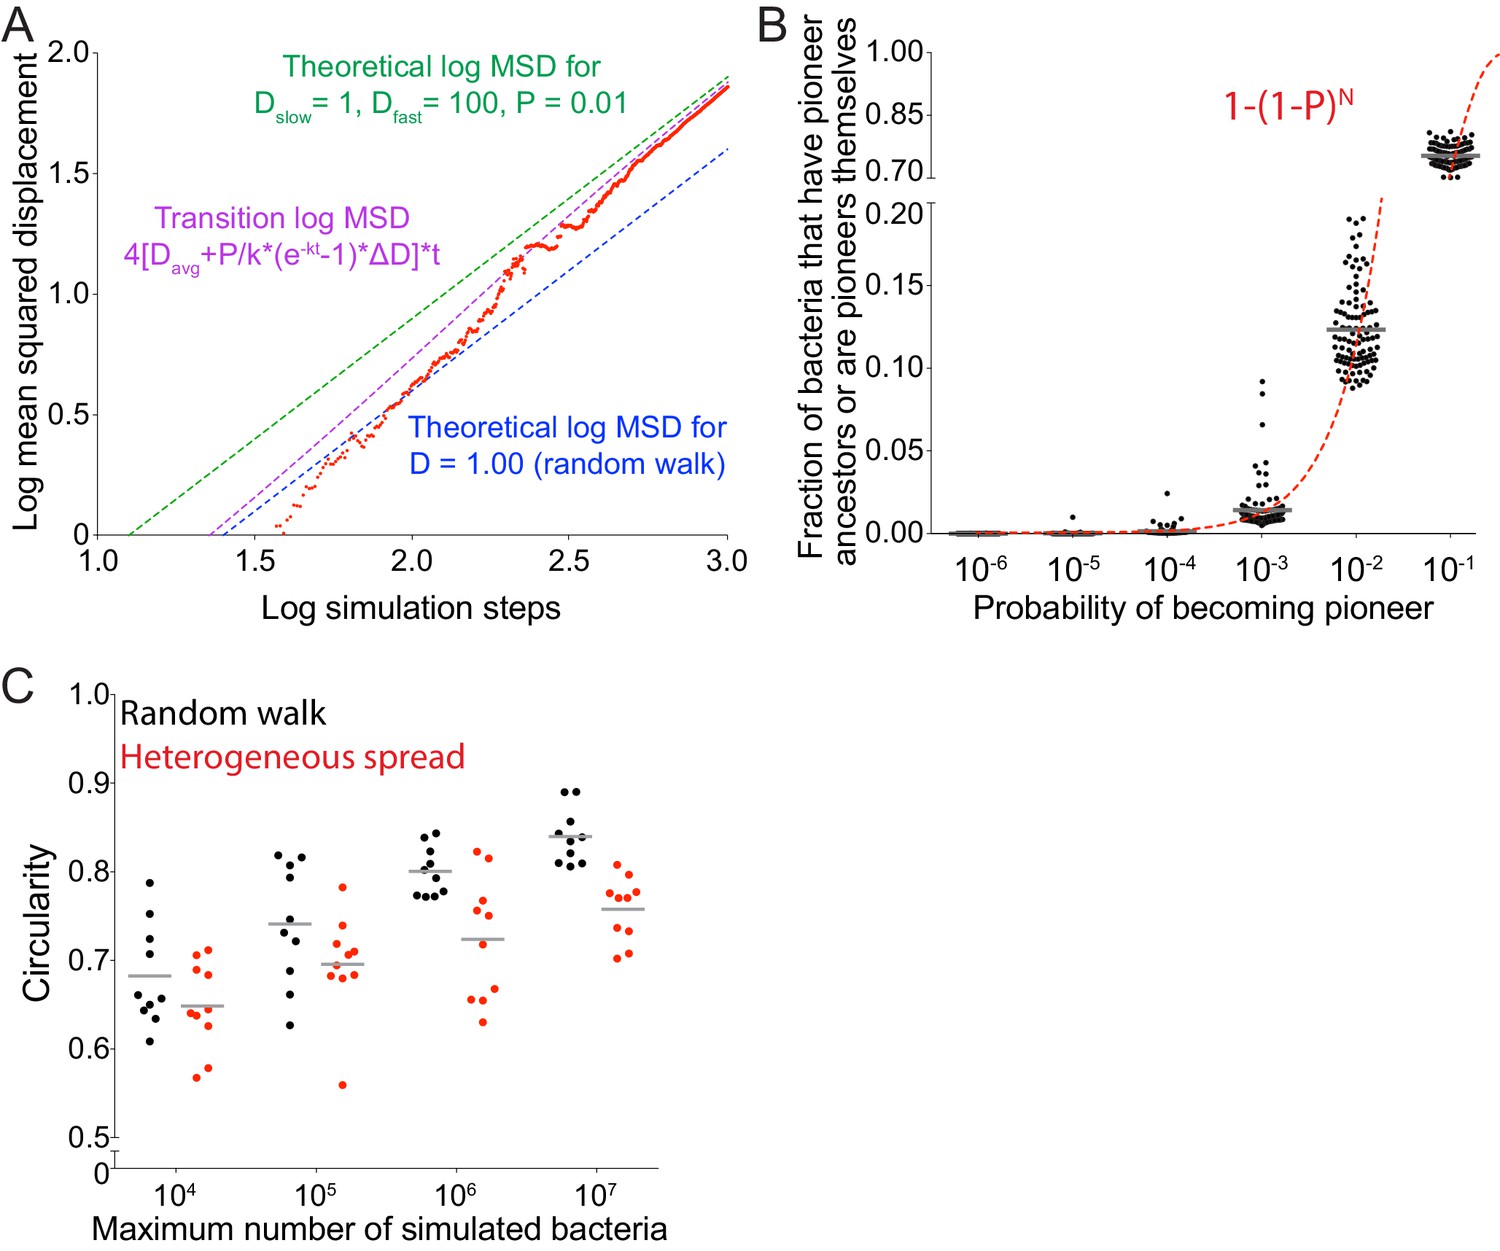
Allowing simulated bacteria to interconvert between pioneer and non-pioneer behavior significantly affects the circularity of the infection focus.
(A) Simulated data (red) quantifying the log mean squared displacement as a function of the log of simulation steps where Dslow = 1, Dfast = 100, and P = 0.01. Dashed magenta line indicates the analytical solution for a population initially composed of non-pioneers, with probability P of becoming a pioneer at each replication event set by the growth rate k. For this expression, Davg equals the average of Dfast and Dslow weighed by P, and ∆D equals Dfast – DSlow. Blue and green dashed lines show the short time asymptotic limit (diffusive spreading with D = 1) and the long time asymptotic limit (diffusive spreading with D = Dslow*(1–P) + Dfast*P = 1.96), respectively. (B) Data quantifying the number of bacteria that either have a fast ancestor or are fast themselves as a function of probability of becoming a pioneer. Each data point represents an independent simulation. A total of 100 simulations were run per condition. Each simulation started with 25 bacteria and was run until 105 bacteria had been accumulated. Dashed line gives analytic solution: 1–(1–P)N where N is the typical number of generations in the simulation (N equals approximately 12). (C) Data quantifying the infection foci circularity as a function of number of bacteria simulated for a random walk (black) or heterogeneous spread where Dfast/Dslow = 100 and probability of becoming a pioneer is 0.10 (red). Each data point represents an independent simulation. For B and C, horizontal bars indicate the mean. For all simulations, replication rate k equals 1.
Figure 3—figure supplement 2
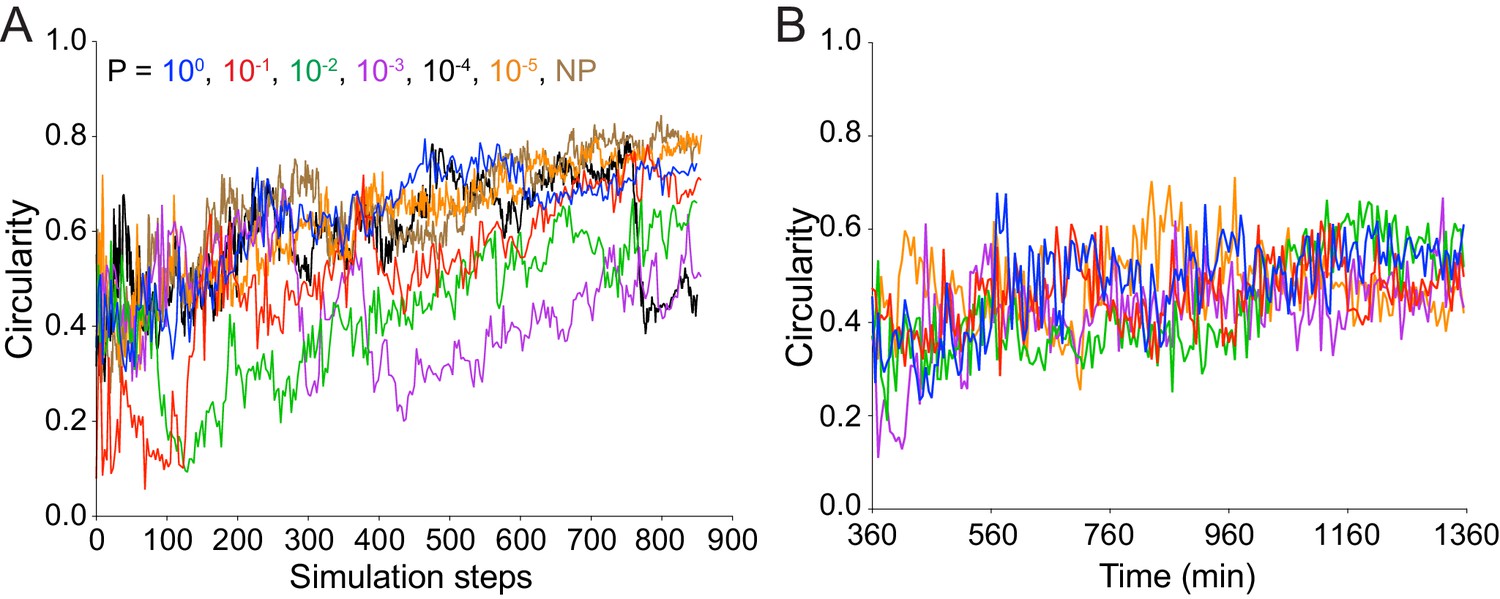
As time increases, focus circularity increases in both simulated and experimental data.
(A) Data quantifying the circularity of simulated infection foci as a function of time. Different colors represent independent simulations with distinct values of P, the probability of the becoming a pioneer. For all simulations, replication rate k equals 1. (B) Data quantifying the circularity of experimental infection foci as a function of time. Each color represents a different focus. The effective time scales for parts A and B are comparable.
Figure 4 with 1 supplement
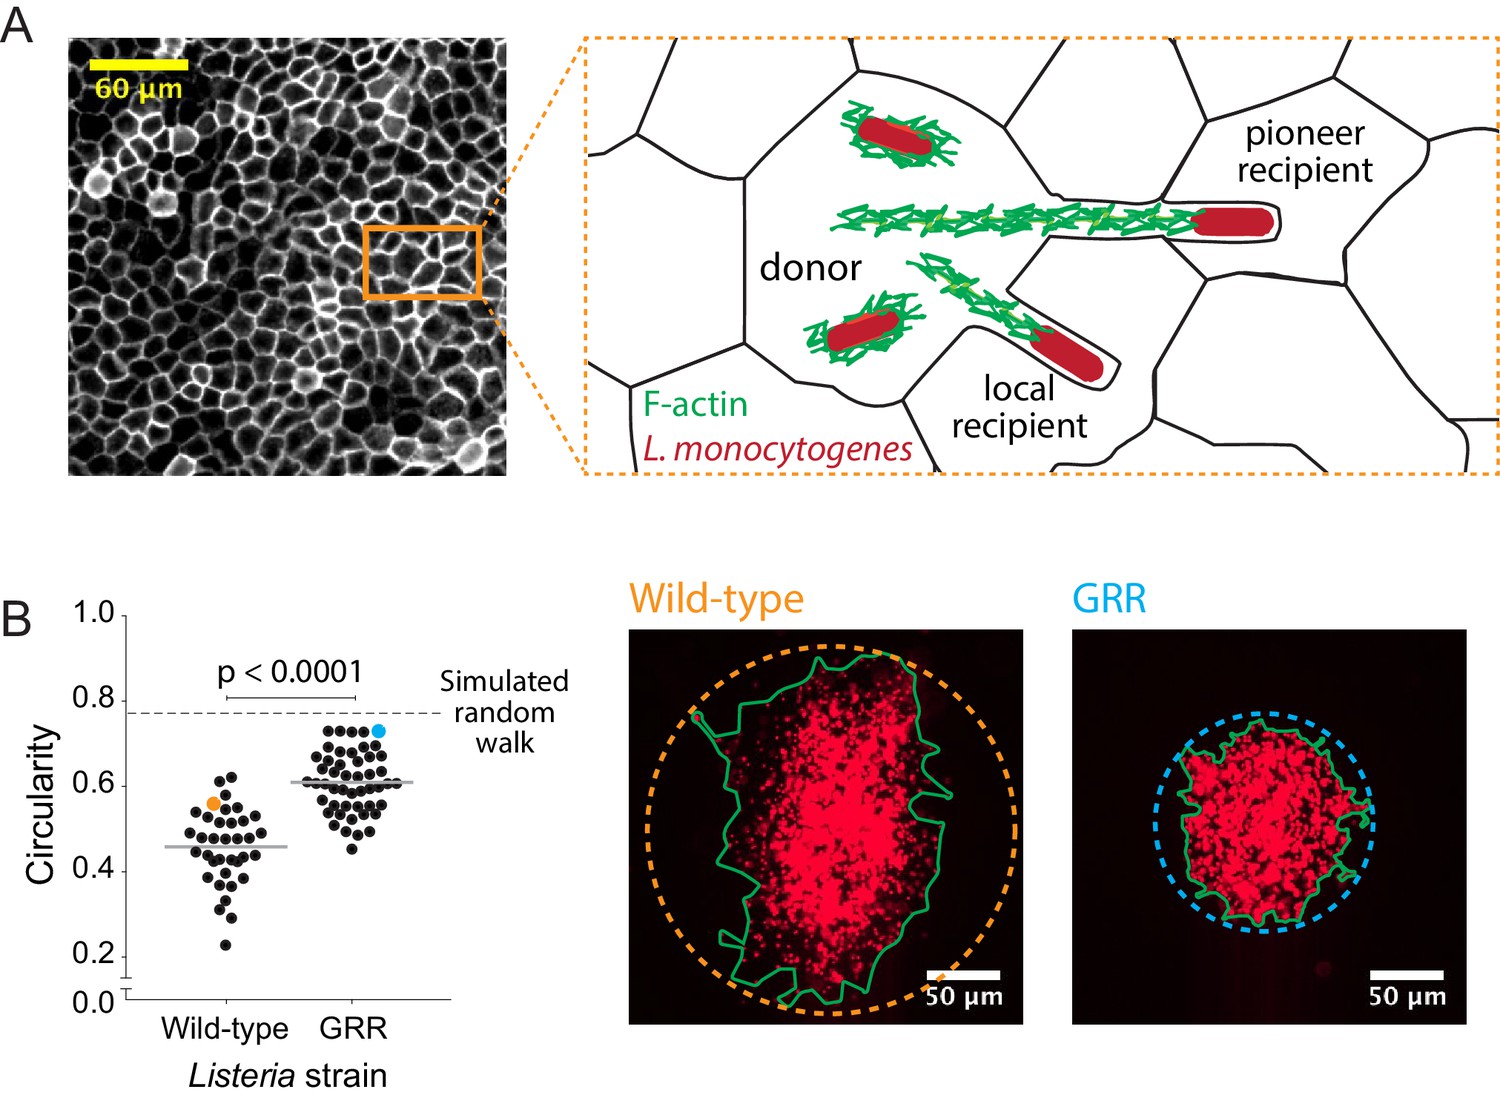
Decreasing the rate of bacterial protrusion formation leads to more circular infection foci.
(A) Micrograph showing phalloidin staining of MDCK cell monolayer (left), and a cartoon representation of host cell boundaries based on phalloidin staining and L. monocytogenes spreading from cell to cell. (B) Data quantifying the circularity of foci generated by wild-type and GRR L. monocytogenes. Horizontal bars indicate the mean. p-value was calculated using the non-parametric Wilcoxon rank sum test. The orange and cyan data points correspond to the foci on the right. Green boundaries fully enclose all bacteria. Circular dashed lines represent the smallest circles that fully enclose green boundaries.
-
Figure 4—source data 1
This spreadsheet contains circularity data used to generate graphs in Figure 4B and in Figure 4—figure supplement 1.
- https://doi.org/10.7554/eLife.40032.026
Figure 4—figure supplement 1

Changing the value of Dfast/Dslow significantly affects the circularity of simulated foci; changing directional persistence does not.
Data quantifying the circularity of simulated infection foci as a function persistence. Each data point represents the average of 100 independent simulations. Vertical bars represent the standard deviation. Each color represents a different value of Dfast/Dslow ratio. For all simulations, replication rate k equals 1.
Figure 5 with 2 supplements

Simulations predict that heterogeneous spread increases the chance of a persistent L. monocytogenes infection in the intestinal epithelium.
(A) Schematic of the topology of the intestinal epithelium and L. monocytogenes cell-to-cell spread originating at the tip of intestinal villi. Image of intestinal villi was adapted from ‘Structure of villi and microvilli present on the epithelial cells of the small intestine.’ https://commons.wikimedia.org/wiki/File:Esquema_del_epitelio_del_intestino_delgado.png. License: CC BY-SA 4.0. Villus side view image was adapted from Figure 3 of Pizarro-Cerdá et al. (2012). (B) Schematic of the steps of the host cell extrusion simulation. Host cell boundary of next cell to be extruded is depicted as a cyan dashed line. Extruding host cell is depicted as an orange boundary. Black arrows inside host cell in the second panel indicate monolayer retraction after extrusion. (C) Phase diagram of simulated data depicting the outcomes of host cell extrusion random walk simulations with only a single effective diffusion coefficient (no pioneers) for different combinations of host cell extrusion periods and effective diffusion coefficients. A total of 100 simulations were run for each combination. For these simulated data, the radius of extrusion equals 1, and the bacterial replication rate equals 1. Units are normalized by the replication rate, 0.006 min−1, and radius of an extruded cell, 7 µm (Ho et al., 2017). The white dashed line represents the analytic approximation for extrusion steady state. (D) Simulated data showing the outcomes of host cell extrusion simulations where extrusion period equals 0.15, extrusion radius equals 1, Dslow equals 2, and Dfast varies. Vertical axis depicts the fraction of simulations with indicated outcome for 100 simulations per value of Dfast/Dslow ratio.
-
Figure 5—source data 1
This spreadsheet contains diffusion coefficient data used to generate the graph in Figure 5C.
This spreadsheet also contains probability data used to generate the graphs in Figure 5D and in Figure 5—figure supplements 1 and 2.
- https://doi.org/10.7554/eLife.40032.030
Figure 5—figure supplement 1
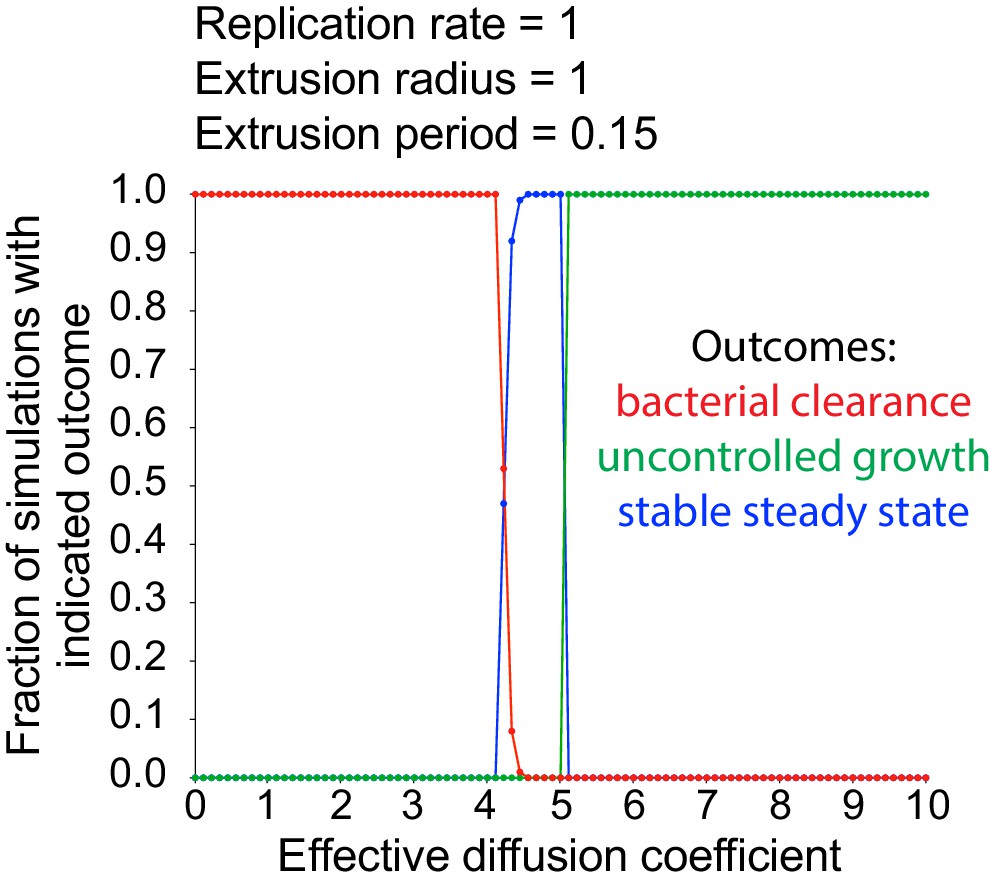
Random walk host cell extrusion simulations predominantly lead to all-or-nothing outcomes.
Data quantifying the fraction of simulations with indicated outcome (bacterial clearance in red, uncontrolled growth in green, stable steady state in blue) as a function of effective diffusion coefficient. A total of 100 simulations were run for each effective diffusion coefficient. For these simulated data, the radius of extrusion equals 1, the extrusion period equals 0.15, and the bacterial replication rare equals 1 Uncontrolled growth occurs when the number of simulated bacteria in the monolayer reaches 105, stable steady state occurs when the number of simulated extruded bacteria reaches 2 × 10⁵, and bacterial clearance occurs if the number of simulated bacteria in the monolayer reaches zero.
Figure 5—figure supplement 2

Simulations predict that heterogeneous spread increases the chance of a persistent L. monocytogenes infection in the intestinal epithelium for several combinations of Dslow and host cell extrusion periods.
Data quantifying the fraction of simulations that reached a stable steady state for three combinations of Dslow and host cell extrusion period E as a function of Dfast/Dslow ratio. The bacterial replication rate equals 1. A total of 100 simulations were run for each Dfast/Dslow ratio for each curve. Uncontrolled growth occurs when the number of simulated bacteria in the monolayer reaches 105, stable steady state occurs when the number of simulated extruded bacteria reaches 2 × 10⁵, and bacterial clearance occurs if the number of simulated bacteria in the monolayer reaches zero.
Videos
Video 1
Spread of wild-type L. monocytogenes in a polarized, confluent MDCK cell monolayer.
Time-lapse microscopy data showing intracellular wild-type bacteria (mTagRFP, red) and host cell nuclei (Hoechst, blue). Images were collected every 5 min for a total of 1000 min. Time shown in minutes post-infection.
Video 2
Solution of reaction-diffusion equation.
Solution as defined in Equation 2. Effective diffusion coefficient and replication rate were each set to 1. Time steps were set to 0.01.
Video 3
Initial steps of stochastic random walk simulation.
First 425 steps of a stochastic simulation that starts with a single bacterium and ends when 100 bacteria have accumulated. Effective diffusion coefficient and replication rate equal 1.
Video 4
Full stochastic random walk simulation.
Stochastic simulation that starts with 25 bacteria and ends when 105 bacteria have accumulated. Effective diffusion coefficient and replication rate equal 1.
Video 5
Stochastic random walk simulation including directional persistence and host cell boundaries.
Directional persistence equals 0.3 and the probability of crossing a host cell boundary equals 0.10. Host cell boundaries are drawn in gray. The trailing points behind a bacterium represent the last ten positions of that bacterium. Effective diffusion coefficient and replication rate equal 1.
Video 6
Pioneer spreading through MDCK cells.
Single pioneer spreading through a polarized monolayer of MDCK cells. Images were collected every 5 min. White arrow indicates the initial position of pioneer bacterium.
Video 7
Out-of-focus pioneer spreading through MDCK cells.
Single pioneer briefly goes out of focus as it spreads through a polarized monolayer of MDCK cells. Images were collected every 5 min. White arrow indicates the initial position of pioneer bacterium.
Video 8
Heterogeneous cell-to-cell spread where P=0.10 (left), P=0.01 (center), and P=0.001 (right).
Stochastic simulations where Dslow = 1, Dfast = 100, and k = 1. Each simulation starts with 25 bacteria and ends when 105 bacteria have accumulated. Colors depict whether a bacterium has never been a pioneer (black), has a pioneer ancestor (orange), or is currently a pioneer (magenta). Green boundaries fully enclose all bacteria.
Video 9
Host cell extrusion simulation ending in bacterial clearance (left), stable steady state (center), and uncontrolled growth (right).
Bacterial clearance is triggered when the number of bacteria in epithelium reaches zero. Uncontrolled growth is triggered when the number of bacteria in epithelium reaches 105. Stable steady state is triggered when the number of extruded bacteria reaches 2 × 10⁵ before the number of bacteria in epithelium reaches 105. Extrusion radius equals 1, extrusion period equals 0.2, and replication rate equals 1. Effective diffusion coefficients are 1 (bacterial clearance), 3 (stable steady state), and 9 (uncontrolled growth ) respectively.
Tables
Key resources table
| Reagent type (species) or resource | Designation | Source or reference | Identifiers | Additional information |
|---|---|---|---|---|
| Strain, strain background (L. monocytogenes) | 10403S; JAT607;wild-type + actAp::mTagRFP | Bishop and Hinrichs, 1987 PMID: 3114382 | Strains were conjugated with actAp::mTagRFP ORF as described previously (Ortega et al., 2017) | |
| Strain, strain background (L. monocytogenes) | DP-L4032; JAT1348; GRR + actAp::mTagRFP | Skoble et al., 2001 PMID: 11581288 | ||
| Cell line (C. familiaris) | Madin-Darby canine kidney type II G cells | Mays et al., 1995 PMID: 7657695 | RRID:CVCL_0424 | |
| chemical compound, drug | Alexa Fluor 488 phalloidin | Thermo Fisher A12379; RRID:AB_2315147 | ||
| Chemical compound, drug | Gentamicin sulfate | MP Biomedicals 194530 | ||
| Chemical compound, drug | Rat-tail collage type I | Thermo Fisher A1048301 | ||
| Software, algorithm | MATLAB | Mathworks; RRID:SCR_001622 | Used image processing toolbox | |
| Software, algorithm | Circularity measurement | Zheng and Hryciw, 2015 DOI: 10.1680/geot.14.P.192 | Mathworks; RRID:SCR_001622 | Written in MATLAB |
| Other | DMEM low glucose, no sodium bicarbonate, no phenol red | Sigma D5921 | ||
| Other | Leibovitz's L-15 medium, no phenol red | Thermo Fisher 21083027 | ||
| Other | Foundation Fetal Bovine Serum | Gemini Bio-Prod 900108 | Lot: A37C48A | |
| Other | Phosphate buffered saline (PBS), no calcium, no magnesium | Fisher SH30028FS | ||
| Other | Brain heart infusion (BHI) | BD 211059 |
Table 1
Bacterial strains expressing mTagRFP under the actA promoter used in this work.
https://doi.org/10.7554/eLife.40032.032| Genotype | Strain designation | Parental strain designation | Parental strain reference |
|---|---|---|---|
| Wild-type | JAT607 | 10403S | Bishop and Hinrichs, 1987 |
| GRR | JAT1348 | DP-L4032 | Skoble et al., 2001 |
Additional files
-
Transparent reporting form
- https://doi.org/10.7554/eLife.40032.033
Download links
A two-part list of links to download the article, or parts of the article, in various formats.
Downloads (link to download the article as PDF)
Open citations (links to open the citations from this article in various online reference manager services)
Cite this article (links to download the citations from this article in formats compatible with various reference manager tools)
Listeria monocytogenes cell-to-cell spread in epithelia is heterogeneous and dominated by rare pioneer bacteria
eLife 8:e40032.
https://doi.org/10.7554/eLife.40032


