The RNA interactome of human telomerase RNA reveals a coding-independent role for a histone mRNA in telomere homeostasis
- Nanyang Technological University, Singapore
- Skin Research Institute Singapore, Singapore
Figures
Figure 1 with 2 supplements
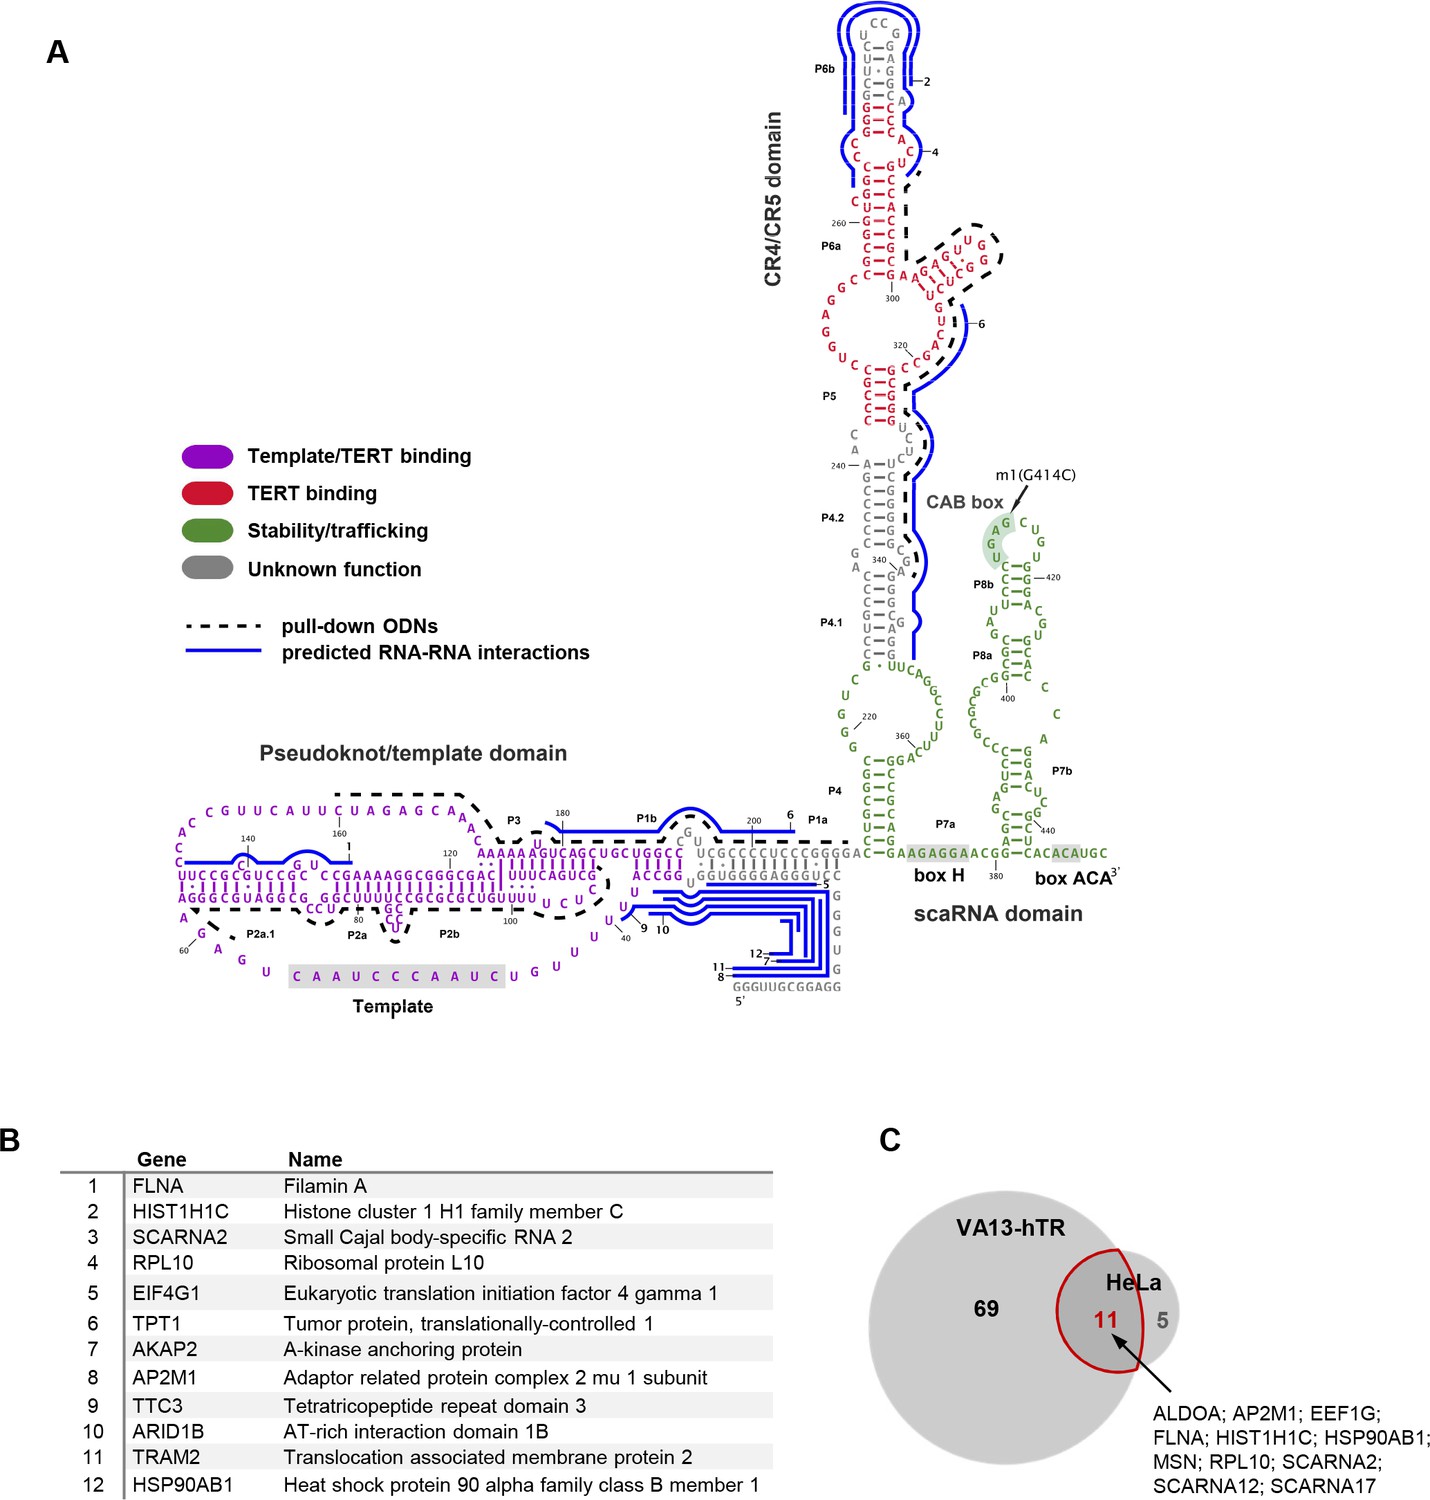
Characterization of the hTR-RNA interactome.
(A) Schematic representation of hTR sequence, domain organization and bait oligonucleotides (ODNs) used in this study. (B) List of top 12 high-confidence hTR interacting RNAs in VA13-hTR cells, ranked based on peak score (JAMM software) across hTR pull-downs. A full list is provided in Figure 1—source data 1. Predicted interaction sites in hTR for the top 12 RNAs are shown in panel A (blue lines; numbers indicate the rank of the transcript as shown in B). Details for these predicted interactions are provided in Figure 1—source data 2. (C) Overlap between hTR-interacting RNAs identified in VA13-hTR and HeLa cells. A list of interacting partners identified in both cell lines is shown next to the Venn diagram.
-
Figure 1—source data 1
List of hTR interacting RNAs in VA13-hTR and HeLa cells, ranked based on peak scores.
Full peak calling results are provided in Supplementary file 1.
- https://doi.org/10.7554/eLife.40037.005
-
Figure 1—source data 2
Details of the predicted RNA-RNA interactions for the transcripts listed in Figure 1B.
- https://doi.org/10.7554/eLife.40037.006
Figure 1—figure supplement 1
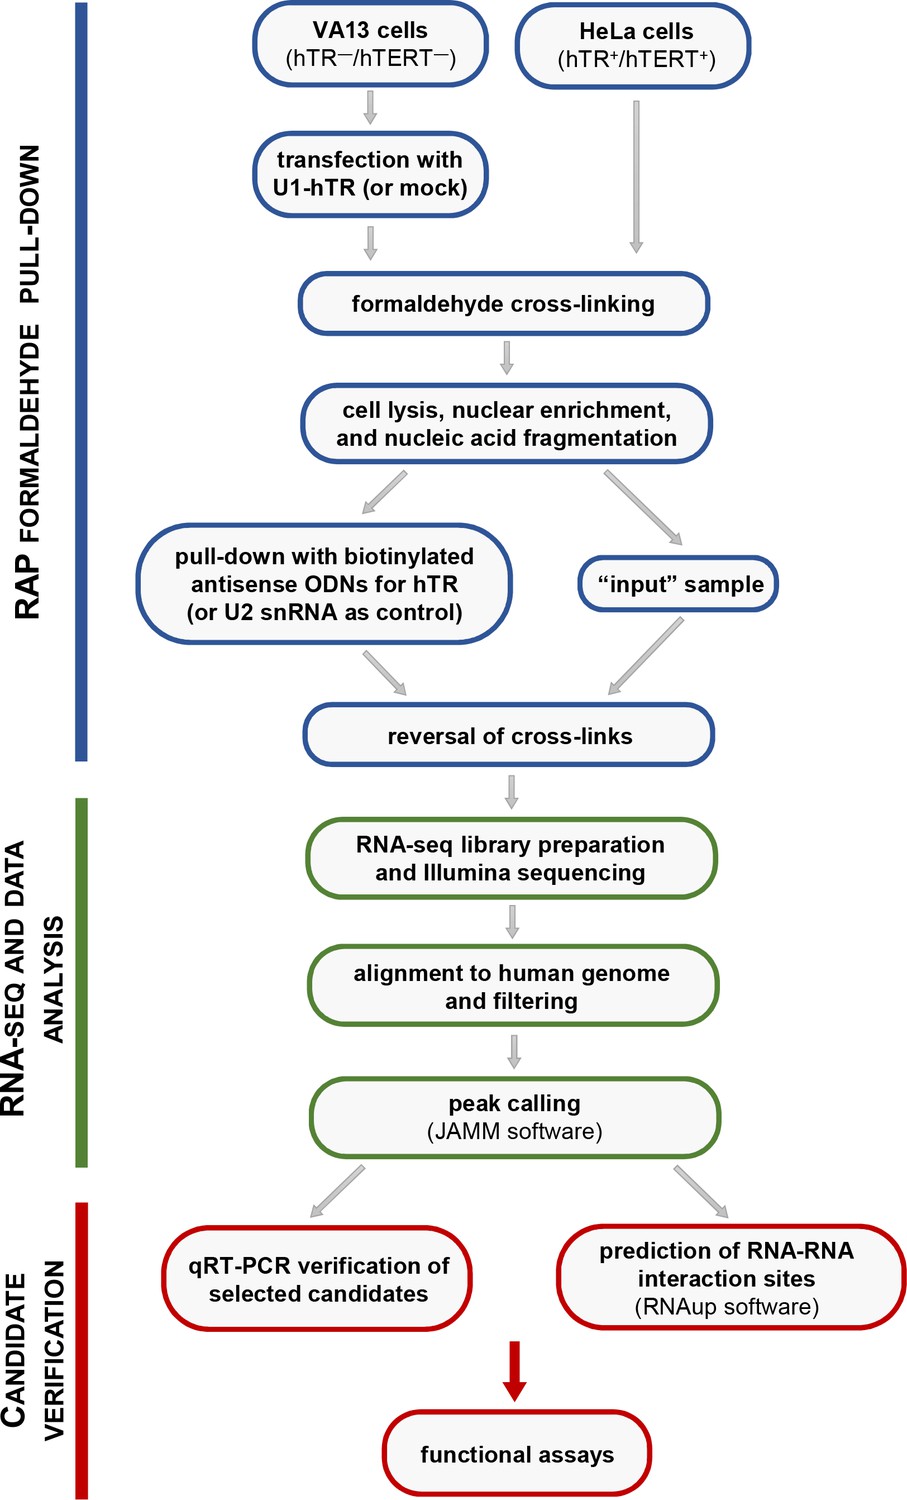
Schematic pipeline of the experimental protocol employed for the characterization of the hTR-RNA interactome.
https://doi.org/10.7554/eLife.40037.003
Figure 1—figure supplement 2
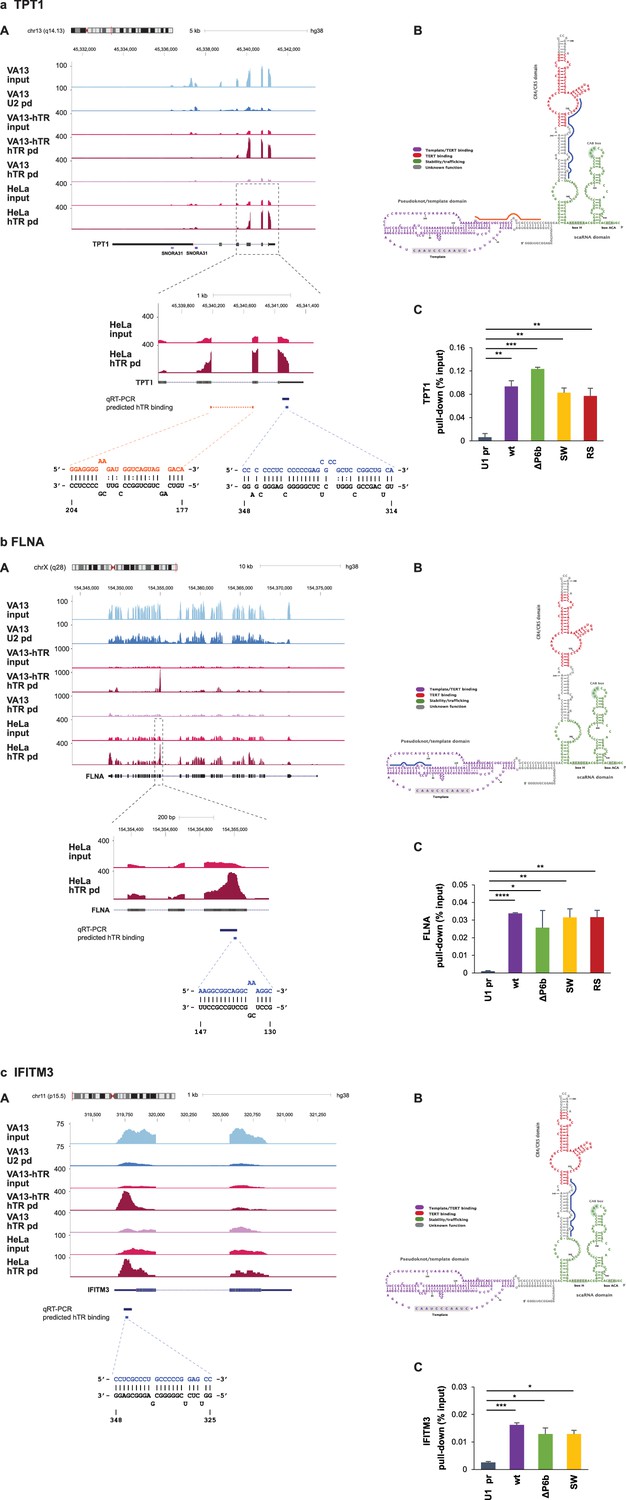
Verification of selected hTR-RNA interactions by qRT-PCR.
(a) Translationally controlled tumor protein 1 (TPT1), (b) filamin A (FLNA), (c) interferon-induced transmembrane protein 3 (IFITM3). For each example: (A) UCSC genome browser view showing coverage of RAP-RNA[FA] RNA-seq. The y axis indicates reads per million. VA13: mock-transfected VA13 cells; VA13-hTR: U1-hTR transfected VA13 cells; pd: pull-down. The blow-up of the enriched region (in a and b) shows the position for the qRT-PCR amplicon and the predicted hTR-binding site(s). mRNA-hTR interaction(s) predicted using RNAup are shown below the panel. (B) Location of the predicted RNA-RNA interaction(s) in hTR. (C) qRT-PCR of target enrichment upon hTR pull-down from VA13 cells transiently transfected with the hTR expression constructs indicated. The corresponding hTR mutants are described in Figure 3. Error bars represent s.d. Representative results from two-to-three independent transfections are shown. Paired two-tailed t-tests, *p<0.05, **p<0.01, ***p<0.001, ****p<0.0001.
Figure 2
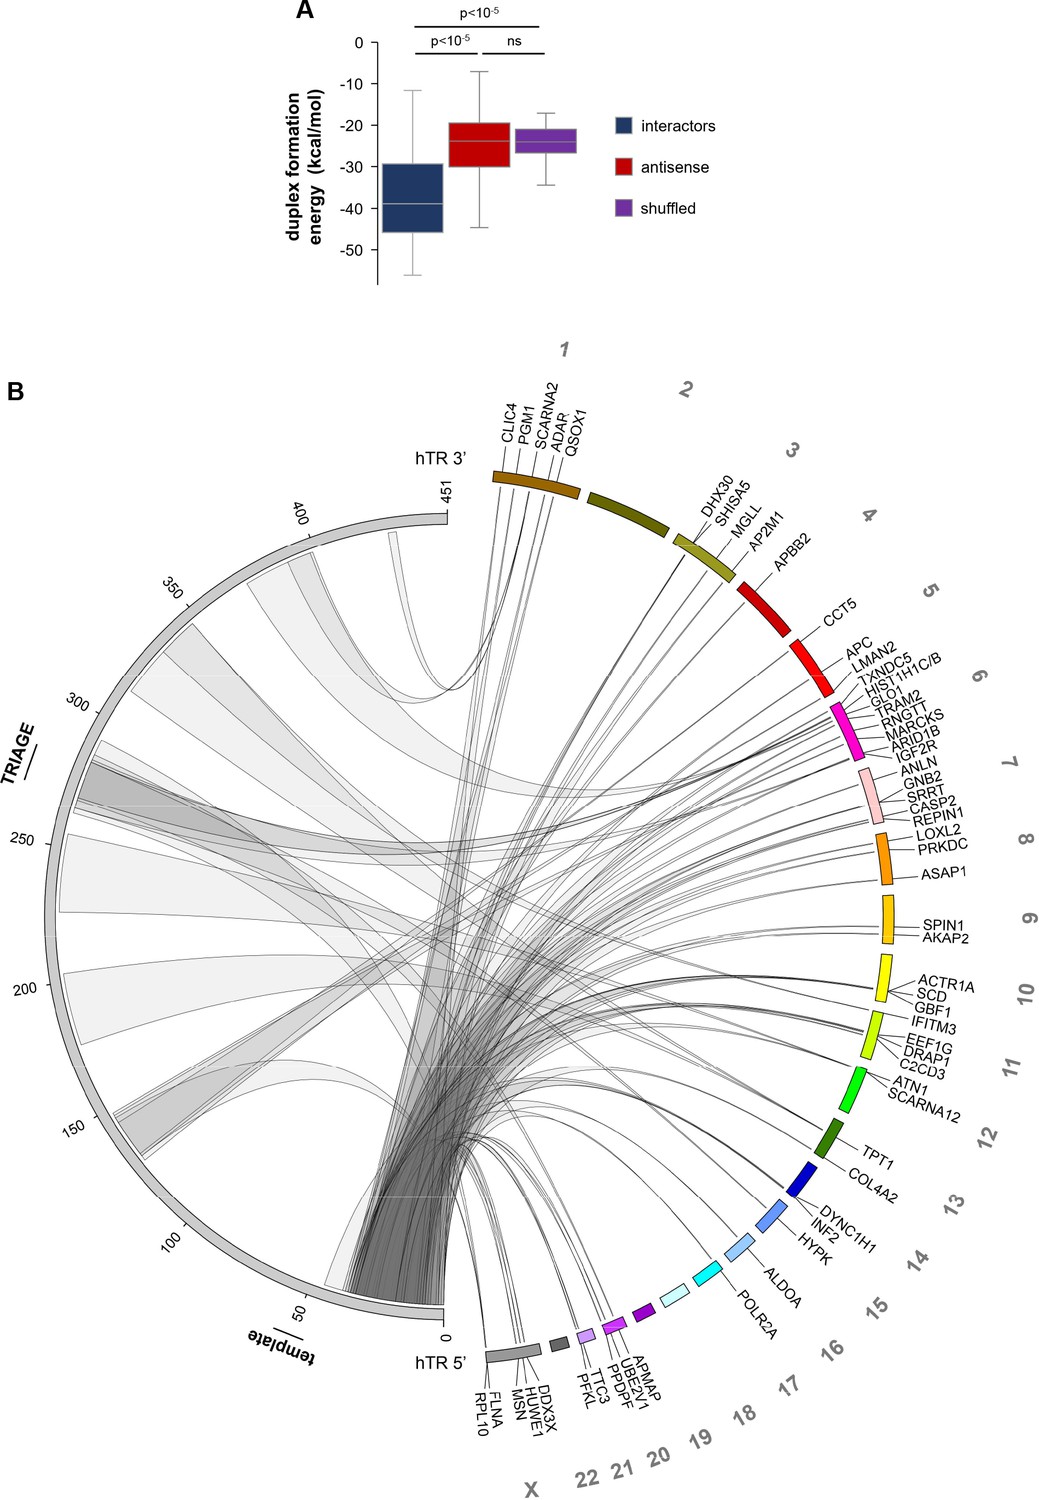
Predicted direct hTR-RNA interactions.
(A) Prediction of duplex formation energies between hTR and RNA sequences enriched in hTR pull-downs in VA13-hTR cells. Antisense and randomly shuffled (5/each RNA) sequences were used as controls representing non-interacting sequences. Statistical analysis was carried out using the Mann-Whitney U test. (B) Circos plot (Krzywinski et al., 2009) showing the position of predicted direct hTR-RNA interactions. Only interactions with predicted duplex formation energies at least one standard deviation below the median of shuffled sequences were included on the plot, corresponding to 58 RNAs (72.5%) out of the 80 RNAs. The left side of the plot corresponds to the hTR sequence (with the position of the template and TRIAGE regions indicated), while the right side represents the genomic position of hTR-RNA interactors.
Figure 3
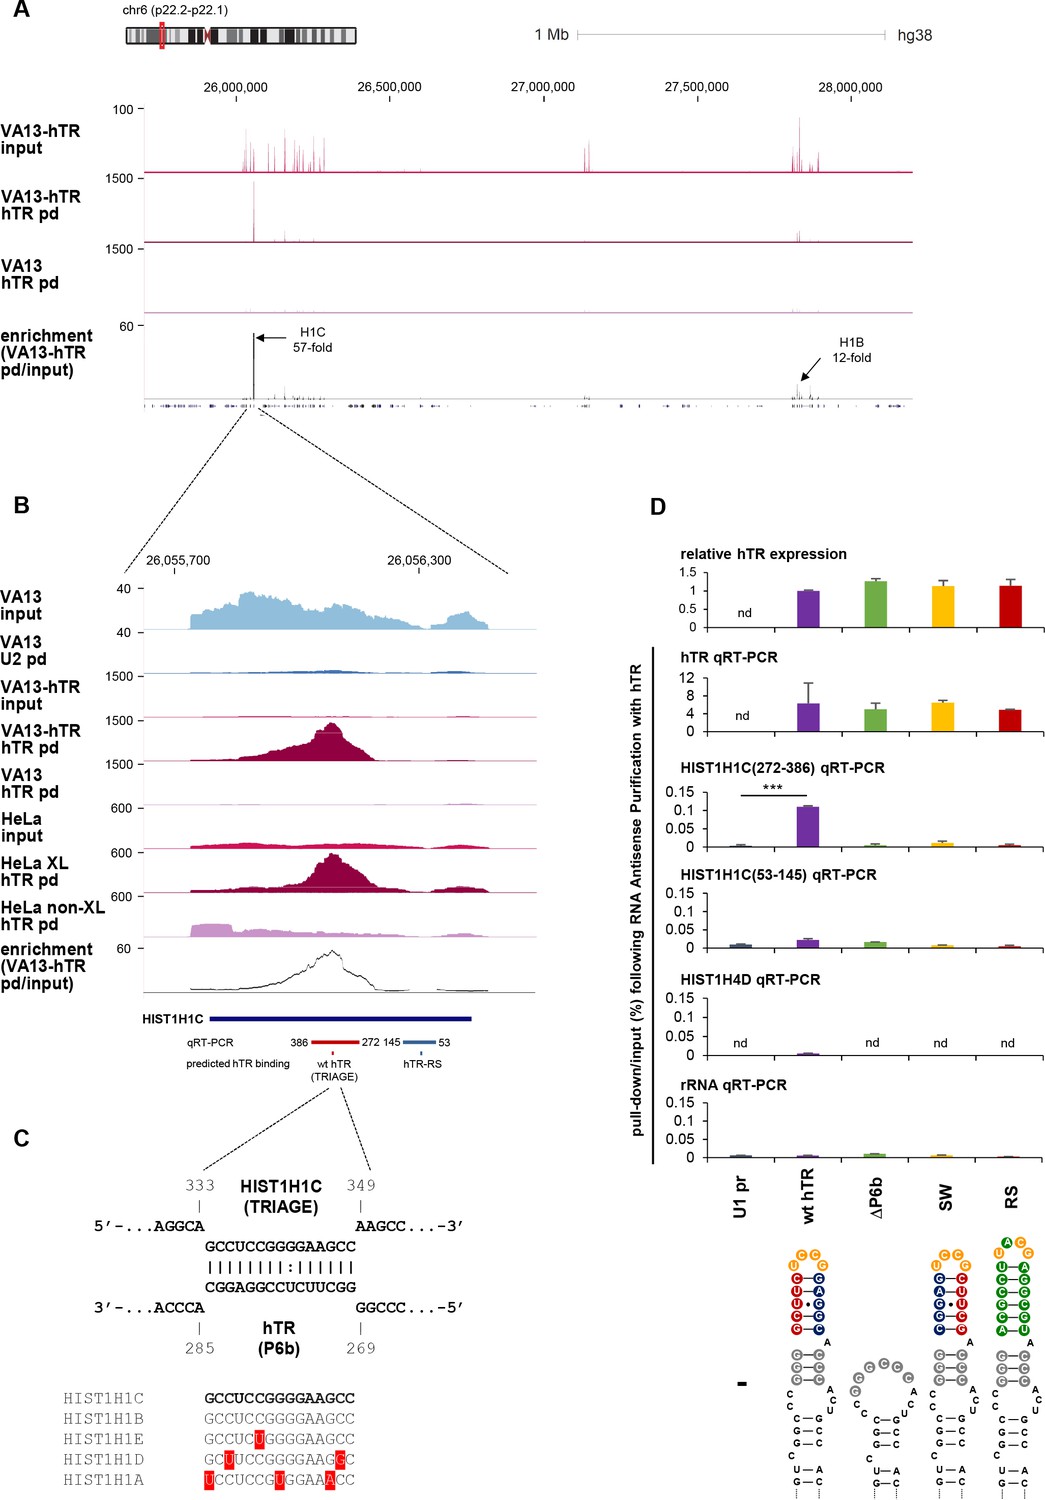
HIST1H1C RNA specifically interacts with hTR.
(A) UCSC genome browser view showing coverage of RAP-RNA[FA] RNA-seq over the entire HIST1 gene cluster on chromosome 6 (y axis indicates reads per million). VA13: mock-transfected VA13 cells; VA13-hTR: U1-hTR transfected VA13 cells; pd: pull-down. The position of the HIST1H1C and HIST1H1B genes and their maximum enrichment upon hTR pull-down is shown. (B) Blow-up of the HIST1H1C region, showing specific enrichment upon hTR pull-down. Control pull-downs [for U2 snRNA (U2 pd) and hTR pull-down without formaldehyde cross-linking (non-XL)] are also shown. (C) Predicted base-pairing between the TRIAGE sequence and the P6b stem-loop of hTR. The conservation of the TRIAGE sequence in the five replication-dependent somatic linker histone subtypes (HIST1H1A-E) is shown below. (D) Mutations were introduced into hTR (as shown at the bottom), disrupting complementarity with TRIAGE (SW: swap mutant; RS: rescue mutant). Relative expression levels of hTR variants (uppermost panel) and pull-down efficiencies of various transcripts (all other panels) were measured by qRT-PCR upon transient transfections of VA13 cells with the indicated hTR variants and RAP-RNA[FA] using hTR-specific antisense oligonucleotides. The results demonstrate the specific pull-down of HIST1H1C by wild-type hTR. HIST1H4D and ribosomal RNA were used as negative controls. nd: not detectable. The positions of the regions amplified for HIST1H1C are illustrated in panel B. Error bars represent s.d. Representative results from two biological replicates, measured in triplicates, are shown. Paired two-tailed t-tests, ***p<0.001.
Figure 4 with 2 supplements
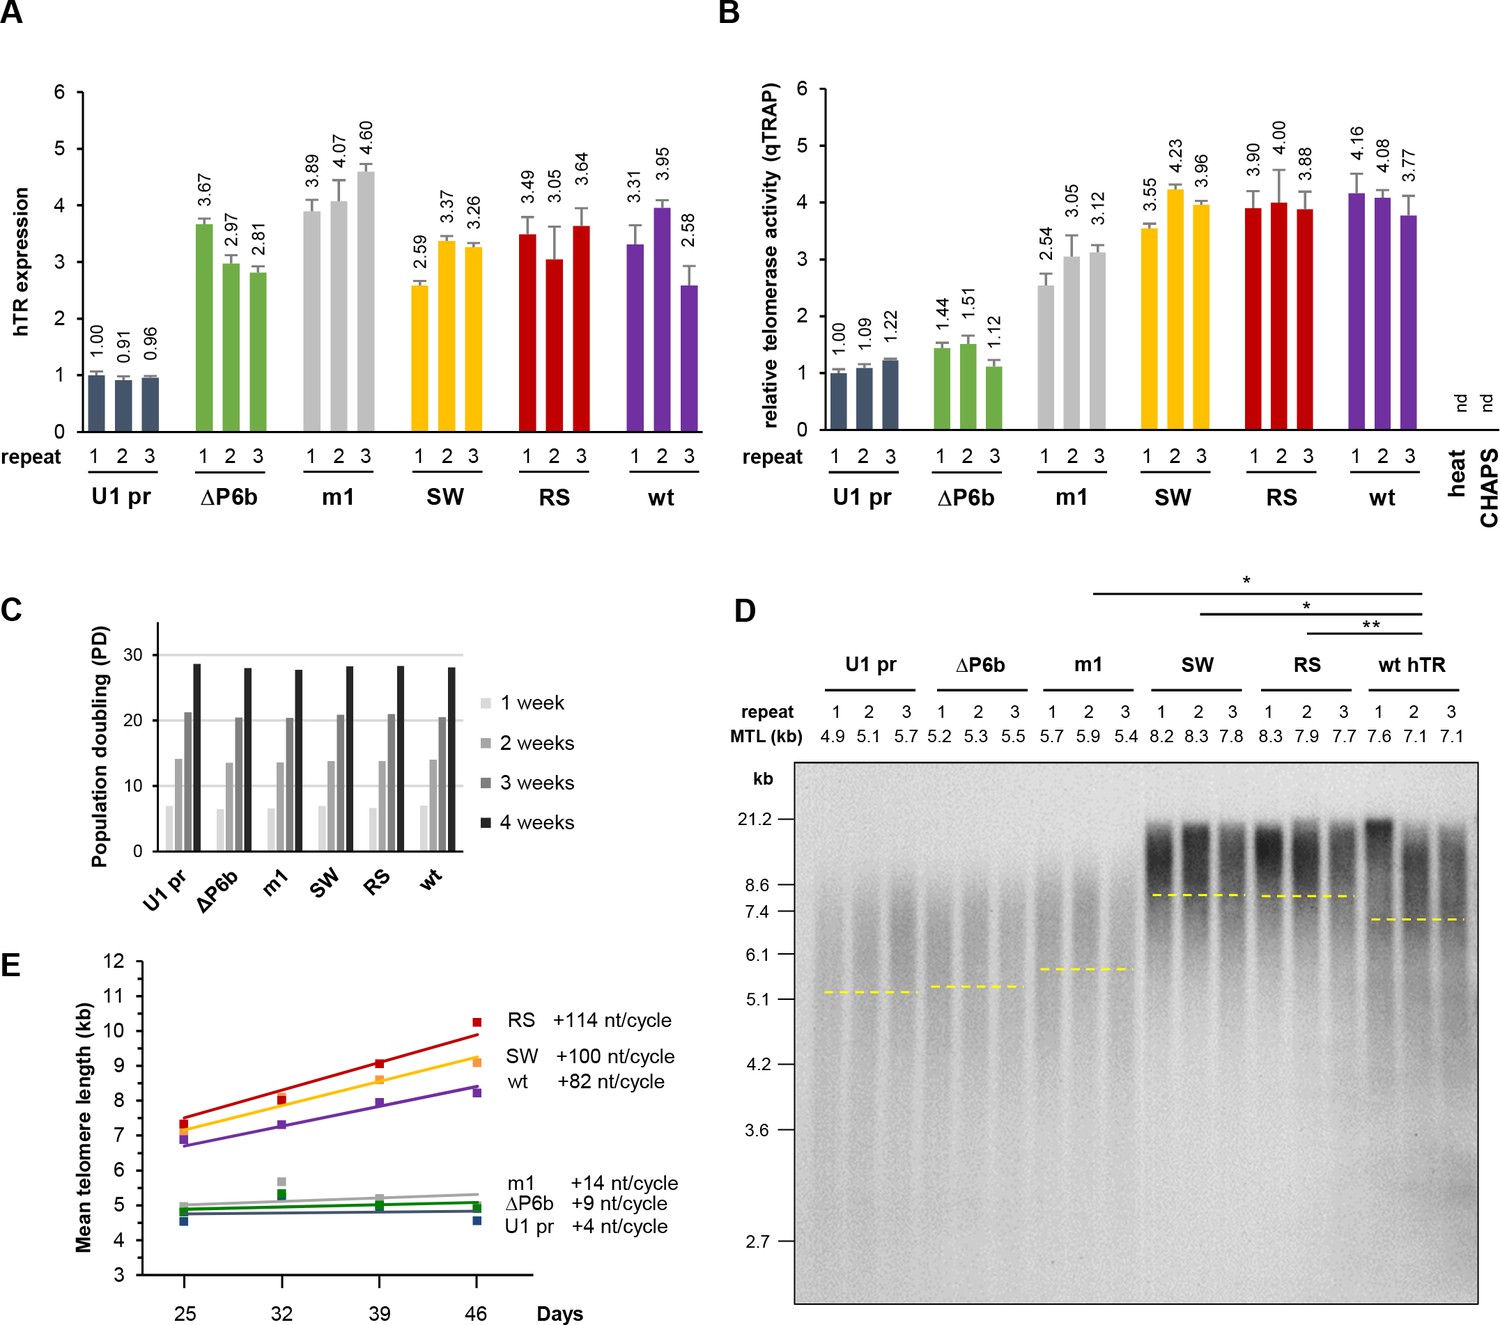
Mutations in hTR disrupting the interaction with HIST1H1C RNA lead to increased telomere elongation.
(A) Relative hTR expression levels and (B) relative telomerase activities in stably transfected polyclonal HT1080 cell lines expressing the indicated hTR variants, measured at day 32 post-transfection. Error bars represent s.d. Representative results of two-to-three biological replicates, measured in triplicates, are shown. (C) Cells were counted at each passage to determine average population doubling (PD) times for the HT1080 cell lines (n = 3 for each condition) stably expressing the indicated hTR variant. (D) Southern blot for TRF analysis at day 32 post-transfection. MTLs for the individual cell lines are indicated above the panel, while the average MTL for each hTR variant is shown by dashed lines. Statistical significance was calculated by paired two-tailed t-tests, *p<0.05, **p<0.01. Southern blots for the other time points are provided in Figure 4—figure supplement 2. (E) MTL changes over time for HT1080 cells stably expressing the indicated hTR variants. Average MTL values from three independent cell lines are shown. The intercept at day 0 for the trendlines was set at the MTL of the untransfected cell population.
Figure 4—figure supplement 1
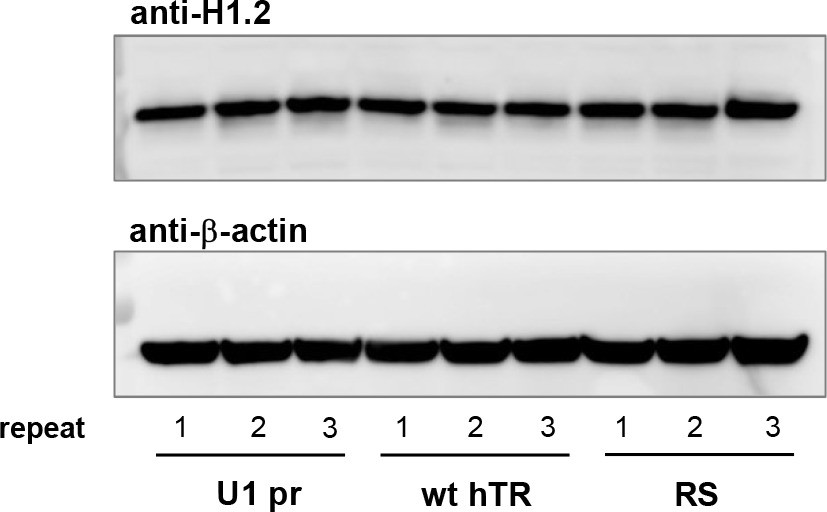
H1.2 protein levels are not affected by hTR expression.
Western blot showing H1.2 expression and β-actin loading control in polyclonal HT1080 cell lines (at 32 days post-transfection) stably expressing the indicated hTR constructs.
Figure 4—figure supplement 2
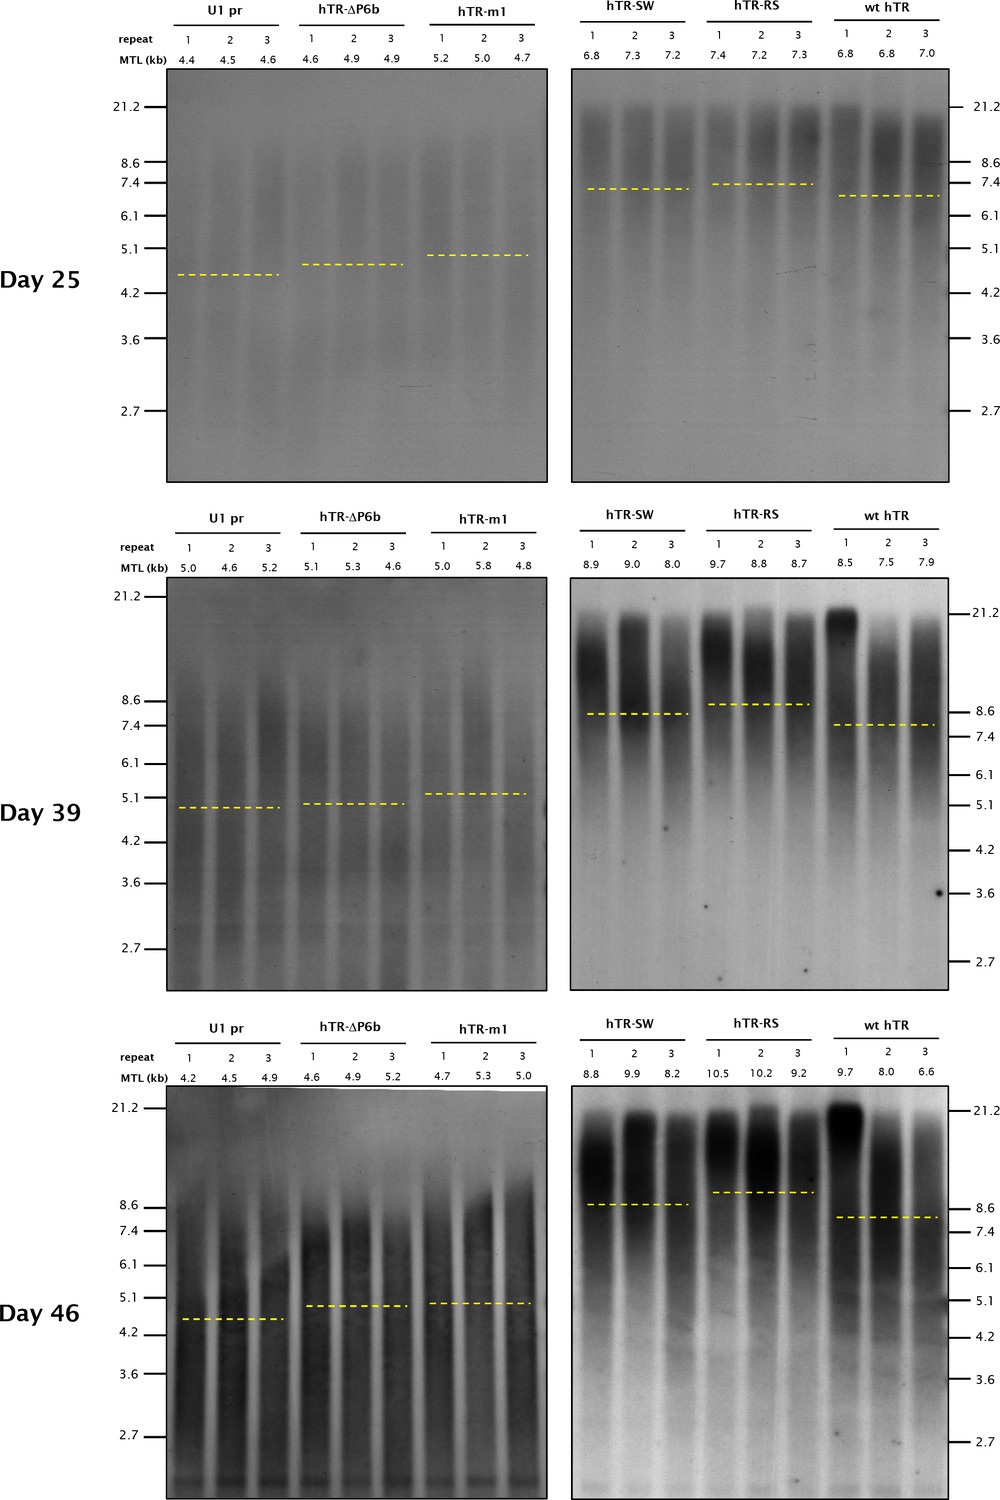
Southern blots from different time-points post-transfection for telomere length analysis of stably transfected HT1080 cell lines over-expressing the hTR variants.
Mean telomere length (MTL) for the individual cell lines is indicated above the panels, while the average MTL for each hTR variant is shown by dashed lines.
Figure 5 with 1 supplement
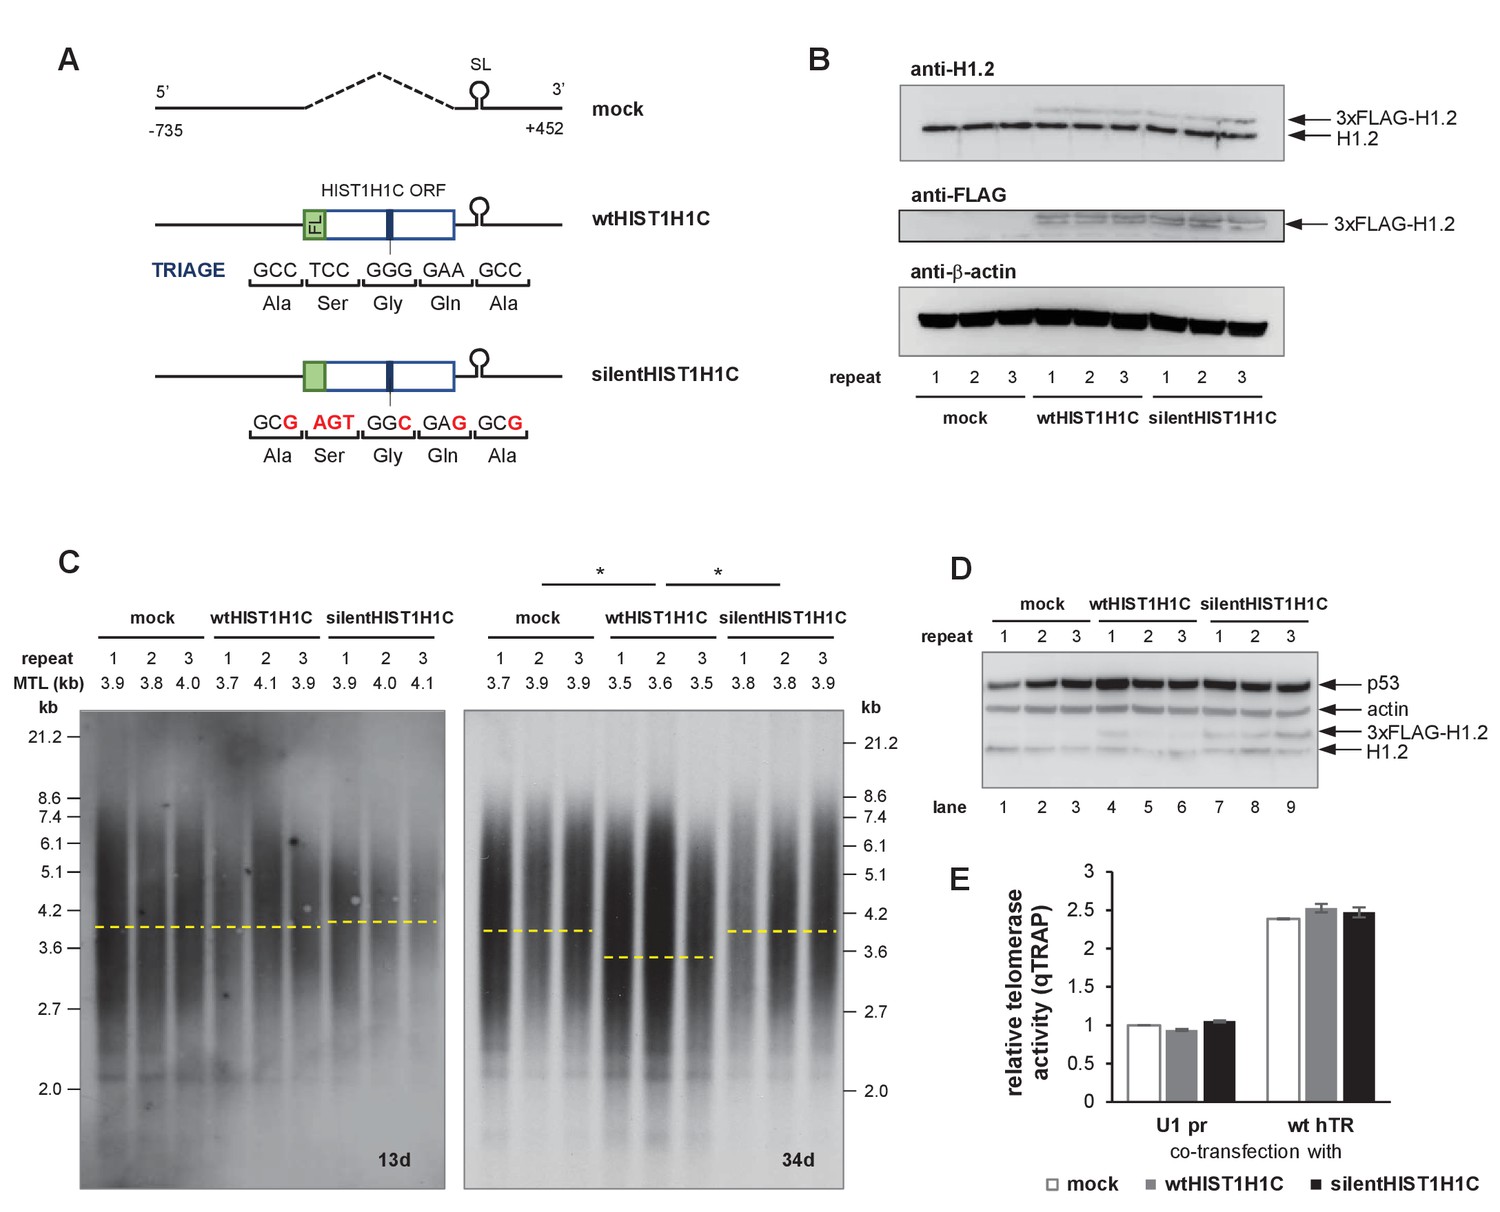
The presence of the TRIAGE sequence in HIST1H1C regulates telomere length.
(A) Schematic representation of HIST1H1C constructs. The TRIAGE sequence and silent mutations introduced in it are shown. FL indicates the N-terminal 3xFLAG tag. (B) Western blot showing 3xFLAG-H1.2 expression in stable polyclonal HT1080 cell lines. The same membrane was sequentially probed with anti-H1.2, anti-actin, and anti-FLAG antibodies. A doublet is detected with the anti-FLAG antibody, probably due to a phosphorylated H1.2 form that is not recognized by the anti-H1.2 antibody. (C) Southern blots for TRF analysis at days 13 (left panel) and 34 (right panel) post-transfection. MTLs for the individual cell lines are indicated above the panel, while the average MTL with the various HIST1H1C constructs is shown by dashed lines. Statistical significance was calculated by paired two-tailed t-tests, *p<0.05. (D) Western blot showing the loss of 3xFLAG-H1.2 expression in wtHIST1H1C-expressing polyclonal cell lines 2 and 3 (lanes 5 and 6) upon long-term culture (120 days post-transfection), and activation of the DNA damage marker p53 in cell line 1 (lane 4). (E) Relative telomerase activities upon transient transfection of HT1080 cells with the indicated combinations of hTR- (U1 pr and wt hTR) and histone 1C (mock, wtHIST1H1C, and silentHIST1H1C)-expressing constructs, measured 3 days post-transfection. Error bars represent s.d. Representative results of two biological replicates, measured in triplicates, are shown.
Figure 5—figure supplement 1
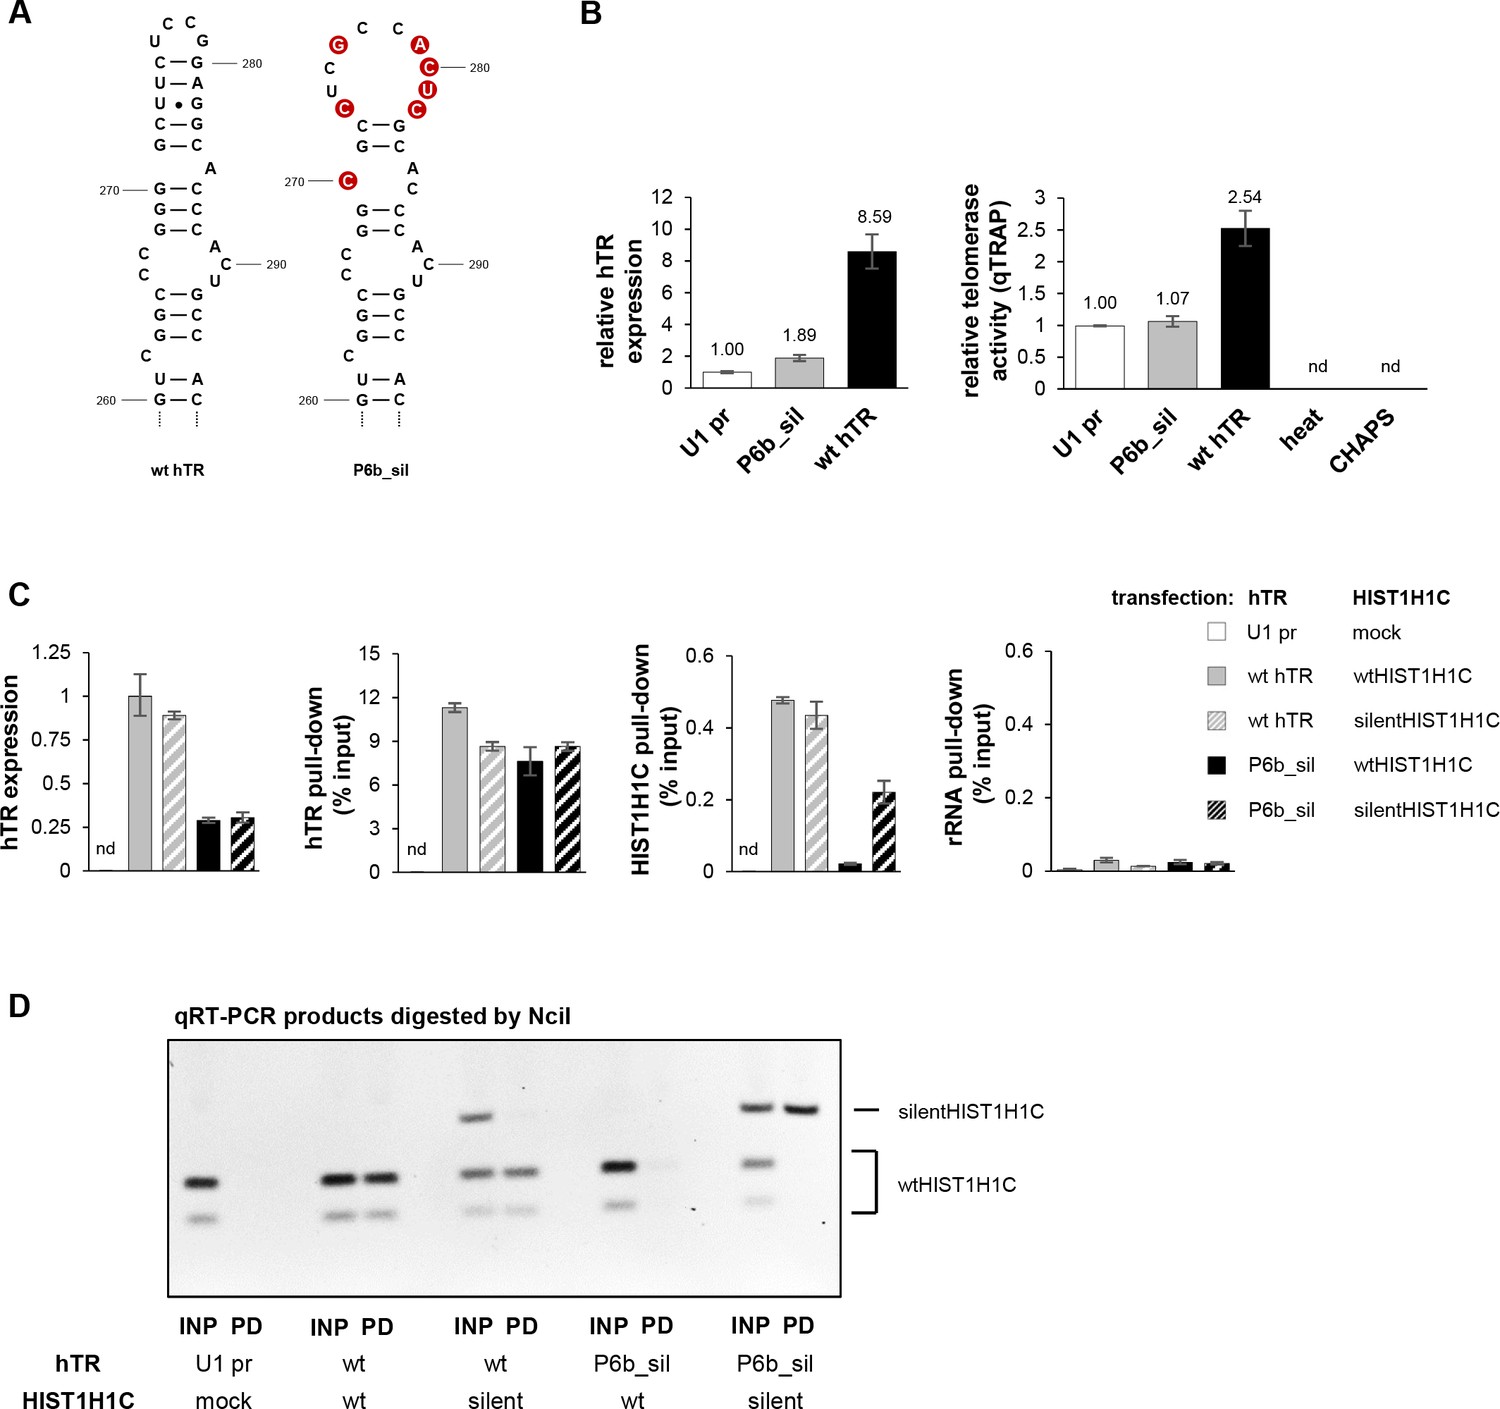
Rescue of the HIST1H1C-hTR interaction by compensatory mutations in the two RNAs.
(A) Schematic representation of compensatory mutations introduced into hTR, resulting in the P6b_sil hTR variant, with the complementarity to silentHIST1H1C re-established. (B) Relative hTR expression levels (measured by qRT-PCR) and relative telomerase activities (measured by RQ-TRAP) in HT1080 cells transiently transfected with the indicated hTR variants, measured 72 hr after transfection. Error bars represent s.d., n = 2, measured in triplicates. Heat-inactivated wild-type hTR-transfected cell lysates and CHAPS buffer were used as negative controls for the RQ-TRAP assay. nd: not detectable. (C) Various combinations of hTR- and HIST1H1C-expressing constructs – as indicated on the right – were transiently transfected into VA13 cells, followed by RAP-RNA[FA] using hTR-specific biotinylated antisense ODNs. Relative hTR expression levels, as well as pull-down efficiencies for hTR, HIST1H1C, and ribosomal RNA (as a negative control) were measured by qRT-PCR. Error bars represent s.d. Representative results from two biological replicates, measured in triplicates, are shown. nd: not detectable. (D) HIST1H1C qRT-PCR products for input (INP) and RAP pull-down (PD) samples were digested by NciI restriction enzyme that cleaves the wtHIST1H1C but not the silentHIST1H1C amplicon. Wild-type hTR specifically pulled down (either endogenous or exogenous) wild-type HIST1H1C, while the P6b_sil variant only pulled down silentHIST1H1C.
Figure 6 with 2 supplements
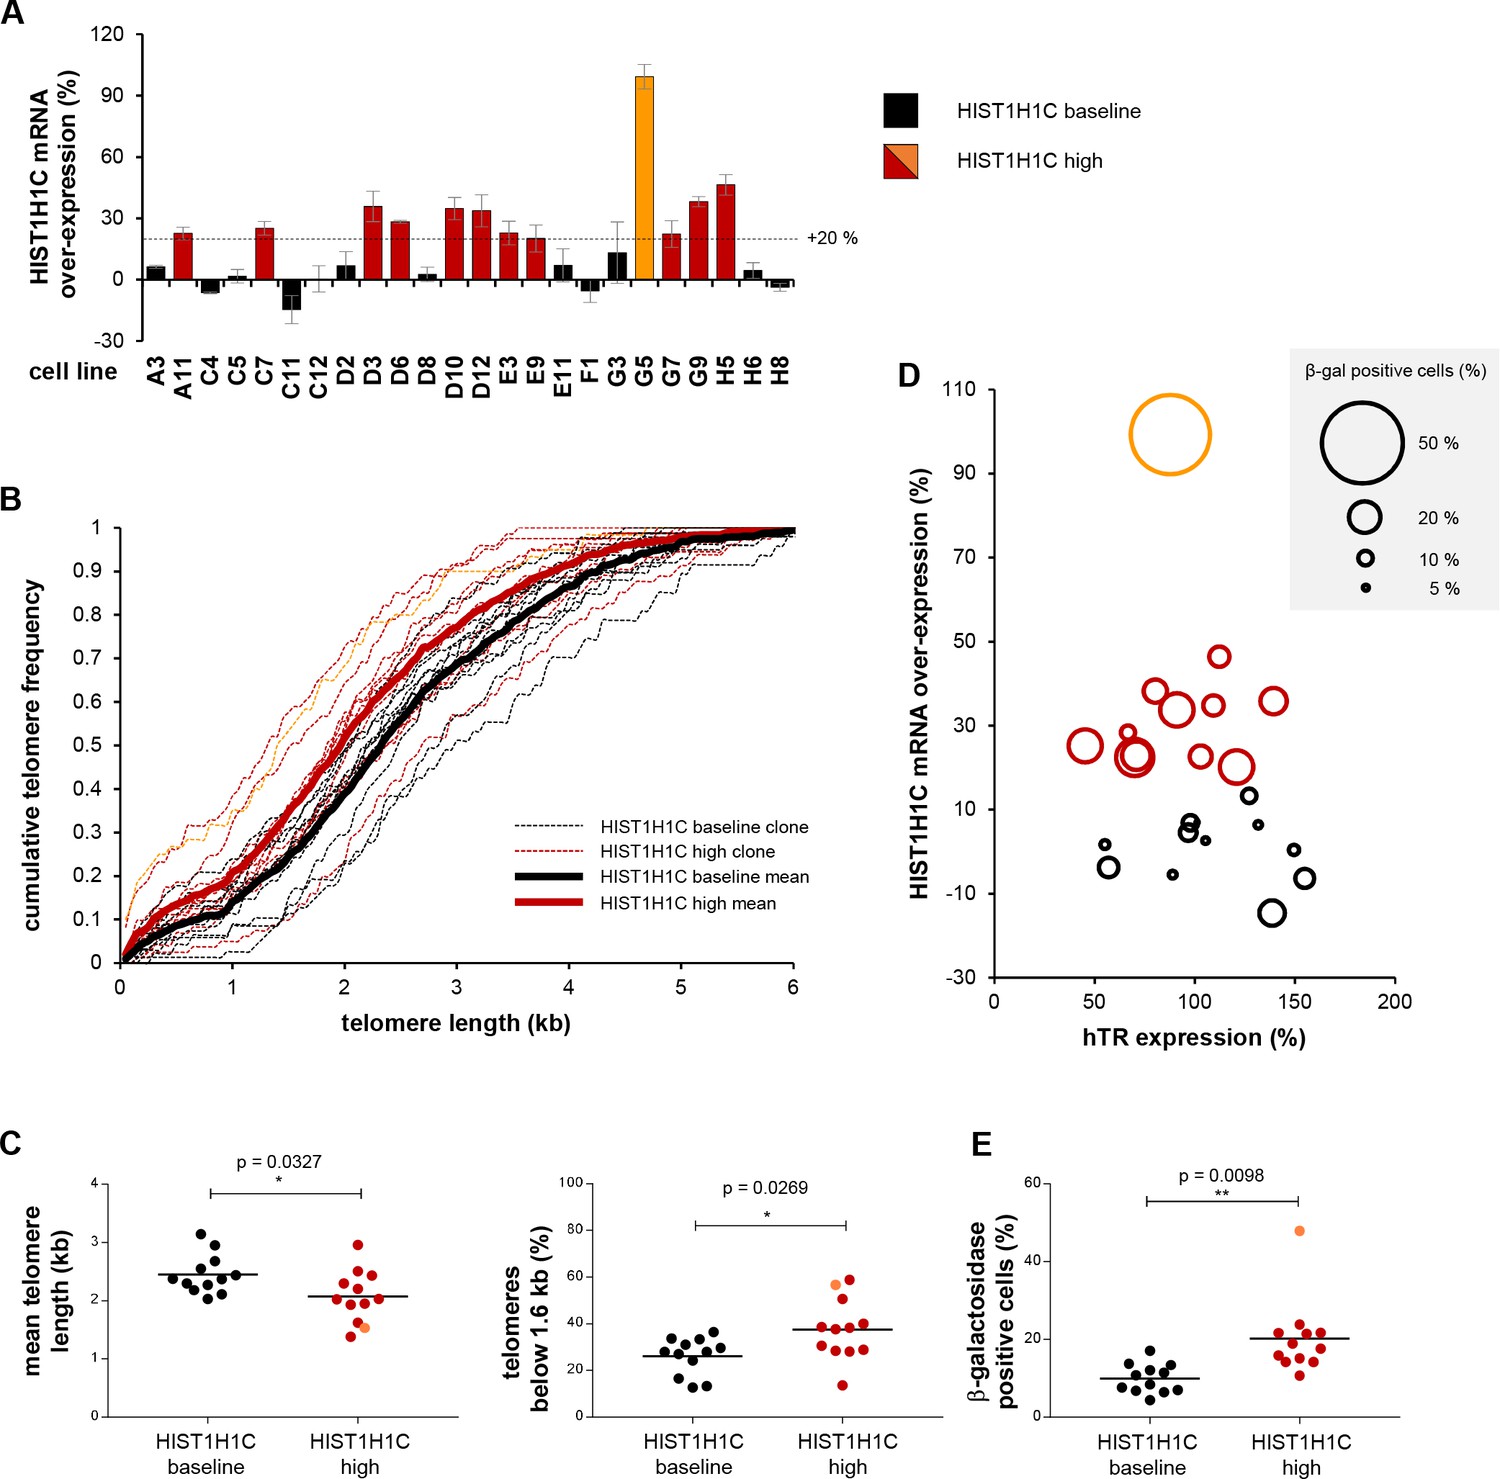
Long-term HIST1H1C mRNA over-expression results in shorter telomere length and increased cellular senescence.
(A) HIST1H1C mRNA over-expression levels relative to mock-transfected cells in clonal HT1080 cell lines stably transfected with wtHIST1H1C, measured by qRT-PCR at 10 weeks post-transfection. Values were normalized to HIST1H3B RNA levels. Cell lines were divided into two groups, each comprising 12 members: clones with <20% over-expression relative to mock (in black; ‘HIST1H1C baseline’ group) and clones with >20% over-expression (in red and orange; ‘HIST1H1C high’ group). Clone G5, showing the highest HIST1H1C RNA expression levels, is emphasized by orange colour. The same colour code is applied throughout panels B-E and in Figure 6—figure supplement 1. Error bars represent s.d., n = 2, with triplicates each. (B) Telomere length of clonal HT1080 cell lines was assessed by the TeSLA method (Lai et al., 2017) at 10 weeks post-transfection. Cumulative telomere frequency (calculated as the ratio of telomeres below a certain length) is shown for the individual clonal cell lines (thin dashed lines) and for the mean of the ‘HIST1H1C baseline’ and ‘HIST1H1C high’ groups (thick lines). TeSLA blots and the associated telomere length values for the individual clones are provided in Figure 6—figure supplement 2. (C) Elevated HIST1H1C mRNA expression levels correlate with lower mean telomere length values (left panel) and with an increase in the ratio of short telomeres (arbitrarily defined as telomeres below 1.6 kb; right panel). Each data point corresponds to a clonal HT1080 cell line stably expressing wtHIST1H1C. Statistical significance was calculated by paired two-tailed t-tests, *p<0.05. TeSLA blots and telomere length values for the individual clones are provided in Figure 6—figure supplement 2. Note that telomere length measurements with the TeSLA method give shorter MTL values than the TRF method utilized in Figures 4 and 5, and the absolute values obtained with these distinct methods are not directly comparable (Lai et al., 2017). (D) Elevated HIST1H1C mRNA expression levels correlate with increased cellular senescence, as measured by β-galactosidase staining. Cellular senescence in individual HT1080 clonal cell lines stably expressing wtHIST1H1C, measured at 8 and 10 weeks post-transfection, is illustrated by the diameter of the bubbles, plotted as a function of hTR expression levels (expressed relative to the average value in the 24 clonal cell lines) and HIST1H1C mRNA over-expression levels (relative to mock-transfected cells). (E) Statistical significance between the ‘HIST1H1C baseline’ and ‘HIST1H1C high’ groups was calculated by paired two-tailed t-tests, **p<0.01.
-
Figure 6—source data 1
Numerical values measured for the clonal HT1080 cell lines.
- https://doi.org/10.7554/eLife.40037.017
Figure 6—figure supplement 1
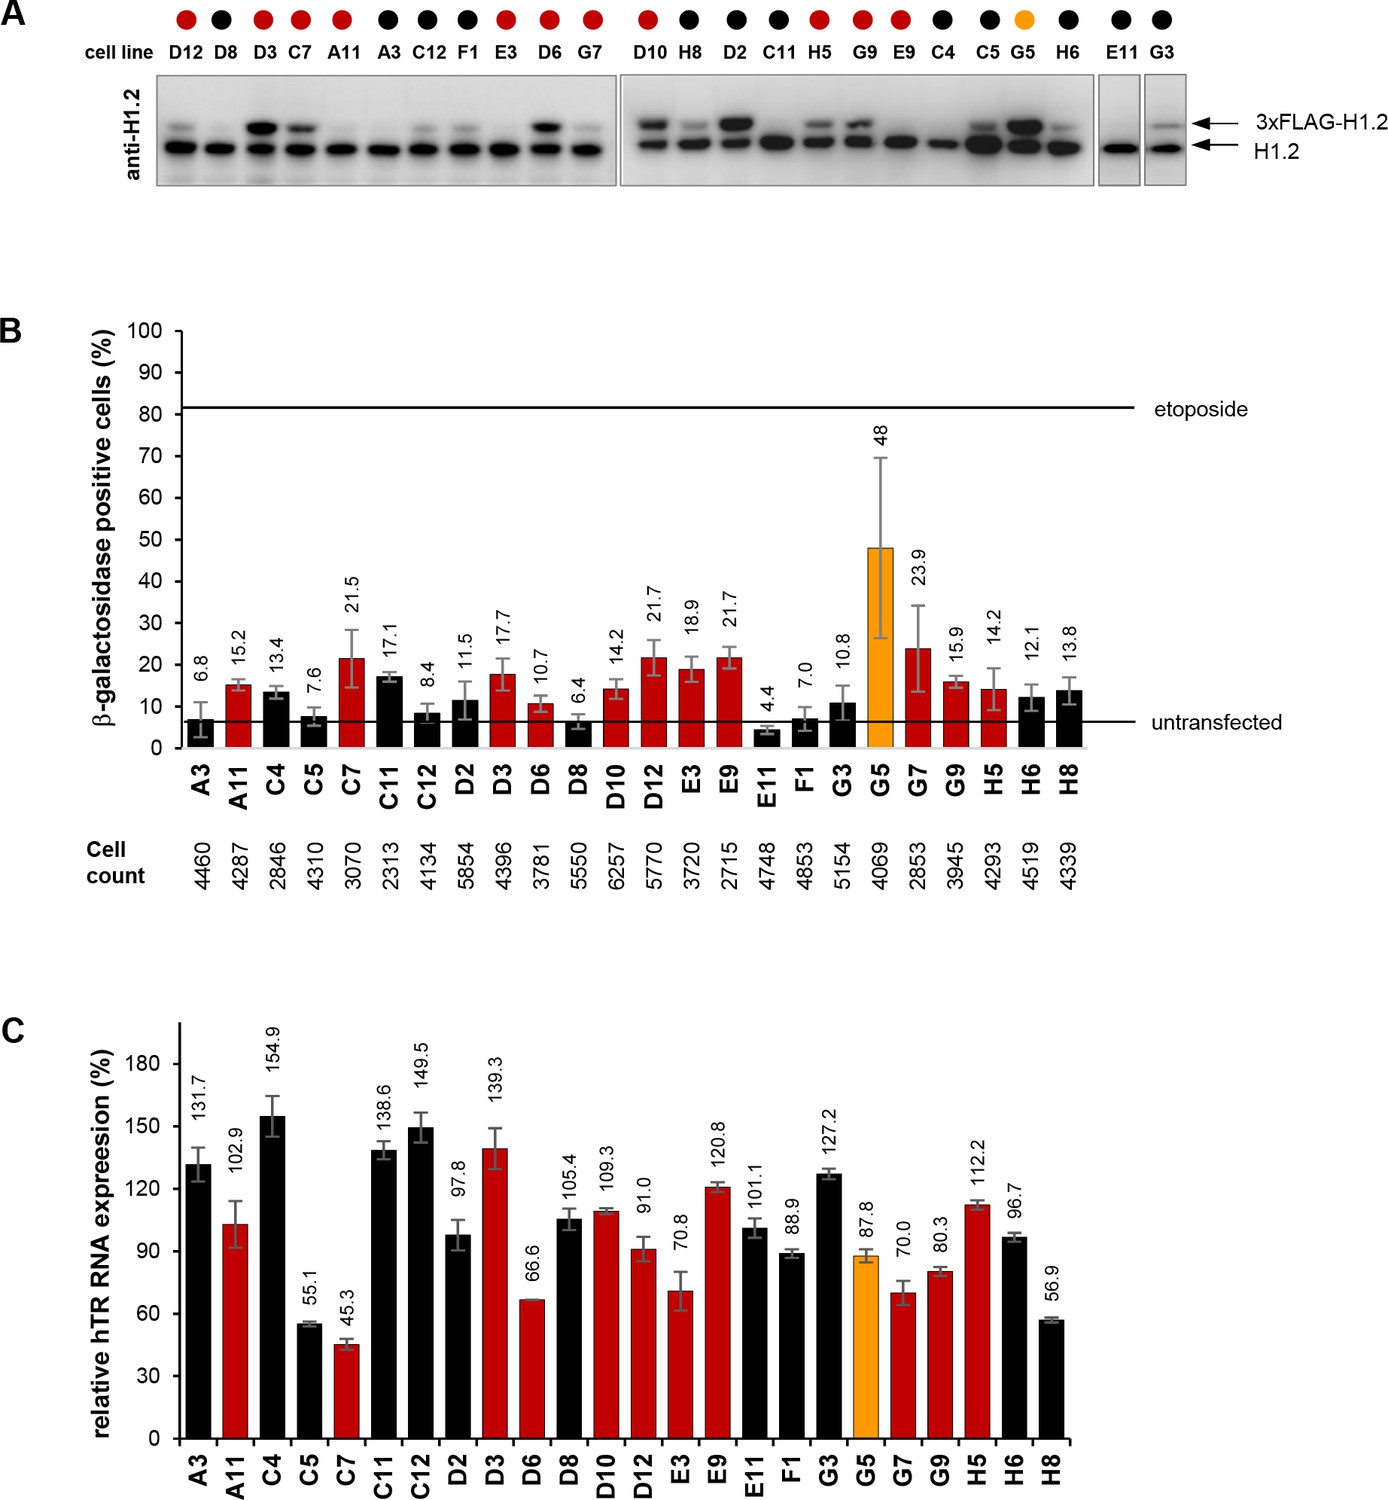
Western blots, cellular senescence assays, and qRT-PCR measurements on wtHIST1H1C-expressing clonal HT1080 cell lines.
(A) Western blots showing endogenous H1.2 and 3xFLAG-H1.2 expression in individual cell lines. (B) β-galactosidase staining was carried out in triplicates on clonal HT1080 cell lines as described in the Materials and methods. The total number of cells counted for each clone is indicated below the chart. (C) hTR expression levels measured by qRT-PCR, expressed relative to the average value in the 24 clonal cell lines. The color code corresponds to the ‘HIST1H1C baseline’ and ‘HIST1H1C high’ groups described in Figure 6A.
Figure 6—figure supplement 2
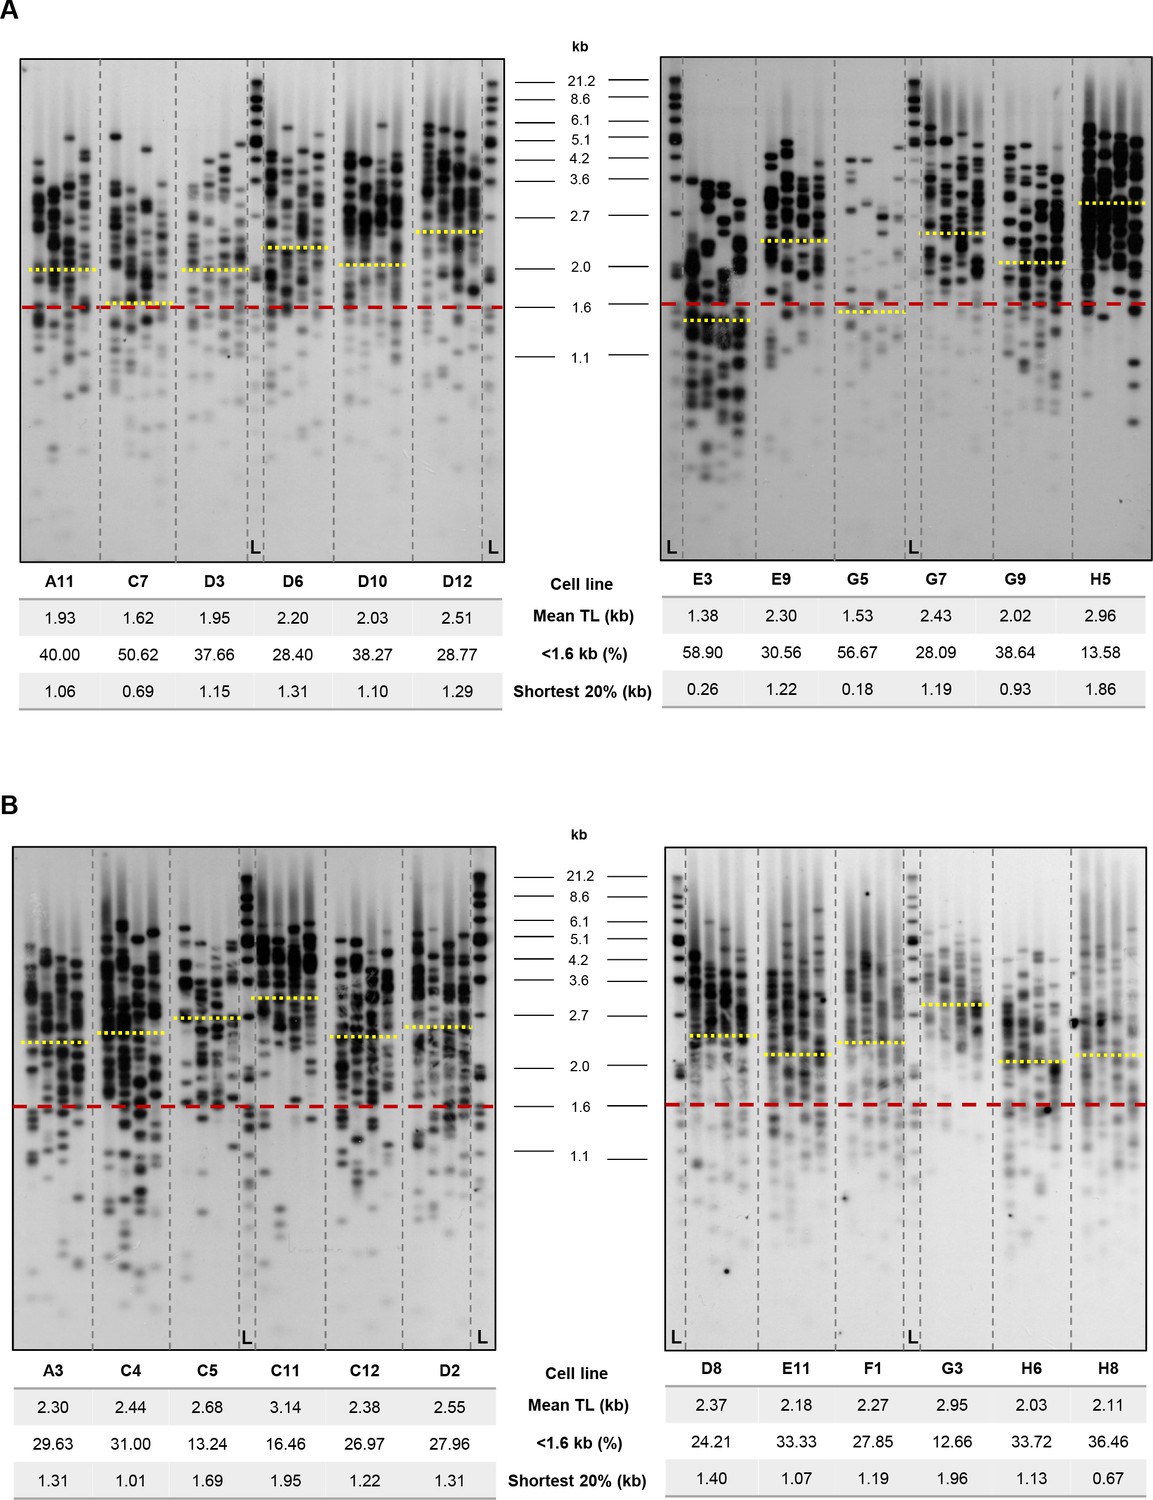
Southern blots and telomere length measurements of clonal, wtHIST1H1C-transfected HT1080 cell lines.
TeSLA (four parallel PCR reactions for each cell line) was carried out on the 24 clonal HT1080 cell lines at 10 weeks post-transfection. Southern blots for the ‘HIST1H1C high’ (A) and ‘HIST1H1C baseline’ clones (B) are shown, together with telomere length values measured by the TeSLA-QUANT software (Lai et al., 2017). Yellow lines indicate the MTL of individual cell lines, while the red line shows the threshold set for short telomeres. L indicates the molecular weight marker.
Figure 7 with 1 supplement
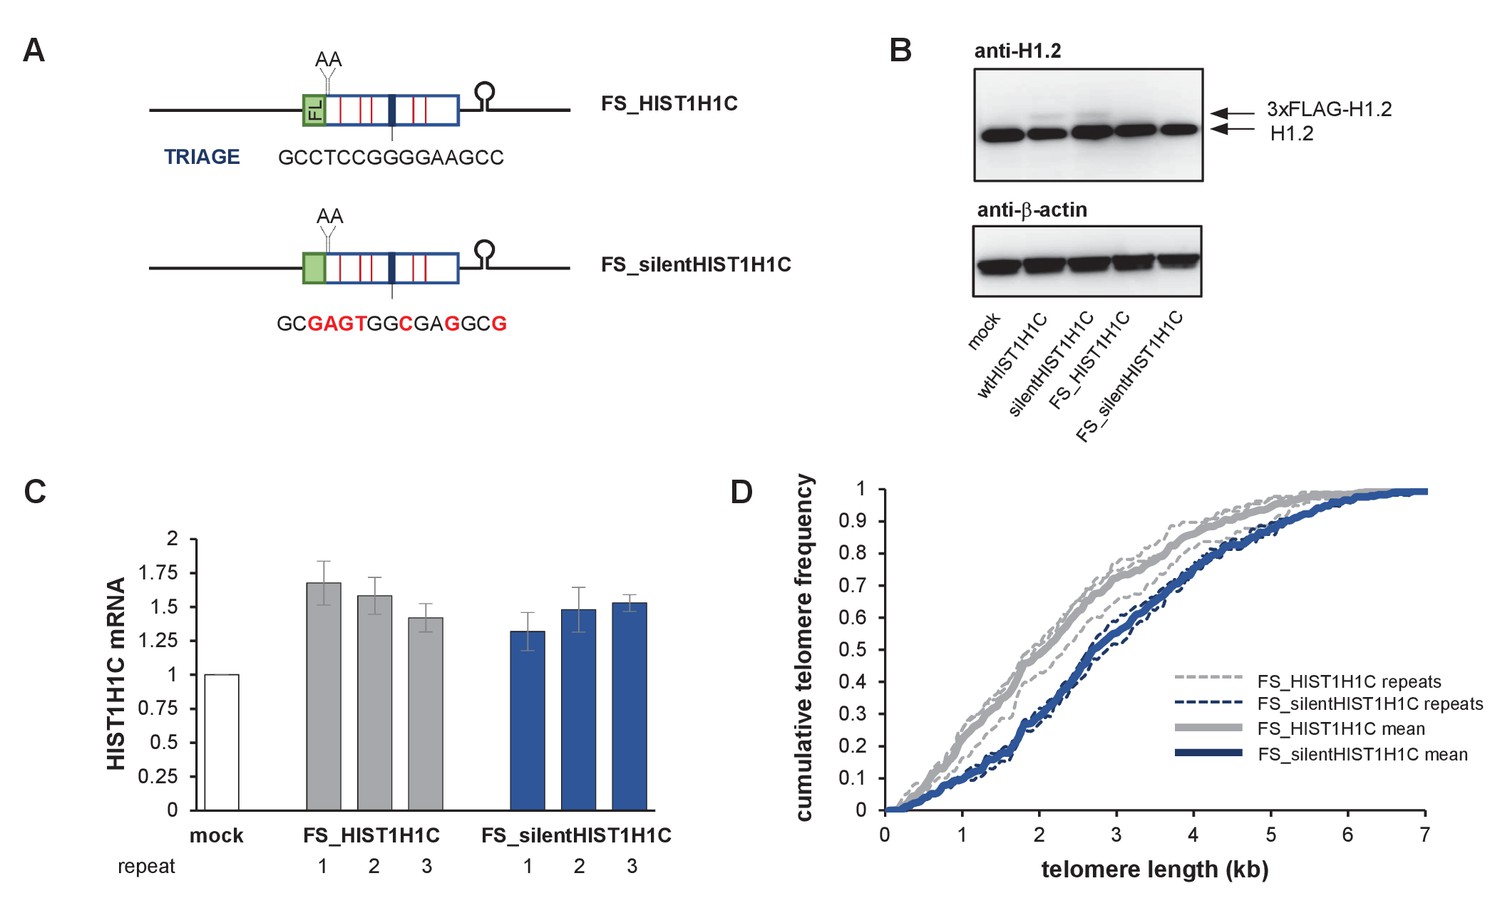
HIST1H1C regulates telomere length acting as a non-coding RNA.
(A) Schematic representation of HIST1H1C expression constructs containing a two-nucleotide frameshift achieved by insertion of two adenines following the 3xFLAG tag (FL). The frameshift results in several stop codons in the HIST1H1C ORF (red lines), and completely abolishes 3xFLAG-H1.2 expression, assessed by western blotting (B). (C) HIST1H1C mRNA expression levels in polyclonal HT1080 cell lines stably transfected with the indicated constructs were measured 3 months post-transfection by qRT-PCR. Error bars represent s.d., n = 2, with triplicates each. (D) Telomere length of the polyclonal HT1080 cell lines was measured by the TeSLA method at 3 months post-transfection. Cumulative telomere frequency (calculated as the ratio of telomeres below a certain length) is shown for the individual cell lines (thin dashed lines) and as average for the three biological replicates (thick lines). TeSLA blots and the associated telomere length values for the individual cell lines are provided in Figure 7—figure supplement 1.
Figure 7—figure supplement 1
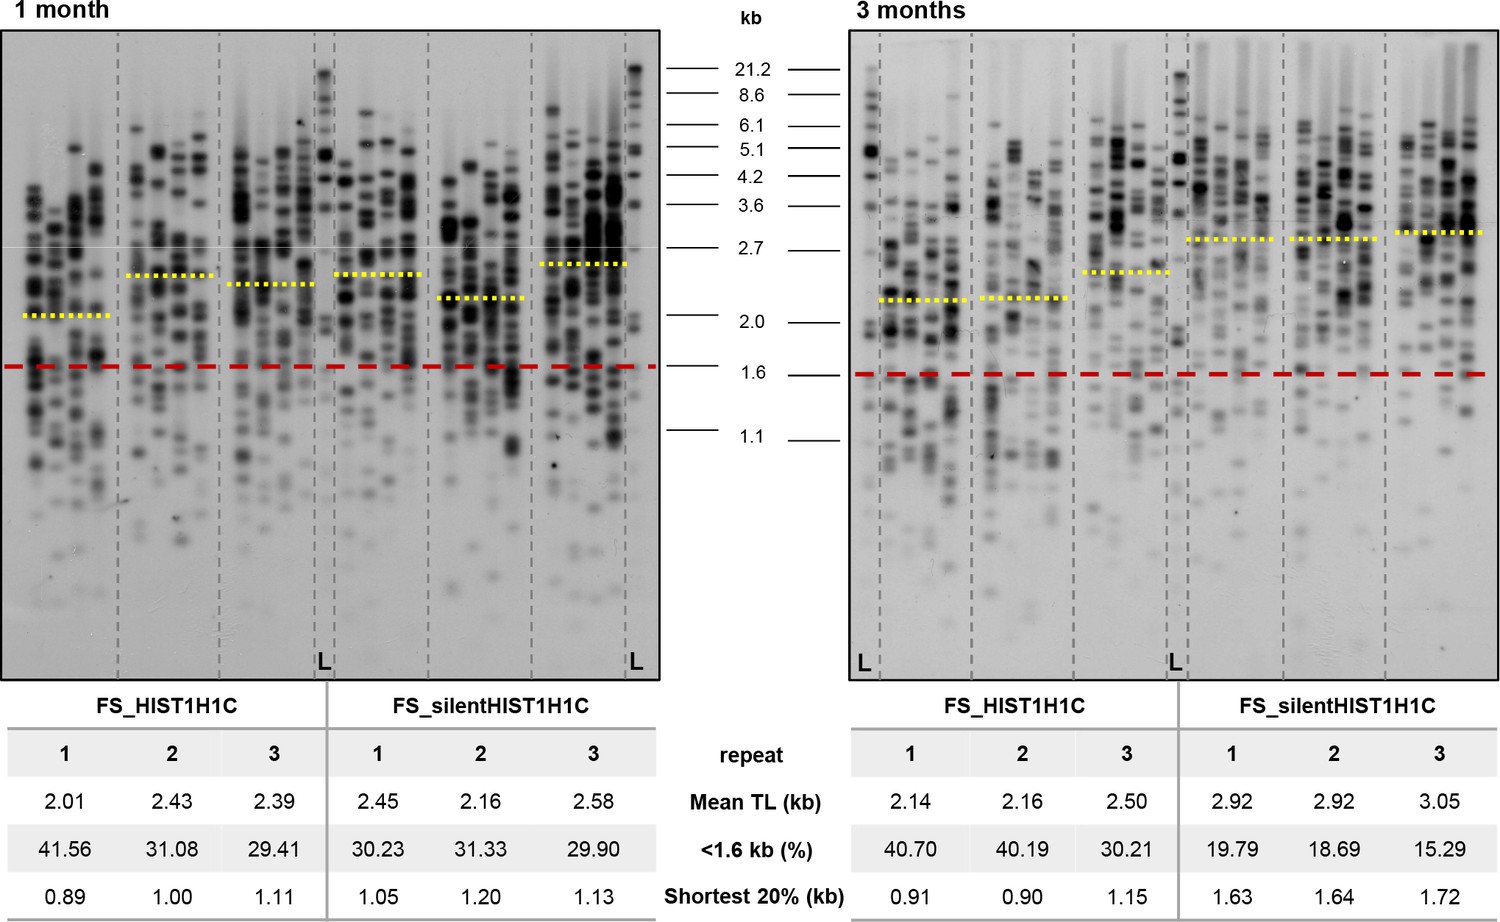
Southern blots and telomere length measurements of polyclonal HT1080 cell lines stably expressing the frameshifted HIST1H1C constructs.
TeSLA (four parallel reactions for each cell line) was carried out at one and three months post-transfection. Southern blots, together with telomere length values measured by the TeSLA-QUANT software (Lai et al., 2017) are shown. Yellow lines indicate the MTL of individual cell lines, while the red line shows the threshold set for short telomeres. L indicates the molecular weight marker.
Figure 8
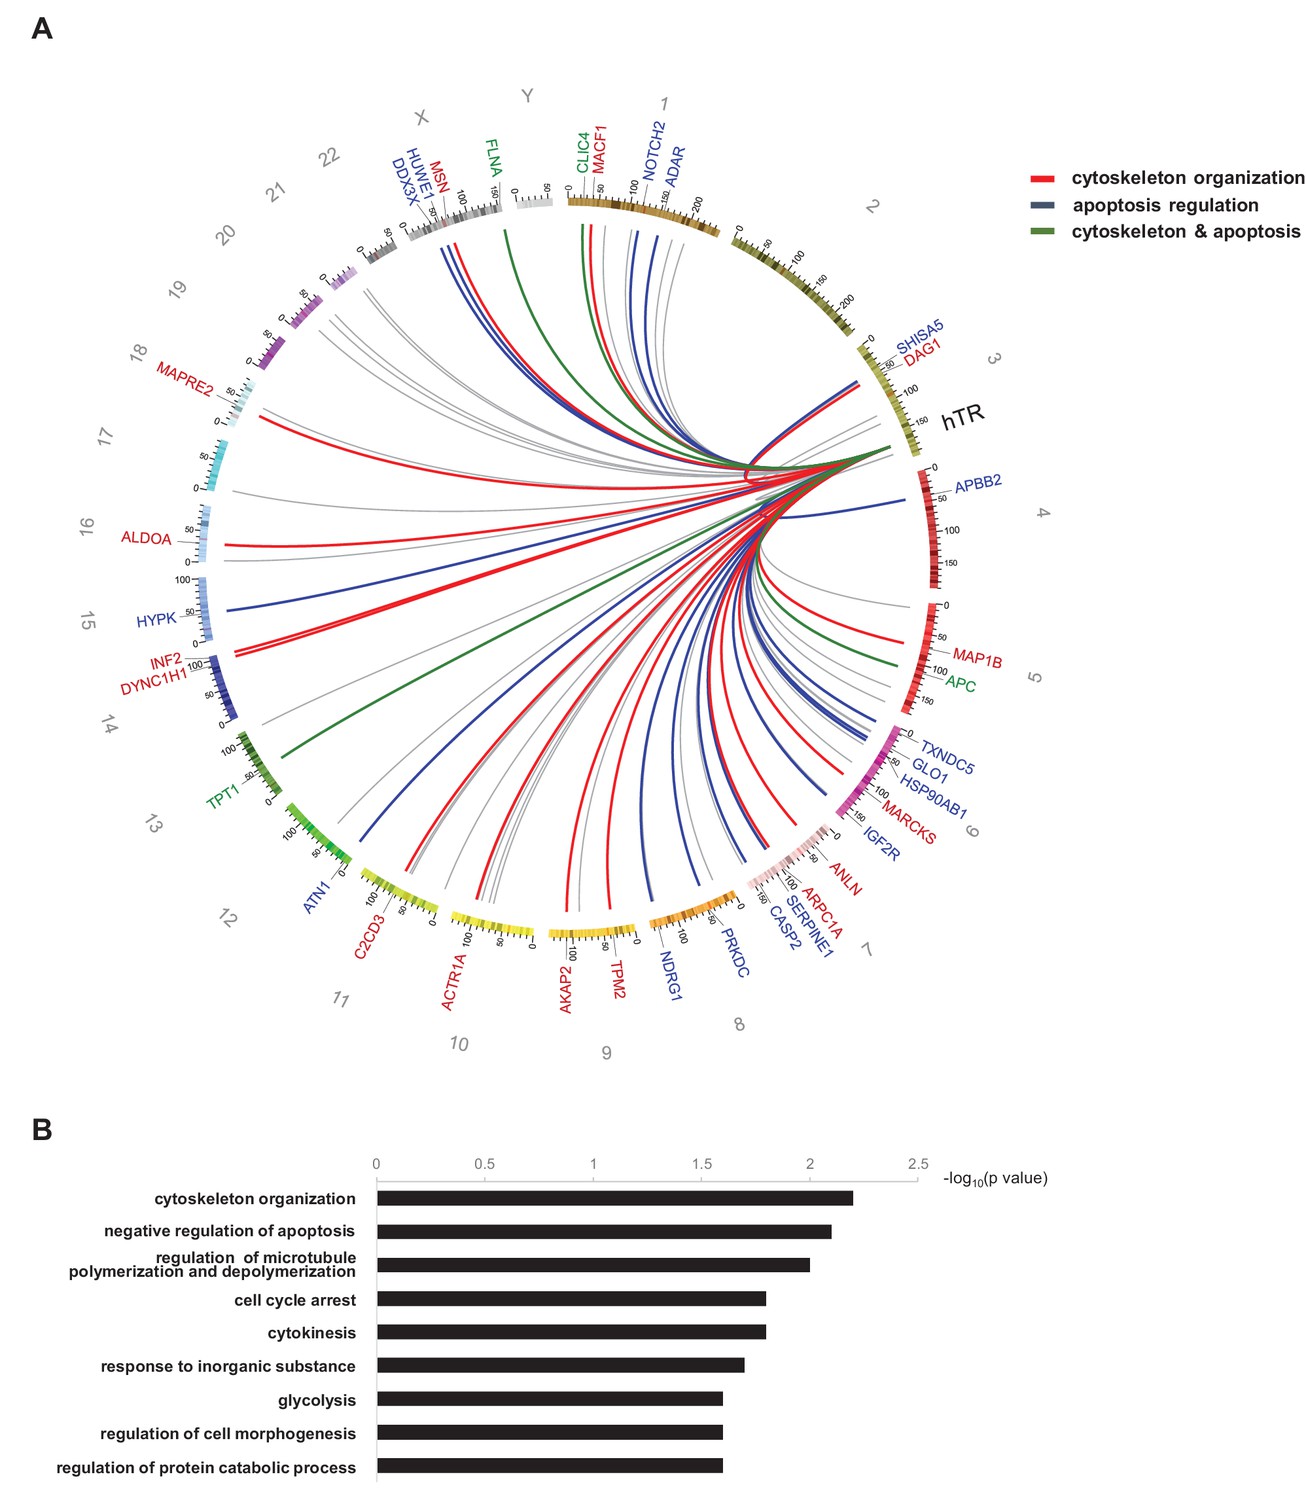
Functional annotation analysis of the hTR interactome.
(A) Circos plot (Krzywinski et al., 2009) depicting hTR-interacting mRNAs coding for proteins functionally associated with cytoskeleton organization (red links and labels), apoptosis regulation (blue links and labels), or both (green links and labels). Links shown in grey correspond to RNAs not functionally associated with either cytoskeleton organization or apoptosis. The most significant gene ontology terms (GOTERM_BP_FAT, using DAVID 6.7) associated with the hTR RNA interactome are shown in (B).
Figure 9
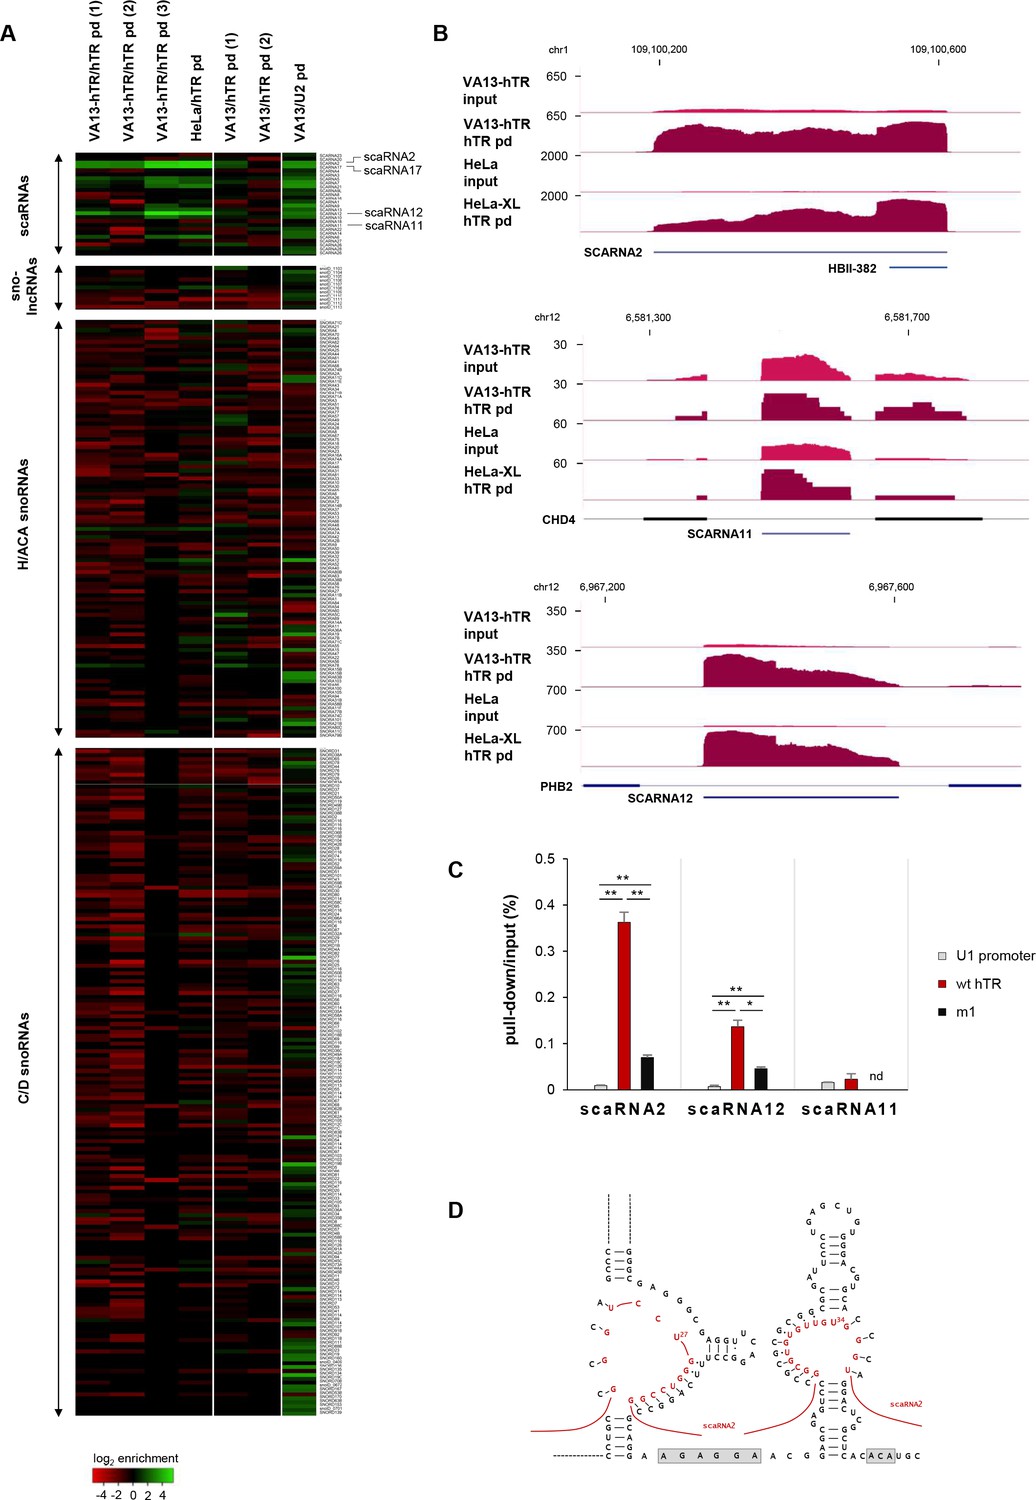
hTR selectively interacts with a subset of small Cajal-body-specific non-coding RNAs.
(A) Heat map showing the enrichment of small nucleolar RNAs (snoRNAs) and small Cajal body-specific RNAs (scaRNAs) upon hTR or U2 small nuclear RNA pull-down (pd). SnoRNA co-ordinates were obtained from Jorjani et al. (2016). Only snoRNAs with at least 10 RNA-sequencing reads supporting their expression were included in the figure. The position of highly enriched transcripts upon hTR pull-down (scaRNA2, scaRNA17, and scarRNA12), as well as the non-enriched scaRNA11 are indicated on the right. Figure generated using Heatmapper (Babicki et al., 2016). Note that U2 is expected to interact with scaRNAs, as they mediate the modification of snRNAs. (B) UCSC genome browser view showing coverage of RAP-RNA[FA] RNA-seq for selected scaRNAs. The y axis indicates reads per million. (C) qRT-PCR of scaRNA enrichments upon hTR pull-down from VA13 cells transiently transfected with the hTR expression constructs indicated. Error bars represent s.d. Representative results from two independent transfections, measured in triplicates, are shown. nd: not detectable. Paired two-tailed t-tests, *p<0.05, **p<0.01. (D) Hypothetical base-pairing between scaRNA2 and the pseudouridylation pockets of hTR. Base-pairing in the 5’ pocket will require the formation of an alternative secondary structure for the 5’ H/ACA hairpin of hTR (Egan and Collins, 2010; Theimer et al., 2007), different from the canonical structure (Chen et al., 2000) shown in Figure 1A.
Tables
Key resources table
| Reagent type (species) or resource | Designation | Source or reference | Identifiers or link | Additional information |
|---|---|---|---|---|
| Genetic reagent | Lipofectamine 2000 | Thermo Fisher Scientific | Cat#11668019 | |
| Cell line (Homo sapiens) | WI38 VA13-2RA | Daniela Rhodes lab (Nanyang Technological University) | N/A | |
| Cell line (Homo sapiens) | HT1080 | Peter Dröge lab (Nanyang Technological University) | N/A | |
| Cell line (Homo sapiens) | HeLa | Peter Dröge lab (Nanyang Technological University) | N/A | |
| Antibody | Anti-Histone H1.2 antibody [EPR12691] | Abcam | Cat#ab181977 | WB: 1:2000 |
| Antibody | Monoclonal anti-FLAG M2 antibody | Sigma-Aldrich | Cat#F1804; RRID:AB_262044 | WB: 1:1500 |
| Antibody | Anti-p53 (DO-1) antibody | Santa Cruz Biotechnology | Cat#sc126; RRID: AB_628082 | WB: 1:1000 |
| Antibody | Mouse Monoclonal Anti-beta- Actin | Sigma-Aldrich | Cat# A2228, RRID:AB_476697 | WB: 1:5000 |
| Antibody | Goat Polyclonal Anti-Mouse | Dako | Cat# P0447, RRID:AB_2617137 | WB: 1:10000 |
| Antibody | Goat Polyclonal Anti-Rabbit | Dako | Cat# P0448, RRID:AB_2617138 | WB: 1:10000 |
| Recombinant DNA reagent | pU1-hTR(451) | This paper | N/A | |
| Recombinant DNA reagent | pBS-U1-hTR | Cristofari and Lingner (2006) | N/A | |
| Recombinant DNA reagent | pBS-U1-hTR-puro | This paper | N/A | |
| Recombinant DNA reagent | pPGK-puro-3xFLAG-wtHIST1H1C | This paper | N/A | |
| Recombinant DNA reagent | pPGK-puro-3xFLAG-silentHIST1H1C | This paper | N/A | |
| Sequence- based reagent | NEBNext Multiplex Oligos for Illumina (Index Primers Set 1) | New England Biolabs | Cat#E7335S | |
| Commercial assay or kit | TeloTAGGG Telomere Length Assay kit | Roche | Cat#12209136001 | |
| Commercial assay or kit | DNeasy Blood and Tissue Kit | Qiagen | Cat#69506 | |
| Commercial assay or kit | Senescence β-Galactosidase Staining Kit | Cell Signaling Technology | Cat#9860 | |
| Commercial assay or kit | QuantiNova SYBR Green RT-PCR Kit | Qiagen | Cat#208154 | |
| Commercial assay or kit | ThermoScript RT-PCR System | Thermo Fisher Scientific | Cat#11146–024 | |
| Commercial assay or kit | Mycoplasma PCR Detection Kit | Applied Biological Materials | Cat#G238 | |
| Commercial assay or kit | Qubit dsDNA HS Assay Kit | Thermo Fisher Scientific | Cat#Q32851 | |
| Chemical compound, drug | Etoposide | Sigma-Aldrich | Cat#E1383 | |
| Chemical compound, drug | Pierce 16% Formaldehyde (w/v), Methanol-free | Thermo Fisher Scientific | Cat#28906 | |
| Chemical compound, drug | Bovine albumin fraction V | Thermo Fisher Scientific | Cat#15260037 | |
| Chemical compound, drug | Trizol reagent | Thermo Fisher Scientific | Cat#15596026 | |
| Chemical compound, drug | Dynabeads MyOne Streptavidin C1 | Thermo Fisher Scientific | Cat#65001 | |
| Chemical compound, drug | Dynabeads MyOne Silane | Thermo Fisher Scientific | Cat#37002D | |
| Chemical compound, drug | Agencourt AMPure XP | Beckman Coulter | Cat#A63880 | |
| Chemical compound, drug | Ribonuclease H | Thermo Fisher Scientific | Cat#18021014 | |
| Chemical compound, drug | RNase inhibitor, murine | New England Biolabs | Cat#M0314S | |
| Chemical compound, drug | FastAP Thermosensitive Alkaline Phosphatase | Thermo Fisher Scientific | Cat#EF0651 | |
| Chemical compound, drug | T4 polynucleotide kinase | New England Biolabs | Cat#M0201S | |
| Chemical compound, drug | Turbo DNase | Thermo Fisher Scientific | Cat#AM2239 | |
| Chemical compound, drug | Exonuclease I | New England Biolabs | Cat#M0293S | |
| Chemical compound, drug | RQ1 RNase-free DNase | Promega | Cat#M6101 | |
| Chemical compound, drug | ExoSAP-IT PCR Product Cleanup Reagent | Thermo Fisher Scientific | Cat#78200.200 .UL | |
| Chemical compound, drug | NEBNext Ultra II Q5 Master Mix | New England Biolabs | Cat#M0544S | |
| Chemical compound, drug | SYBR Green PCR Master Mix | Thermo Fisher Scientific | Cat#4364344 | |
| Chemical compound, drug | FailSafe enzyme mix | Lucigen | Cat# FSE5101K | |
| Software, algorithm | HISAT2 v2.0.3 | Kim et al., 2015 | https://ccb.jhu.edu/software/hisat2/index.shtml RRID:SCR_015530 | |
| Software, algorithm | BamTools | Barnett et al., 2011 | https://github.com/pezmaster31/bamtools RRID:SCR_015987 | |
| Software, algorithm | JAMM peak finder v1.0.7.5 | Ibrahim et al., 2015 | https://github.com/mahmoudibrahim/JAMM | |
| Software, algorithm | RNAup | Gruber et al., 2008 | http://rna.tbi.univie.ac.at/cgi-bin/RNAWebSuite/RNAup.cgi | |
| Software, algorithm | Circos | Krzywinski et al., 2009 | http://circos.ca/ RRID:SCR_011798 | |
| Software, algorithm | Heatmapper | Babicki et al., 2016 | http://heatmapper.ca/ | |
| Software, algorithm | DAVID 6.7 | Huang et al., 2009a, Huang et al., 2009b | https://david-d.ncifcrf.gov/ RRID:SCR_001881 | |
| Software, algorithm | TeSLA-QUANT | Lai et al., 2017 | Available as supplementary item in Lai et al., 2017 | |
| Other | RNA-sequencing data | This paper | SRP123633 https://trace.ncbi.nlm.nih.gov/Traces/sra/?study=SRP123633 |
Table 1
qRT-PCR primers used in this study.
https://doi.org/10.7554/eLife.40037.022| Primer name | Sequence (5’ to 3’) | Reference |
|---|---|---|
| hTR_fw | GAAGAGGAACGGAGCGAGTC | Xi and Cech (2014) |
| hTR_rev | ATGTGTGAGCCGAGTCCTG | Xi and Cech (2014) |
| GAPDH_fw | ACAGCAACAGGGTGGTGGAC | Xi and Cech (2014) |
| GAPDH_rev | GACCATTGCTGGGGCTGGTG | Xi and Cech (2014) |
| 28S_rRNA_fw | GTGTCAGAAAAGTTACCACA | Rocchi et al. (2014) |
| 28S_rRNA_rev | ATTATGCTGAGTGATATCCC | Rocchi et al. (2014) |
| HIST1H1C(272-386)_fw | GCACTCTGGTGCAAACGAAAG | |
| HIST1H1C(272-386)_rev | TTAGGTTTGGTTCCGCCCG | |
| HIST1H1C(53-145)_fw | CCCCTGTAAAGAAGAAGGCGG | |
| HIST1H1C(53-145)_rev | CCACAGCCTTGGTGATGAGC | |
| HIST1H4D_fw | CCAAGCGTCACCGTAAGGTAT | |
| HIST1H4D_rev | AAACTTTCAGCACTCCGCGA | |
| HIST1H3B_fw | AGACAGCTCGGAAATCCACC | |
| HIST1H3B_rev | AACGGTGAGGCTTTTTCACG | |
| scaRNA2_fw | TTTAGGGAGGGAGAGCGGC | |
| scaRNA2_rev | CTCACGCGTCCACTCACAC | |
| scaRNA11_fw | GTCCTGGCCTATTTTTCTGCTCC | |
| scaRNA11_rev | CGGCCCTCCTAAACTGAGAGG | |
| scaRNA12_fw | TGGGGACTACAGATGAGATCTGA | |
| scaRNA12_rev | GATCCAAGGTTGCGCTCAGG | |
| TPT1_fw | GGCCTTTTCCGCCCGC | |
| TPT1_rev | CTAGCTTAGCACGAGCCTGA | |
| FLNA_fw | CGGTGATCACTGTGGACACTA | |
| FLNA_rev | ATTCTCCACCACGTCCACATC | |
| IFITM3_fw | GAGCTCTGCCCATGACCTG | |
| IFITM3_rev | GCTGATACAGGACTCGGCTC |
Additional files
-
Supplementary file 1
Enriched peaks identified in hTR pull-down samples, using the JAMM universal peak finder (Ibrahim et al., 2015).
- https://doi.org/10.7554/eLife.40037.023
-
Transparent reporting form
- https://doi.org/10.7554/eLife.40037.024
Download links
A two-part list of links to download the article, or parts of the article, in various formats.
Downloads (link to download the article as PDF)
Open citations (links to open the citations from this article in various online reference manager services)
Cite this article (links to download the citations from this article in formats compatible with various reference manager tools)
The RNA interactome of human telomerase RNA reveals a coding-independent role for a histone mRNA in telomere homeostasis
eLife 7:e40037.
https://doi.org/10.7554/eLife.40037


