Mycobacterium tuberculosis SatS is a chaperone for the SecA2 protein export pathway
- University of North Carolina at Chapel Hill, United States
- Texas A&M University, United States
Figures
Figure 1 with 1 supplement
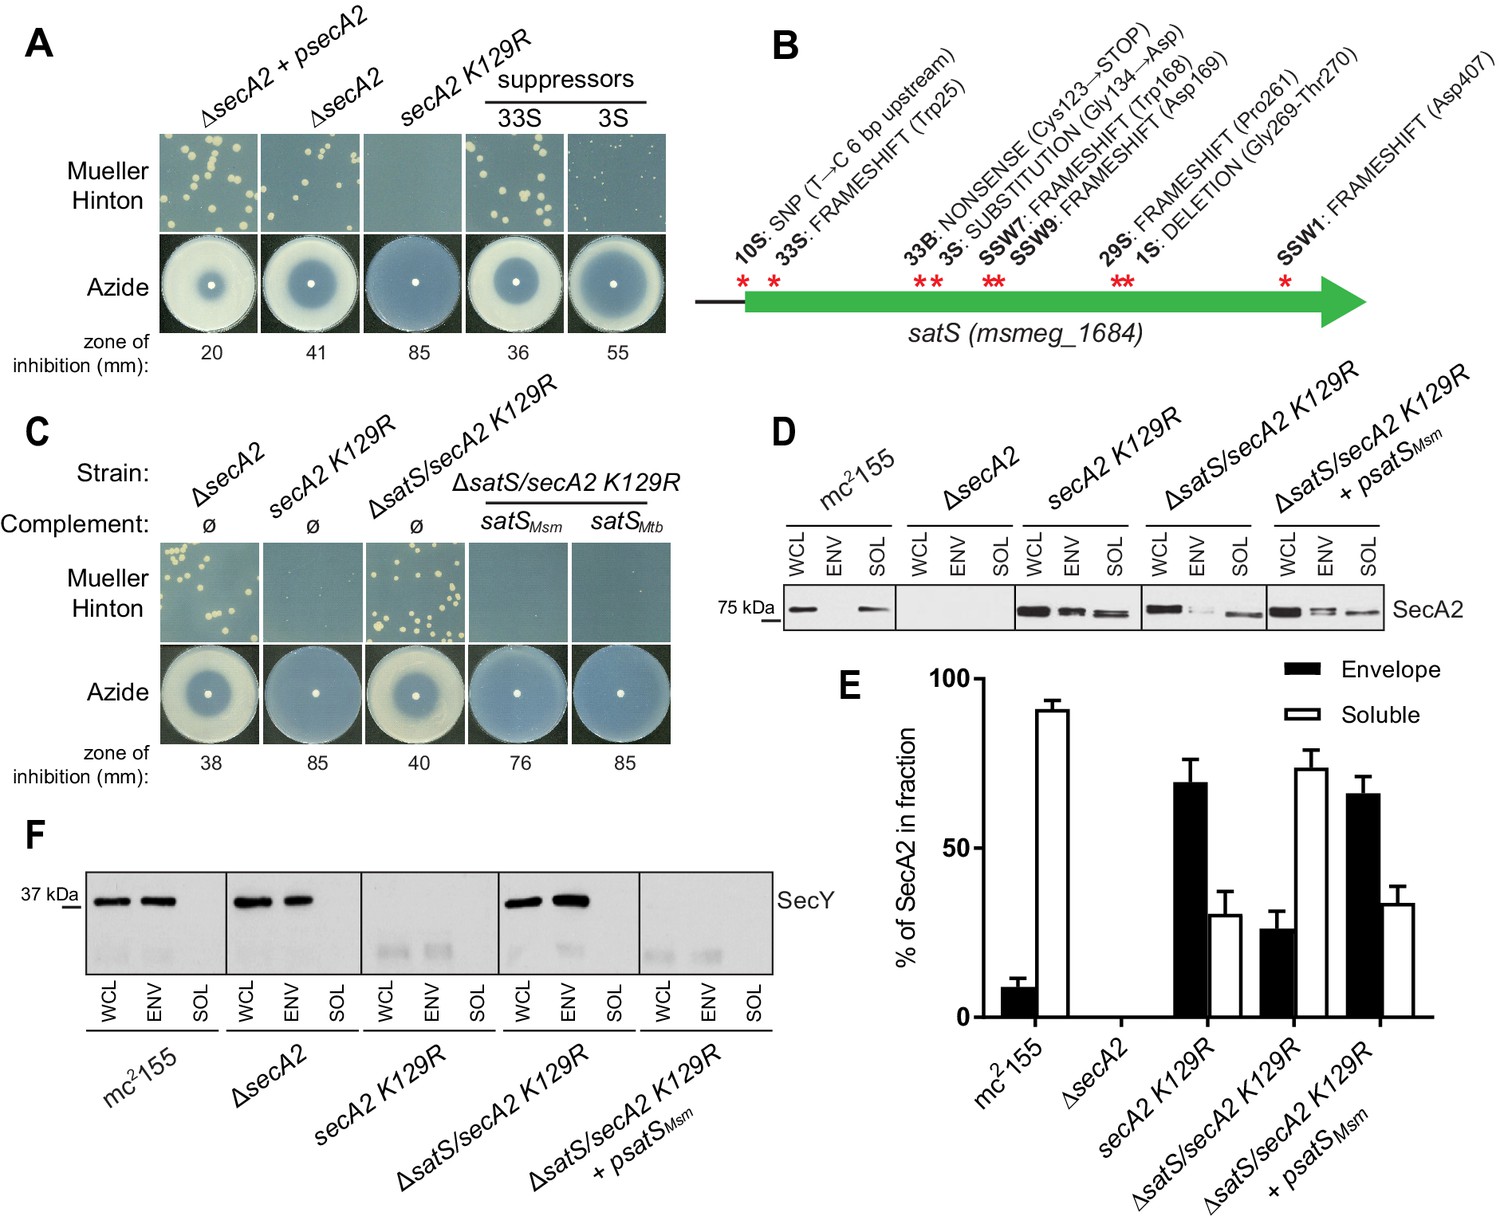
∆satS mutant suppresses SecA2 K129R phenotypes.
(A) Mueller-Hinton growth phenotypes and azide sensitivity of M. smegmatis ∆secA2 mutant expressing wild-type secA2 (∆secA2 +psecA2), an empty vector, or secA2 K129R (secA2 K129R), and two representative suppressors. (B) Nine suppressor mutations affected satS (msmeg_1684). Red stars indicate approximate locations of mutations. For panels C, D, E and F, wild-type M. smegmatis mc2155, ∆secA2, secA2 K129R, ∆satS/secA2 K129R, and ∆satS/secA2 K129R complemented with satSMsm or satSMtb were used. (C) Mueller-Hinton growth phenotypes and azide sensitivity of the strains described above. (D) Whole cell lysates (WCL), subcellular envelope (ENV) and soluble (SOL) fractions were separated by SDS-PAGE, and SecA2 protein was detected by Immunoblot. (E) Densitometry was used to quantify SecA2 levels in the soluble and envelope fractions (ImageJ). Percent localization to a given fraction for SecA2 is reported as the percentage of the total (soluble +envelope). Error bars indicate the standard error of the mean of three independent experiments. (E) Subcellular fractions were separated by SDS-PAGE and SecY protein was detected by Immunoblot. All results shown are representative of at least three independent experiments.
Figure 1—figure supplement 1

Characterization of the M. smegmatis ∆satS mutant.
(A) Liquid cultures of M. smegmatis mc2155 and ΔsatS were grown in 96-well plates with a starting cell count of 1 × 10⁴ cells/well. After 24 hr, resazurin was added and relative fluorescence units (RFU) were measured over the next 20 hr. Polyclonal antibodies against SatS were generated in rabbits and used to localize SatS in M. smegmatis mc2155 by Immunoblot, using the ∆satS mutant as a control for specificity. GroEL and MspA were used to validate the purity of the fractions.
Figure 2 with 4 supplements
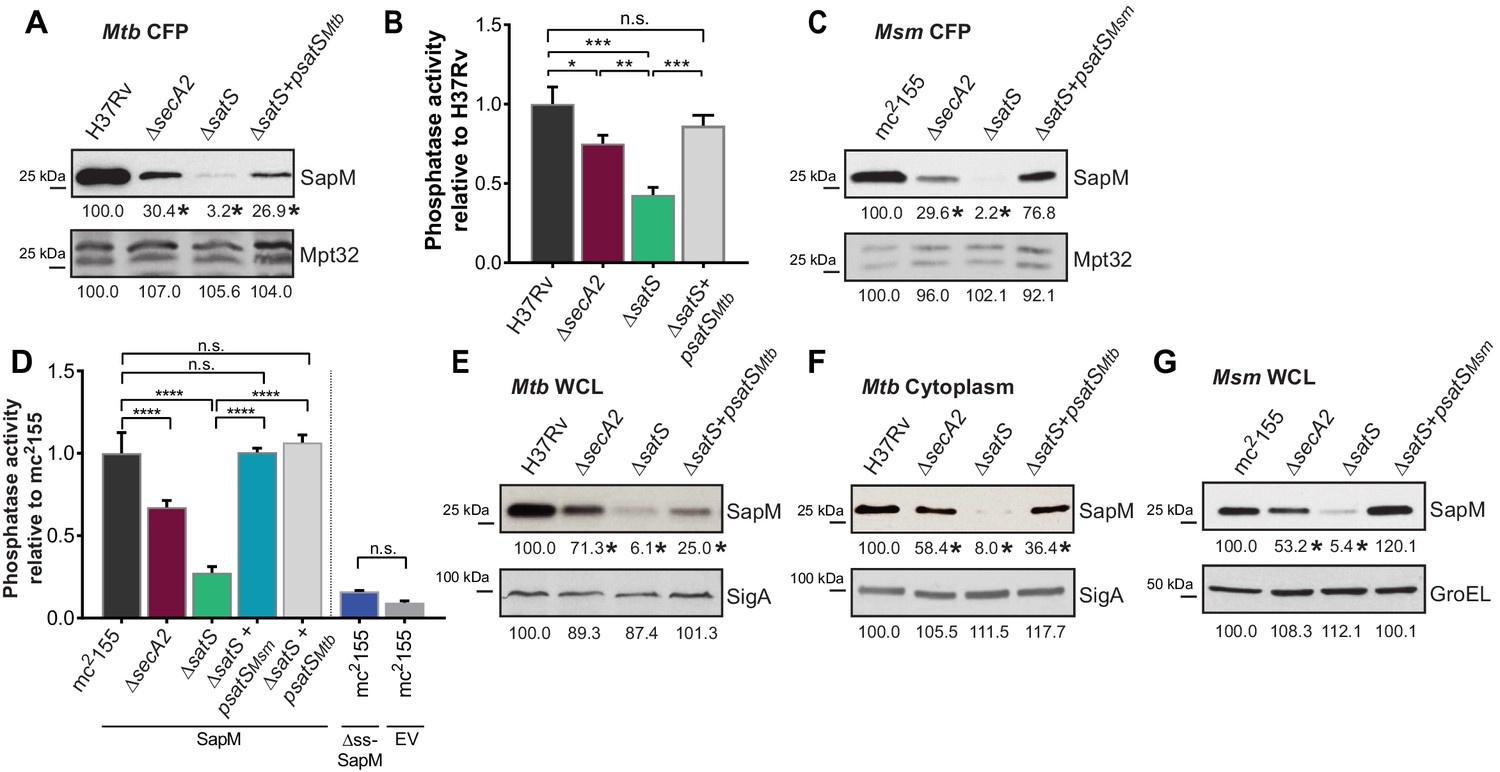
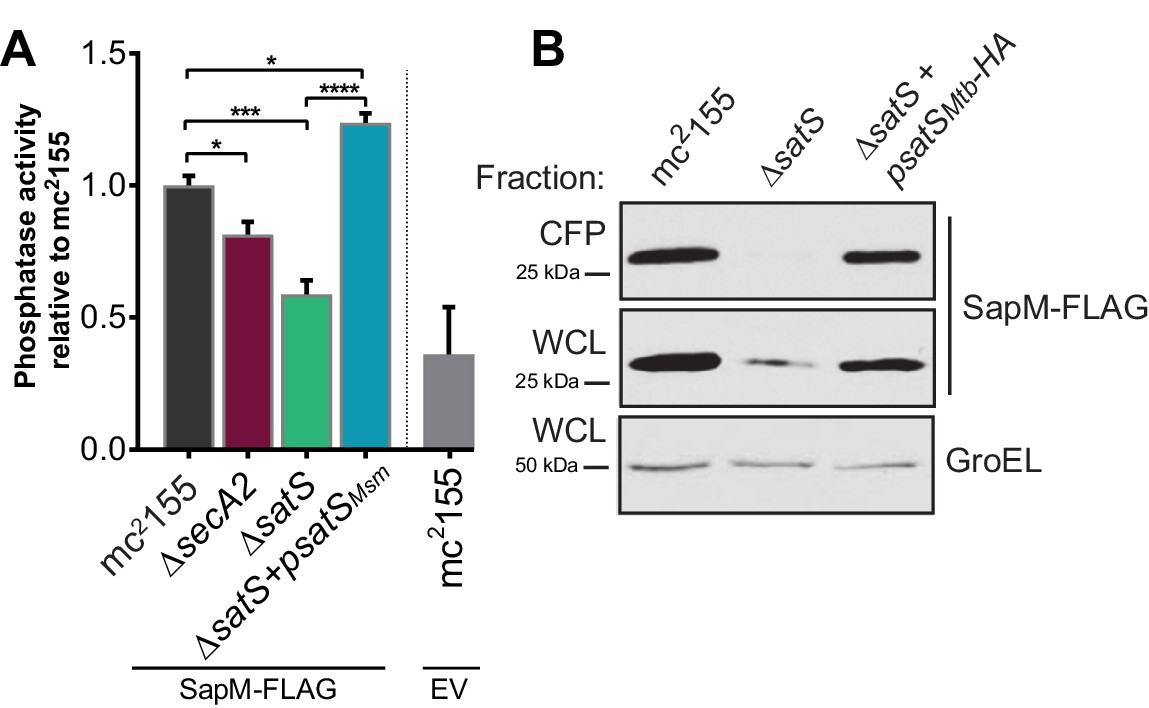
SatS is required for the export of SapM.
(A) Equal protein from culture supernatants from M. tuberculosis H37Rv, ∆secA2, ∆satS and the complemented strain (∆satS +psatSMtb) were immunoblotted for SapM and Mpt32. (B) Phosphatase activity in triplicate culture supernatant samples was examined by quantifying cleavage of pNPP. Rates of pNPP cleavage were normalized to H37Rv. (C) Equal protein from culture supernatants from M. smegmatis mc2155, ∆secA2, ∆satS and the complemented strain (∆satS +psatSMsm) were examined for levels of SapM and Mpt32 by Immunoblot (D) Whole cell phosphatase activity assay in M. smegmatis. All strains are expressing SapM, SapM lacking its signal sequence (∆ss-SapM), or an empty vector as indicated. Triplicate wells containing 2 × 10⁵ cells/well were grown in a 96 well plate for 24 hr at 37°C before measuring phosphatase activity by quantifying cleavage of pNPP. Rates were normalized to mc2155 +SapM. (E) Equal protein levels from whole cell lysates prepared from the same cultures as used for panel A or (F) the soluble, cytoplasmic fraction of M. tuberculosis H37Rv, ∆secA2, ∆satS and the complemented strain (∆satS +psatSMtb) were immunoblotted for SapM and SigA. (G) Equal protein levels from whole cell lysates of prepared from the same cultures as used for panel C were immunoblotted for SapM and GroEL. Densitometry of blots from three experiments was performed (ImageJ). Percent difference of the mean intensity relative to wild-type is reported below each immunoblot. All data are representative of at least three independent experiments and all error bars represent standard deviation of the mean of three independent replicates for each strain. n.s. – no significant difference; *, p<0.05; **, p<0.01; ***, p<0.001; ****, p<0.0001 by ANOVA and Tukey’s post hoc test.
Figure 2—figure supplement 1
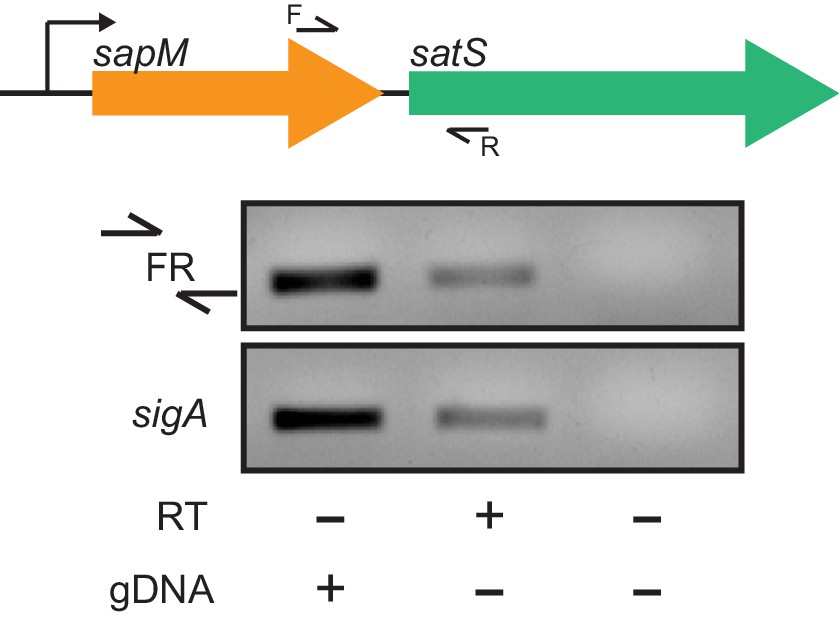
satS and sapM are co-transcribed.
Visualization of the operon structure of sapM and satS and the location of the primers used. Primer set FR flanking the intergenic region between sapM and satS and a control primer set in the housekeeping gene sigA were used to amplify M. tuberculosis H37Rv RNA in the presence or absence of RT.
Figure 2—figure supplement 2

Characterization of the M.tuberculosis ∆satS mutant.
(A) The ΔsatS mutant of M. tuberculosis and the parental H37Rv strain were grown in liquid 7H9 medium with ADS supplementation. Growth was monitored by measuring optical density (OD600) over time. Polyclonal antibodies against SatS were generated in rabbits and used to localize SatS in M. tuberculosis H37Rv by Immunoblot, using the ∆satS mutant as a control for specificity. SigA, PhoS1 and HbHA were used to validate the purity of the fractions.
Figure 2—figure supplement 3
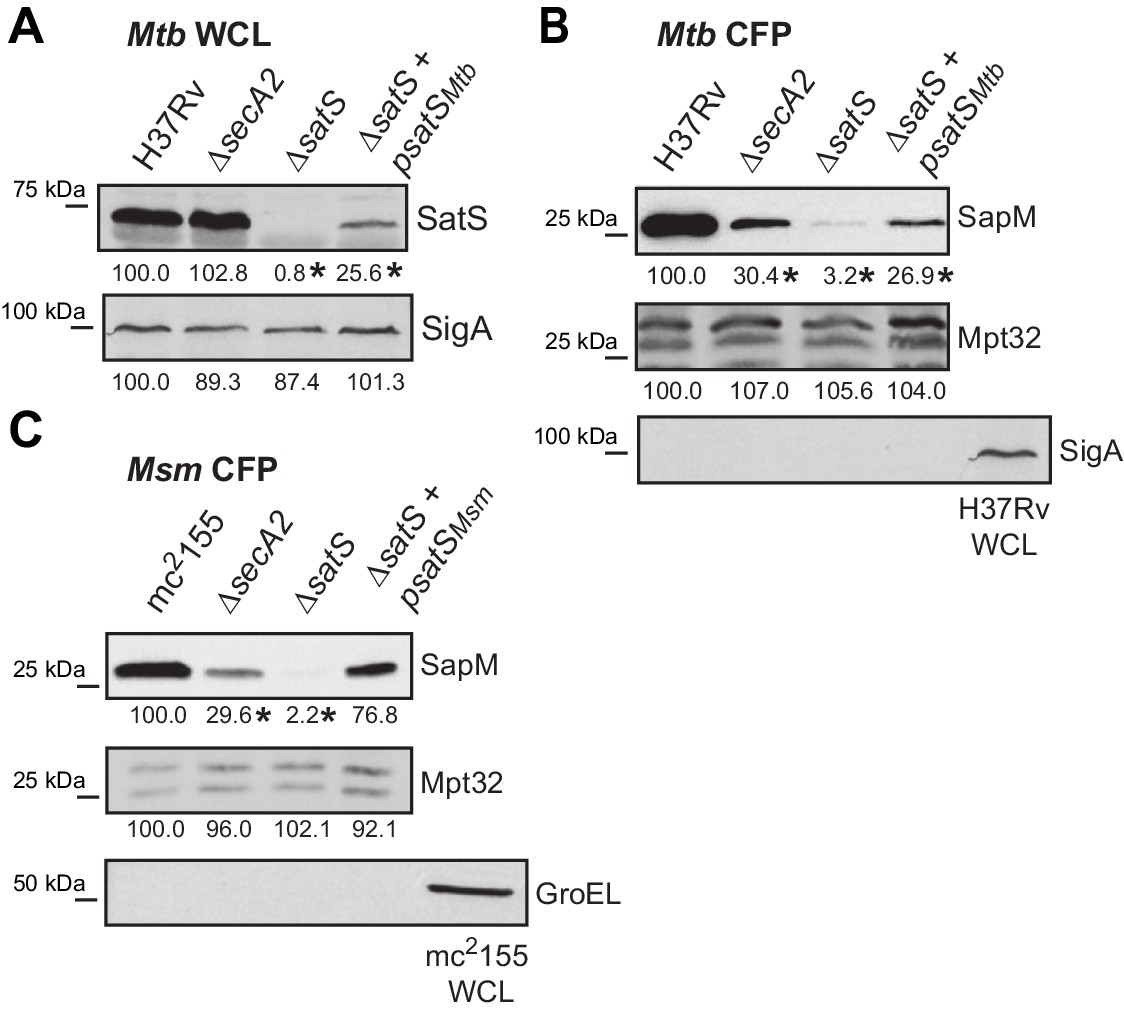
SatSMtb complementation and lysis controls.
(A) Equal protein from whole cell lysates of M. tuberculosis H37Rv, ∆secA2, ∆satS and the complemented strain (∆satS +psatS) were immunoblotted for SatS or SigA. (B) Equal protein from culture supernatants from M. tuberculosis H37Rv, ∆secA2, ∆satS and the complemented strain (∆satS +psatS) were immunoblotted for SapM, Mpt32, and SigA as a control for lysis. (C) Equal protein from culture supernatants from M. smegmatis mc2155, ∆secA2, ∆satS and the complemented strain (∆satS +psatSmsm) were examined for levels of SapM, Mpt32, and GroEL as a control for lysis by Immunoblot. Densitometry of blots from three experiments was performed (ImageJ). Percent difference of the mean intensity relative to wild-type is reported below each immunoblot. *p<0.05 by ANOVA and Tukey’s post hoc test.
Figure 2—figure supplement 4
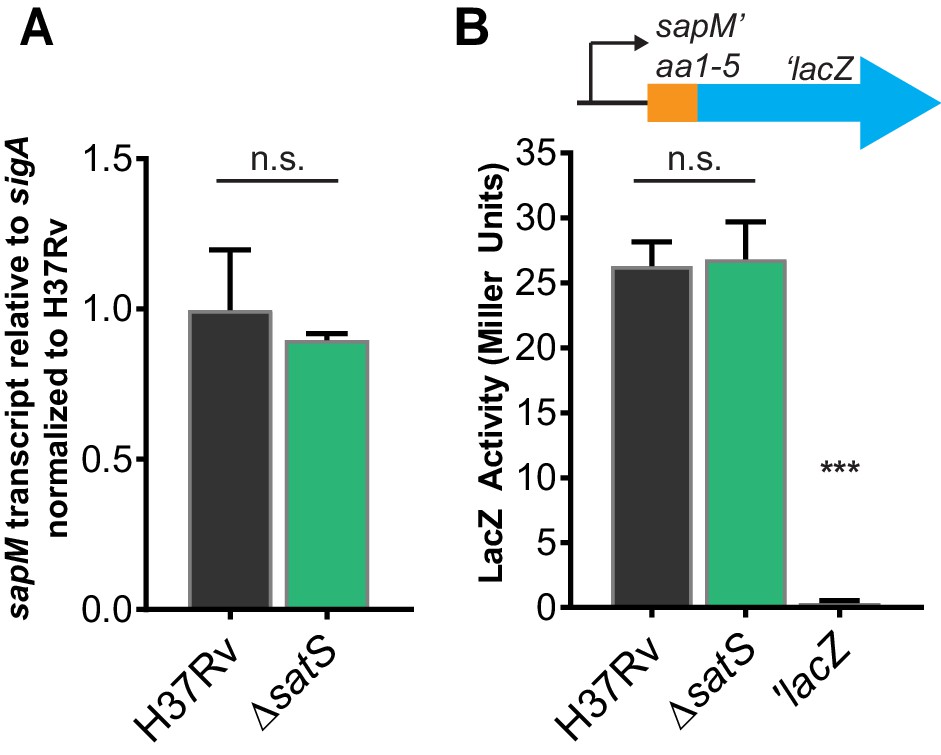
SatS does not affect sapM transcription or translation.
(A) RNA was isolated from M. tuberculosis H37Rv and ∆satS. sapM transcript levels were measured by quantitative RT-PCR and normalized to the level of sigA transcript. Data shown are for the mean of three biological replicates. (B) Expression of the promoterless lacZ gene in pYUB76 when fused to the 170 bp region upstream of sapM, containing the putative promoter and first 15 bp of sapM, was measured in liquid medium by measuring hydrolysis of o-nitrophenyl-β-D-galactoside. The results are from a representative experiment performed in triplicate. In all experiments, the error bars represent standard deviations. n.s. – no significant difference; ***, p<0.001 when compared to H37Rv or ∆satS by ANOVA.
Figure 3
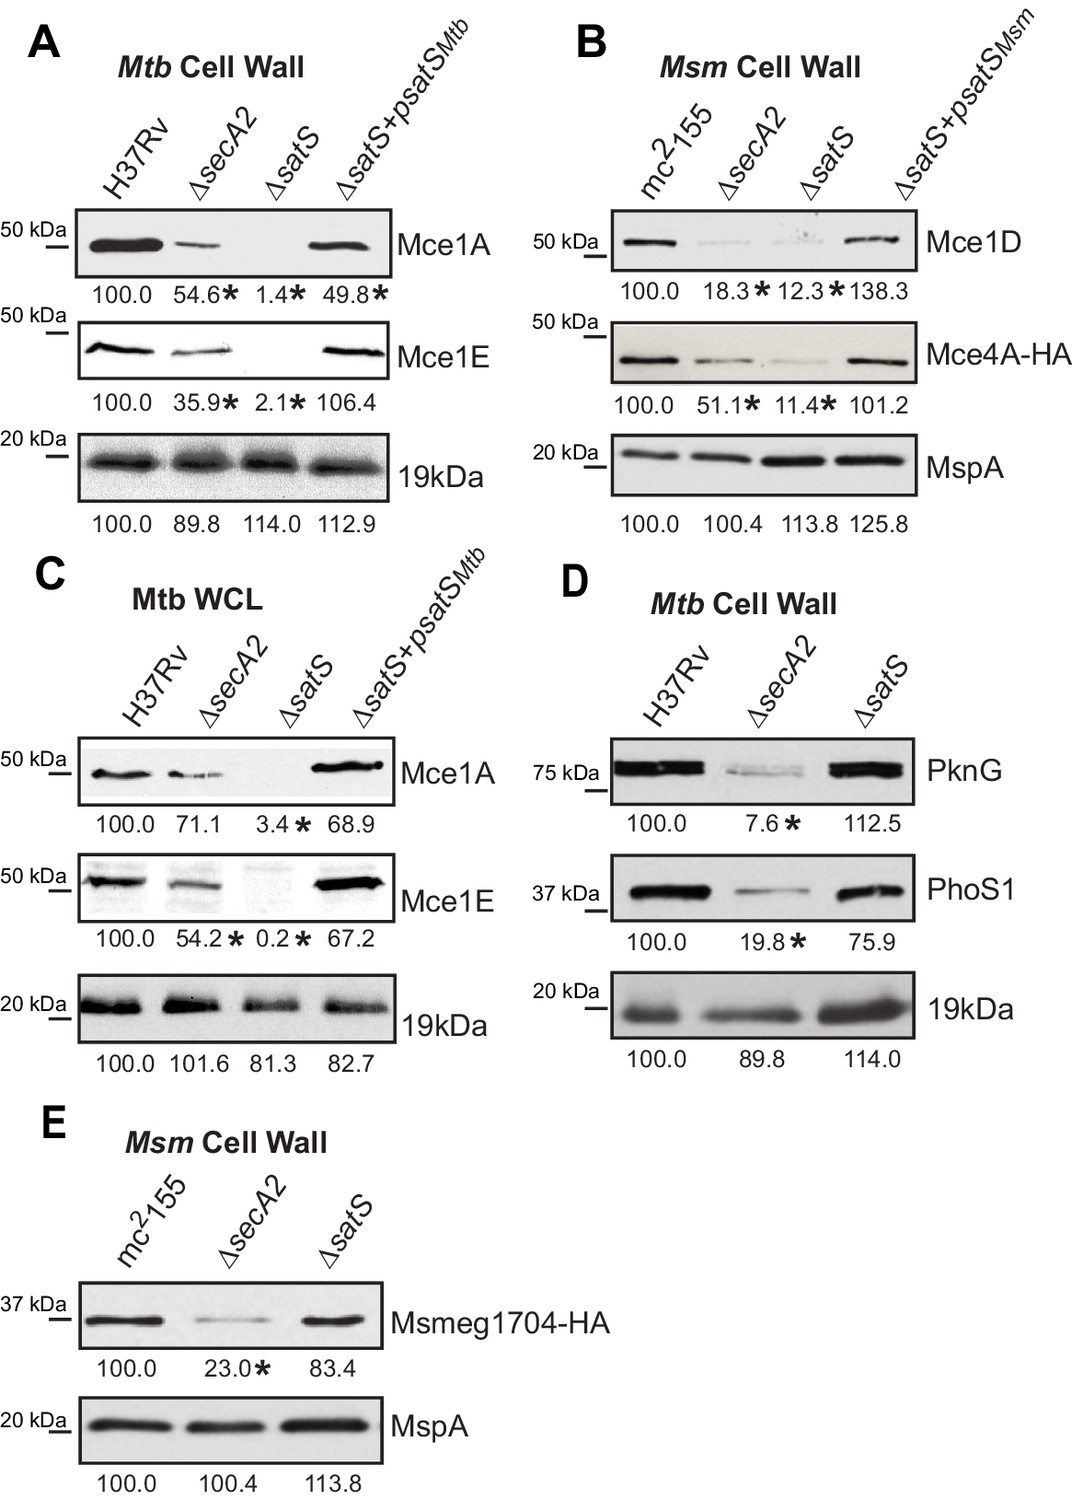
Mce proteins require SatS.
(A) Equalized cell wall fractions of M. tuberculosis H37Rv, ΔsecA2, ΔsatS and complemented (ΔsatS +psatSMtb) strains were analyzed by immunoblot using Mce1A, Mce1E, and 19 kDa antibodies to monitor differences in protein levels. (B) Equalized M. smegmatis mc2155, ΔsecA2, ΔsatS, and ΔsatS +psatSMsm cell wall fractions were analyzed by immunoblot using Mce1D, HA (Mce4A-HA), and MspA antibodies. (C) Equalized protein from whole cell lysates of M. tuberculosis H37Rv, ∆secA2, ∆satS and the complemented strain (∆satS +psatSMtb) were immunoblotted for Mce1A, Mce1E, and 19 kDa. (D) Equalized cell wall fractions of M. tuberculosis H37Rv, ΔsecA2, and ΔsatS strains were analyzed by immunoblot using PknG, PhoS1, and 19 kDa antibodies. (E) Equalized M. smegmatis mc2155, ΔsecA2, and ΔsatS, cell wall fractions were analyzed by immunoblot using HA (Msmeg1704-HA) and MspA antibodies. Densitometry of blots from three experiments was performed (ImageJ). Percent difference of the mean intensity relative to wild-type is reported below each immunoblot. *, p<0.05 by ANOVA and Tukey’s post hoc test.
Figure 4
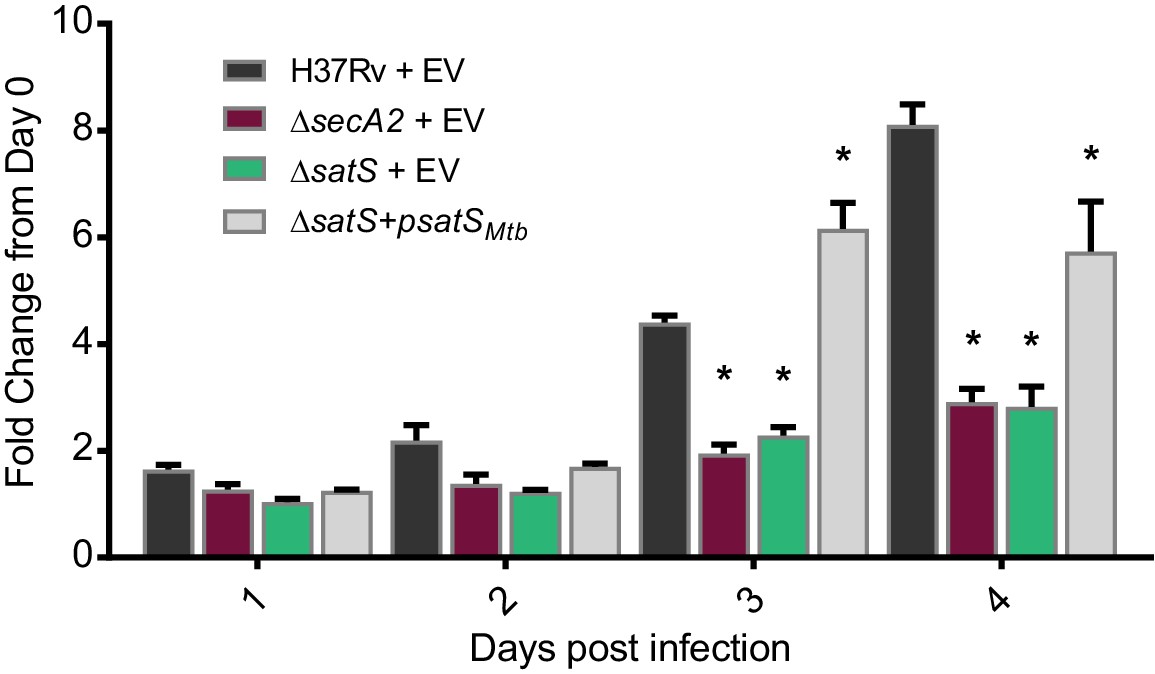
SatS contributes to M. tuberculosis growth in macrophages.
Nonactivated BMDM were infected at an MOI of one with M. tuberculosis H37Rv + EV, ΔsecA2 + EV, ΔsatS + EV, or ΔsatS + psatS, and CFU burden was monitored over the course of a 4 day infection. The fold change in CFU over the course of the 4 day macrophage infection for each strain was calculated; the points represent means of triplicate wells, and the error bars represent standard deviations (SD). *, p<0.01; when compared to H37Rv by ANOVA and Tukey’s post hoc test. Shown is a representative experiment of four independent experiments.
Figure 5 with 1 supplement
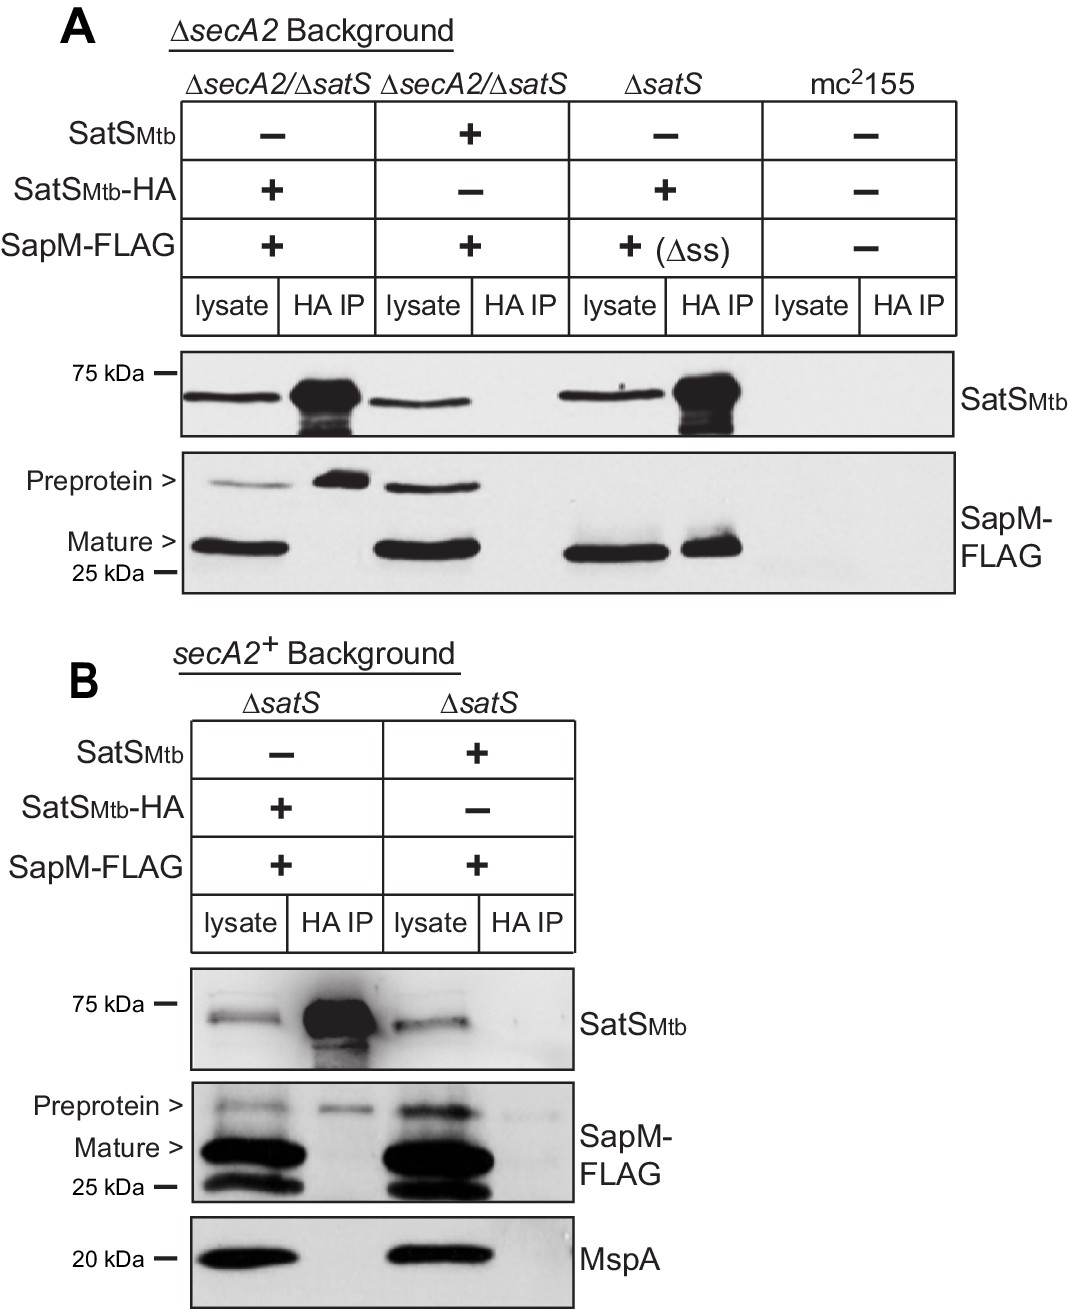
SatS and SapM interact.
(A) Lysate from M. smegmatis ∆secA2/∆satS expressing SapM-FLAG and either SatSMtb-HA or SatSMtb without a tag, ∆satS expressing ∆ss-SapM-FLAG and SatSMtb-HA, or mc2155 with two empty vectors (as shown above the blot) were used for co-immunoprecipitation using anti-HA conjugated beads. Lysates (left) and immunoprecipitations (right) for each strain were probed with SatS antibody and FLAG antibody for SapM. Two different sizes of SapM-FLAG corresponding to the full-length (signal sequence-containing) and mature (cleaved signal sequence) species were detected. (B) Lysate from M. smegmatis ∆satS expressing SapM-FLAG and either SatSMtb-HA or SatSMtb without a tag were used for co-immunoprecipitation using anti-HA conjugated beads. Lysates (left) and co-immunoprecipitations (right) for each strain were probed with SatS antibody, FLAG antibody, and MspA antibody. All data are representative of at least three independent experiments.
Figure 5—figure supplement 1
Epitope tags do not disrupt SapM or SatS functions.
(A) Whole cell phosphatase activity assay of M. smegmatis strains expressing SapM-FLAG or an empty vector. The error bars represent standard deviation from the mean of three independent replicates. *, p<0.05; ***, p<0.001; ****, p<0.0001 by ANOVA. (B) Equal protein levels from whole cell lysates and culture supernatants of mc2155, ∆satS, and the HA-tagged complemented strain (∆satS +psatS HA) were examined for levels of SapM-FLAG and GroEL by Immunoblot.
Figure 6
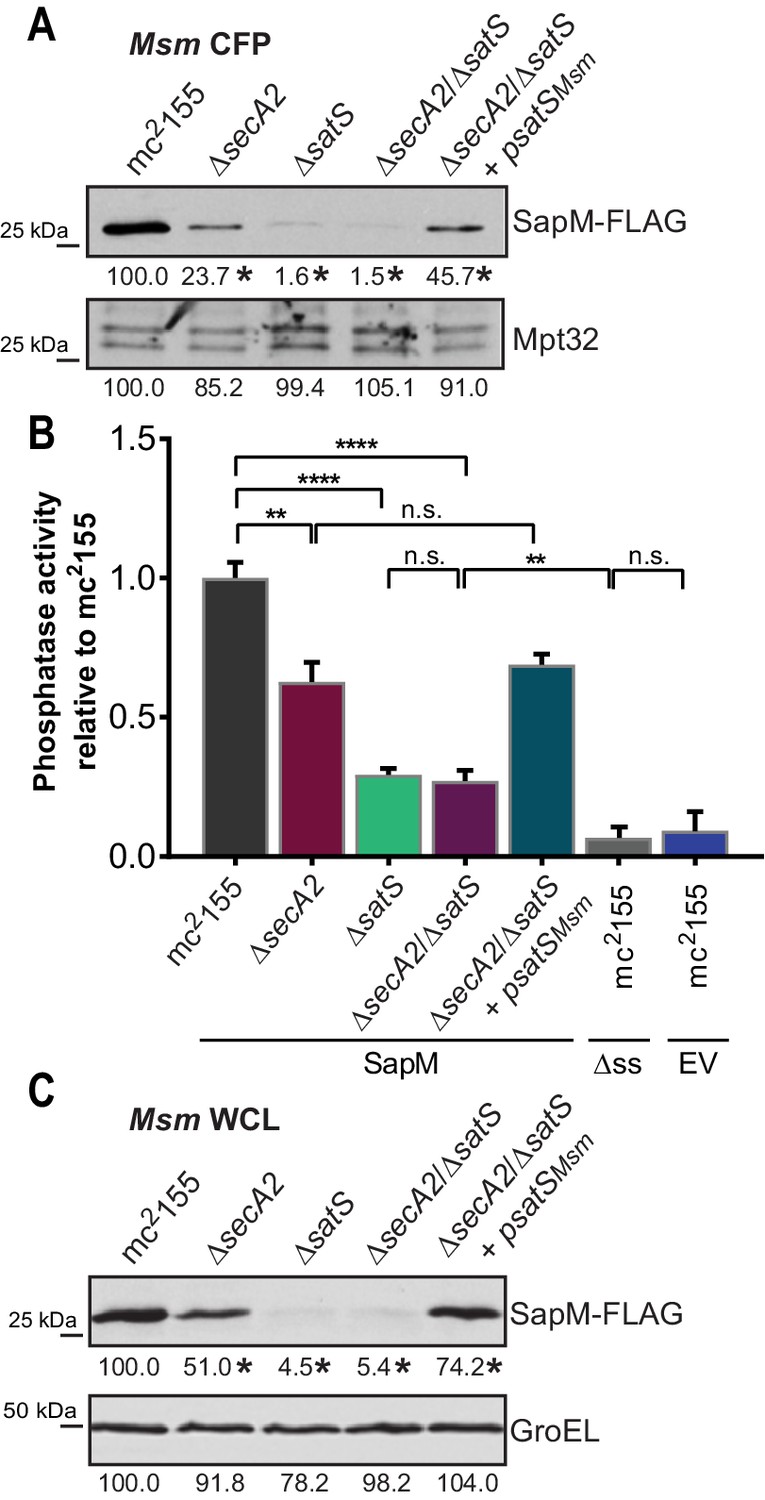
SatS functions prior to SecA2.
(A) Equal protein from culture supernatants (CFP) from M. smegmatis mc2155, ∆secA2, ∆satS, the ∆secA2/∆satS double mutant, and ∆secA2/∆satS expressing wild-type SatS (∆secA2/∆satS +psatSMsm) were examined for levels of SapM-FLAG and Mpt32, by Immunoblot. (B) Whole cell phosphatase activity assay using the above M. smegmatis strains. All strains are expressing SapM, SapM lacking its signal sequence (∆ss-SapM), or an empty vector as indicated. Rates were normalized as described above. (C) Whole cell lysates from the above M. smegmatis strains were examined for levels of SapM-FLAG and GroEL by Immunoblot. For panels A and C, densitometry of blots from three experiments was performed (ImageJ). Percent difference of the mean intensity relative to wild-type is reported below each immunoblot. All data are representative of at least three independent experiments and all error bars represent standard deviation of the mean of three independent replicates for each strain. n.s. – no significant difference; **, p<0.01; ****, p<0.0001 by ANOVA and Tukey’s post hoc test.
Figure 7
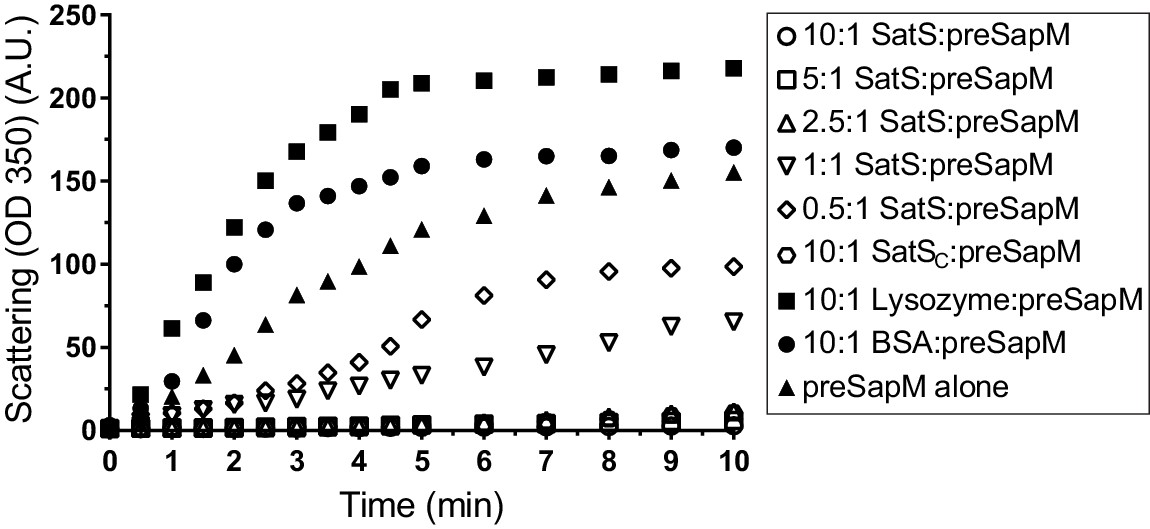
SatS and SatSC prevent aggregation of SapM in vitro.
Denatured SapM-His was diluted 150 fold to a final concentration of 1 µM in 40 mM HEPES, 100 mM NaCl, pH 7.4. SapM-His aggregation was monitored by light scattered (350 nm) at 25°C in the presence or absence of SatS/SatSC or, as controls, lysozyme or BSA. A molar ratio of 2.5:1 of SatS:SapM-His could prevent SapM-His aggregation and aggregation was significantly reduced using a molar ratio of 0.5:1.
Figure 8 with 1 supplement
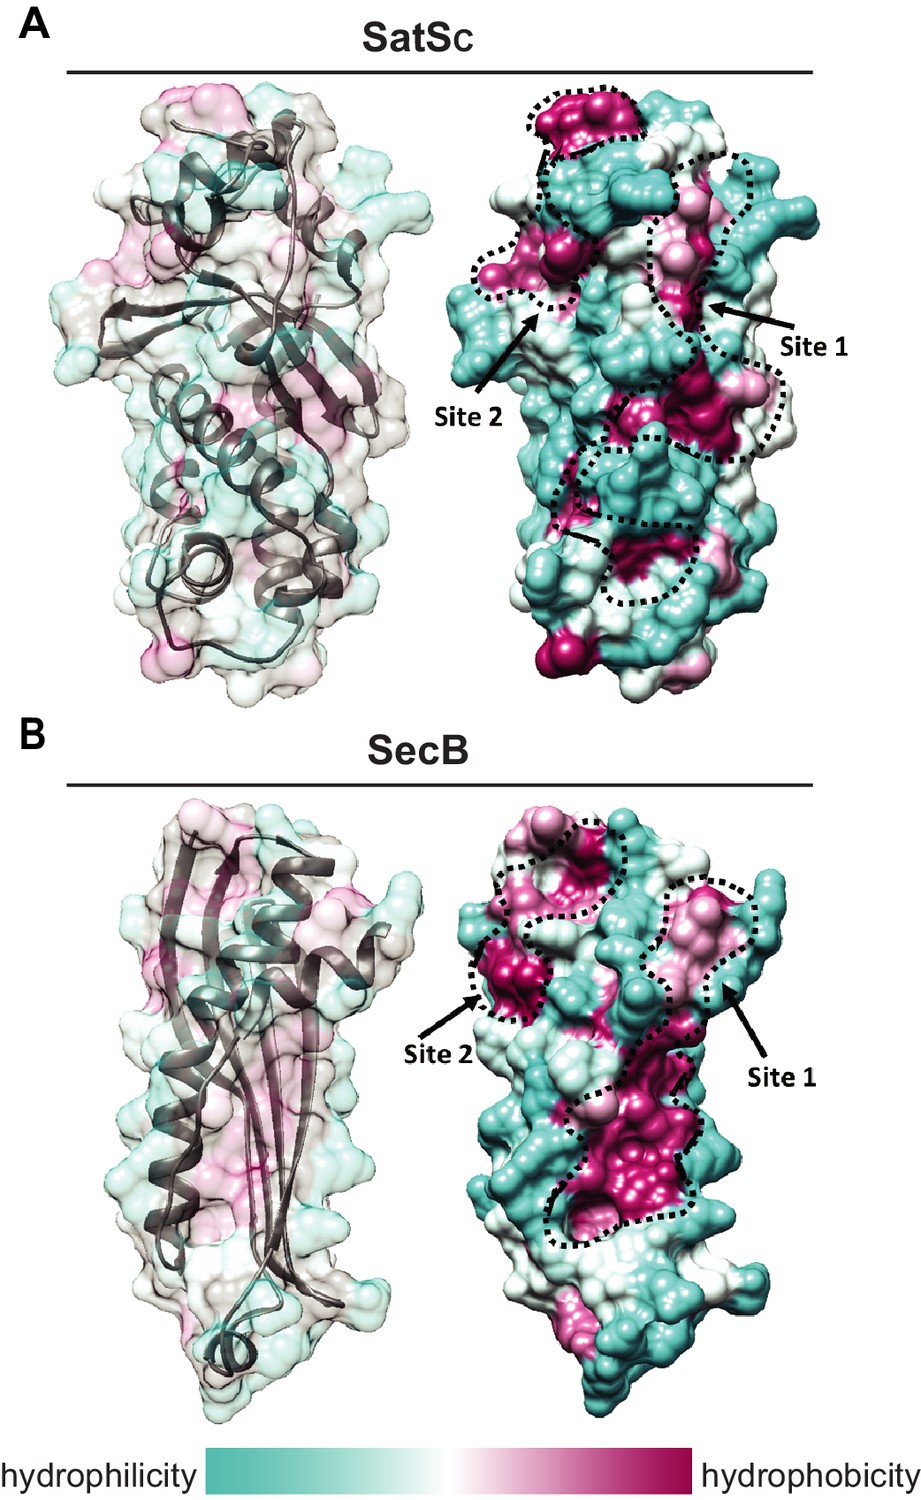
SatS has a new fold and hydrophobic grooves that share similarity with the preprotein binding sites of the SecB chaperone.
(A) The overall secondary structure of SatSC. The hydrophilicity of SatSC is a colored gradient from cyan (hydrophilic) to maroon (hydrophobic). SatSC exposes ~2,900 Å2 of hydrophobic surface. The predicted primary and secondary polypeptide binding site(s) are delineated. (B) The overall secondary structure of SecB monomer (PDB ID:1QYN) (Dekker et al., 2003). The hydrophilicity of SecB is a colored gradient from cyan (hydrophilic) to maroon (hydrophobic). The primary and secondary client binding site(s) are delineated. Each SecB monomer exposes ~1,900 Å2 of hydrophobic surface for client protein interactions (Huang et al., 2016). Molecular graphics and analyses were performed with the UCSF Chimera package (Petersen et al., 2011).
-
Figure 8—source data 1
SatSC X-ray Structure Validation Details.
- https://doi.org/10.7554/eLife.40063.017
Figure 8—figure supplement 1
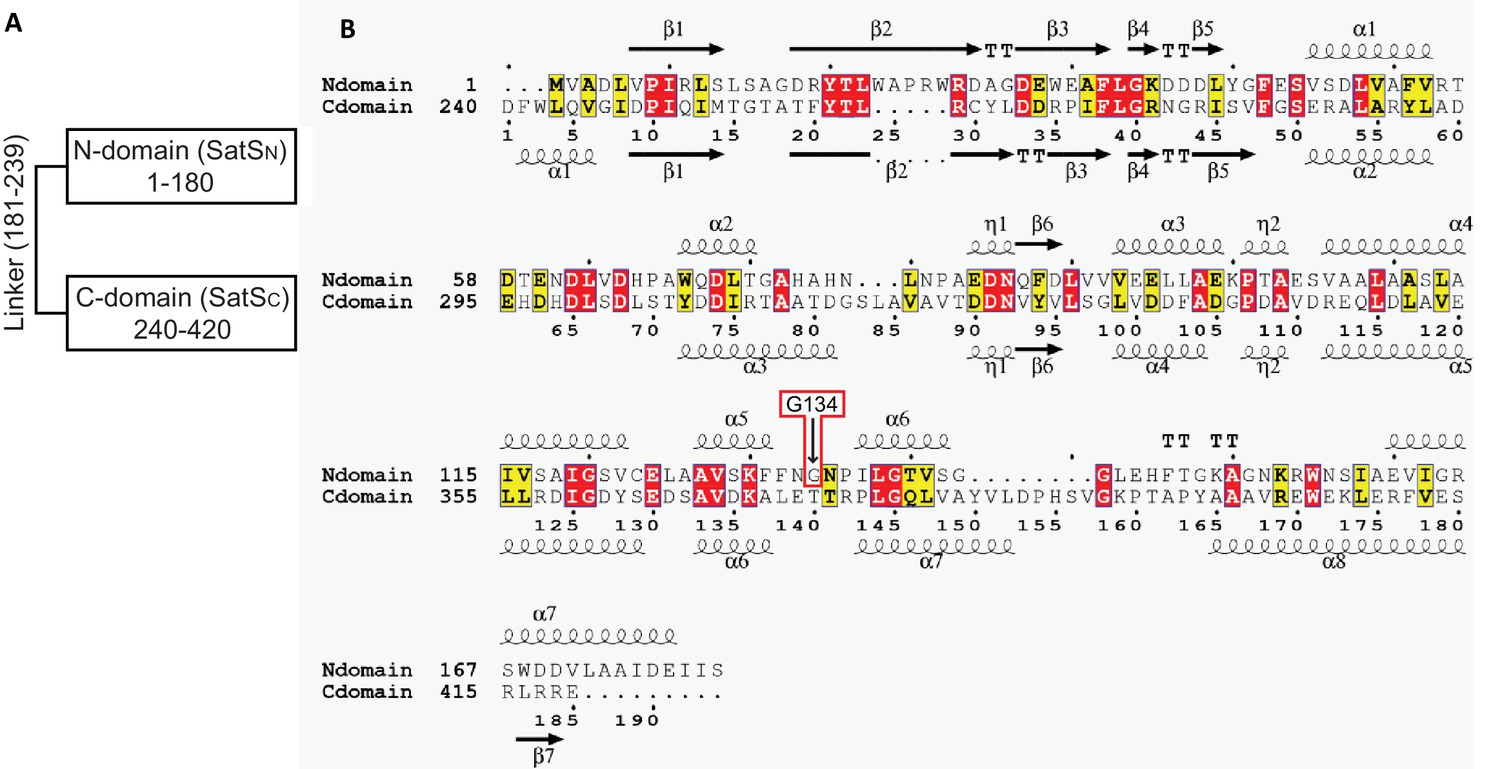
SatSC secondary structure and the predicted secondary structure of SatSN.
(A) SatS is composed of two domains of similar secondary structure joined by a potential linker of 60 amino acids with little predicted secondary structure. The disordered linker region was predicted using IUPred2A (Mészáros et al., 2018). (B) Multiple sequence alignment of N-domain (SatSN) with C-domain (SatSC) without the linker region. Secondary structure elements for each domain are depicted above and below their corresponding sequence. SatSN has 22% sequence identity (highlighted in red) and 41% sequence similarity to SatSC (highlighted in yellow and red);TT - tight turn.
Figure 9
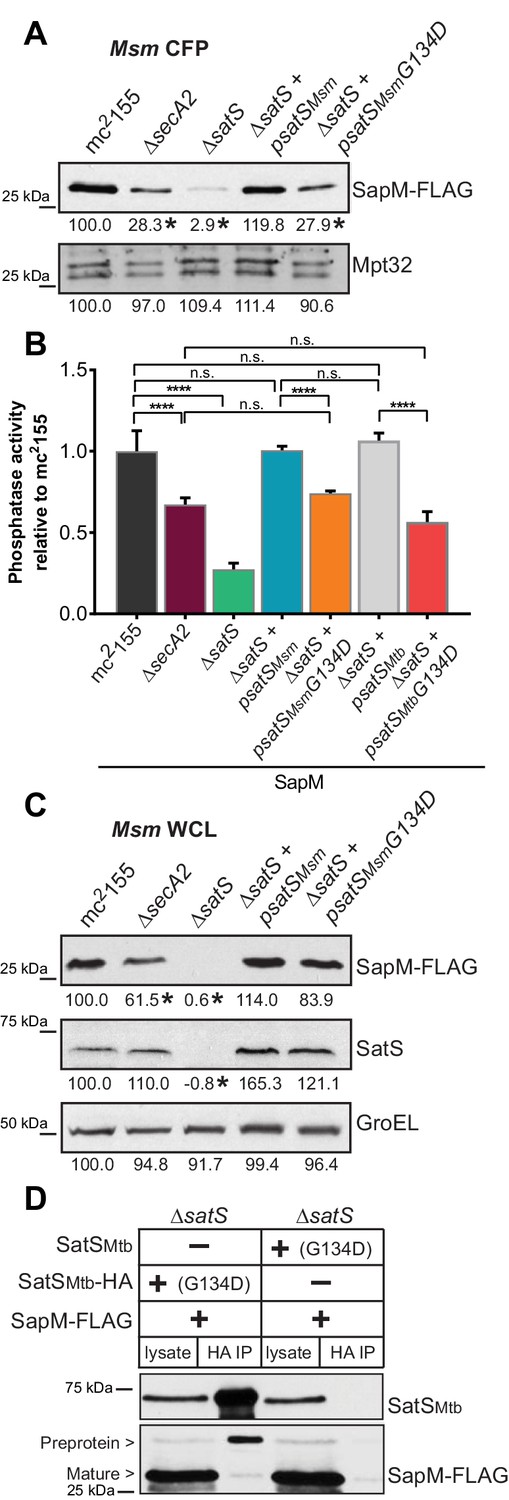
SatS has at least two separable roles in protein export.
(A) Equal protein from culture supernatants (CFP) from M. smegmatis mc2155, ∆secA2, ∆satS and the ∆satS mutant expressing either wild-type SatS (∆satS +psatSMsm) or SatS G134D (∆satS +psatSMsmG134D) were examined for levels of SapM-FLAG and Mpt32 by Immunoblot. (B) Whole cell phosphatase activity assay of M. smegmatis strains expressing SapM. Rates were normalized as described above. (C) Equal protein from whole cell lysates (WCL) from M. smegmatis strains described above were examined for levels of SapM-FLAG, SatS and GroEL by Immunoblot. For panels A and C, densitometry of blots from three experiments was performed (ImageJ). Percent difference of the mean intensity relative to wild-type is reported below each immunoblot. (D) Lysate from M. smegmatis ∆satS expressing SapM-FLAG and either SatSMtbG134D-HA or SatSMtbG134D without a tag were used for co-immunoprecipitation using anti-HA conjugated beads. Lysates (left) and co-immunoprecipitations (right) for each strain were probed with SatS antibody and FLAG antibody. All data are representative of at least three independent experiments and all error bars represent standard deviation of the mean of three independent replicates for each strain. n.s. – no significant difference; ****, p<0.0001 by ANOVA and Tukey’s post hoc test.
Additional files
-
Transparent reporting form
- https://doi.org/10.7554/eLife.40063.020
Download links
A two-part list of links to download the article, or parts of the article, in various formats.
Downloads (link to download the article as PDF)
Open citations (links to open the citations from this article in various online reference manager services)
Cite this article (links to download the citations from this article in formats compatible with various reference manager tools)
Mycobacterium tuberculosis SatS is a chaperone for the SecA2 protein export pathway
eLife 8:e40063.
https://doi.org/10.7554/eLife.40063


